Basys’06, Niagara Falls, Ontario, Canada, 2006 Agent-based supply chain planning in the forest...
58
Basys’06, Niagara Falls, Ontario, Canada, 2006 Agent-based supply chain planning in the forest products industry Sophie D’Amours Ph.D. Professor, Université Laval General Director, Research Consortium FOR@C Canada Research Chair on planning value creation network
-
Upload
melina-burnley -
Category
Documents
-
view
212 -
download
0
Transcript of Basys’06, Niagara Falls, Ontario, Canada, 2006 Agent-based supply chain planning in the forest...

Basys’06, Niagara Falls, Ontario, Canada, 2006
Agent-based supply chain planning in the forest products industry
Sophie D’Amours Ph.D.Professor, Université Laval
General Director, Research Consortium FOR@CCanada Research Chair on
planning value creation network

Basys’06, Niagara Falls, Ontario, Canada, 2006
Agenda FOR@C Research Consortium Forest products industry Supply chain planning challenges in the
forest products industry Supply chain scheduling: application to
the lumber industry FOR@C V-Lumber Experimental
Platform Agent-based simulation in supply chain

Basys’06, Niagara Falls, Ontario, Canada, 2006
Mission of the Consortium
o become a Canadian and International centre of expertise in the development of the knowledge and skills required to integrate and optimize value creation networks in the forest products industry by taking advantage of the potential of new technologies and electronic business models.
T

Basys’06, Niagara Falls, Ontario, Canada, 2006
Partners

Basys’06, Niagara Falls, Ontario, Canada, 2006
Supply chain

Basys’06, Niagara Falls, Ontario, Canada, 2006
Forest products supply chain

Basys’06, Niagara Falls, Ontario, Canada, 2006
Canadian Industry Snapshot 3% GDP Exports for 45 billion $ of lumber, pulp
and paper every year Contributing 60% to the net export of
Canada 900 000 direct and indirect jobs More than 350 localities depend
economically on the industry Source: FPAC, March 2006
Basys’06, Niagara Falls, Ontario, Canada, 2006
Basys’06, Niagara Falls, Ontario, Canada, 2006
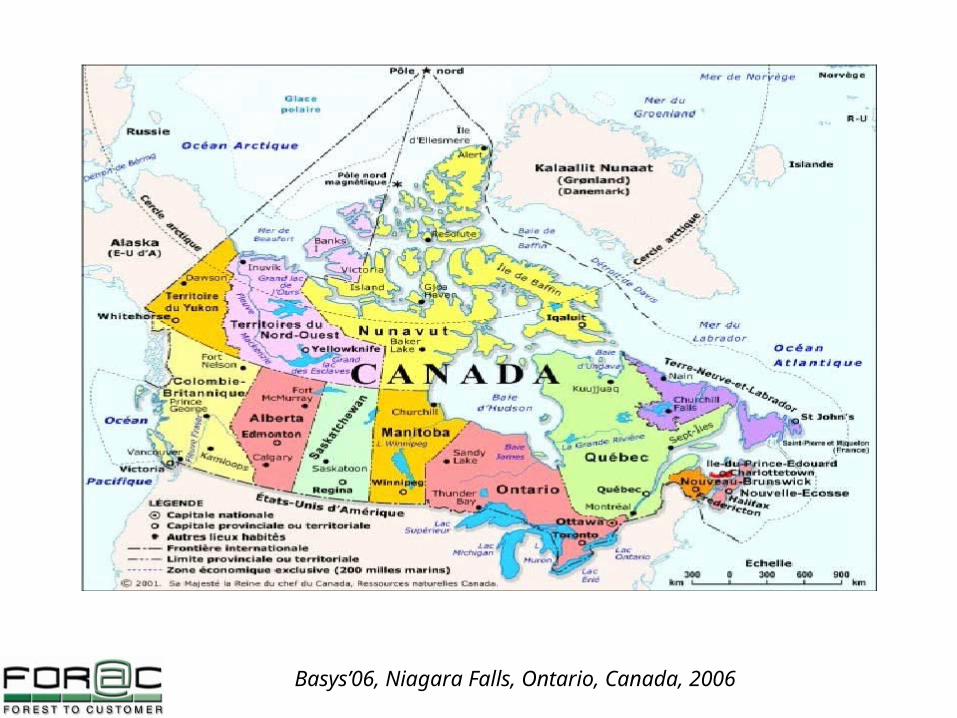
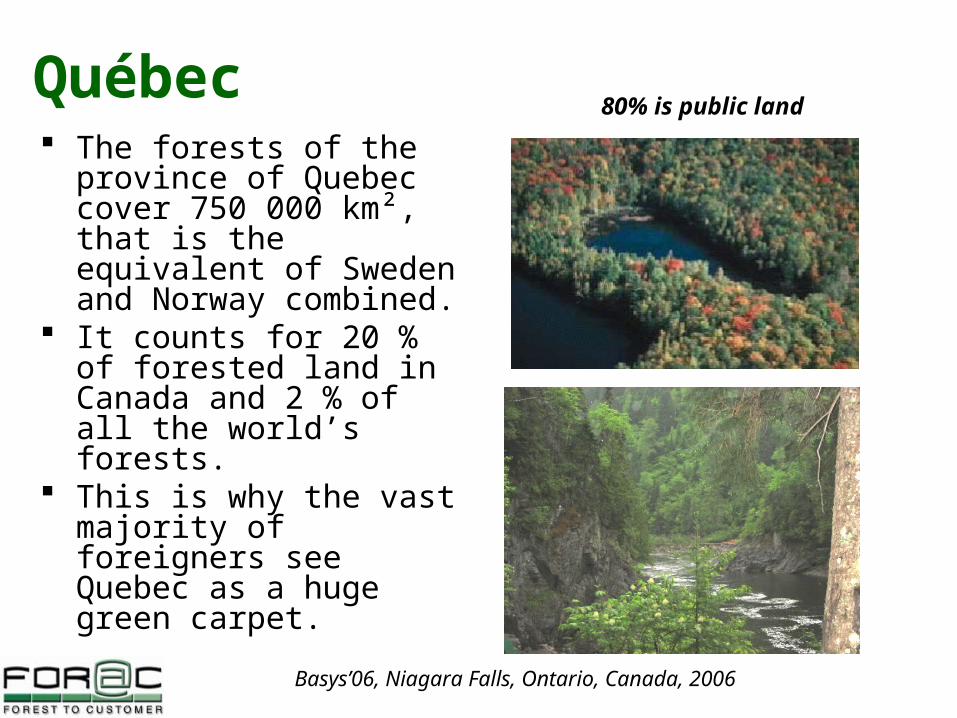
Québec The forests of the province
of Quebec cover 750 000 km², that is the equivalent of Sweden and Norway combined.
It counts for 20 % of forested land in Canada and 2 % of all the world’s forests.
This is why the vast majority of foreigners see Quebec as a huge green carpet.
80% is public land

Basys’06, Niagara Falls, Ontario, Canada, 2006
Fiber flow

Basys’06, Niagara Falls, Ontario, Canada, 2006
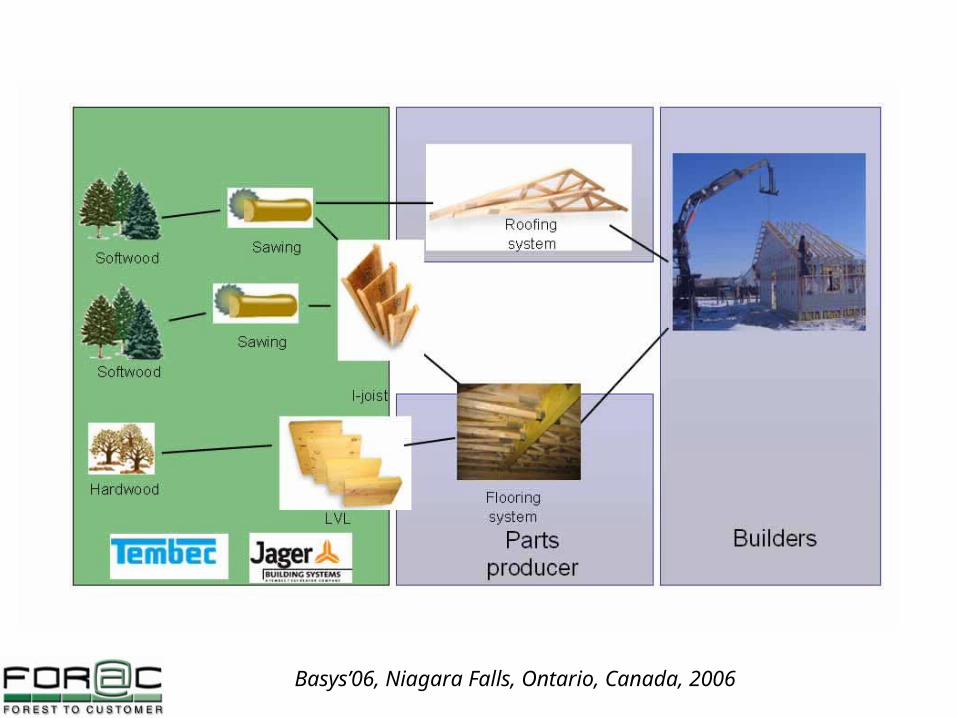
Fiber transformation

Basys’06, Niagara Falls, Ontario, Canada, 2006
customers
customers
customers
Forest supply chain

Basys’06, Niagara Falls, Ontario, Canada, 2006
Pulp and paper supply chain
Basys’06, Niagara Falls, Ontario, Canada, 2006

Basys’06, Niagara Falls, Ontario, Canada, 2006
Transportation in the supply chain

Basys’06, Niagara Falls, Ontario, Canada, 2006
Supply chain planning challenges in the forest products industry

Basys’06, Niagara Falls, Ontario, Canada, 2006
In the United States at December 31, 2005, the Company operated 23 pulp, paper and packaging mills, 93 converting and packaging plants, 25 wood products facilities, six speciality chemicals plants and 270 distribution branches.
Top 5International paper (~$26 B)Weyerhaeuser (~ $20 B)Georgia Pacific (~ $20 B)Stora Enso (~ $15 B)Kimberly Clark (~ $15 B)
PWC – Global Forest and Paper Industry Survey 2005

Basys’06, Niagara Falls, Ontario, Canada, 2006
Domtar supply chain
Ship to pointsDistribution CentersSatellite WarehousesMillsConvertersMerchants

Basys’06, Niagara Falls, Ontario, Canada, 2006
Harvesting/procurement plan
2006 20082007
Sustainable developmentRoad constructionMixed of products, uneven agedPlantation

Basys’06, Niagara Falls, Ontario, Canada, 2006
Alternative divergent processes Trees are cut to produce a set of logs Logs are cut to produce a set of lumbers Chips are mixed to produce different grades of
pulp and paper Rolls are cut to produce a set of rolls or sheets
Recipe/cutting patternRecipe/cutting pattern
Recipe/cutting pattern
Productivity not always linearSequence dependent set-ups
Attribute basedproducts

Basys’06, Niagara Falls, Ontario, Canada, 2006
Commodity Price Trends
• In North America, the link between consumption and real GDP is falling for all the major grades of paper, but worst for newsprint.
• Even globally, the link between consumption and real GDP plateaued in the mid-1990s.
40.00
50.00
60.00
70.00
80.00
90.00
100.00
110.00
120.00
130.00
140.00
1987
1988
1989
1990
1991
1992
1993
1994
1995
1996
1997
1998
1999
2000
2001
2002
2003
2004
Containerboard New sprint UFS
.
N. American Consumption/Real GDP
40.00
50.00
60.00
70.00
80.00
90.00
100.00
110.00
120.00
130.00
140.00
1970
1974
1978
1982
1986
1990
1994
1998
2002
Containerboard New sprint P&W
.
Global Consumption/Real GDP
Source: RISI, CIBC World MarketsSource: RISI, CIBC World Markets
Source; Roberts, 2005, Vision 2015 FOR@C

Basys’06, Niagara Falls, Ontario, Canada, 2006
Demand/supply propagation
Mix of spot market and contracts
Facilities Markets
Basys’06, Niagara Falls, Ontario, Canada, 2006
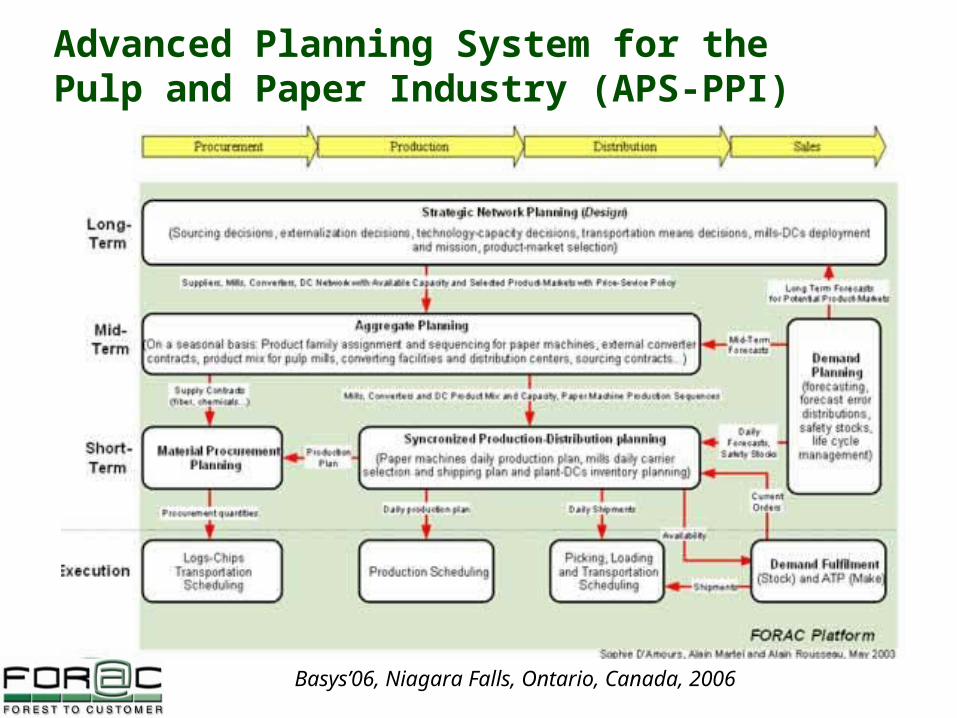
Advanced Planning System for the Pulp and Paper Industry (APS-PPI)

Basys’06, Niagara Falls, Ontario, Canada, 2006
Distributed planning systems
Top level planning problem
Anticipation model ofthe base level
planning problems
Base level planning model
FinalSet ofdecisionsIN*
ReactionRE*
InstructionIN*
Anticipationfunctions
Instructions
Schneeweiss (2003)

Basys’06, Niagara Falls, Ontario, Canada, 2006
Supply chain scheduling: application to the lumber industry

Basys’06, Niagara Falls, Ontario, Canada, 2006
Scheduling Decide what to do, when to do it
and how to do it Support mixed mode: Pull & Push
– Satisfy demand (committed orders & contracts)– Maximize throughput value
Constraints:– Planned available inventory– Machine capacity (potential bottlenecks)

Basys’06, Niagara Falls, Ontario, Canada, 2006
The lumber supply chainCustomers
Customers
Customers

Basys’06, Niagara Falls, Ontario, Canada, 2006
Log Requirement

Basys’06, Niagara Falls, Ontario, Canada, 2006
Sawing Line Plan
Solved usingmathematicalprogramming(MIP or LP)

Basys’06, Niagara Falls, Ontario, Canada, 2006
Sawing
2x4
1x6
2x3
2x6
Type 1
Type 2
Type 3
Cutting Pattern #12
Cutting Pattern #57
Cutting Pattern #25
Cutting Pattern #9

Basys’06, Niagara Falls, Ontario, Canada, 2006
Drying Plan
Solved usinga constraint programmingmodel
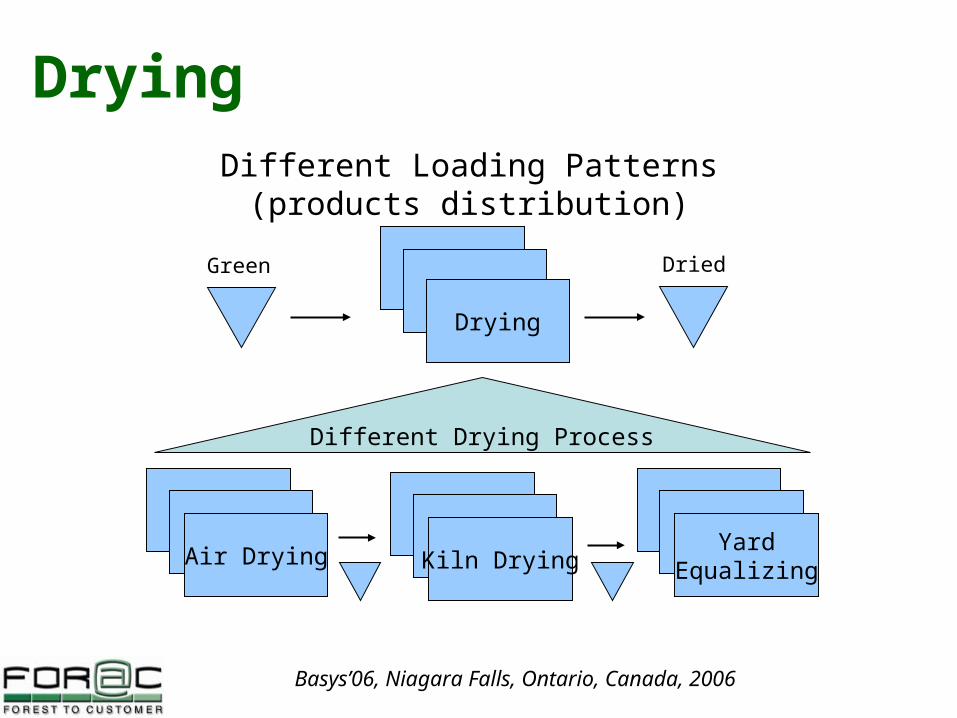
Basys’06, Niagara Falls, Ontario, Canada, 2006
KilnKilnDrying
Green Dried
KilnKiln
Kiln Drying
Drying
KilnKiln
Air Drying
KilnKilnYard
Equalizing
Different Loading Patterns(products distribution)
Different Drying Process

Basys’06, Niagara Falls, Ontario, Canada, 2006
Finishing Line Plan
Solved usingheuristics

Basys’06, Niagara Falls, Ontario, Canada, 2006
Finishing
Co-Products Management:– Finishing 1 product type can results in 11 different product types
simultaneously– All of them can have demand: they are not by-products
Campaign Optimization (Setup management)
96 “ 925/8 “ 88 “ 72 “
Premium 11,71 % 4,93 % - -
Stud 35,70 % 14,15 %
10,68 % 6,81 %
No 3 6,81 % - - -
Economy 4,49 % - 2,68 % 1,61 %
Kiln wet (TH > 19 %) 0,50 % - - -
96 “ 925/8 “ 88 “ 72 “
Premium 11,71 % 4,93 % - -
Stud 35,70 % 14,15 %
10,68 % 6,81 %
No 3 6,81 % - - -
Economy 4,49 % - 2,68 % 1,61 %
Kiln wet (TH > 19 %) 0,50 % - - -
96 “ 925/8 “ 88 “ 72 “
Premium 11,71 % 4,93 % - -
Stud 35,70 % 14,15 % 10,68 % 6,81 %
No 3 6,81 % - - -
Economy 4,49 % - 2,68 % 1,61 %
Kiln wet (TH > 19 %) 0,50 % - - -

Basys’06, Niagara Falls, Ontario, Canada, 2006
Shipment Orders
Solved usinga linear programmingmodel

Basys’06, Niagara Falls, Ontario, Canada, 2006
Integration and system dynamics
SupplierProduction
siteWarehouse SalesDecentralised
order
material
Simple integration Limited information exchanged Impact of the bullwhip effect Minimum return – local optimisation
SupplierProduction
SiteWarehouse SalesCentralised
Planning centre
material
Multi-site integration Standardisation of exchanges and management objectives Global optimisation Large quantity of information (collect and maintain) Transactional technologies available Great potential return – but little success

Basys’06, Niagara Falls, Ontario, Canada, 2006
Planning challenges
Global Performance of the entire supply chain network
(avoid local optimum et information distortion)
Global Performance of the entire supply chain network
(avoid local optimum et information distortion)
Operation plans feasibility(avoid plans that are not feasible)
Operation plans feasibility(avoid plans that are not feasible)
Manufacturing and logistic Agility(ability to re-plan quickly)
Manufacturing and logistic Agility(ability to re-plan quickly)
Synchronization of decisions
Specialization of decisionsmodels and algorithms
Decisions distribution and localizationwhere events must be managed

Basys’06, Niagara Falls, Ontario, Canada, 2006
Raise the needs for tools designed
To evolve in a decentralized, dynamic and specialized environment
To support demand and supply propagation with optimization (e.g. revenue management)
To integrate real-time execution information (e.g. event management systems, contingency planning)
To support collaboration (e.g. collaborative workflows)

Basys’06, Niagara Falls, Ontario, Canada, 2006
FOR@C V-Lumber Experimental Platform

Basys’06, Niagara Falls, Ontario, Canada, 2006
Distributed & Specialized Tools

Basys’06, Niagara Falls, Ontario, Canada, 2006

Basys’06, Niagara Falls, Ontario, Canada, 2006
Supply Chain Planning
MakeAgent
DeliverAgent
SourceAgent
Planning Unit
Demand Plan
Supply Plan
Demand PlanSupply Plan
MakeAgent
DeliverAgent
SourceAgent
Planning Unit
MakeAgent
DeliverAgent
SourceAgent
Planning Unit
Tactical planning unit
Analysis Tools
AgentsData

Basys’06, Niagara Falls, Ontario, Canada, 2006
Agent Architecture

Basys’06, Niagara Falls, Ontario, Canada, 2006
Customer AgentSupplier Agent
Offer
Offer Accepted
Offer Refused
Need
Conversation
Offer
Offer Accepted
Offer Refused
Need
Conversation
Offer
Offer Accepted
Offer Refused
Need
Conversation
Workflow
Engins en approvisionnement infini
Allocations
Engins en approvisionnement fini
Allocations
Workflow
Engins en approvisionnement infini
Allocations
Engins en approvisionnement fini
Allocations
Workflow
Engins en approvisionnement infini
Allocations
Engins en approvisionnement fini
Allocations
Planning
Event
New CustomerDemand
Event
New SupplierDemand
Event
New SupplierSupply
Event
New CustomerSupply
© FOR@C – experimental platform

Basys’06, Niagara Falls, Ontario, Canada, 2006
Definition of collaboration An intended cooperative action
between two or more entities that exchange or share resources in order to take decisions or pursue an activity that will generate benefits or loss that are to be shared.
D’Amours et Frayret (2003)
From an intra-organizational perspectiveall resources can be view as shareable resources

Basys’06, Niagara Falls, Ontario, Canada, 2006
Concepts of collaboration Main characteristics of inter-organizational
collaboration (from literature):– Common goals and objectives, shared or jointly decided
Jacobs (2002)– Implication of decision makers
Pollard (2002)– Mutual trust
Jacobs (2002)– Through organisational structures
Pollard (2002)– Shared operation planning and execution
Simatupang and Sridharan (2002), Jacobs (2002), Schrage (1990)– Sharing of risk, rewards and responsibilities
Lambert and al. (1999)– Be more efficient, get a competitive advantage
Simatupang and Sridharan (2002), Lambert and al. (1999), Pollard (2002)
Three important dimensionsof collaboration :
HumainOrganisationnal
(strategy & process)Technology

Basys’06, Niagara Falls, Ontario, Canada, 2006
Transactionnal relationshipTransactionnal relationship
Information exchange Information exchange relationshiprelationship
Joint planningJoint planning
Collaborative operation Collaborative operation planning and executionplanning and execution
Intensity of the collaboration
Nature of exchanges
weak strong
Co-evolutionCo-evolution
Frayret, D’Amours and D’Amours 2003
simple
complex
Concepts of collaboration
•Contracts & mechanisms•Collaborative rules
•Allocation•Pricing•Incentives…
•Local & collective goals•Information & decisiontechnologies •Protocols & workflows
Basys’06, Niagara Falls, Ontario, Canada, 2006
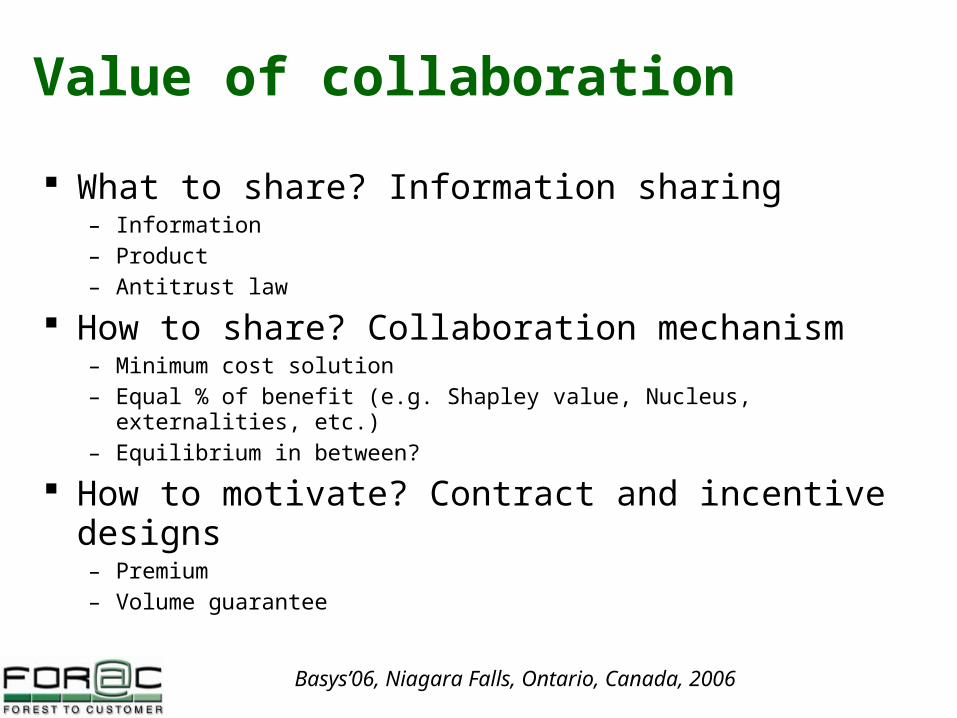
Value of collaboration
What to share? Information sharing– Information– Product – Antitrust law
How to share? Collaboration mechanism– Minimum cost solution– Equal % of benefit (e.g. Shapley value, Nucleus, externalities, etc.)– Equilibrium in between?
How to motivate? Contract and incentive designs– Premium– Volume guarantee

Basys’06, Niagara Falls, Ontario, Canada, 2006
Strategic game Precisely, a strategic game
consists of – a set of players – for each player, a set of actions (sometimes
called strategies) – for each player, a payoff function that gives the
player's payoff to each list of the players' actions.
http://www.chass.utoronto.ca/~osborne/2x3/tutorial/SGAME.HTM

Basys’06, Niagara Falls, Ontario, Canada, 2006
The wood supply game
Satisfy demandMinimize inventory
FOREST
ComplexSawing
Saw MillWholesalerPaper
WholesalerWood
RetailerWood
RetailerPaper

Basys’06, Niagara Falls, Ontario, Canada, 2006
1. Traditional order transmission2. Decoupled demand/order transmission3. Real-time end customer demand transmission
There is always an equilibrium where players demonstrate collaborative behavior. This equilibrium is almost always as good as the minimum cost solution.
Moyaux et al. 2004

Basys’06, Niagara Falls, Ontario, Canada, 2006
Moving toward collaboration
Order based relationship Continous replenishment
– Transportation based– Capacity based
Vendor managed Inventory Collaborative planning, forecasting
and replenishment

Basys’06, Niagara Falls, Ontario, Canada, 2006
Agent-based simulation in supply chain

Basys’06, Niagara Falls, Ontario, Canada, 2006
Knowledge-based supply chain planning systems
Forget et al. 2006

Basys’06, Niagara Falls, Ontario, Canada, 2006
Multi-behavior agent
Forget et al. 2006

Basys’06, Niagara Falls, Ontario, Canada, 2006

Basys’06, Niagara Falls, Ontario, Canada, 2006
Concluding remarks
Building the agent-based simulation ability will permit to model and test emerging supply chain planning approaches in a dynamic, distributed, specialized and stochastic environment.
Technical challengesEvent managementDecision delayExecution up-datePlayers behavioursDebugging
Basys’06, Niagara Falls, Ontario, Canada, 2006
Thank you
www.forac.ulaval.ca