BASIN MANAGEMENT ACTION LAN PHASE 2
123
BASIN MANAGEMENT ACTION PLAN PHASE 2 for the Implementation of Total Maximum Daily Loads adopted by the Florida Department of Environmental Protection in the Orange Creek Basin for Newnans Lake, Orange Lake, Lake Wauberg, Hogtown Creek, Sweetwater Branch, Tumblin Creek, and Alachua Sink prepared by the Division of Environmental Assessment and Restoration Water Quality Restoration Program Florida Department of Environmental Protection Tallahassee, FL 32399 in cooperation with the Orange Creek Basin Working Group June 2014
Transcript of BASIN MANAGEMENT ACTION LAN PHASE 2

BASIN MANAGEMENT ACTION PLAN
PHASE 2
for the Implementation of Total Maximum Daily Loads adopted by the
Florida Department of Environmental Protection in the
Orange Creek Basin
for
Newnans Lake, Orange Lake, Lake Wauberg, Hogtown Creek, Sweetwater Branch,
Tumblin Creek, and Alachua Sink
prepared by the
Division of Environmental Assessment and Restoration Water Quality Restoration Program
Florida Department of Environmental Protection Tallahassee, FL 32399
in cooperation with the
Orange Creek Basin Working Group
June 2014

Final Orange Creek Basin Management Action Plan Phase 2 – June 2014
ACKNOWLEDGMENTS
The Florida Department of Environmental Protection adopted the Orange Creek Basin Management Action Plan by Secretarial Order as part of its statewide watershed management approach to restore and protect Florida’s water quality. The plan was developed in cooperation with the Orange Creek Basin Working Group (BWG), identified below, with participation from affected local, regional, and state governmental interests; elected officials and citizens; and private interests. FLORIDA DEPARTMENT OF ENVIRONMENTAL PROTECTION Herschel T. Vinyard Jr., Secretary Drew Bartlett, Deputy Secretary for Water Policy and Ecosystem Restoration Tom Frick, Director of the Division of Environmental Assessment and Restoration Trina Vielhauer, Deputy Director of the Division of Environmental Assessment and Restoration Beth Alvi, Program Administrator for the Water Quality Restoration Program Charles Gauthier, Environmental Administrator for the Watershed Planning and Coordination Section
ORANGE CREEK BASIN WORKING GROUP PARTICIPANTS - = Empty cell/no data
LOCAL GOVERNMENTS REGIONAL AND STATE AGENCIES OTHER INTERESTED STAKEHOLDERS
Alachua County Public Works Florida Department of Agriculture and Consumer Services (including the Florida Forest Service and Office of Agriculture Water Policy)
Alachua County Environmental Protection Advisory Committee
Alachua County Environmental Protection Department
Florida Department of Environmental Protection Northeast District Office Florida Forestry Association
City of Gainesville Public Works Florida Department of Health in Alachua County Gainesville Water Management Committee
Gainesville Regional Utilities Florida Department of Transportation Plum Creek Timber Company Marion County Office of the County Engineer, Stormwater Section
Florida Fish and Wildlife Conservation Commission Private Sector
Town of McIntosh St. Johns River Water Management District Rayonier Town of Micanopy Paynes Prairie Preserve State Park Sierra Club - - University of Florida For additional information on Total Maximum Daily Loads and the watershed management approach in the Orange Creek Basin contact: Mary Paulic, Basin Coordinator Florida Department of Environmental Protection Water Quality Restoration Program, Watershed Planning and Coordination Section 2600 Blair Stone Road, Mail Station 3565 Tallahassee, FL 32399-2400 Email: [email protected] Phone: (850) 245–8560
Page i of xvi

Final Orange Creek Basin Management Action Plan Phase 2 – June 2014
TABLE OF CONTENTS
ACKNOWLEDGMENTS ......................................................................................................................... I LIST OF ACRONYMS AND ABBREVIATIONS .............................................................................. VI SUMMARY ........................................................................................................................................... VII CHAPTER 1 : CONTEXT, PURPOSE, AND SCOPE OF THE PLAN ............................................ 1
1.2 Regional Setting of the Orange Creek Basin......................................................... 5 1.3 BMAP Development Process .................................................................................. 8 1.4 Pollutant Reduction Allocations ............................................................................. 9
CHAPTER 2 : CONSIDERATIONS AND FUTURE GROWTH .................................................... 10 2.1 BMAP Assumptions and Considerations ............................................................ 10 2.2 Additional Verified Impaired Waterbodies ........................................................ 11 2.3 Managing Pollutant Loads from Future Growth ............................................... 12
CHAPTER 3 : REGULATORY LINKS AND OVERALL MANAGEMENT STRATEGIES ..... 18 3.1 Regulatory Links to BMAP Enforcement ........................................................... 18
3.1.1 Environmental Resource Permitting ....................................................................... 18 3.1.2 NPDES Stormwater Program .................................................................................. 18 3.1.3 Urban Nonpoint Sources ......................................................................................... 19
3.2 Local Government Natural Resource Protection ............................................... 20 3.2.1 Alachua County ....................................................................................................... 20 3.2.2 City of Hawthorne ................................................................................................... 21 3.2.3 City of Gainesville ................................................................................................... 21 3.2.4 Marion County ......................................................................................................... 22
3.3 Overview of Management Strategies ................................................................... 22 3.4 FWC Activities ....................................................................................................... 29 3.5 Agricultural BMP Implementation ...................................................................... 30
3.5.1 Agricultural BMPs ................................................................................................... 33 3.5.2 BMP Enrollment ...................................................................................................... 33 3.5.3 FDACS OAWP Role in BMP Implementation and Follow-Up ............................... 38 3.5.4 Florida Forest Service Role in BMP Implementation and Monitoring ................... 38
CHAPTER 4 : HOGTOWN CREEK, TUMBLIN CREEK, AND SWEETWATER BRANCH ... 40 4.1 Water Quality and Pollutant Sources .................................................................. 40 4.2 Management Strategies ......................................................................................... 42
CHAPTER 5 : ALACHUA SINK ......................................................................................................... 47 5.1 Water Quality and Pollutant Sources .................................................................. 47 5.2 Management Strategies ......................................................................................... 48
CHAPTER 6 : LAKE WAUBERG ...................................................................................................... 50 6.1 Water Quality and Pollutant Sources .................................................................. 50 6.2 Management Strategies ......................................................................................... 52
Page ii of xvi

Final Orange Creek Basin Management Action Plan Phase 2 – June 2014
CHAPTER 7 : NEWNANS LAKE ....................................................................................................... 55 7.1 Water Quality and Pollutant Sources .................................................................. 55 7.2 Recent Studies ........................................................................................................ 58 7.3 Management Strategies ......................................................................................... 59
CHAPTER 8 : ORANGE LAKE .......................................................................................................... 63 8.1 Water Quality and Pollutant Sources .................................................................. 63 8.2 Management Strategies ......................................................................................... 64
CHAPTER 9 : LOCHLOOSA LAKE ................................................................................................. 66 9.1 Water Quality and Pollutant Sources .................................................................. 66 9.2 Management Strategies ......................................................................................... 67
CHAPTER 10 : ASSESSING PROGRESS AND MAKING CHANGES ........................................ 68 10.1 Monitoring Water Quality and Pollutant Loads ................................................ 68
10.1.1 Monitoring Objectives and Anticipated Benefits .................................................. 68 10.1.2 Water Quality Indicators and Resource Responses.............................................. 68 10.1.3 Monitoring Network.............................................................................................. 70 10.1.4 Quality Assurance/Quality Control Mechanisms ................................................. 80 10.1.5 Data Management Mechanisms for Data Storage and Retrieval ......................... 80 10.1.6 Bacteria Source Tracking Protocol ...................................................................... 81
10.2 Tracking and Follow-up Actions .......................................................................... 81 10.3 Commitment to Plan Implementation ................................................................. 82
APPENDIX A: REFERENCES ............................................................................................................ 84 APPENDIX B: BACTERIA SOURCE TRACKING PROTOCOL ................................................. 86 APPENDIX C: MANAGEMENT STRATEGIES FROM THE FIRST BMAP ITERATION ...... 95
Page iii of xvi

Final Orange Creek Basin Management Action Plan Phase 2 – June 2014
LIST OF FIGURES
Figure ES-1: Orange Creek Basin Boundary and Location of BMAP Waterbodies __________ ix Figure ES-2: Change in Percent Exceedance Rates Between the TMDL Period and Recent Data
Period _______________________________________________________________x Figure ES-3: Comparison of Annual Average Chlorophyll-a Concentration Between the TMDL
Data Period and Post-BMAP Data Period _________________________________ xi Figure ES-4: Comparison of Annual Average TP Concentration between the TMDL Data
Period and Post-BMAP Data Period ______________________________________ xi Figure ES-5: Comparison of Annual Average TN Concentration Between the TMDL Data
Period and Post-BMAP Data Period _____________________________________ xii Figure 1: Orange Creek Basin Impaired Waterbodies ________________________________ 4 Figure 2: Orange Creek Basin Waterbodies ________________________________________ 6 Figure 3: Movement of Water in the Orange Creek Basin _____________________________ 7 Figure 4: Map of the Innovation Square District in Gainesville ________________________ 16 Figure 5: Examples of the Low Impact Development Strategies that Will Be Used in the
Innovation Square District _____________________________________________ 16 Figure 6: Sewer and Stormwater System Upgrades for the Innovation Square District______ 17 Figure 7: OAWP 2009 Agricultural Lands in the Orange Creek Basin __________________ 32 Figure 8: OAWP BMP Enrollment in the Orange Creek Basin as of September 30, 2013____ 37 Figure 9: Median Fecal Coliform Counts for Urban Gainesville Creeks for the Years 2001 to
2013 ______________________________________________________________ 41 Figure 10: Wet Year Baseline TN Loading to Alachua Sink ___________________________ 48 Figure 11: Trend in TSI for Lake Wauberg over the Period of Record __________________ 50 Figure 12: Average Annual Total Phosphorus Concentration Comparisons ______________ 51 Figure 13: Average Annual Total Nitrogen Concentration Comparisons ________________ 51 Figure 14: Average Annual Chlorophyll-a Concentration Comparisons _________________ 52 Figure 15: Trend in Annual Chlorophyll-a Concentrations ___________________________ 52 Figure 16: Baseline TP Loading to Lake Wauberg __________________________________ 53 Figure 17: Baseline TN Loading to Lake Wauberg __________________________________ 53 Figure 18: Trend in TP Concentrations in Newnans Lake ____________________________ 56 Figure 19: Trend in Chlorophyll-a in Newnans Lake ________________________________ 56 Figure 20: Baseline TN Loading to Newnans Lake __________________________________ 58 Figure 21: Baseline TP Loading to Newnans Lake __________________________________ 58 Figure 22: Baseline TP Loading to Orange Lake ___________________________________ 65 Figure 23: Inter-Annual Distribution of Phytoplankton Density Expressed as Biovolume for
Lochloosa Lake _____________________________________________________ 67 Figure 24: ACEPD Sampling Stations ___________________________________________ 71 Figure 25: SJRWMD Water Quality Sampling Stations, 2013 _________________________ 72 Figure 26: SJRWMD Discharge and Water Level Sampling Stations ___________________ 79
Page iv of xvi

Final Orange Creek Basin Management Action Plan Phase 2 – June 2014
Figure B-1: Private Wastewater Collection Systems and Past Priority Hot Spots __________ 87 Figure B-2: GRU Wastewater Collection System Infrastructure and the Past Priority Hot Spots
__________________________________________________________________ 88 Figure B-3: OSTDS and the Past Priority Hot Spots ________________________________ 89 Figure B-4: Gainesville Stormwater Collection System and Past Priority Hotspots ________ 90 Figure B-5: OSTDS Graphical Tool that can be Utilized for Investigation of Elevated Fecal
Coliforms in the Gainesville Urban Creeks ________________________________ 93
LIST OF TABLES
Table 1: TMDLs Addressed in the Orange Creek Basin _______________________________ 2 Table 2: Entities in the Orange Creek Basin Designated as Regulated Phase II MS4s ______ 19 Table 3: Management Strategies to Reduce Fecal Coliform and Nutrient Loading in the Orange
Creek Basin ________________________________________________________ 25 Table 4: Agricultural Land Uses in the Orange Creek Basin __________________________ 30 Table 5: Agricultural Acreage and BMP Enrollment for the Orange Creek Basin _________ 36 Table 6: Comparison of Fecal Coliform Data Between Streams for the Post-BMAP Adoption
Period _____________________________________________________________ 42 Table 7: Management Strategies To Reduce Fecal Coliform Bacteria and Nutrients in Urban
Creeks and To Prevent Future Discharges ________________________________ 45 Table 8: Management Strategies To Reduce Total Nitrogen to Alachua Sink _____________ 49 Table 9: Distribution of Algal Taxa in the Lakes ___________________________________ 57 Table 10: Management Strategies To Reduce Nutrients in Newnans Lake ________________ 61 Table 11: Management Strategies To Reduce Nutrients in Orange Lake _________________ 65 Table 12: Management Strategies To Reduce Nutrients in Lochloosa Lake _______________ 67 Table 13: Anticipated Trends in Core and Supplemental Water Quality Indicators ________ 69 Table 14: Anticipated Resource Responses to Impairment for Nutrients and Coliforms, by
Waterbody Type _____________________________________________________ 69 Table 15: Ambient Water Quality Monitoring Stations in the Orange Creek Basin _________ 73 Table 16: Discharge and Water Level Monitoring Stations in the Orange Creek Basin _____ 77 Table C-1: Agricultural BMPs__________________________________________________ 96 Table C-2: Education and Outreach Efforts _______________________________________ 97 Table C-3: Regulations, Ordinances, and Guidelines ________________________________ 97 Table C-4: Restoration and Water Quality Improvement Projects ______________________ 98 Table C-5: Special Studies and Planning Efforts ___________________________________ 99 Table C-6: Basic Stormwater Management Program Implementation __________________ 100 Table C-7: Conservation Land Acquisition/BMP Land Acquisition ____________________ 102 Table C-8: Wastewater Infrastructure Management, Maintenance, Repair, and Upgrade __ 103
Page v of xvi

Final Orange Creek Basin Management Action Plan Phase 2 – June 2014
LIST OF ACRONYMS AND ABBREVIATIONS
ACEPD Alachua County Environmental Protection Department BMAP Basin Management Action Plan BMP Best Management Practice BWG Basin Working Group CR County Road Department Florida Department of Environmental Protection EPA U.S. Environmental Protection Agency ERP Environmental Resource Permitting F.A.C. Florida Administrative Code FDACS Florida Department of Agriculture and Consumer Services FDOH Florida Department of Health FDOT Florida Department of Transportation F.S Florida Statutes FWC Florida Fish and Wildlife Conservation Commission FWRA Florida Watershed Restoration Act GRU Gainesville Regional Utilities HUC Hydrologic Unit Code lbs/yr Pounds per Year LID Low Impact Development mg/L Milligrams per Liter mL Milliliter MS4 Municipal Separate Storm Sewer System MST Microbial Source Tracking NE Northeast NOI Notice of Intent NPDES National Pollutant Discharge Elimination System NW Northwest OAWP Office of Agricultural Water Policy ORI Outfall Reconnaissance Inventory OSTDS Onsite Sewage Treatment and Disposal System PLRG Pollutant Load Reduction Goal SE Southeast SJRWMD St. Johns River Water Management District SR State Road STORET Storage and Retrieval (database) SW Southwest SWIM Surface Water Improvement and Management TMDL Total Maximum Daily Load TN Total Nitrogen TP Total Phosphorus TSI Trophic State Index UF University of Florida WBID Waterbody Identification WRF Water Reclamation Facility
Page vi of xvi

Final Orange Creek Basin Management Action Plan Phase 2 – June 2014
SUMMARY
This document describes the management priorities for the second phase of the Orange Creek Basin
Management Action Plan (BMAP) adopted by Florida Department of Environmental Protection
Secretarial Order in May 2008. For this second BMAP iteration, new strategies for continuing water
quality improvements in impaired waters that help in achieving the nutrient and fecal coliform total
maximum daily loads (TMDLs) in this basin are proposed. However, the 2008 BMAP remains in effect
and projects adopted through it are still under Secretarial Order.
Over the next five years, this second phase of the BMAP focuses on identification of nutrient sources
that cause impairment of the basin’s lakes (Newnans Lake, Orange Lake, and Lake Wauberg), provides
support for the restoration of Paynes Prairie, and continues the refinement and strengthening of
protocols that address fecal coliforms TMDLs in the urban creeks. In addition, the nutrient TMDL for
Lochloosa Lake will be adopted during this second BMAP iteration, and actions that address that TMDL
are identified. Lochloosa Lake is a tributary of Orange Lake.
This BMAP provides for phased implementation under Subparagraph 403.067(7)(a)1, Florida Statutes
(F.S.), and this adaptive management process will continue until the TMDLs are met. The phased
BMAP approach allows for incrementally reducing loadings through the implementation of projects,
while simultaneously monitoring and conducting studies to better understand water quality dynamics
(sources and response variables) in each impaired waterbody. Subsequent five-year BMAP
management phases will continue to evaluate progress and make adjustments or add new projects, as
needed, to meet the TMDLs.
All impaired surface waters in the Orange Creek Basin covered by this BMAP are designated as Class
III waters in accordance with Chapter 62-302, Florida Administrative Code (F.A.C.). Class III waters
are defined as having suitable water quality for recreational use and for the propagation and maintenance
of a healthy, well-balanced population of fish and wildlife. Management strategies addressing these
TMDLs in this basin were included in a single BMAP, because of the connection of the TMDL
waterbodies. Several local pollution control programs, as well as maintenance and operation activities,
apply to all the waterbodies.
The following streams and lakes have TMDLs and are depicted in Figure ES-1:
Page vii of xvi

Final Orange Creek Basin Management Action Plan Phase 2 – June 2014
− Hogtown Creek, Tumblin Creek and Sweetwater Branch: Impaired due to high levels
of fecal coliform bacteria exceeding the state criterion.
− Alachua Sink: Impaired due to excessive nitrogen. Alachua Sink is part of Paynes
Prairie.
− Newnans Lake: Impaired due to excessive nitrogen and phosphorus.
− Lake Wauberg: Impaired due to excessive nitrogen and phosphorus.
− Orange Lake: Impaired due to excessive phosphorus.
The BMAP process strives to achieve cooperation and consensus among a broad range of interested
parties. The process promotes the engagement of local stakeholders in a coordinated and collaborative
manner to address the reductions in loadings of nutrients and bacteria needed to achieve the Orange
Creek Basin TMDLs. Members of the Orange Creek Basin Working Group (BWG) began the process
to update the 2008 BMAP in October 2013, with a series of meetings through March 2014.
PROGRESS DURING THE FIRST BMAP ITERATION Substantial progress was made in identifying sources of fecal coliform bacteria and remediating
contributing illicit discharges since the adoption of the BMAP in 2008. When compared to data in the
TMDL baseline period the rates of exceedance of the daily fecal coliform criterion have declined
(Figure ES-2) in all impaired streams. Gainesville Regional Utilities (GRU), the City of Gainesville,
Florida Department of Health (FDOH) in Alachua County, Alachua County, and Florida Department of
Transportation (FDOT) District 2 completed a number of management actions pertinent to controlling
fecal coliform bacteria during the first BMAP iteration to better evaluate elevated levels of fecal
coliform bacteria in Gainesville’s urban creeks. The identification of bacteria sources using a variety of
techniques, including detailed microbial source tracking (MST), the use of optical brighteners, and field
observations, was completed and a protocol for investigating and identifying bacterial sources
established. This protocol can be applied to other streams with elevated fecal coliforms bacteria levels.
Page viii of xvi

Final Orange Creek Basin Management Action Plan Phase 2 – June 2014
FIGURE ES-1: ORANGE CREEK BASIN BOUNDARY AND LOCATION OF BMAP WATERBODIES
Page ix of xvi

Final Orange Creek Basin Management Action Plan Phase 2 – June 2014
FIGURE ES-2: CHANGE IN PERCENT EXCEEDANCE RATES BETWEEN THE TMDL PERIOD AND
RECENT DATA PERIOD
Water quality improvements for Newnans Lake, Orange Lake, and Lake Wauberg have been more
mixed and are inadequate to meet the TMDLs for these waterbodies, indicating that more effort is
needed. Figure ES-3 compares annual average chlorophyll-a concentrations between lakes and by
TMDL data period and post-BMAP data period. Annual average chlorophyll-a levels have declined for
lakes Newnans, Orange, and Lochloosa, but increased for Lake Wauberg. Chlorophyll-a is used as an
indicator of algal biomass. The decline in chlorophyll-a is an indicator of improving water quality.
However, even with a decline in concentrations, the current levels are too high for healthy lakes. The
dominant algal taxa present in lakes Newnans, Orange, and Lochloosa are the blue-greens indicating a
continued imbalance within these lakes. The lakes have experienced two periods of historically low
water levels over the past 15 years compared to historical records, which may have affected algal
populations.
Page x of xvi

Final Orange Creek Basin Management Action Plan Phase 2 – June 2014
FIGURE ES-3: COMPARISON OF ANNUAL AVERAGE CHLOROPHYLL-a CONCENTRATION BETWEEN
THE TMDL DATA PERIOD AND POST-BMAP DATA PERIOD
Figure ES-4 and Figure ES-5 compare annual average total phosphorus (TP) and total nitrogen (TN)
concentrations between lakes and time periods. While chlorophyll-a concentrations have decreased,
annual average TP and TN concentrations have increased or exhibited a small decline as for TN for
Newnans Lake. The increase in nutrients may be a result of extended droughts concentrating them in
the water column over the past 15 years. The increase for TP may also be a result of erosion processes
in tributary streams that have exposed the phosphate-rich clays of the Hawthorn Group.
FIGURE ES-4: COMPARISON OF ANNUAL AVERAGE TP CONCENTRATION BETWEEN THE TMDL DATA
PERIOD AND POST-BMAP DATA PERIOD
Page xi of xvi

Final Orange Creek Basin Management Action Plan Phase 2 – June 2014
FIGURE ES-5: COMPARISON OF ANNUAL AVERAGE TN CONCENTRATION BETWEEN THE TMDL
DATA PERIOD AND POST-BMAP DATA PERIOD
MANAGEMENT STRATEGIES The BMAP built upon existing water quality improvement programs and local partnerships, such as the
Gainesville Clean Water Partnership (which includes Gainesville, Alachua County, and FDOT), created
to address water quality problems and implement a stormwater management program that was created as
result of the municipal separate storm sewer system (MS4) Phase II permit requirements. State and
local governments as well as community groups have committed to the implementation of the BMAP.
Furthermore, wastewater or stormwater permits often contain provisions that specifically require
implementation of the BMAP strategies.
The BMAP describes the management strategies that have been or will be undertaken by local, regional,
state, or private entities to reduce the amount of these pollutants released into waterbodies with
established TMDLs. Management strategies cover a wide variety of pollutant control measures through
stormwater retrofits, centralized wastewater infrastructure management, the repair and/or upgrade of on-
site sewage treatment and disposal systems (OSTDS), pollution prevention, public education, and
related activities.
An additional 57 projects are adopted with this second phase of the BMAP. They cover a range of
management strategies including purchases of conservation land around the large lakes, urban
Page xii of xvi

Final Orange Creek Basin Management Action Plan Phase 2 – June 2014
stormwater best management practices (BMPs), public education and outreach, and continued
monitoring and evaluation of water quality response to management actions.
The following summary of major management strategies represents the goals of the second BMAP
cycle:
1. Alachua County, the FDOH in Alachua County, GRU, the Department, City of
Gainesville, and FDOT District 2 initiated a project during the first BMAP cycle to
identify and remediate sources of fecal coliform bacteria in urban creeks or “hot spots”
(areas with consistently high fecal counts) in response to the adoption of fecal coliforms
TMDLs for Hogtown Creek, Sweetwater Branch, and Tumblin Creek. The selection of
these hot spots was based on fecal coliform monitoring and initial MST activities in the
basin. The project has culminated in a series of management actions or protocols to be
taken when high levels of fecal coliforms are found in urban streams. The protocols have
identified and eliminated many sources achieving significant localized reductions in fecal
coliforms levels and improved communication and coordination among the agencies
responsible for wastewater and stormwater management. They will continue to be
utilized to investigate new sources of fecal contamination as well as refined and
strengthened during the second BMAP cycle with the expectation of continued
remediation of problems. These protocols will be adopted with this BMAP.
2. The Sweetwater Branch/Paynes Prairie Sheetflow Restoration Project is a cooperative
effort of local governments, City of Gainesville Public Works, GRU, the Department,
FDOT, St. Johns River Water Management District (SJRWMD), and others. The TN load
reductions required of wastewater and stormwater point sources identified in the
Alachua Sink TMDL will be met when this project is completed. Its purpose is to
rehydrate wetlands by the return of sheetflow to Paynes Prairie and, through the creation
of a wetland treatment system, remove nutrients from water in Sweetwater Branch, which
discharges into Alachua Sink. Construction was officially started in May 2013 with
completion expected in 2016. The project is adopted with this second phase of the BMAP
and its implementation continues to be supported by the BWG.
Page xiii of xvi

Final Orange Creek Basin Management Action Plan Phase 2 – June 2014
3. Implementing actions that address the TMDLs established for lakes Newnans, Orange,
and Wauberg is a priority of this second five year BMAP cycle. A goal of this second
phase of the BMAP is to identify, during the 18-24 months following its adoption,
actionable management strategies that will improve water quality. The first five-year
BMAP cycle focused on studies and data collection needed to support the development of
management strategies for the lakes. In 2010, SJRWMD completed pollutant load
reduction goals (PLRGs) for nutrients in Newnans Lake and in 2011, completed a
Surface Water Management Plan (SWIM) for the basin. The PLRGs and SWIM Plan
identified major sources of nutrient pollutants and suggested actions that may aid in the
selection of future management strategies to reduce nutrient loads. In 2011, the
Department collaborated with the SJRWMD and Alachua County Environmental
Protection Department (ACEPD) to conduct a survey of depth to the Hawthorn
Formation in the Newnans Lake watershed. In many parts of the watershed, the
Hawthorn Formation is at or near the land surface and can be a contributor of
phosphate to surface waters. The Department conducted an investigation of ground
water-surface water interactions in the Lochloosa Lake and Orange Lake watersheds
(report completed 2008) in an effort to estimate the role of ground water as a nutrient
input to Lochloosa Lake. The second five-year iteration will build on those efforts and
translate them into management actions. Even with this additional focus, achieving the
lake TMDLs will be a long-term process as indicated by the water quality data presented
in the previous section.
4. Aquatic plant management and habitat restoration are important elements of Florida
Fish and Wildlife Conservation Commission’s (FWC) lake management in this basin. A
management strategy for this second BMAP cycle is to develop closer communication
and coordination between the Department and FWC and other BWG members in the
development of water quality and habitat restoration plans.
5. BMPs for all the agricultural commodities in the basin have now been developed by the
Florida Department of Agriculture and Consumer Services (FDACS). Agricultural
producers are required to implement BMPs developed for their commodity upon their
adoption by FDACS as a rule and as a requirement of this BMAP. Implementation of
Page xiv of xvi

Final Orange Creek Basin Management Action Plan Phase 2 – June 2014
agricultural BMPs and achievement of nutrient loading reductions are most important in
the Newnans, Lochloosa, and Orange lake watersheds.
ALLOCATIONS The BWG agreed that basin allocations adopted as part of each TMDL were appropriate for the initial
BMAP, as well as this second iteration of the BMAP. Several factors influenced this decision. First,
fecal coliform pollution is best served by investigating potential sources in the field. For nutrient
impairments, there are only three major point source discharges in the basin, all affecting Alachua Sink.
Wasteload allocations to these three point sources were made within the Alachua Sink TMDL.
Uncertainty about the identification of nutrient sources required further investigation. The physical
interconnectedness of the stormwater collection system managed by Alachua County, Gainesville, and
FDOT requires the sharing of stormwater management responsibilities among these entities. This
second phase of the BMAP maintains the basin allocation approach but includes a recommendation that
more detailed allocations may be assigned as implementation continues, for waterbodies that do not
show improvement in water quality and in areas for which sufficient data exist to quantify more specific
assignments.
MANAGING POLLUTANT LOADS FROM FUTURE GROWTH As required by the Florida Watershed Restoration Act (FWRA), nutrient and fecal coliform loadings
associated with future growth were considered. Basinwide, the growth predicted from 2007 through
2015, based on U. S. Census Bureau data, was not expected to substantially increase pollutant loads.
However, land use in eastern Alachua County may undergo substantial changes over the next few
decades. Lands that are currently in silviculture are planned for commercial and residential
development. In January 2014, Plum Creek, the largest private landowner in Alachua County, proposed
an amendment to the Alachua County Comprehensive Plan to include a Sector Plan for a portion of
those holdings east of Newnans Lake and west of US 301, largely in the Lochloosa Lake watershed.
How this will effect loading is unknown at this time.
A large part of the urban area (downtown) of Gainesville is currently in the planning stages for
redevelopment into the Innovation Square District. The downtown contains the older parts of
Gainesville, a good portion of which was developed before stormwater management rules were adopted
and where stormwater retrofitting is desirable. Redevelopment is most extensive in the Tumblin Creek
watershed. The expected benefit of the redevelopment process is the use of structural BMPs and low
Page xv of xvi

Final Orange Creek Basin Management Action Plan Phase 2 – June 2014
impact development (LID) techniques to reduce both fecal coliform levels and nutrient levels that will
directly benefit Tumblin Creek and Bivens Arm.
BMAP IMPLEMENTATION AND TRACKING In this second phase, the BWG will continue to track its projects and other implementation efforts, as
well as monitor water quality in TMDL waterbodies, to ensure that the BMAP is carried out and to
measure its effectiveness. The BWG will meet at least annually to discuss implementation issues,
consider new information, and determine other management strategies needed for waterbodies that are
not projected to meet their TMDLs.
Each entity responsible for implementing management strategies as part of the BMAP will complete an
annual report for submittal to the BWG and the Department. The report will track the implementation
status of any management strategies listed in the BMAP and document additional management strategies
undertaken to further the water quality improvements in the basin.
As part of the BMAP, the BWG designed a strategy for monitoring water quality based on specific
indicators and measuring pollutant concentrations and loads to determine if water quality is improving
and the TMDL is being met. Observations of water quality conditions and trends will be reported to the
BWG and public at least annually as part of the BMAP annual report. Water quality data will be used to
support the adaptive management process, assess projects, and identify the need for new actions.
Page xvi of xvi

Final Orange Creek Basin Management Action Plan Phase 2 – June 2014
Chapter 1: CONTEXT, PURPOSE, AND SCOPE OF THE PLAN
For this second phase of the basin management action plan (BMAP), new strategies for continuing water
quality improvements in impaired waters that help in achieving the nutrient and fecal coliform total
maximum daily loads (TMDLs) in this basin are proposed. However, the 2008 BMAP remains in effect
and projects adopted through it are still under Florida Department of Environmental Protection
Secretarial Order (http://www.dep.state.fl.us/water/watersheds/bmap.htm).
Addressing the nutrient TMDLs established for the lakes (Newnans Lake, Orange Lake, and Lake
Wauberg), supporting the completion of the Paynes Prairie Sheetflow Restoration Project, and
continuing efforts to address fecal coliforms TMDLs for Hogtown Creek, Sweetwater Branch, and
Tumblin Creek will be the primary focus of this second five-year BMAP cycle. Management strategies
addressing these TMDLs were included in a single BMAP, because of the connection of the TMDL
waterbodies. Several local pollution control programs, as well as maintenance and operation activities,
apply to all the waterbodies.
The first five-year BMAP iteration identified studies and data collection needed to support the
development of management strategies for the lakes. The second five-year iteration will build on those
efforts and translate them into management strategies. The development and adoption of the Lochloosa
Lake TMDL during this second cycle, as well as identification of actions that address the TMDL, will
aid in the restoration of Orange Lake.
The Paynes Prairie sheetflow restoration project addresses the wastewater and urban stormwater load
allocations assigned in the Alachua Sink TMDL, and is adopted with this BMAP. The Orange Creek
Basin Working Group (BWG) will continue to support efforts to implement and successfully complete
this project. The restoration of wetlands on Paynes Prairie was officially started in May 2013, and
project completion is expected in 2016.
Alachua County, Gainesville Regional Utilities (GRU), and the Florida Department of Health (FDOH)
in Alachua County collaborated to complete management actions to better evaluate and address elevated
levels of fecal coliform bacteria in Gainesville’s urban creeks. This action was taken in response to the
adoption of fecal coliforms TMDLs for Sweetwater Branch, Tumblin Creek, and Hogtown Creek. The
identification of bacteria sources using a variety of techniques, including detailed microbial source
Page 1 of 106

Final Orange Creek Basin Management Action Plan Phase 2 – June 2014
tracking (MST), optical brighteners, and field observations, has resulted in a protocol for investigating
and identifying bacterial sources that will be adopted with this BMAP (refer to Appendix B). The
protocols will be utilized to investigate reoccurring and new sources of fecal contamination as well as
refined and strengthened during the second BMAP iteration with the expectation of continued
remediation of existing problem waterbodies.
An additional 57 management strategies are adopted with this second iteration BMAP. They cover a
range of strategies including purchases of conservation land around the large lakes, urban stormwater
best management practices (BMPs), public education and outreach, and continued monitoring and
evaluation of water quality response to management actions. This BMAP includes efforts to more fully
implement agriculture BMPs relevant to the commodities present in the basin; these efforts are of
importance for the restoration of the lakes.
This is a phased BMAP as outlined under Paragraph 403.067(7)(a)1, Florida Statutes (F.S.) and, as such,
allows for the implementation of projects designed to achieve incremental reductions, while
simultaneously monitoring and conducting studies to better understand water quality dynamics (sources
and response variables) in each impaired waterbody. Subsequent five-year management cycles will
evaluate progress and make adjustments or add new projects, as needed, to meet the current or new
TMDLs. This adaptive management process will continue until the TMDLs are met. The total nitrogen
(TN), total phosphorus (TP), and fecal coliform TMDLs addressed by this BMAP are listed in Table 1.
Impaired waterbodies are displayed in Figure 1.
TABLE 1: TMDLS ADDRESSED IN THE ORANGE CREEK BASIN - = No data
WBID PARAMETER
TMDL BASELINE LOADING (POUNDS
PER YEAR [LBS/YR])
TMDL (LBS/YEAR OR COUNTS
PER 100 MILLILITER
[ML])
WASTEWATER WASTELOAD ALLOCATION
(LBS/YR)
NATIONAL POLLUTANT DISCHARGE
ELIMINATION SYSTEM (NPDES)
STORMWATER WASTELOAD
ALLOCATION (% REDUCTION)
LOAD ALLOCATION
(LBS/YR)
% REDUCTION
NEEDED Newnans Lake
2705B TN 315,510 85,470 3,104 - 82,366 74%
Newnans Lake 2705B TP 25,732 10,924 386 - 10,538 59%
Orange Lake 2749A TP 27,889 15,262 - - 15,262 45%
Page 2 of 106

Final Orange Creek Basin Management Action Plan Phase 2 – June 2014
WBID PARAMETER
TMDL BASELINE LOADING (POUNDS
PER YEAR [LBS/YR])
TMDL (LBS/YEAR OR COUNTS
PER 100 MILLILITER
[ML])
WASTEWATER WASTELOAD ALLOCATION
(LBS/YR)
NATIONAL POLLUTANT DISCHARGE
ELIMINATION SYSTEM (NPDES)
STORMWATER WASTELOAD
ALLOCATION (% REDUCTION)
LOAD ALLOCATION
(LBS/YR)
% REDUCTION
NEEDED Lake Wauberg
2741 TN 4,064 2,062.4 - - 2,062.4 51%
Lake Wauberg 2741 TP 748 374 - - 374 50%
Alachua Sink 2720A TN 462,557 256,322 41,003 45% 215,319 45%
Hogtown Creek 2698 Fecal Coliform 1,633 800 - 51% 51% 51%
Tumblin Creek 2718A Fecal Coliform 3,077 800 - 74% 74% 74%
Sweetwater Branch 2711
Fecal Coliform 2,667 800 2.27E + 11 70% 70% 70%
Page 3 of 106

Final Orange Creek Basin Management Action Plan Phase 2 – June 2014
FIGURE 1: ORANGE CREEK BASIN IMPAIRED WATERBODIES
Page 4 of 106

Final Orange Creek Basin Management Action Plan Phase 2 – June 2014
1.2 REGIONAL SETTING OF THE ORANGE CREEK BASIN The Orange Creek Basin is located in Alachua County, including a significant part of the City of
Gainesville, northern Marion County and southwestern Putnam County, and is part of the Ocklawaha
River Basin (Figure 1). The basin is divided into six major sub-basins: Hogtown Creek, Payne’s
Prairie (includes Lake Wauberg, Alachua Sink, Tumblin Creek, and Sweetwater Branch), Newnans
Lake (includes Hatchet, Little Hatchet, and Lake Forest Creeks), Lochloosa Lake, Orange Lake, and
Orange Creek (Figure 2). Each sub-basin has unique issues influencing water quality, including the
degree of existing and anticipated development, the number and type of sources, and geographic
considerations. The Hogtown Creek and Payne’s Prairie watersheds receive the most urban drainage,
while the Lake Lochloosa and Orange Lake watersheds are largely rural.
The six sub-basins can be further grouped into three primary hydrologically connected groupings.
Major water flow paths are displayed in Figure 3. Hogtown Creek drains western urban Gainesville and
discharges to Haile Sink. Tumblin Creek and Sweetwater Branch drain the older urbanized portions of
Gainesville and eventually discharge to Paynes Prairie and Alachua Sink. Lake Wauberg is bordered on
the north by Paynes Prairie, but has no continuous inflows or outflows. Hatchet Creek and its tributaries
drain the eastern side of largely residential and rural Gainesville and Alachua County into Newnans
Lake. Once water leaves Newnans Lake, about 45% of the flow (long-term average) is diverted into
Paynes Prairie through three large culverts. The remainder flows south towards Orange Lake by way of
Camps Canal and the River Styx swamp (Robinson, 1992). Water also enters Orange Lake from
Lochloosa Lake through Cross Creek. Water quality problems in Newnans Lake can be transferred to
Orange Lake. Orange Creek begins as the discharge from Orange Lake and enters the Ocklawaha River
through the Rodman Reservoir.
Page 5 of 106

Final Orange Creek Basin Management Action Plan Phase 2 – June 2014
FIGURE 2: ORANGE CREEK BASIN WATERBODIES
Page 6 of 106

Final Orange Creek Basin Management Action Plan Phase 2 – June 2014
FIGURE 3: MOVEMENT OF WATER IN THE ORANGE CREEK BASIN
Page 7 of 106

Final Orange Creek Basin Management Action Plan Phase 2 – June 2014
1.3 BMAP DEVELOPMENT PROCESS The BMAP process was structured to achieve cooperation and consensus among a broad range of
interested parties. The process promoted the engagement of local stakeholders in a coordinated and
collaborative manner to address the reductions of loadings of nutrients and bacteria needed to achieve
the Orange Creek Basin TMDLs.
Meaningful public involvement continues to be a key component of the Orange Creek BMAP process.
In October 2004, the Department convened the Orange Creek BWG, comprised of representatives from
local, regional, state, business, and community interests, to develop a BMAP and to provide input during
implementation and subsequent BMAP iterations. The BWG used a consensus-based, collaborative
approach when making decisions on the content of the BMAP. The members of the BWG are listed in
the Acknowledgements Section.
The BWG began the second BMAP phase development process in October 2013, followed by a series of
meetings through March 2014. All BWG meetings held in the basin were public meetings noticed in the
Florida Administrative Record and on the Department’s website. During the BWG meetings, public
comment from interested citizens was solicited. A public workshop on the second BMAP was held on
January 30, 2014, which was advertised in the Gainesville Sun and Ocala Star Banner newspapers.
Special briefings for commissions and advisory committees were not requested for the adoption of the
updated BMAP.
It was necessary to redefine what constitutes a consensus agreement for the BWG during the second
phase, short of unanimous agreement, in making recommendations to the Department. Members that
support or accept a recommendation are considered to be in consensus with the recommendation;
members that oppose a recommendation are not in consensus with the recommendation. However, the
BWG concluded that accepting a proposal without full unanimity would be a default position, when
necessary to move the process forward and to complete the development of the BMAP on schedule. The
BWG agreed to make every effort to develop proposals that all members could support. If a unanimous
or consensus alternative cannot be identified, a non-consensus recommendation will include a
description of the parties that objected and the nature of their objection(s). These objections will be
included in presentations to the Department’s decision-makers so that an informed decision can be made
on whether and how to move forward with the BMAP process.
Page 8 of 106

Final Orange Creek Basin Management Action Plan Phase 2 – June 2014
1.4 POLLUTANT REDUCTION ALLOCATIONS The BWG agreed that basin allocations adopted as part of each TMDL were appropriate for the initial
BMAP, as well as this second phase of the BMAP. If substantial progress toward water quality
improvement is not made during this second BMAP phase, specific allocations should be considered.
The following factors were considered in making this decision:
− Only three major point sources are identified in the TMDL wasteload allocations for
nutrients: domestic wastewater (GRU), power generation station (GRU), and municipal
stormwater discharges.
− Municipal stormwater discharges also have allocations in the bacteria TMDLs.
Allocations to these sources were adequately documented in the TMDL.
− Sources of nutrients problems in the lakes require further investigation to determine
relative contribution.
− Although local governments and the Florida Department of Transportation (FDOT) have
independent permit responsibilities, the interconnectedness of their stormwater
infrastructure requires local municipal separate storm sewer system (MS4) permittees to
cooperate closely to meet their permit responsibilities. This cooperation occurs in part
through the Gainesville Clean Water Partnership among the City of Gainesville, FDOT,
and Alachua County. Together, the Partnership shares NPDES permit responsibilities.
The Partnership also cooperates in implementing TMDL projects.
Page 9 of 106

Final Orange Creek Basin Management Action Plan Phase 2 – June 2014
Chapter 2: CONSIDERATIONS AND FUTURE GROWTH
This section contains general assumptions and considerations made during the development of this
BMAP, as well as a discussion on the impact of future growth in the basin on loadings to the impaired
waterbodies.
2.1 BMAP ASSUMPTIONS AND CONSIDERATIONS The water quality improvements from BMAP implementation are based on a number of fundamental
assumptions and considerations, as follows:
− Multi-parameter Impacts – Actions in this BMAP that decrease fecal coliform will also
decrease nutrients.
− Unquantified Project Impacts – Some of the projects and activities contained in the
BMAP cannot currently be quantified with regard to the reductions in coliforms or
nutrients they might achieve. An example is the purchase of land for conservation
purposes. However, because of their positive project impact, it is assumed that these
actions will help reduce pollutant loads and estimates of loading reductions may be
determined at a later date.
− Source Identification – Fecal coliform impairment sources are particularly difficult to
trace. For this reason, source identification studies are included as management
strategies.
− Implementation Schedule – BMAP implementation will be a long-term process. While
many of the projects and activities contained in the BMAP are recently completed or
currently ongoing, key projects and studies may extend beyond the second five-year
BMAP cycle. Therefore, TMDLs established for impaired waters in the basin will not
necessarily be achieved in the near term. Regular follow-up and continued BWG activity
will ensure that management strategies are carried out and that their incremental effects
are assessed. As each five-year iteration is completed and more information is gathered,
additional management strategies to achieve the TMDLs will be developed.
Page 10 of 106

Final Orange Creek Basin Management Action Plan Phase 2 – June 2014
2.2 ADDITIONAL VERIFIED IMPAIRED WATERBODIES The Orange Creek Basin is in Group 1 of the Department’s rotating basin assessment. It was first
assessed for compliance with water quality standards and criteria in 2002 with subsequent evaluations in
2008 and 2012. The impaired waters lists were adopted by Secretarial Order in 2002, 2009, and 2013.
In addition to the waterbodies addressed by this BMAP, there are 27 additional listings of impaired
waters in the Orange Creek Basin, which can be found on the Department’s website at
http://www.dep.state.fl.us/water/watersheds/assessment/a-lists.htm#vl. The listings are for nutrients,
dissolved oxygen, and fecal coliforms. TMDLs have not been developed for these impairments.
There are other options available for local stakeholders to address impaired waterbodies beside the
TMDL/BMAP pathway. A Reasonable Assurance Plan is documentation that control programs are or
can be put in place that will restore water quality to an impaired water precluding the need for
development of a TMDL. Typically, these plans are approved before the listing of a water as impaired
is finalized (so the waterbody is not listed), and the plan needs both U. S. Environmental Protection
Agency (EPA) and Department approval. The required content of these plans is similar to the
requirements of a BMAP. The second option is the Category 4e Water Quality Restoration Plan, which
is for a waterbody that has been listed as impaired for a given parameter, but there are local initiatives
that can potentially address the impairment. This type of plan may postpone the development of a
TMDL and only requires the approval of the Department. The waterbody is listed in Category 4e, which
means that it has a water quality impairment, but is not on schedule for a TMDL.
On November 30, 2012, the EPA approved the Department’s numeric nutrient criteria for rivers,
streams, lakes, and some estuaries. In January 2014, a federal judge granted EPA’s motion to
discontinue federal rulemaking and allow the Department to implement its numeric nutrient. As part of
the Department’s numeric nutrient criteria, established restoration goals in the form of TMDLs continue
to apply. Therefore, the Orange Creek TMDLs remain the applicable nutrient standards, and will remain
in effect once all of Department’s nutrient standards are in effect because the standards establish nutrient
TMDLs as site-specific interpretations of the narrative nutrient criteria. However, future evaluations for
impairments in the basin will be based on the state’s numeric nutrient criteria. The next assessment of
waters in the Orange Creek Basin will occur in 2018; that assessment could result in removal of some
listed waters and addition of others.
Page 11 of 106

Final Orange Creek Basin Management Action Plan Phase 2 – June 2014
2.3 MANAGING POLLUTANT LOADS FROM FUTURE GROWTH As required by the FWRA, nutrient and fecal coliform loadings associated with future growth were
considered as part of the BMAP. Originally, based on the 2000 U.S. Census Bureau data, future growth
predicted through 2015 was not expected to substantially increase pollutant loads. Local land
development regulations, comprehensive plans, local codes, incentives, and Environmental Resource
Permit (ERP) requirements provide provisions for protecting water resources and reducing the impact of
new development as it occurs (see Section 3.2 for more detail). Alachua County’s Water Quality Code,
in effect since January 1, 2003, establishes standards for environmental protection through the regulation
of water pollution. Erosion and sediment control are part of the Water Quality Code, and the code
requires that land excavation or filling does not adversely impact surface or ground water quality. Both
Marion and Alachua counties require buffers between development and wetlands. The City of
Gainesville maintains an incentive program for developers to employ green building techniques in new
development (Chapter 6, Article 1.5, City Code of Ordinances). Some of the incentives provided by this
program are fast-track permitting, fee reductions for building applications, and official designation as a
green building. The City of Hawthorne has land development regulations that protect wetlands and
surface waters within the city boundaries.
However, emerging development patterns indicate that Census predictions may under estimate future
land use changes. Land use in eastern Alachua County may undergo substantial changes over the next
few decades. There are plans to convert lands that are currently in silviculture into commercial and
residential development. In January 2014, Plum Creek, the largest private landowner in Alachua
County, proposed an amendment to the Alachua County Comprehensive Plan to include a Sector Plan
for a portion of those holdings east of Newnans Lake and west of US 301, largely in the Lochloosa Lake
watershed. The Sector Plan would primarily be located north of State Road (SR) 20, with some
development south of SR 20 near the City of Hawthorne, and involves approximately 60,000 acres with
10,000 acres of proposed urban development. The fifty-year build out of the Sector Plan would include
an estimated 10,500 homes, as well as commercial and industrial development. Alachua County
received the request for a Comprehensive Plan amendment for the project in January 2014. The first
phases of development are planned to occur east of Newnans Lake and west of Lochloosa Creek, north
of SR 20, as well as west of the City of Hawthorne, north and south of SR 20. The plan does provide for
Page 12 of 106

Final Orange Creek Basin Management Action Plan Phase 2 – June 2014
conservation easements and for sewer in areas of high density development. Information on the project,
Envision Alachua, can be found at http://www.envisionalachua.com/.
The Sector Plan covers areas in the Lochloosa Creek and Lochloosa Lake watersheds. Lochloosa Lake
is a verified impaired waterbody and adoption of its TMDL is planned during this second BMAP phase.
The lake is an Outstanding Florida Water, designated in 1987. The 1,252 acre Lochloosa Creek
Flatwoods Strategic Ecosystem is also located within the project area. Water resources in these
watersheds are sensitive and development of the area provides unique challenges. There is the potential
for water resources to be impacted by development. The area has a relatively high water table with a
land cover of pine flatwoods interspersed with forested wetlands. The area is underlain by varying
thicknesses of the Hawthorn Group formations and more recent deposits; in some places the Hawthorn
is almost at land surface.
The ERP program considers the applicability of the requirements of Section 373.4141 (F.S.) in
evaluating future development. Under state law, ERP requires that identified water quality impairments
are addressed through project design and commitments. There are additional provisions for net
improvement as specified in Rule 62-330.301(2), F.A.C. Factors as listed below should be considered in
the ERP and Sector Plan in development of stormwater management systems, water supply, and use of
reclaimed water, because of the environmental sensitivity of the Lochloosa Lake watershed:
− Emphasize low impact development (LID) to reduce the amount of stormwater generated.
− Preserve and protect native habitat.
− Minimize exposing Hawthorn Group constituents that may release phosphorus.
− Ensure all landscaping and agricultural practices are sustainable and follow BMPs.
− Utilize non-engineering options to reduce the loads prior to the treatment systems
(Florida Friendly Landscaping, reduced landscaped area, homeowner association
covenants, etc.).
− Minimize water use for the project (e.g. implement Florida WaterStar or similar
requirements, promote use of cisterns, minimize water intensive landscaping, etc.).
Page 13 of 106

Final Orange Creek Basin Management Action Plan Phase 2 – June 2014
− Develop creative methods for wastewater treatment and reuse. Ensure a high level of
wastewater treatment, advanced wastewater treatment is preferred, prior to disposal via
a rapid infiltration basin, land spreading, treatment wetlands, or other method where
treated effluent would reach surface of ground water resources.
− Maximize the use of reclaimed water (wastewater and stormwater) by industrial facilities
to minimize the impact of reclaimed water on surface waters and natural wetlands.
A large part of the urban area (downtown) of Gainesville is currently in the planning stages for
redevelopment into the Innovation Square District (see Figure 4). Part of the incentive behind this
planning initiative is to create a link between the University of Florida (UF) and downtown Gainesville.
The downtown contains the older parts of Gainesville, a good portion of which was developed before
stormwater management rules were adopted and where stormwater retrofitting is desirable.
Redevelopment is most extensive in the Tumblin Creek watershed. The expected benefit of the
redevelopment process is the use of structural BMPs and LID techniques to reduce both fecal coliform
levels and nutrient levels that will directly benefit Tumblin Creek and Bivens Arm.
Redevelopment presents opportunities for incorporating LID principles into design of the District, such
as streetscaping and green space (Figure 5), and for improving wastewater and stormwater collection
infrastructure (Figure 6). Several of these infrastructure upgrade projects are underway or planned in
the near future in the Tumblin Creek watershed. Local partners are pursuing funding for additional
projects.
One example of a project is the City of Gainesville’s collaboration with other local agencies to create a
Tumblin Creek Regional Stormwater Treatment Facility. The City is collaborating with local agencies
to develop and construct this facility. In 1964, a 1,000-foot creek section was channelized and the
adjacent wetland cleared and filled with the spoil from the creek excavation. Construction of this spoil
pile removed natural sheet flow of Tumblin Creek to a large portion of the forested wetlands. In effect,
the quantity of stormwater treatment provided by this area has been greatly reduced. The project
proposes to construct a large concrete sediment trap located a few hundred feet downstream of the US
441 underpass of Tumblin Creek. The structure will have the capacity to hold several hundred tons of
sediment which will be removed periodically. Immediately downstream of the sediment basin will be a
trash trap that will stop and gather floating debris to allow for easy removal during maintenance
Page 14 of 106

Final Orange Creek Basin Management Action Plan Phase 2 – June 2014
operations. Another key element of the project is a series of ditch bottom inlets and pipes that will allow
for the base flow of Tumblin Creek to travel through the aforementioned spoil berm and rehydrate
historic wetlands that surround the creek’s discharge into Bivens Arm Lake.
Page 15 of 106

Final Orange Creek Basin Management Action Plan Phase 2 – June 2014
FIGURE 4: MAP OF THE INNOVATION SQUARE DISTRICT IN GAINESVILLE
FIGURE 5: EXAMPLES OF THE LOW IMPACT DEVELOPMENT STRATEGIES THAT WILL BE USED IN THE
INNOVATION SQUARE DISTRICT
Page 16 of 106

Final Orange Creek Basin Management Action Plan Phase 2 – June 2014
FIGURE 6: SEWER AND STORMWATER SYSTEM UPGRADES FOR THE INNOVATION SQUARE DISTRICT
Page 17 of 106

Final Orange Creek Basin Management Action Plan Phase 2 – June 2014
Chapter 3: REGULATORY LINKS AND OVERALL MANAGEMENT STRATEGIES
This BMAP requires implementation of specific projects and activities by the BWG entities and
agricultural producers in the basin. This chapter describes the management strategies that apply to the
entire Orange Creek Basin and identifies the regulatory links that enforce the implementation of
management strategies. The management strategies specific to the individual TMDL waterbodies are
included in Chapter 4 through Chapter 9. Previously adopted management strategies that have been
modified are contained in Appendix C.
Management strategies are the activities or projects that stakeholders are implementing to reduce
pollutant loadings in TMDL waterbodies. An important result of the BMAP process in the Orange
Creek Basin has been the unprecedented level of local stakeholder participation and commitment. The
BMAP process enhanced communication and cooperation among basin stakeholders that will have
benefits beyond the BMAP. Together, stakeholders identified solutions to some of the basin’s complex
water pollution issues and are taking decisive steps toward realizing those solutions. Before the third
five-year BMAP iteration, management strategies will be refined and new projects developed to reduce
nutrient sources to the extent practical.
3.1 REGULATORY LINKS TO BMAP ENFORCEMENT
3.1.1 ENVIRONMENTAL RESOURCE PERMITTING Activities that exceed St. Johns River Water Management District (SJRWMD) permitting thresholds for
stormwater must be authorized by an ERP from the District (Rules 40C-4 through 40C-400, Florida
Administrative Code [F.A.C.]) that incorporates both stormwater treatment and the mitigation of any
wetland impacts. To obtain an ERP where existing ambient water quality does not meet state water
quality standards, an applicant must demonstrate that the proposed activity will result in a net
improvement in the parameters that do not meet standards. SJRWMD applies this criteria to waters that
are listed by the Department as impaired.
3.1.2 NPDES STORMWATER PROGRAM The NPDES stormwater program regulates several entities in the basin. The basic requirements of this
program serve as a foundation for the stormwater management efforts of the basin’s communities.
Phase I addresses large and medium MS4s located in incorporated places and counties with populations
Page 18 of 106

Final Orange Creek Basin Management Action Plan Phase 2 – June 2014
of 100,000 or more, as well as specific industrial activities. Phase II addresses additional sources,
including small MS4s. All of the MS4s in the Orange Creek Basin are Phase II.
Under a generic permit, operators of regulated Phase II MS4s must develop a Stormwater Management
Program that includes BMPs, with measurable goals, to effectively implement the following six
minimum control measures: public education and outreach, public participation/involvement, illicit
discharge detection and elimination, construction site runoff control, post-construction runoff control,
and pollution prevention/good housekeeping. Table 2 lists local governments and other entities in the
Orange Creek Basin that are currently designated as Phase II MS4s. The Phase II MS4 permits for
Alachua County and the City of Gainesville do not cover the Lake Wauberg, Lochloosa Lake, or Orange
Lake basins.
The generic permit (Subsection 62-621.300[7][a], F.A.C.) also states, “If a TMDL is approved for any
waterbody into which the Phase II MS4 discharges, and the TMDL includes requirements for control of
stormwater discharges, the operator must review its Stormwater Management Program for consistency
with the TMDL allocation. If the Phase II MS4 is not meeting its TMDL allocation, the operator must
modify its Stormwater Management Program to comply with the provisions of the TMDL
Implementation Plan applicable to the operator in accordance with the schedule in the Implementation
Plan.”
TABLE 2: ENTITIES IN THE ORANGE CREEK BASIN DESIGNATED AS REGULATED PHASE II MS4S PERMITTEE MS4 PERMIT NUMBER
City of Gainesville FLR04E006 Alachua County FLR04E005 Marion County FLR04E021
UF FLR04E067 FDOT FLR04E018
3.1.3 URBAN NONPOINT SOURCES Reductions in loads carried by stormwater that are separate from discharges by a permitted MS4 were
established in the “load allocation” component of the TMDL. Subparagraph 403.067(7)(b)2.f, F.S.,
prescribes the pollutant reduction actions required for nonagricultural pollutant sources that are not
subject to NPDES permitting. These nonpoint sources must also implement the pollutant reduction
requirements detailed in a BMAP. The Towns of McIntosh and Micanopy are the entities that may be
responsible for reducing nonpoint sources in the Orange Creek Basin.
Page 19 of 106

Final Orange Creek Basin Management Action Plan Phase 2 – June 2014
Failure by a nonpoint source to reduce loadings, as required in a BMAP, can result in enforcement
action by the Department under Paragraph 403.067(7)(b)2(h), F.S. The Department can designate an
entity as a regulated Phase II MS4 if its discharges are determined to be a significant contributor of
pollutants to surface waters of the state in accordance with Rule 62-624.800, F.A.C. The designation of
an entity as a Phase II MS4 can occur when a TMDL has been adopted for a waterbody or segment into
which the entity discharges the pollutant(s) of concern. If an entity is designated as a regulated Phase II
MS4, it is subject to the conditions of the Phase II MS4 Generic Permit.
3.2 LOCAL GOVERNMENT NATURAL RESOURCE PROTECTION The Orange Creek BMAP recognizes the local protections below as an important component of the
BMAP and encourages these local governments to further strengthen these "upstream" local watershed
protection frameworks.
3.2.1 ALACHUA COUNTY Alachua County requires review and approval of any development activities that occur within its
jurisdiction in the unincorporated portion of the basin. Specific protection standards are in place to
protect regulated natural resources, which include wetland and surface waters and associated buffers,
100-year floodplain, significant geological features, listed-species habitat, and all areas identified as
strategic ecosystems. Local policies and regulations for the protection of regulated natural resources in
unincorporated Alachua County are provided in the Conservation and Open Space Element of the
Alachua County Comprehensive Plan 2011-2030 and Chapter 406 of the Alachua County Unified Land
Development Code.
County regulations require that all efforts should be made to avoid adverse impacts to wetlands and
surface waters. The county evaluates development proposals on the determination of avoidance of
adverse impacts. Where the applicant demonstrates that all reasonable steps have been taken in the
attempt to avoid adverse impact, but impacts are unavoidable, activities are required to minimize impact
and mitigate if necessary. To allow significant impacts in wetlands, the application must meet Section
406.44 Unified Land Development Code. Buffer width shall be determined on a case-by-case basis
depending on what is demonstrated to be scientifically necessary to protect natural ecosystems from
significant adverse impact. This determination is made in consideration of development type and
potential for adverse impacts, natural community and hydrology, buffer characteristics and function, and
Page 20 of 106

Final Orange Creek Basin Management Action Plan Phase 2 – June 2014
presence of listed plant and animal species. Absent scientific information which demonstrates that a
larger or smaller buffer width is appropriate, buffer widths for the resources are set forth in table
406.43.1 Alachua County Unified Land Development Code.
Supporting Alachua County Comprehensive Plan Objectives and Policies are available at http://growth-
management.alachuacounty.us/comprehensive_planning/documents/2011_2030_Comprehensive_Plan.p
df.
3.2.2 CITY OF HAWTHORNE The City of Hawthorne has land development regulations that protect wetlands and surface waters
within the city boundaries. Hawthorne Zoning Regulations (Section 4.3.7) requires a minimum 35-foot
natural buffer from wetlands, perennial rivers, streams, creeks, lakes and ponds. Any structures (except
permitted docks, walkways, and piers) are prohibited within these buffer areas, although non-intensive
resource-based recreation activities are permitted within the riverine buffer areas. In addition, within the
riverine and wetland buffer area, agriculture and silviculture uses conducted in accordance with BMPs
may be allowed. Other protection standards and policies may apply. Supporting Hawthorne
Comprehensive Plan Policies are available at
http://www.cityofhawthorne.net/pages/hawthornefl_planning/compplan/CompPlan.pdf.
3.2.3 CITY OF GAINESVILLE Surface waters and wetlands within the City of Gainesville are protected under Section 30-302
Gainesville Code of Ordinances. Pursuant to Section 30-302(b), no development is allowed in, on or
over a surface water or wetland, or within 75 feet of the landward extent of a regulated lake, or within 35
feet of wetlands and the break in slope at the top of the bank of any regulated creek as referred to in
Section 30-301 of the Gainesville code. The average minimum distance of 50 feet shall be maintained
under all circumstances unless it is established, prior to permitting, by competent, substantial evidence
that a distance greater than 50 feet is required for the protection of wetland functions, as required by
code. Buffers are to remain in an undisturbed condition except for drainage features that will not
adversely affect wetland functions and public infrastructure exempted by Section 30-304. Within
required wetland or surface water buffers, there is no placement of impervious surfaces or sod, except as
otherwise allowed pursuant to the code. Native vegetation shall be retained and/or installed in order to
protect wetland and surface water environmental features. Other protection policies and standards may
Page 21 of 106

Final Orange Creek Basin Management Action Plan Phase 2 – June 2014
apply. Supporting Gainesville Comprehensive Plan Policies are available at
http://www.cityofgainesville.org/PlanningDepartment/ComprehensivePlanning/PlanElements.aspx.
3.2.4 MARION COUNTY Marion County passed a springs protection ordinance.
3.3 OVERVIEW OF MANAGEMENT STRATEGIES The second phase of the BMAP contains 57 new strategies to address elevated coliform levels and
nutrient levels in specific basin creeks and lakes, respectively. Many of these projects are part of
existing programs, but were expanded in scope to address the TMDLs, or projects were undertaken by
local stakeholders for the sole purpose of supporting TMDL development and implementation. The
following summaries of management strategies represent the goals of the second BMAP cycle:
1. Alachua County, the FDOH in Alachua County, GRU, the Department, City of
Gainesville, and FDOT District 2 in response to the adoption of fecal coliforms TMDLs
in urban creeks, initiated a project during the first BMAP cycle to identify and remediate
sources of fecal coliform bacteria in urban creeks “hot spots” (areas with consistently
high fecal counts). The selection of these hot spots was based on fecal coliform
monitoring and initial MST activities in the basin. The project has culminated in a series
of management actions or protocols to be taken when high levels of fecal coliforms are
found in urban streams (details are in Chapter 4 and Appendix B). The protocols have
identified and eliminated many sources achieving significant localized reductions in fecal
coliforms levels and improved communication and coordination among the agencies
responsible for wastewater and stormwater management. They will continue to be
utilized to investigate new sources of fecal contamination as well as refined and
strengthened during the second BMAP cycle with the expectation of continued
remediation of problems. These protocols will be adopted with this BMAP.
2. The Sweetwater Branch/Paynes Prairie Sheetflow Restoration Project is a cooperative
effort of local governments, City of Gainesville Public Works, GRU, the Department,
FDOT, St. Johns River Water Management District (SJRWMD), and others to address
the stormwater and wastewater loading components of the Alachua Sink TMDL. The TN
Page 22 of 106

Final Orange Creek Basin Management Action Plan Phase 2 – June 2014
load reductions required of wastewater and stormwater point sources identified in the
Alachua Sink TMDL will be met when this project is completed.
Its purpose is to rehydrate wetlands by the return of sheetflow to Paynes Prairie and,
through the creation of a wetland treatment system, remove nutrients from water in
Sweetwater Branch, before discharge into Alachua Sink. It is adopted with this update of
the BMAP and its implementation supported by the BWG. Construction of the project
was officially started in May 2013.
3. Implementing actions that address the TMDLs established for lakes Newnan, Orange,
and Wauberg is a priority of this second five year BMAP cycle. A goal of this updated
BMAP is to identify, during the 18-24 months following its adoption, actionable
management strategies that will improve water quality. The first five-year BMAP
iteration focused on studies and data collection needed to support the development of
management strategies for the lakes. In 2010, SJRWMD completed pollutant load
reduction goals (PLRGs) for nutrients in Newnans Lake and in 2011, completed a
Surface Water Management Plan (SWIM) for the basin. The PLRGs and SWIM Plan
identified major sources of nutrient pollutants and suggested actions that may aid in the
selection of future management strategies to reduce nutrient loads. In 2011, the
Department collaborated with the SJRWMD and Alachua County Environmental
Protection Department (ACEPD) to conduct a survey of depth to the Hawthorn
Formation in the Newnans Lake watershed. In many parts of the watershed, the
Hawthorn Formation is at or near the land surface and can be a contributor of
phosphate to surface waters. The Department conducted an investigation of ground
water-surface water interactions in the Lochloosa Lake and Orange Lake watersheds
(report completed 2008) in an effort to estimate the role of ground water as a nutrient
input to Lochloosa Lake. The second five-year iteration will build on those efforts and
translate them into management actions. Even with this additional focus, achieving the
lake TMDLs will be a long-term process as indicated by the water quality data presented
in the previous section.
4. Aquatic plant management and habitat restoration are important elements of Florida
Fish and Wildlife Conservation Commission’s (FWC) lake management in this basin. A
Page 23 of 106

Final Orange Creek Basin Management Action Plan Phase 2 – June 2014
management strategy for this second BMAP cycle is to develop closer communication
and coordination between the Department and FWC and other BWG members in the
development of water quality and habitat restoration plans.
5. BMPs for all the agricultural commodities in the basin have now been developed by the
Florida Department of Agriculture and Consumer Services (FDACS). Agricultural
producers are required to implement BMPs developed for their commodity upon their
adoption by FDACS as rules and as a requirement of this BMAP. Implementation of
agricultural BMPs and achievement of nutrient loading reductions are most important in
the Newnans, Lochloosa, and Orange lake watersheds.
Strategies that apply to the entire Orange Creek Basin are summarized in Table 3. Many of the
strategies used to control bacteria provide additional benefit by also removing or reducing nutrient
loadings. Strategies for the individual waterbodies are included in Chapter 4 through Chapter 9.
Appendix C lists projects adopted with the first BMAP cycle that have been modified since adoption.
Where available, the various project tables provide information on the assigned nutrient reductions for
projects benefiting the watershed. The BMAP projects and activities represent a considerable local,
regional, and state investment in a multifaceted approach to water quality protection and restoration.
Responsible entities submitted these management strategies to the Department with the understanding
that these strategies would be included in the BMAP, thereby requiring each entity to timely implement
the proposed strategies, perform any required operation or maintenance, and achieve the assigned load
reduction estimates. However, this list of projects and activities is meant to be flexible enough to allow
for changes that may occur over time. Any change in listed projects and activities, or the deadline to
complete these actions, must first be approved by the Department. Substituted strategies must result in
equivalent or greater nutrient reductions than expected or equivalent benefit from the original strategies.
Page 24 of 106

Final Orange Creek Basin Management Action Plan Phase 2 – June 2014
TABLE 3: MANAGEMENT STRATEGIES TO REDUCE FECAL COLIFORM AND NUTRIENT LOADING IN THE ORANGE CREEK BASIN
PROJECT NUMBER - PROJECT NAME / WHICH TYPE OF TMDL IS ADDRESSED?
WATERBODY NAME / WATERBODY
IDENTIFICATION (WBID) NUMBER
LEAD ENTITY / PROJECT PARTNERS
COST / SOURCE OF FUNDING / COMPLETION
OR EXPECTED COMPLETION DATE
GENERAL LOCATION / PROJECT DESCRIPTION
ALCODE02 - Fertilizer and Landscape Irrigation Codes/ Addresses Nutrient TMDL
Orange Creek Basin / Hydrologic unit code (HUC) 03080102
ACEPD / Alachua County General Fund
Unavailable/ Ongoing Alachua County/ Adopt and enforce Fertilizer Management and Landscape Irrigation Ordinances. Reduce volume of runoff from over irrigation and reduce nutrient loading from the use of fertilizers. Implements Alachua County Comp Plan Conservation and Open Space Element - Surface Water Systems Objective 4.6.
ALACHUA04 - Pet Waste Outreach/ Addresses Bacteria and Nutrient TMDL
Orange Creek Basin / HUC 03080102
ACEPD / Alachua County, City of Gainesville, FDOT, District 2 (Gainesville Clean Water Partnership)
$40,655/Alachua County, City of Gainesville, FDOT, District 2 (Gainesville Clean Water Partnership) cost share/ Ongoing
Alachua County/ Implement social marketing campaign to motivate citizens to scoop, bag, and trash dog wastes at home and in the community. / Reduces bacteria and nutrient sources in all watersheds. Implements Alachua County Comp Plan Conservation and Open Space Element - Surface Water Systems Objective 4.6.
ALACHUA05 - Stormwater Basin Monitoring/ Addresses Bacteria and Nutrient TMDL
Orange Creek Basin / HUC 03080102
ACEPD $6,000/Alachua County General Fund/ Complete
Alachua County/ Monitor water quality in various stormwater basins to understand if they are sinks or sources of nutrients and bacteria. / Provide data for determining how stormwater basins affect water quality. Implements Alachua County Comp Plan Conservation and Open Space Element - Surface Water Systems Objective 4.6
ALACHUA06 - Landscaping Debris Social Marketing / Addresses Bacteria and Nutrient TMDL
Orange Creek Basin / HUC 03080102
ACEPD / Alachua County, City of Gainesville, FDOT, District 2 (Gainesville Clean Water Partnership)
$50,000/ Alachua County, City of Gainesville, FDOT, District 2 (Gainesville Clean Water Partnership) cost share / Ongoing
Alachua County/ Implement social marketing campaign designed to get citizens to keep landscaping debris out of the roads and stormwater collection systems. / Reduces bacteria and nutrient sources in all watersheds. Implements Alachua County Comp Plan Conservation and Open Space Element - Surface Water Systems Objective 4.6.
ALACHUA07 - Water Conservation and LID/ Addresses Bacteria and Nutrient TMDL
Orange Creek Basin / HUC 03080102
ACEPD / Alachua County, City of Gainesville, FDOT, District 2 (Gainesville Clean Water Partnership)
Unavailable/Alachua County, City of Gainesville, FDOT, District 2 (Gainesville Clean Water Partnership) cost share / Ongoing
Alachua County/ Conduct targeted public outreach to encourage water conservation and rain harvesting. Includes rain barrel sales and LID promotion. / By harvesting rainwater and keeping stormwater on site, stormwater and the pollutants it transports is decreased.
ALACHUA08 – Water Quality Protection and Public Education and Outreach/ Addresses Nutrient TMDL
Orange Creek Basin/ HUC 03080102
ACEPD/ Alachua County, City of Gainesville, FDOT District 2 (Gainesville Clean Water Partnership)
$10,000 annually/ Alachua County, City of Gainesville, FDOT, District 2 (Gainesville Clean Water Partnership) cost share / Ongoing through 2017
Gainesville urban area and Alachua County/ Public education to promote stormwater nutrient (nitrogen and phosphorus) reduction to protect groundwater and surface water resources/ Reduce pollutant concentrations in stormwater runoff; public education effort to demonstrate the importance of preventing non-point source pollution; implement Alachua County Comp Plan Conservation and Open Space Element - Education and Outreach Objective 2.2; Surface Water Systems Objective 4.6; Alachua County Unified Land Development Code - Article 9 Stormwater Management.
Page 25 of 106

Final Orange Creek Basin Management Action Plan Phase 2 – June 2014
PROJECT NUMBER - PROJECT NAME / WHICH TYPE OF TMDL IS ADDRESSED?
WATERBODY NAME / WATERBODY
IDENTIFICATION (WBID) NUMBER
LEAD ENTITY / PROJECT PARTNERS
COST / SOURCE OF FUNDING / COMPLETION
OR EXPECTED COMPLETION DATE
GENERAL LOCATION / PROJECT DESCRIPTION
ALACHUA09 - Landscaping Behavior Change Social Marketing/ Addresses Nutrient TMDL
Orange Creek Basin/ HUC 03080102
ACEPD/ Alachua County, City of Gainesville, FDOT District 2 (Gainesville Clean Water Partnership)
$25,000/ Alachua County, City of Gainesville, FDOT, District 2 (Gainesville Clean Water Partnership) cost share / Ongoing through 2017
Gainesville urban area and Alachua County/ Implement social marketing campaign designed to get citizens to make landscaping behavior changes that reduce nutrients in stormwater/ Reduces nutrients sources in all watersheds. Implements Alachua County Comp Plan Conservation and Open Space Element - Surface Water Systems Objective 4.6. Behavior changes to reduce nutrient inputs to stormwater; implement Alachua County Comp Plan Conservation and Open Space Element - Education and Outreach Objective 2.2; Surface Water Systems Objective 4.6; Alachua County Unified Land Development Code, Chapter 407 Article 4 Landscaping - 406.43 Water Resources Buffers; Article 9 Stormwater Management.
ALACHUA10 – Neighborhood Stormwater Fertilizer Study/ Addresses Nutrient TMDL
Orange Creek Basin / HUC 03080102
ACEPD/ Alachua County, City of Gainesville, FDOT District 2 (Gainesville Clean Water Partnership)
$24,600/ Alachua County, City of Gainesville, FDOT District 2 (Gainesville Clean Water Partnership) cost share/ Ongoing, completion in December 2014
Gainesville urban area/ Monitor and assess stormwater water quality in selected neighborhoods and evaluate impacts to water quality in the Gainesville urban creeks/ Provide data for determining how fertilization practices in residential neighborhoods affect water quality. Implements Alachua County Comp Plan Conservation and Open Space Element - Surface Water Systems Objective 4.6 and policies.
ALACHUA11 – Stormwater Pond Outfall Study and Phosphorus Sediment Evaluation/ Addresses Nutrient TMDL
Orange Creek Basin / HUC 03080102
ACEPD/ Alachua County, City of Gainesville, FDOT District 2 (Gainesville Clean Water Partnership)
$30,800/ Alachua County, City of Gainesville, FDOT District 2 (Gainesville Clean Water Partnership) cost share/ Ongoing with completion in September 2015
Gainesville urban area/ Monitor and assess water quality in various stormwater basins and evaluate stormwater basin and stream sediments to understand if they are sinks or sources of phosphorus/ Provide data for determining how stormwater basins (water and sediments) and stream sediment phosphorus affect water quality. Implements Alachua County Comp Plan Conservation and Open Space Element - Surface Water Systems Objective 4.6 and policies.
ALACHUA12 – Quantifying Nutrient Improvement in Street Sweepings/ Addresses Nutrient TMDL
Orange Creek Basin / HUC 03080102
ACEPD/ Alachua County, City of Gainesville, FDOT District 2 (Gainesville Clean Water Partnership)
$38,940/ Alachua County, City of Gainesville, FDOT District 2 (Gainesville Clean Water Partnership) cost share/ Start in October 2015, completion in September 2016
Gainesville urban area and Alachua County/ Monitor and assess street sweepings to quantify nutrient reductions and subsequent potential water quality improvements/ Provide data to quantify nutrients in street sweepings and assess the potential for water quality improvement. Implements Alachua County Comp Plan Conservation and Open Space Element - Surface Water Systems Objective 4.6 and policies.
ALACHUA13 – Surface Water Nutrient Loading Assessment/ Addresses Nutrient TMDL
Orange Creek Basin / HUC 03080102
ACEPD/ Alachua County, City of Gainesville, FDOT District 2 (Gainesville Clean Water Partnership)
$48,800/ Alachua County, City of Gainesville, FDOT District 2 (Gainesville Clean Water Partnership) cost share/ Start in October 2016, completion in September 2017
Gainesville urban area/ Evaluate nutrient loading and determine the status of the urban streams and their receiving waters as it relates to nutrient impairment/ Provide data to assess nutrient impairment of the urban streams and their receiving waters. Implements Alachua County Comp Plan Conservation and Open Space Element - Surface Water Systems Objective 4.6 and policies.
Page 26 of 106
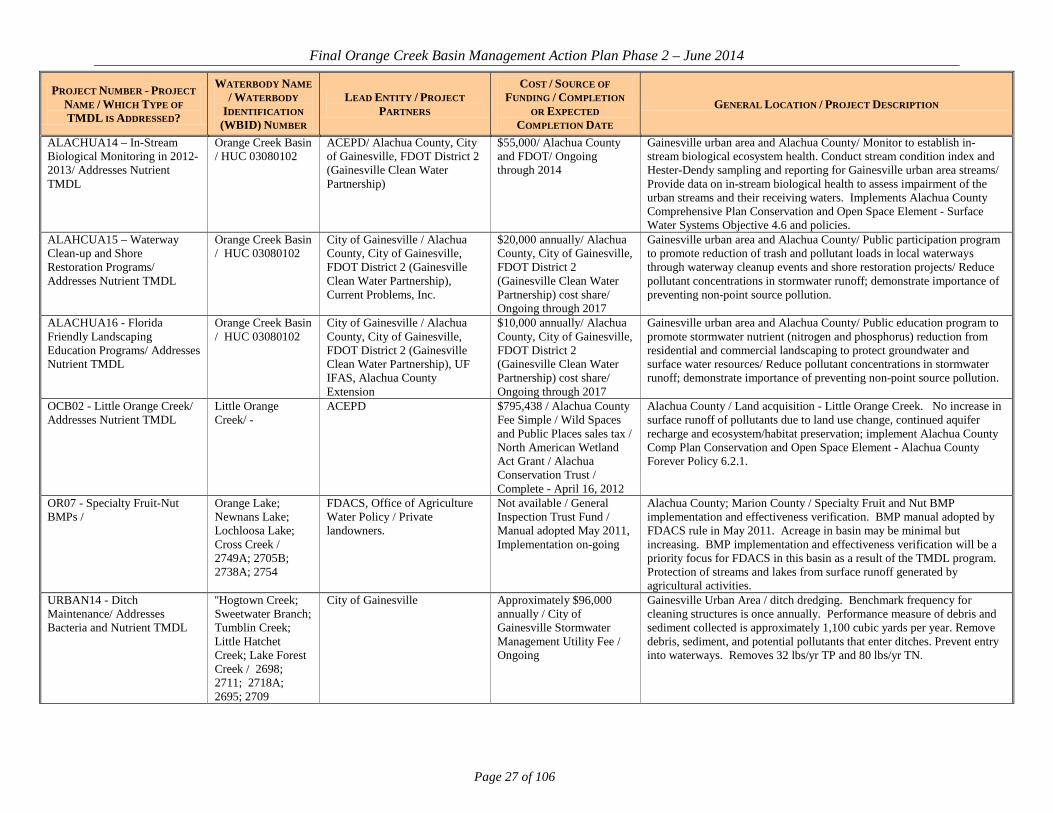
Final Orange Creek Basin Management Action Plan Phase 2 – June 2014
PROJECT NUMBER - PROJECT NAME / WHICH TYPE OF TMDL IS ADDRESSED?
WATERBODY NAME / WATERBODY
IDENTIFICATION (WBID) NUMBER
LEAD ENTITY / PROJECT PARTNERS
COST / SOURCE OF FUNDING / COMPLETION
OR EXPECTED COMPLETION DATE
GENERAL LOCATION / PROJECT DESCRIPTION
ALACHUA14 – In-Stream Biological Monitoring in 2012-2013/ Addresses Nutrient TMDL
Orange Creek Basin / HUC 03080102
ACEPD/ Alachua County, City of Gainesville, FDOT District 2 (Gainesville Clean Water Partnership)
$55,000/ Alachua County and FDOT/ Ongoing through 2014
Gainesville urban area and Alachua County/ Monitor to establish in-stream biological ecosystem health. Conduct stream condition index and Hester-Dendy sampling and reporting for Gainesville urban area streams/ Provide data on in-stream biological health to assess impairment of the urban streams and their receiving waters. Implements Alachua County Comprehensive Plan Conservation and Open Space Element - Surface Water Systems Objective 4.6 and policies.
ALAHCUA15 – Waterway Clean-up and Shore Restoration Programs/ Addresses Nutrient TMDL
Orange Creek Basin / HUC 03080102
City of Gainesville / Alachua County, City of Gainesville, FDOT District 2 (Gainesville Clean Water Partnership), Current Problems, Inc.
$20,000 annually/ Alachua County, City of Gainesville, FDOT District 2 (Gainesville Clean Water Partnership) cost share/ Ongoing through 2017
Gainesville urban area and Alachua County/ Public participation program to promote reduction of trash and pollutant loads in local waterways through waterway cleanup events and shore restoration projects/ Reduce pollutant concentrations in stormwater runoff; demonstrate importance of preventing non-point source pollution.
ALACHUA16 - Florida Friendly Landscaping Education Programs/ Addresses Nutrient TMDL
Orange Creek Basin / HUC 03080102
City of Gainesville / Alachua County, City of Gainesville, FDOT District 2 (Gainesville Clean Water Partnership), UF IFAS, Alachua County Extension
$10,000 annually/ Alachua County, City of Gainesville, FDOT District 2 (Gainesville Clean Water Partnership) cost share/ Ongoing through 2017
Gainesville urban area and Alachua County/ Public education program to promote stormwater nutrient (nitrogen and phosphorus) reduction from residential and commercial landscaping to protect groundwater and surface water resources/ Reduce pollutant concentrations in stormwater runoff; demonstrate importance of preventing non-point source pollution.
OCB02 - Little Orange Creek/ Addresses Nutrient TMDL
Little Orange Creek/ -
ACEPD $795,438 / Alachua County Fee Simple / Wild Spaces and Public Places sales tax / North American Wetland Act Grant / Alachua Conservation Trust / Complete - April 16, 2012
Alachua County / Land acquisition - Little Orange Creek. No increase in surface runoff of pollutants due to land use change, continued aquifer recharge and ecosystem/habitat preservation; implement Alachua County Comp Plan Conservation and Open Space Element - Alachua County Forever Policy 6.2.1.
OR07 - Specialty Fruit-Nut BMPs /
Orange Lake; Newnans Lake; Lochloosa Lake; Cross Creek / 2749A; 2705B; 2738A; 2754
FDACS, Office of Agriculture Water Policy / Private landowners.
Not available / General Inspection Trust Fund / Manual adopted May 2011, Implementation on-going
Alachua County; Marion County / Specialty Fruit and Nut BMP implementation and effectiveness verification. BMP manual adopted by FDACS rule in May 2011. Acreage in basin may be minimal but increasing. BMP implementation and effectiveness verification will be a priority focus for FDACS in this basin as a result of the TMDL program. Protection of streams and lakes from surface runoff generated by agricultural activities.
URBAN14 - Ditch Maintenance/ Addresses Bacteria and Nutrient TMDL
''Hogtown Creek; Sweetwater Branch; Tumblin Creek; Little Hatchet Creek; Lake Forest Creek / 2698; 2711; 2718A; 2695; 2709
City of Gainesville Approximately $96,000 annually / City of Gainesville Stormwater Management Utility Fee / Ongoing
Gainesville Urban Area / ditch dredging. Benchmark frequency for cleaning structures is once annually. Performance measure of debris and sediment collected is approximately 1,100 cubic yards per year. Remove debris, sediment, and potential pollutants that enter ditches. Prevent entry into waterways. Removes 32 lbs/yr TP and 80 lbs/yr TN.
Page 27 of 106

Final Orange Creek Basin Management Action Plan Phase 2 – June 2014
PROJECT NUMBER - PROJECT NAME / WHICH TYPE OF TMDL IS ADDRESSED?
WATERBODY NAME / WATERBODY
IDENTIFICATION (WBID) NUMBER
LEAD ENTITY / PROJECT PARTNERS
COST / SOURCE OF FUNDING / COMPLETION
OR EXPECTED COMPLETION DATE
GENERAL LOCATION / PROJECT DESCRIPTION
URBAN15 - Storm Drain Cleaning/ Addresses Bacteria and Nutrient TMDL
'Hogtown Creek; Sweetwater Branch; Tumblin Creek; Little Hatchet Creek; Lake Forest Creek / 2698; 2711; 2718A; 2695; 2709
City of Gainesville Approximately $27,000 annually / City of Gainesville Stormwater Management Utility Fee / Ongoing
Gainesville Urban Area / stormdrain cleaning, major collector roads, and residential areas. Benchmark frequency for cleaning structures is once annually. Performance measure of debris and sediment collected is approximately 180 cubic yards per year. Remove debris, sediment, and potential pollutants that enter storm drains. Prevent entry into waterways. Removes 147 lbs/yr TP and 239 lbs/yr TN.
URBAN16 - Stormwater Pond Maintenance/ Addresses Bacteria and Nutrient TMDL
''Hogtown Creek; Sweetwater Branch; Tumblin Creek; Little Hatchet Creek; Lake Forest Creek / 2698; 2711; 2718A; 2695; 2709
City of Gainesville Approximately $46,000 annually / City of Gainesville Stormwater Management Utility Fee / Ongoing
Gainesville Urban Area / stormwater pond dredging. Benchmark frequency for cleaning structures is once annually. Performance measure of debris and sediment collected is approximately 180 cubic yards per year. Remove debris, sediment, and potential pollutants that enter stormwater ponds. Prevent entry into waterways. Removes 14 lbs/yr TP and 35 lbs/yr TN.
Page 28 of 106

Final Orange Creek Basin Management Action Plan Phase 2 – June 2014
3.4 FWC ACTIVITIES Aquatic plant management in Florida is delegated to the FWC and is carried out by the Invasive Plant
Management section of the Habitat and Species Conservation Division. The Invasive Plant
Management section's aquatic plant management program designs, funds, coordinates, and contracts
invasive non-native aquatic plant control efforts in Florida's 1.25 million acres of public waters under
Chapter 68F, F.A.C. Public waterbodies are sovereignty waters accessible by public boat ramps.
Invasive non-native aquatic plants, mostly hydrilla, water hyacinth, and water lettuce, are managed in
several hundred waterbodies each year. Lakes in the Orange Creek Basin that are actively managed by
the Invasive Plant Management section are Newnans Lake, Orange Lake, and Lochloosa Lake. FWC
biologists work with personnel from other agencies, as well as interested private-sector stakeholders, to
develop annual aquatic plant work plans. Major uses and functions of each public waterbody are
identified along with any listed species that may be affected by invasive plants or aquatic plant
management activities. Basic management objectives are defined and plant control methods are selected
that will conserve or enhance identified waterbody uses and functions. Sites are monitored at least once
each year to assess management effectiveness and to determine if any adverse impacts resulted from
management activities. The section also oversees the permitting program for aquatic plant control and
grass carp by homeowners, homeowner associations, golf courses, etc. A more detailed description of
the section’s responsibilities may be found here: http://myfwc.com/wildlifehabitats/invasive-
plants/aquatic-plant/.
FWC may also manage aquatic plants for the purpose of enhancing habitats for fish and wildlife as part
of the agency’s mission. Projects that enhance fish and wildlife habitats within the Orange Creek Basin
aquatic resources are conducted primarily by FWC’s Aquatic Habitat Restoration and Enhancement
Sub-section, but in coordination with other FWC staff through teams to ensure a multi-disciplinary
approach to habitat management. Partnering and coordinating with other governmental entities as well
as non-governmental stakeholders is part of the process. Information about the Aquatic Habitat
Restoration and Enhancement Sub-section subsection is available at this link:
http://myfwc.com/conservation/freshwater/ahre/. Lakes within the Orange Creek Basin are also part of
an identified focal area where wetlands contained within that focal area are categorized as extremely
important to migratory birds (http://myfwc.com/conservation/freshwater/wetland-habitat/). Orange,
Lochloosa and Newnans Lakes are designated as Fish Management Areas, and through that designation
Page 29 of 106

Final Orange Creek Basin Management Action Plan Phase 2 – June 2014
can receive additional attention from FWC, specifically to manage sport fish and sport fish habitat as
well as to improve access for fishermen. For example, plans are under way to improve boating access at
Heagy Burry Park on Orange Lake and this project would be partially funded by FWC’s Sport Fish
Restoration Program (http://myfwc.com/fishing/sfr/).
From 2008 through 2013, Aquatic Habitat Restoration and Enhancement Sub-section conducted a
number of smaller habitat enhancement projects focused on the large lakes within the Orange Creek
Basin. The details of these projects are in the sections on Newnans, Orange, and Lochloosa Lakes.
3.5 AGRICULTURAL BMP IMPLEMENTATION All agricultural non-point sources in the Orange Creek BMAP area are statutorily required either to
implement FDACS adopted BMPs or to conduct water quality monitoring prescribed by the Department
or SJRWMD that demonstrates compliance with water quality standards (Paragraph 403.067(7)(b),
F.S.). If these pollutant sources do not either implement BMPs or conduct monitoring that demonstrates
compliance with water quality standards, they may be subject to enforcement by the Department or
SJRWMD. Under Paragraph 403.067(7)(c), F.S., the implementation of FDACS-adopted, Department-
verified BMPs in accordance with FDACS rule provides a presumption of compliance with state water
quality standards.
A summary of agricultural land categories in the Orange Creek Basin, not including silviculture (refer to
Section 3.5.4), according to 2009 SJRWMD land use data, is provided in Table 4. Prominent
agriculture land uses are improved pasture, equine operations, and field crops. Figure 7 shows the
location of these agricultural lands in the basin.
TABLE 4: AGRICULTURAL LAND USES IN THE ORANGE CREEK BASIN - = Empty cell/no data
LAND USE CODE CODE DESCRIPTION TOTAL ACRES PERCENT OF TOTAL ACRES 2110 Improved Pasture 25,544.9 43.7% 2120 Unimproved Pasture 1,520.3 2.6% 2130 Woodland Pasture 6,058.9 10.4% 3100 Herbaceous Upland Nonforested 1,453.9 2.5% 3200 Shrub and Brushland 1,020.0 1.7% 3300 Mixed Upland Nonforested 2,747.4 4.7% 2140 Row Crop 736.3 1.3% 2150 Field Crops 9,405.7 16.1% 2160 Mixed Crops 663.2 1.1% 2200 Tree Crops 1,104.5 1.9% 2210 Citrus 131.8 0.2% 2240 Abandoned Trees 15.1 0.0%
Page 30 of 106

Final Orange Creek Basin Management Action Plan Phase 2 – June 2014
LAND USE CODE CODE DESCRIPTION TOTAL ACRES PERCENT OF TOTAL ACRES 2310 Cattle Feeding Operation 53.2 0.1% 2320 Poultry Feeding Operation 12.0 0.0% 2400 Nurseries 18.8 0.0% 2410 Tree Nurseries 153.6 0.3% 2430 Ornamentals 134.2 0.2% 2500 Specialty Farms 12.7 0.0% 2510 Horse Farm 7,496.9 12.8% 2520 Dairies 71.2 0.1% 2600 Other Open Lands – Rural 48.0 0.1% 2610 Fallow Cropland 108.4 0.2%
- TOTAL 58,511.0 100.0%
Page 31 of 106

Final Orange Creek Basin Management Action Plan Phase 2 – June 2014
FIGURE 7: OAWP 2009 AGRICULTURAL LANDS IN THE ORANGE CREEK BASIN
Page 32 of 106

Final Orange Creek Basin Management Action Plan Phase 2 – June 2014
3.5.1 AGRICULTURAL BMPS BMPs are individual or combined practices determined through research, field testing, and expert review
to be the most effective and practicable means for improving water quality, taking into account
economic and technological considerations. Primary regulatory authority for establishing agricultural
BMPs is divided between FDACS’ Florida Forest Service (silviculture BMP program), Division of
Aquaculture (Aquaculture Certification Program), and the Office of Agricultural Water Policy (OAWP)
(all other agricultural BMP programs).
FDACS’s OAWP BMPs fall into two categories: structural and management. Structural BMPs involve
the installation of structures or changes to the land, usually are more costly, and often require cost-share
for them to be economically feasible. They include water control structures, fencing, and tailwater
recovery systems, among other things. Management BMPs, such as nutrient and irrigation management,
comprise the majority of the practices and often are not readily observable. Nutrient management
addresses fertilizer type, amount, placement, and application timing, and includes practices such as soil
and tissue testing to determine crop nutrient needs, application methods, and setbacks from water
resources. Irrigation management is the maintenance, scheduling, and overall efficiency rating of
irrigation systems.
OAWP BMPs and staff contact information are available at http://www.floridaagwaterpolicy.com.
Printed BMP manuals can be obtained in the local extension office at county agricultural extension
centers, or by contacting OAWP field staff.
3.5.2 BMP ENROLLMENT
The land use data figures for agriculture in the BMAP area, the acreage associated with commodity
types addressed by OAWP BMP manuals, and the acres enrolled in OAWP BMP programs are
summarized in Table 5. Based on aerial imagery and local staff observations, FDACS adjusted the
2009 land use figures to reflect more accurately the current agricultural land use acreage. Over the next
two years, OAWP will review aerial imagery and use other means to determine changes in agricultural
land use in this basin.
All agricultural non-point sources in the BMAP area are statutorily required either to implement FDACS-adopted BMPs or to conduct water quality monitoring that demonstrates compliance with state water quality standards. Current enrollment in
Page 33 of 106

Final Orange Creek Basin Management Action Plan Phase 2 – June 2014
OAWP BMPs as of September 30, 2013, is about 4,500 acres (see Figure 8
Page 34 of 106

Final Orange Creek Basin Management Action Plan Phase 2 – June 2014
Figure 8). Applicable agricultural operations for BMP enrollment include pasture, row/field/mixed
crops, and equine operations, which together comprise about 54,554 acres, according to the 2009 land
use data.
Not all of the acreage listed as agriculture in Table 5 will be included in enrollment figures, because the
NOIs only document the estimated total number of acres on which applicable BMPs are implemented,
not the entire land use acreage mapped as agriculture. Land use data can contain nonproduction acres
(such as buildings, parking lots, and fallow acres) that will not be counted on the NOIs submitted to
OAWP. There also may be acreage that is not appropriate for enrollment in OAWP BMPs, such as
lands not in commercial production (defined as operations conducted as a business).
3.5.2.1 Agricultural BMP Load Reduction Estimates The estimates of TN and total phosphorus (TP) load reductions due to the implementation of BMPs are
not currently documented for the basin. Estimating the nutrient load reductions expected from the
implementation of BMPs is one of the tasks to be completed in the next five years. Accomplishing this
task will require reconciling discrepancies in the land use data used in the water quality modeling with
the FDACS information about the location of acreage covered by NOIs. With a more accurate
accounting of the location of agriculture, commodity-specific methods developed for the Lake
Okeechobee watershed can be applied to estimate nutrient loading reductions.
Page 35 of 106

Final Orange Creek Basin Management Action Plan Phase 2 – June 2014
TABLE 5: AGRICULTURAL ACREAGE AND BMP ENROLLMENT FOR THE ORANGE CREEK BASIN N/A = Not applicable 1 FDACS staff-adjusted acreage for purposes of enrollment is based on a review of more recent aerial imagery in the basin and local staff observations.
2009 SJRWMD LAND USE ACRES
FDACS ADJUSTED
ACRES1 RELATED FDACS BMP PROGRAMS ACREAGE ENROLLED RELATED NOIS
Pasture and Mixed Rangeland 38,345.4 36,654.3 Cow/Calf; Future (hay) 1,763.6 6
Row/Field/Mixed Crops 10,805.2 10,402.4 Vegetable/Agronomic Crops 1,675.9 5
Horse Farm 7,496.9 7,496.9 Equine 111.0 1
Citrus 131.8 131.8 Ridge Citrus; Flatwoods Citrus - -
Fruit Orchards/Other Groves 1,104.5 1,507.3 Specialty Fruit and Nut 915.5 6
Abandoned Tree Crops 15.1 0.0 No enrollment needed N/A N/A
Nurseries and Vineyards, Ornamentals 153.0 153.0 Container Nursery 60.0 1
Tree Nurseries 153.6 153.6 Future Nursery - -
Specialty Farms 12.7 12.7 Conservation Plan Rule - -
Dairies 71.2 71.2 Conservation Plan Rule/ Lake Okeechobee Protection Program3 - -
Cattle Feeding Operations 53.2 53.2 Conservation Plan Rule - -
Poultry Feeding Operations 12.0 12.0 Conservation Plan Rule - -
Other Open Lands – Rural 48.0 0.0 No enrollment needed N/A N/A
Fallow Cropland 108.4 0.0 No enrollment needed N/A N/A
Total 58,511.0 56,648.4 N/A 4,526.0 19
Page 36 of 106
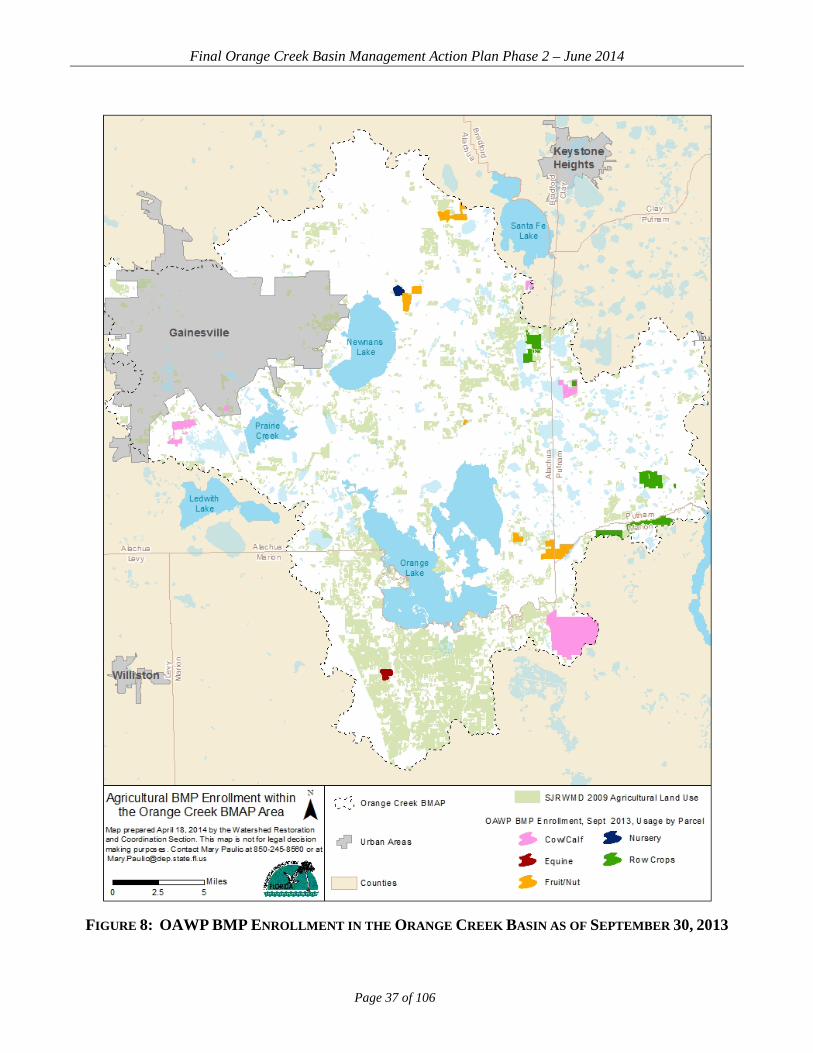
Final Orange Creek Basin Management Action Plan Phase 2 – June 2014
FIGURE 8: OAWP BMP ENROLLMENT IN THE ORANGE CREEK BASIN AS OF SEPTEMBER 30, 2013
Page 37 of 106

Final Orange Creek Basin Management Action Plan Phase 2 – June 2014
3.5.3 FDACS OAWP ROLE IN BMP IMPLEMENTATION AND FOLLOW-UP OAWP works with producers to submit notices of intent (NOIs) to implement the BMPs appropriate for
their operations. Because of the current, high non-compliance rate with BMP requirements, the OAWP
will increase their compliance efforts with producers in the Orange Creek Basin. OAWP staff and
contractors will identify existing growers, to the greatest extent possible, through grower associations,
information on county agricultural exemptions, field staff knowledge, and other means. OAWP will
attempt to ensure that all producers are aware of their statutory obligation to implement BMPs, through
letters, e-mail, workshops, brochures, and/or other means. Staff/contractors will assist producers in
selecting the appropriate BMPs, with emphasis on nutrient management, irrigation management,
sediment/erosion control, stormwater management, and record keeping.
The FWRA requires that, where water quality problems are demonstrated despite the proper
implementation of adopted agricultural BMPs, FDACS must re-evaluate the practices, in consultation
with the Department, and modify them if necessary. Continuing water quality problems will be detected
through the BMAP monitoring component and other Department and SJRWMD activities. If a re-
evaluation of the BMPs is needed, FDACS will also include SJRWMD and other partners in the process.
3.5.4 FLORIDA FOREST SERVICE ROLE IN BMP IMPLEMENTATION AND MONITORING FDACS’ Florida Forest Service’s silviculture BMP program is responsible for the development,
implementation, and monitoring of silviculture BMPs across the state. Silviculture BMPs are applicable
to all bonafide ongoing forestry operations. However, silviculture BMPs are not intended for use on tree
removal or land clearing operations that are associated with a planned land use change to a non-forestry
objective. The current 2008 Siliviculture BMP Manual contains 150 individual BMPs within 14
categories. Silviculture BMPs are both structural (forest roads, stream crossings, etc.) and management
(pesticide and fertilizer application, special management zones, etc.) based. The silviculture BMP NOI
program began on February 11, 2004. As of December 2013, there were 67,393 acres signed up under
the silviculture BMP NOI within the Orange Creek Basin.
Since 1981, the Florida Forest Service has monitored silviculture operations for compliance with BMPs
by conducting biennial surveys. Surveys are conducted on both public and private silviculture
operations with on-the-ground evaluations of randomly selected sites where recent silviculture
operations have taken place. The 2013 Silviculture BMP Implementation Survey Report is expected to
Page 38 of 106

Final Orange Creek Basin Management Action Plan Phase 2 – June 2014
be published sometime in early 2014. Data collected for this 2013 report for the three counties which
make up the Orange Creek BMAP area (Alachua, Marion, and Putnam) evaluated 17 silviculture
operations consisting of 339 individual BMPs. The overall silviculture BMP compliance for these three
counties in 2013 was 99.7%.
An important aspect of silviculture BMPs is that they have been proven effective. A multi-year study
conducted by the Florida Forest Service with assistance from the Department looked at the effectiveness
of silviculture BMPs in protecting aquatic ecosystems during silviculture operations including clear-cut
harvesting, intensive mechanical site preparation, machine planting, post-planting herbicide treatments,
and a forest fertilization treatment. Silviculture BMP effectiveness was evaluated using water chemistry
analysis, habitat assessment, and the stream condition index (a bioassessment methodology developed
for Florida stream ecosystems). The study concluded that silviculture BMPs were effective at protecting
aquatic habitat in nearby streams with no evidence of impacts or impairments to the designated
beneficial use of the streams (Vowell, 2001; Vowell and Frydenborg, 2004).
The Florida Forest Service is also assisting with two more research projects in cooperation with UF,
which are looking at the effectiveness of silviculture BMPs for forest fertilization. One study, which
was just completed in November 2013, looked at the effectiveness of forest fertilization BMPs for
protecting ground water from nutrient leaching. Study results showed that ground water concentrations
of ammonium, total Kjeldahl nitrogen, and TP observed for wells monitored in the fertilization treatment
area did not increase when compared to pre-fertilization baseline levels or distant control wells
(Minogue, et. al., 2013). There is also an ongoing study which looks at the effectiveness of forest
fertilization BMPs for protecting nearby surface waters. This study was initiated in 2012 and is expected
to be completed in 2017.
More information on silviculture BMPs and FDACS’ Florida Forest Service’s silviculture BMP program
is available from the “For Landowners” section of www.FloridaForestService.com.
Page 39 of 106

Final Orange Creek Basin Management Action Plan Phase 2 – June 2014
Chapter 4: HOGTOWN CREEK, TUMBLIN CREEK, AND SWEETWATER BRANCH
Hogtown Creek, Tumblin Creek, and Sweetwater Branch have TMDLs for fecal coliform bacteria. Due
to the similarities in fecal coliform bacteria sources and management strategies, these three urban creeks
are discussed as a group. Hogtown Creek discharges to the Floridan aquifer through Haile Sink.
Tumblin Creek and Sweetwater Branch discharge to Paynes Prairie and ultimately into the Floridan
aquifer through the Primary Sink Feature adjacent to Alachua Sink. GRU’s Main Street Water
Reclamation Facility (WRF) is the only permitted domestic wastewater discharge to Sweetwater Branch
and GRU’s J.R. Kelly Generating Station is the only permitted industrial wastewater facility.
4.1 WATER QUALITY AND POLLUTANT SOURCES Given the often non-uniform distribution and erratic behavior of fecal coliform bacteria in the
environment, the detailed quantification of load reductions, as would be calculated for nutrient loadings
from the watershed, is not currently possible. The goal of fecal coliform TMDLs is to achieve counts of
fecal coliform bacteria that do not exceed criteria specified in Chapter 62-302, F.A.C. for frequency and
magnitude of bacteria counts. An indicator of progress made in obtaining this goal is a reduction in the
frequency of exceedances and reduction in the number of counts. The noted improvements in water
quality do indicate that efforts to control fecal coliforms bacteria are providing beneficial results.
Details about how the water quality assessments were conducted is in the Orange Creek Basin Action
Plan Five Year Water Quality Review
(http://publicfiles.dep.state.fl.us/DEAR/BMAP/OrangeCreek/2014_BMAP/).
Elevated fecal coliform counts are periodically observed in all three urban creeks throughout the year
when compared to the state criterion of 800 counts/100 mL per day maximum. Median annual values
for the urban streams are displayed in Figure 9 for the period from 2001 to 2013. Improvements have
occurred as evidenced with a reduced exceedance rate for each stream during the post BMAP adoption
period (2007-2013) compared to the TMDL data period (Table 6). The average percent rate of
exceedance is lower than the values calculated when the TMDLs were developed for all three streams.
The exceedance rates for Hogtown and Tumblin Creeks have declined more than Sweetwater Branch.
The annual median number of fecal coliform counts stays largely below 1,000 counts/100 mL in
Sweetwater Branch, Hogtown Creek, and Tumblin Creek (Figure 9 and Table 6), with the exception of
Page 40 of 106

Final Orange Creek Basin Management Action Plan Phase 2 – June 2014
2011 and 2012. The 2011 and 2012 data include results of samples collected during summer months
following rainfall events; those sample results are likely higher due to stormwater influences. The
exceedance rate for Tumblin Creek for 2012 was much higher than the other streams. Fecal coliform
concentrations are typically elevated during and following storm events. ACEPD (2008) has
documented that dry season fecal coliform concentrations in Gainesville’s urban creeks were frequently
one or two orders of magnitude lower than concentrations observed during the summer wet season.
Tumblin Creek had higher annual medians for most years. A sampling station at Southwest (SW) 5th
Avenue, with historically higher fecal coliform sample results, was added after BMAP adoption.
Potential sources of fecal coliform bacteria detected in the streams may originate from many different
places, including failing septic systems, leaks and overflows from sanitary sewer systems, illicit
discharges of sanitary waste, runoff from the improper disposal of waste material, stormwater from
developed areas, domestic pet waste, homeless populations, and wildlife populations. The secondary
growth of fecal coliform bacteria in stormwater systems and creek sediments may also contribute to
persistent elevated fecal coliform levels. Current data show that wastewater discharged from the Main
Street WRF is not a significant source of fecal coliform bacteria.
FIGURE 9: MEDIAN FECAL COLIFORM COUNTS FOR URBAN GAINESVILLE CREEKS FOR THE YEARS
2001 TO 2013
Page 41 of 106

Final Orange Creek Basin Management Action Plan Phase 2 – June 2014
TABLE 6: COMPARISON OF FECAL COLIFORM DATA BETWEEN STREAMS FOR THE POST-BMAP ADOPTION PERIOD
STREAM NAME DATA PERIOD NUMBER
OF SAMPLES
MEDIAN (COUNTS/ 100 ML)
RANGE AVERAGE PERCENT
EXCEEDANCE
TMDL PERCENT
EXCEEDANCE Hogtown Creek 2007-May 2013 250 580 19-24,000 37% 89%
Sweetwater Branch 2007-May 2013 280 600 1-48,000 40% 48.4% Tumblin Creek 2007-May 2013 98 525 24-21,000 39% 75%
4.2 MANAGEMENT STRATEGIES New management strategies in this second iteration of the BMAP are listed in Table 7. Through these
efforts, the Department anticipates that fecal coliform loads in the urban creeks will continue to decrease
during the second BMAP iteration. However, the Department will continue to evaluate fecal coliform
levels in the streams to track progress. This adaptive management approach will be used for the
evaluation and selection of additional management strategies in future iterations of the BMAP.
Many of the strategies used to control bacteria provide additional benefit by also removing or reducing
nutrient loadings. This reduction in urban nutrient loading is important for Alachua Sink (via
Sweetwater Branch and Tumblin Creek) and Newnans Lake (via Hatchet and Little Hatchet Creeks).
Projects listed in Table 7 that provide this benefit have the notation “Addresses nutrient TMDL.”
Additional projects that address bacterial TMDLs in all three creeks are listed in Table 3.
In response to the adoption of TMDLs for these three creeks, significant resources were dedicated by
local governments and GRU for the identification of fecal bacteria sources and reduction of fecal
coliform levels in the urban creeks. Methodologies were developed that identify bacteria “hot spots” or
locations with continuing high levels of bacteria. The establishment of investigative protocols coupled
with source prevention and continued monitoring have led to improved management of fecal bacteria
contamination in urban creeks. This protocol is applicable to other streams where bacterial
contamination is detected.
The potential sources listed in the previous section can require different management actions to
eliminate or effectively manage them. It is important to distinguish to the extent possible whether a
source is controllable (largely anthropogenic) or uncontrollable, such as wildlife contributions.
Page 42 of 106

Final Orange Creek Basin Management Action Plan Phase 2 – June 2014
The strategies implemented in the urban creeks as part of the first BMAP iteration are briefly outlined as
they provided the foundation for fecal coliform management protocols developed by local stakeholders
that are being adopted as part of this BMAP (Appendix B). The continuation of these management
efforts is critical to the success of remediating sources of bacterial contamination through management
protocols.
GRU and the ACEPD undertook several MST and optical brightener studies in an effort to better define
the physical extent of the fecal coliform bacteria problem and identify potential sources. ACEPD also
analyzed other microbial indicators (Escherichia coli, Clostridium perfringens, Enterococcus spp.) and
wastewater indicators (ammonia, fluoride, surfactants, and specific conductance). Included with those
studies, ACEPD documented the role of wildlife in contributing to fecal contamination of the three
streams. Urban streams provide habitat for raccoons, opossum, squirrel and other wildlife. These
studies started before adoption of the BMAP in 2008 and continue through the second BMAP iteration.
Information about these studies is available at:
http://www.alachuacounty.us/Depts/EPD/WaterResources/CreeksAndLakes/Reports%20and%20Maps
%20Documents/ACEPD%20Micro%20Report%202008%20with%20Appendices.pdf. These studies
were not conclusive in identifying the relative magnitude or specific location of bacteria sources
throughout the urban creeks, but they did provide adequate information to locate areas with consistently
high fecal coliform counts and the presence or absence of human bacteria sources.
ACEPD continually works with the FDOH in Alachua County, the City of Gainesville Public Works
Department, FDOT, and GRU to identify and resolve illicit discharges as a strategy to reduce fecal
contamination in stormwater. Results of an Outfall Reconnaissance Inventory (ORI) are available at:
http://www.alachuacounty.us/Depts/EPD/WaterResources/CreeksAndLakes/Reports%20and%20Maps
%20Documents/ORI%202008-2012%20Final%20Report.pdf .
The FDOH in Alachua County’s role in these investigations is the identification of septic systems on
properties adjacent to the creeks that potentially could contribute fecal coliform bacteria loading to the
creeks.
GRU wastewater management strategies focus on the prevention of fecal bacteria problems through
regular and periodic evaluation and maintenance of the wastewater collection infrastructure. The utility
has programs in place to revitalize and seal old pipes through sliplining, to evaluate the internal structure
Page 43 of 106

Final Orange Creek Basin Management Action Plan Phase 2 – June 2014
of pipes for damage using closed circuit television, to clean and repair wastewater pipes, and to detect
improper connections and breaks through smoke testing. Details about each of these activities
performed by GRU are contained in the Orange Creek BMAP Supporting Document (2008) available at
http://publicfiles.dep.state.fl.us/DEAR/BMAP/OrangeCreek/Support_document/.
Sweetwater Branch is an example of how these techniques are used to remediate sources of fecal
coliforms bacteria. Several suspect stormwater outfalls with high fecal coliform bacteria counts into
Sweetwater Branch in the Duck Pond area were identified from monitoring. Dye tracing and closed
caption TV cameras were used to confirm the existence of a leaking lateral sewer line. Wildlife cameras
confirmed the usage of the location by raccoons. The sewer line was fixed removing one source of
bacteria.
Similarly for Tumblin Creek, suspect stormwater outfalls that had the potential for cross connections
with sanitary sewer lines were identified. A pool and sink were found to be discharging into the storm
sewer.
Page 44 of 106

Final Orange Creek Basin Management Action Plan Phase 2 – June 2014
TABLE 7: MANAGEMENT STRATEGIES TO REDUCE FECAL COLIFORM BACTERIA AND NUTRIENTS IN URBAN CREEKS AND TO PREVENT FUTURE DISCHARGES
PROJECT NUMBER - PROJECT NAME / WHICH TYPE OF TMDL IS ADDRESSED?
WATERBODY NAME / WBID
LEAD ENTITY / PROJECT PARTNERS
COST / SOURCE OF FUNDING / COMPLETION OR EXPECTED
COMPLETION DATE
GENERAL LOCATION / PROJECT DESCRIPTION
BACTERIA17 - ORI / Addresses Bacteria TMDL
Sweetwater Branch; Hogtown Creek; Tumblin Creek / 2711; 2698; 2718A
Alachua County Environmental Protection Department / Alachua County, City of Gainesville, FDOT, District 2 (Gainesville Clean Water Partnership)
Unavailable / Alachua County, City of Gainesville, FDOT, District 2 (Gainesville Clean Water Partnership) cost share / 2010
Gainesville urban area. / Reconnaissance of all outfalls and visual observations and sampling of suspect outfalls and stormwater pipes discharging to urban creeks with high fecal coliform concentrations. / Identify and climate sources of fecal coliform pollution. Implements Alachua County Comp Plan Conservation and Open Space Element - Surface Water Systems Objective 4.6.
BACTERIA18 - Private Wastewater Collection System Pilot Study/ Addresses Bacteria and Nutrient TMDL
Sweetwater Branch; Hogtown Creek; Tumblin Creek / 2711; 2698; 2718A
ACEPD Unavailable/ Alachua County General Fund/ Complete - November 2008
Gainesville Urban Area/ Conducted a pilot study of private wastewater collection systems./ Pilot tests were conducted and a report was written. ACEPD may pursue a private collection system monitoring program in the future. / Assess the condition of private wastewater collection systems to determine their likelihood to contribute to sanitary sewer overflows. Implements Alachua County Comp Plan Conservation and Open Space Element - Surface Water Systems Objective 4.6.
BACTERIA19 - Hydrodynamic Separator and Fecal Coliform Study/ Addresses Bacteria TMDL
Sweetwater Branch; Hogtown Creek; Tumblin Creek / 2711; 2698; 2718A
ACEPD / Alachua County, City of Gainesville, FDOT, District 2 (Gainesville Clean Water Partnership)
$34,000/ Alachua County, City of Gainesville, FDOT, District 2 (Gainesville Clean Water Partnership) cost share / Ongoing
Gainesville Urban Area/ The goal of this study is to assess the potential of hydrodynamic separator storm sewer BMP devices to harbor and release high levels of bacteria into Gainesville creeks. / Provide data for developing BMP maintenance guidelines for the reduction of fecal coliform bacteria. Implements Alachua County Comp Plan Conservation and Open Space Element - Surface Water Systems Objective 4.6.
BACTERIA20 – Urban Creek Fecal Coliform “Hot Spots” Monitoring/ Addresses Bacteria TMDL
Orange Creek Basin / HUC 03080102
ACEPD/ Alachua County, City of Gainesville, FDOT District 2 (Gainesville Clean Water Partnership)
$7,300 annually/ Alachua County, City of Gainesville, FDOT District 2 (Gainesville Clean Water Partnership) cost share/ Ongoing through 2017
Gainesville urban area/ Continue to assess fecal coliform bacteria (or other bacteriological standard) to assess microbial "Hot Spots" for source investigation/ Provide data for fecal coliform bacteria (or other bacteriological standard) to assess microbial "Hot Spots" for source investigation. Implements Alachua County Comp Plan Conservation and Open Space Element - Surface Water Systems Objective 4.6 and policies.
SWT36 – Southeast (SE) 9th Street, Rosewood Trash Trap/ Addresses Nutrient TMDL
Sweetwater Branch; Paynes Prairie / 2711; 2722
City of Gainesville / Florida Department of Environmental Protection
$350,000 / City of Gainesville and the Department/ Complete - October 2010
Upper Sweetwater Branch watershed / Stormwater Treatment facility. Water quality improvement project.
TUM23 - Tumblin Creek Sediment and Trash Trap / Addresses Bacteria and Nutrient TMDL
Tumblin Creek / 2718A City of Gainesville, FDOT
$1,250,000 City of Gainesville Stormwater Management Utility Fee / $190,785 FDOT / Ongoing
Tumblin Creek watershed / stormwater sediment and trash trap. Water quality improvement project by removal of debris, sediment and potential pollutants from Tumblin Creek and its watershed prior to discharge to Bivens Arm and the rehydration of an adjacent wetland.
Page 45 of 106

Final Orange Creek Basin Management Action Plan Phase 2 – June 2014
PROJECT NUMBER - PROJECT NAME / WHICH TYPE OF TMDL IS ADDRESSED?
WATERBODY NAME / WBID
LEAD ENTITY / PROJECT PARTNERS
COST / SOURCE OF FUNDING / COMPLETION OR EXPECTED
COMPLETION DATE
GENERAL LOCATION / PROJECT DESCRIPTION
TUM24 - City of Gainesville Rain and Weather Gauges
Sweetwater Branch; Hogtown Branch; Tumblin Creek / 2711 ; 2698 ; 2718A
ACEPD / Alachua County, City of Gainesville
$3,597 City of Gainesville Stormwater Management Utility Fee / $3,597 City of Gainesville, Alachua County (Gainesville Clean Water Partnership) / Ongoing
Gainesville Urban Area. / Installation of six weather stations to monitor rain, temperature and other weather data at various points across Gainesville. Collecting rain and additional weather data at various locations across Gainesville which can be used in future analysis
TUM25- Tumblin Creek SW 9th Street Pipe Upgrade
Tumblin Creek / 2718A City of Gainesville $920,000 City of Gainesville Stormwater Management Utility Fee / Ongoing
Tumblin Creek watershed / stormwater pipe upgrade. Replacement of existing older pipes to better convey stormwater to the headwaters of Tumblin Creek
TUM26 - Tumblin Creek West 6th Street Pipe Upgrade
Tumblin Creek / 2718A City of Gainesville $300,000 City of Gainesville Stormwater Management Utility Fee / Ongoing
Tumblin Creek watershed / stormwater pipe upgrade. Replacement of existing older pipes to better convey stormwater to the existing infrastructure leading to Tumblin Creek
TUM27 - Tumblin Creek Northwest (NW) 14th Street Pipe Upgrade
Tumblin Creek / 2718A City of Gainesville $400,000 City of Gainesville Stormwater Management Utility Fee / Ongoing
Tumblin Creek watershed / stormwater pipe upgrade. Replacement of existing older pipes to better convey stormwater to the existing infrastructure leading to Tumblin Creek
TUM28 - Tumblin Creek SW 7th Terrace Pipe Upgrade
Tumblin Creek / 2718A City of Gainesville $1,250,000 City of Gainesville Stormwater Management Utility Fee / Future / Funding to be approved or secured
Tumblin Creek watershed / stormwater pipe upgrade. Replacement of existing older pipes to better convey stormwater to the headwaters of Tumblin Creek
TUM29 - Tumblin Creek SW 14th Avenue Underpass Improvements
Tumblin Creek / 2718A City of Gainesville $500,000 City of Gainesville Stormwater Management Utility Fee / Future / Funding to be approved or secured
Tumblin Creek watershed / underpass upgrade. Replacement and upgrade to an existing underpass for Tumblin Creek to prevent upstream flooding and erosion control
TUM30 - Tumblin Creek SW 9th Street Underpass Improvements
Tumblin Creek / 2718A City of Gainesville $500,000 City of Gainesville Stormwater Management Utility Fee / Future / Funding to be approved or secured
Tumblin Creek watershed / underpass upgrade. Replacement and upgrade to an existing underpass for Tumblin Creek to prevent upstream flooding and erosion control
TUM31 - Tumblin Creek PK Yonge Underpass Improvements
Tumblin Creek / 2718A City of Gainesville $400,000 City of Gainesville Stormwater Management Utility Fee / Future / Funding to be approved or secured
Tumblin Creek watershed / underpass upgrade. Replacement and upgrade to an existing underpass for Tumblin Creek to prevent upstream flooding and erosion control
TUM32 - Tumblin Creek Erosion Control and Stream Restoration
Tumblin Creek / 2718A City of Gainesville $1,750,000 City of Gainesville Stormwater Management Utility Fee / Future / Funding to be approved or secured
Tumblin Creek watershed / Creek restoration. Upgrade problematic areas along Tumblin Creek for erosion control and stream restoration
Page 46 of 106

Final Orange Creek Basin Management Action Plan Phase 2 – June 2014
Chapter 5: ALACHUA SINK
Alachua Sink is verified as impaired for nutrients and the TN TMDL developed for Alachua Sink
requires a 45 percent reduction in loading. Alachua Sink is located on the northern edge of Paynes
Prairie, south of the City of Gainesville. It consists of a small lake (Alachua Lake), with a
corresponding solution sink (Alachua Sink) that recharges the Floridan aquifer. There are two well-
defined inflows into Alachua Sink: Sweetwater Branch and a canal that connects Alachua Lake to
Alachua Sink.
5.1 WATER QUALITY AND POLLUTANT SOURCES There are three point sources in the watershed: the Main Street Domestic WRF, the John R. Kelly
Generating Station, and the City of Gainesville MS4. The Main Street WRF is an advanced, secondary-
level, activated sludge domestic wastewater treatment facility that discharges treated wastewater to
Sweetwater Branch. The John R. Kelly Generating Station discharges cooling tower water and a small
volume of industrial wastewater into Sweetwater Branch. The City of Gainesville’s MS4 drains
contributing urbanized areas of Sweetwater Branch. Other nonpoint sources to Sweetwater Branch, and
ultimately Alachua Sink, include stormwater from the eastern portions of Gainesville.
The Alachua Sink TMDL point and nonpoint source loadings are allocated based on wet and dry year
conditions. Wet years are the critical condition when nonpoint source impacts are the greatest, while in
dry years the greatest source of nutrients is point sources. Alachua Lake and the Main Street WRF are
the major nonpoint and point sources of nutrient loading to Alachua Sink. Figure 10 shows that the
nutrient load from the Alachua Lake watershed is the largest single nutrient source, contributing 73.1%
of the TN loading for wet years. Nutrient sources to Alachua Lake include stormwater runoff into the
Paynes Prairie sub-basin and nutrients from Newnans Lake, which are transported via Prairie Creek.
The second largest source (19.1%) is the point source discharge from the Main Street WRF. The plant
discharges treated wastewater to Sweetwater Branch, which enters Alachua Sink through Paynes Prairie
via the Sweetwater Canal. Sweetwater Branch also conveys stormwater to Alachua Sink from portions
of the urban watershed of east Gainesville, much of which was developed prior to the implementation of
current stormwater regulations. Nonpoint source stormwater from these urbanized areas accounts for
Page 47 of 106

Final Orange Creek Basin Management Action Plan Phase 2 – June 2014
5.6% of TN inputs to Alachua Sink. Various other identified sources contribute the remaining TN
loading.
* The TMDL was based on two different critical conditions. Nonpoint source loadings were considered to be at their highest during wet years. Dry years are the critical condition for point sources.
FIGURE 10: WET YEAR BASELINE TN LOADING TO ALACHUA SINK
5.2 MANAGEMENT STRATEGIES Table 8 provides details on the projects completed or anticipated for this waterbody. The Paynes Prairie
Sheetflow Restoration Project (AS18) is the most significant project designed to address the Alachua
Sink TMDL. When completed, Sweetwater Branch will discharge to a constructed polishing wetland
located on Paynes Prairie rather than through Sweetwater Canal into Alachua Sink, eliminating this
direct discharge to the Floridan aquifer. The canal will be filled in allowing water to sheet flow across
Paynes Prairie. The Paynes Prairie Sheetflow Restoration Project will achieve the wasteload allocation
portion of the Alachua Sink TMDL when completed by removing 124,000 lbs/yr of TN and 2,948 lbs/yr
of TP. The wasteload allocation is comprised of the loading from the Main Street WRF and urban
stormwater that enters Sweetwater Branch. Additional TP loading reduction occurs at the Main Street
WRF, before discharge to Sweetwater Branch, through chemical coagulation treatment. Treatment to
reduce TN concentration occurs downstream in the polishing wetland. The TN and TP concentrations in
the prairie after treatment by the polishing wetland are expected to be 1.47 milligrams per liter (mg/L)
and 0.1 mg/L, respectively. Construction is ongoing, but is expected to be completed before the end of
Page 48 of 106

Final Orange Creek Basin Management Action Plan Phase 2 – June 2014
the second BMAP iteration. There are still regulatory requirements that need to be completed before the
project is operational. The project was officially dedicated on May 8, 2013; complete details about the
project are available at:
http://www.cityofgainesville.org/PublicWorks/ProgramsandServices/PaynesPrairieSheetflowProject.asp
x.
In addition, FWC has completed exotic plant control efforts on Paynes Prairie to enhance the success of
native plants. Stormwater management projects completed or planned in the Sweetwater Branch
watershed remove at least 880 lbs/yr of TN. Not all of the projects are currently quantified. The City of
Gainesville has installed a number of vortex units that remove sediment and trash and also have some
nutrient removal capacity.
TABLE 8: MANAGEMENT STRATEGIES TO REDUCE TOTAL NITROGEN TO ALACHUA SINK PROJECT NUMBER -
PROJECT NAME / WHICH TYPE OF
TMDL IS ADDRESSED?
WATERBODY NAME / WBID
LEAD ENTITY / PROJECT
PARTNERS
COST / SOURCE OF FUNDING / COMPLETION OR EXPECTED
COMPLETION DATE GENERAL LOCATION / PROJECT DESCRIPTION
AS17 - Prairie Creek Conservation Cemetery/ Addresses Nutrient TMDL
Paynes Prairie / 2705
ACEPD Department /
$324,022 / Alachua County Forever Bond proceeds / Purchased December 9, 2010
Paynes Prairie / Conservation Easement acquisition - Crevasse (Prairie Creek by Paynes Prairie. No increase in surface runoff of pollutants due to land use change, continued aquifer recharge and ecosystem/habitat preservation; implement Alachua County Comp Plan Conservation and Open Space Element - Alachua County Forever Policy 6.2.1.
AS18 - Paynes Prairie Sheetflow Restoration Project/ Address Nutrient TMDL
Alachua Sink/ Gainesville Regional Utilities/ City of Gainesville, Alachua County, FDOT
$22.1 million/ Stormwater Utility & Wastewater fees $16,357,745/$8,370,044 fiscal year and $11,077,55 GRU total / Legislative $500,000/SJRWMD $1,355,869/FDOT $666,000/319 & TMDL $2,506,270/FWC $500,000/Rec Trails $200,000/ Start - August 2012, End June 2014
Paynes Prairie / Paynes Prairie Sheetflow Restoration Project is a 125 acre off-line wetland that reduces excess nutrients from Sweetwater Branch and achieves the TMDL reduction required for the City's (waste and storm water utilities) for Alachua Sink. Meet TMDL requirements, rehydrates 1300 acres of prairie, and captures sediments and trash currently flowing to the prairie. Project will remove 124,000 lbs/yr of TN and 2,948 lbs/yr of TP.
AS19 – Paynes Prairie Exotic Plant Control
Alachua Sink /
FWC $15,285 / FWC / Completed 2013
Paynes Prairie / Control of exotic plants including Triadica sebifera, Melia azedarach, and Colocasia esculenta on 250 acres. Enhance success of native plants.
Page 49 of 106

Final Orange Creek Basin Management Action Plan Phase 2 – June 2014
Chapter 6: LAKE WAUBERG
The pollutants of concern for Lake Wauberg are TN and TP. Lake Wauberg is located south of
Gainesville. It has a surface area of 248 acres, with a mean depth of 12 feet. The bottom of the lake
intersects the phosphate rich Hawthorn Group which influences its water quality. The lake receives
most of its recharge directly from rainfall.
6.1 WATER QUALITY AND POLLUTANT SOURCES Lake Wauberg has been hypereutrophic since at least 1990, based on TN, TP, and chlorophyll-a data. A
Trophic State Index (TSI) uses nutrient and chlorophyll-a data to present a composite of the lakes
nutrient condition. From 1990 to 2011, the mean annual TSI was 72.3 and classified as poor water
quality. The seasonal average TSI for Lake Wauberg has been increasing since the late 1990s (Figure
11).
Comparison of annual average TN, TP, and chlorophyll-a data between the data period used for TMDL
development (1990-2000) and more recent post BMAP data period (2008-2011) are displayed in Figure
12 through Figure 14. TN, TP, and chlorophyll-a annual average concentrations were higher in the
post-BMAP data period and are higher than the TMDL target concentration included on the figures.
TN, TP, and chlorophyll-a levels displayed significant increasing trends in concentration (p=0.0001)
over the entire period of record (1990-2011). Figure 15 displays the trend for annual average
chlorophyll-a concentrations over the period of record. Some of the increase could be a result of less
rainfall (less lake volume and concentrating effect) during the post BMAP period. Lake level data for
Lake Wauberg were not available to evaluate the effect of water level on nutrient concentration.
FIGURE 11: TREND IN TSI FOR LAKE WAUBERG OVER THE PERIOD OF RECORD
Page 50 of 106

Final Orange Creek Basin Management Action Plan Phase 2 – June 2014
FIGURE 12: AVERAGE ANNUAL TOTAL PHOSPHORUS CONCENTRATION COMPARISONS
FIGURE 13: AVERAGE ANNUAL TOTAL NITROGEN CONCENTRATION COMPARISONS
Page 51 of 106

Final Orange Creek Basin Management Action Plan Phase 2 – June 2014
FIGURE 14: AVERAGE ANNUAL CHLOROPHYLL-a CONCENTRATION COMPARISONS
FIGURE 15: TREND IN ANNUAL CHLOROPHYLL-A CONCENTRATIONS
6.2 MANAGEMENT STRATEGIES The Lake Wauberg watershed is largely undeveloped and bordered by limited rural residential
development that relies on onsite sewage treatment and disposal systems (OSTDS) for wastewater
management, a university-owned recreation area near the lake, and Paynes Prairie State Preserve. The
lake is located in close proximity to U.S. Highway 441. To achieve the TMDLs for Lake Wauberg
loadings of TP and TN must be reduced by 50% and 51%, respectively (Figure 16 and Figure 17).
Page 52 of 106

Final Orange Creek Basin Management Action Plan Phase 2 – June 2014
FIGURE 16: BASELINE TP LOADING TO LAKE WAUBERG
FIGURE 17: BASELINE TN LOADING TO LAKE WAUBERG
The management of OSTDS and fertilizer use are the primary controllable factors for nutrient load
reduction in the Lake Wauberg watershed. FDOH in Alachua County evaluated the OSTDS located on
residential properties surrounding Lake Wauberg during the first BMAP cycle. UF upgraded both the
north and south shore OSTDS locations in 1998. It is estimated that the complete removal of all OSTDS
input to Lake Wauberg will only result in a 32% reduction in TN and TP. UF does not fertilize the
Page 53 of 106

Final Orange Creek Basin Management Action Plan Phase 2 – June 2014
landscape around the lake (personal communication, Bill James, 2011). Other potential sources of
nutrient loading to Lake Wauberg are atmospheric deposition, phosphatic-rich clays of the Hawthorn
Group, and wildlife.
It may be more appropriate to manage the nutrient concentrations within the lake rather than reduce
loadings from its watershed as the management strategy for achieving the TMDLs. This hypothesis will
be investigated in this second BMAP cycle. Additionally, since the watershed is largely undeveloped
and the Hawthorn Group is in contact with the lake bottom reevaluation of the TMDLs may be
appropriate.
Page 54 of 106

Final Orange Creek Basin Management Action Plan Phase 2 – June 2014
Chapter 7: NEWNANS LAKE
TP and TN were identified as the pollutants causing water quality impairment in Newnans Lake. A
large drainage area north and west of the lake supplies inflow via three streams: Hatchet Creek, Little
Hatchet Creek, and Lake Forest Creek. Hatchet Creek and Little Hatchet Creek are “blackwater”
streams with naturally high color and frequently have high levels of TN. The lake’s surface water
outflow is through Prairie Creek. The geology of the area is dominated by the phosphate-clay rich
Hawthorn Group, which is relatively impermeable and acts as a confining layer separating surface water
from the influence of the Floridan aquifer. Erosion of tributary streambeds and stream banks has
exposed the phosphatic clays of the Hawthorn allowing transport of phosphate to the lake.
7.1 WATER QUALITY AND POLLUTANT SOURCES Water quality in Newnans Lake has been declining since 1969. The lake has been considered
hypereutrophic since at least 1999. Newnans Lake is a fairly shallow lake with a maximum lake depth
no more than 12 feet, and a mean depth of approximately five feet. Annual average TP concentration
for the post-BMAP period is substantially greater (about a 59% increase) than the TMDL period (Figure
12).
Figure 18 displays the trend in annual average TP concentration over the period of record. TN annual
average concentrations have declined slightly during the post-BMAP period (Figure 13). However, TN
average concentrations remain very high at about 4 mg/L.
Chlorophyll-a concentrations have declined substantially between the TMDL period and post-BMAP
period, but are still very high relative to other lakes in the Orange Creek Basin (Figure 14). Figure 19
Page 55 of 106

Final Orange Creek Basin Management Action Plan Phase 2 – June 2014
displays the trend in annual chlorophyll-a concentrations over the period of record. Blue-green algae are
the dominant phytoplankton taxa in Newnans Lake (80%, Table 9), at a biovolume consistently higher
than Orange Lake and Lochloosa Lake. Lake water levels have fluctuated more over the past 20 years
than in previous decades. Historically low water levels have occurred in more recent decades and may
be influencing the water quality of the lake. The area was in an extended drought for the period from
1999 until 2001, and again in 2011. The highest TP concentrations were during the drought period in
2000 and 2001, and extending into 2002.
FIGURE 18: TREND IN TP CONCENTRATIONS IN NEWNANS LAKE
FIGURE 19: TREND IN CHLOROPHYLL-A IN NEWNANS LAKE
Page 56 of 106

Final Orange Creek Basin Management Action Plan Phase 2 – June 2014
TABLE 9: DISTRIBUTION OF ALGAL TAXA IN THE LAKES
LAKE CYANOPHYTA (BLUE-
GREEN ALGAE) BACILLARIOPHYCEAE
(DIATOMS) CHLOROPHYTA
(GREEN ALGAE) OTHER
TAXA DATA
PERIOD Lochloosa Lake 76% 12% 8% 4% 2003-2009 Newnans Lake 80% 8% 8% 4% 2003-2011 Orange Lake 71% 11% 11% 7% 2003-2009
Current nutrient sources identified in the Newnans Lake TMDL are presented in Figure 20 and Figure
21. These figures reflect the dominance of internal recycling as a nutrient source: 71.8% of the TN load
and 52.4% of the TP load. The lake is dominated by blue-green algae which are capable of fixing
atmospheric nitrogen. Tributary inflows from Hatchet and Little Hatchet Creeks contribute 17.1% of the
TN load and 22.1% of the TP load; this includes the loading from the Brittany Estates WRF. A portion
of the watershed is located within urbanized land uses (eastern Gainesville). There is the potential for
stormwater to be a contributing source through the Little Hatchet Creek and Lake Forest Creek
watersheds and part of Hatchet Creek’s watershed. Brittany Estates was allocated TN and TP loadings
within the TMDL at the facility’s current permitted rate of discharge, because the loadings from Brittany
Estates have a minimal impact on the water quality of Newnans Lake, even under drought conditions.
Atmospheric deposition contributes 12.4% of the TP loading and about 2% of the TN loading. OSTDS
are a small portion of the TN load to Newnans Lake.
Silviculture represents a large part of the Newnans Lake watershed land use, although it contributes a
very small portion of the overall nutrient load to Newnans Lake when compared with the other land uses
in the watershed. Most of the silviculture acreage in the Newnans Lake watershed is managed by
several large industrial silviculture operators, as well as conservation lands managed by SJRWMD and
Alachua County, all of whom are participating in the Florida Forest Service BMP program. Other
agricultural activities, such as blueberry farms, are present in the watershed. Nutrient loadings left from
legacy agriculture and hydrologic alteration from earlier silviculture practices have been identified as
potential sources of nutrients to the lake (Lippincott, 2011).
Page 57 of 106

Final Orange Creek Basin Management Action Plan Phase 2 – June 2014
* See text for discussion of internal recycling.
FIGURE 20: BASELINE TN LOADING TO NEWNANS LAKE
* See text for discussion of internal recycling.
FIGURE 21: BASELINE TP LOADING TO NEWNANS LAKE
7.2 RECENT STUDIES In the past five years, several studies and reports evaluating natural and anthropogenic sources of
nutrients and recommending future actions have been prepared. Two reports (Cohen et al. 2008 and
2010, unpublished data) focused on spatial nutrient loading to the Newnans Lake watershed. Several
sources of external TP loading to the lake were identified including:
Page 58 of 106

Final Orange Creek Basin Management Action Plan Phase 2 – June 2014
− Erosion of naturally or artificially exposed phosphatic Hawthorn Group materials due to
poor stormwater infrastructure in the urbanized portion of the watershed and
development constructed prior to stormwater management requirements.
− Ditches historically excavated to re-route Little Hatchet Creek on Gainesville Regional
Airport property exposed and continually erode phosphatic materials.
− Legacy phosphorus inputs to the lake from former dairy operations on the northeast side
of Newnans Lake near Windsor.
The Department working with SJRWMD and ACEPD collected data on the depth of the Hawthorn
Group in the Newnans Lake watershed in spring 2010. There are many places in the lake’s watershed
where the Hawthorn is five feet or less from the land surface. This proximity to the land surface
confirms that this geologic formation plays a role in contributing loading and complicates
implementation of projects that reduce loading.
The 2011 Orange Creek Basin SWIM Plan (Lippincott 2011) lays out information, goals, and suggests
projects that could improve water quality in the watershed. The plan is a potential source of information
and project ideas for lakes in the Orange Creek Basin. While internal recycling of nutrients is a major
source of nutrient to the lake, there are external loading sources that could be mitigated through
implementation of specific projects.
7.3 MANAGEMENT STRATEGIES Table 10 summarizes the management strategies for Newnans Lake. To achieve the TMDLs for
Newnans Lake TN and TP must be reduced from baseline loadings by 74% and 59%, respectively. The
extent to which nutrient recycling acts as a nutrient load in Newnans Lake could significantly affect the
effectiveness of nutrient load reduction projects. The PLRG developed by SJRWMD assigns most
loading to the lake’s watershed, in contrast to the TMDL’s assignment of 50% or more of the loading to
internal recycling. The discrepancy between these two loading analyses will be resolved during this
second BMAP cycle.
Two potential TP sources that will be evaluated following BMAP adoption are the contribution from a
legacy dairy operation and ditches at the Gainesville Airport that intersect the Hawthorn Group. The
feasibility of implementing projects that address these two sources is part of that evaluation.
Page 59 of 106

Final Orange Creek Basin Management Action Plan Phase 2 – June 2014
Dredging is one mechanism to remove nutrients stored in sediment that contribute to internal recycling,
but because of significant cultural resources (wooden dugout canoes) buried in the bottom of the lake,
dredging is not a feasible option. Additionally, without eliminating the sources of excess nutrients
dredging becomes a temporary solution.
Alachua County acquired several parcels of land surrounding Newnans Lake, either by direct purchase
or through easements, for conservation purposes. These lands are maintained as natural lands that aide
in aquifer recharge as well as have the potential for recreational use.
The City of Gainesville plans to develop a watershed master study for the Little Hatchet Creek and Lake
Forest Creek watersheds. The timing of plan development is not known. Watershed plans inventory
stormwater collection infrastructure and identify locations that contribute the highest loadings. The
results of these plans are used to identify and prioritize stormwater remediation projects. One such
retrofit project, the Duval Stormwater Park (NEW19), removes 72 lbs/yr of TP and 253 lbs/yr of TN.
SJRWMD harvested gizzard shad from the lake for one year of a proposed three year project. There
were not enough fish to continue the second and third year’s harvests. Gizzard shad feed at the lake
bottom and in the process resuspend sediments containing TP. The fish also store the nutrient they
consume from food as biomass and recycle it as waste material. Removing the fish exports TP from the
lake. At this time, the degree of water quality improvement is difficult to predict, as insufficient data are
available to determine the effects of reduced nutrient inputs on internal recycling in the lake.
The FWC has done several plantings of Egyptian paspalidium (Paspalidium geminatum) in the littoral
zone of the lake along with giant bulrush (Schoenoplectus californicus) for a total of 26,500 plants.
Vegetation planted in the lake littoral zone provides habitat for aquatic species, filters runoff, helps to
stabilize the lake bottom, uptakes nutrient, and reduces resuspension of sediment. The direct nutrient
removal and water quality improvements of these activities are not easily quantified with current data.
A priority for this second BMAP cycle is the identification and implementation of further actions to
reduce nutrient loading in the Newnans Lake watershed. The BWG will work toward meeting this goal
by identifying and implementing additional management strategies in addition to those outlined above or
listed in Table 10. Project nutrient reductions will be evaluated through data collected during project
implementation and the implementation of the basin monitoring strategy.
Page 60 of 106

Final Orange Creek Basin Management Action Plan Phase 2 – June 2014
TABLE 10: MANAGEMENT STRATEGIES TO REDUCE NUTRIENTS IN NEWNANS LAKE PROJECT NUMBER -
PROJECT NAME / WHICH TYPE OF TMDL IS
ADDRESSED?
WATERBODY NAME / WBID
LEAD ENTITY / PROJECT PARTNERS
COST / SOURCE OF FUNDING / COMPLETION OR EXPECTED
COMPLETION DATE GENERAL LOCATION / PROJECT DESCRIPTION
NEW18 - Depth to top of Hawthorn formation investigation / Addresses Nutrient TMDL
Newnans Lake / 2705B
Department Bureau of Watershed Restoration; SJRWMD; ACEPD
$5,000 / Federal funds/ Complete - June 2010
Newnans Lake Watershed / Boreholes were drilled at 24 locations within the watershed to determine the depth from land surface to the top of the Hawthorn formation. Depth was determined by both physical observation and gamma ray logging. Samples of phosphatic rock were collected for analysis of phosphate content. The Hawthorn formation comprises layers of interbedded phosphatic clays and is hypothesized to be one of the sources of TP into Newnans Lake, particularly where the formation is close to the surface either naturally or by artificial ditching. / The mapping of the Hawthorn surface provides greater detail of the interaction of the subsurface geology with activities on land surface.
NEW19 - Duval Stormwater Park/ Addresses Bacteria and Nutrient TMDL
Newnans Lake; Lake Forest Creek / 2705B
City of Gainesville / Florida Communities Trust
$891,609 / Stormwater Management Utility Fees; Florida Department of Transportation Cost Share Grant; Florida Department of Environmental Protection Grant; Community Development Block Grant; Florida Communities Trust Grant/ Complete - 2011
The Duval Neighborhood Stormwater Park, 26.4 acres, is located at 505 Northeast (NE) 21st Street in the Gainesville "Front Porch Community." This urban stormwater retrofit project is designed to improve water quality in Newnans Lake. The Duval Stormwater Park provides a water quality treatment credit "bank" that the City may draw from as needed during implementation of the revitalization projects in the Duval neighborhood. The Duval Stormwater Park also provides passive recreational opportunities. Reduce sediment load and nutrient loads. Project will remove 72 lbs/yr of TP and 253 lbs/yr of TN.
NEW20 - Cox & Moore/ Addresses Nutrient TMDL
Hatchet Creek / 2705B ACEPD $1,095,342.75 / Alachua County Forever Bond proceeds / Wild Spaces and Public Places sales tax / Complete - May 16, 2013
Alachua County / Land acquisition - Cox & Moore. No increase in surface runoff of pollutants due to land use change, continued aquifer recharge and ecosystem/habitat preservation; implement Alachua County Comp Plan Conservation and Open Space Element - Alachua County Forever Policy 6.2.1.
NEW21 -Kincaid and Tabone/ Addresses Nutrient TMDL
Lake Forest Creek / 2705B
ACEPD $179,000 / Alachua County Forever Bond proceeds / Complete - January 2012
Alachua County / Conservation Easement acquisition - Kincaid and Tabone. No increase in surface runoff of pollutants due to land use change, continued aquifer recharge and ecosystem/habitat preservation; implement Alachua County Comp Plan Conservation and Open Space Element - Alachua County Forever Policy 6.2.1.
NEW22 - Smith/ Addresses Nutrient TMDL
Lake Forest Creek / 2705B
ACEPD $63,700 / Alachua County Forever Bond proceeds/ Complete - January 2012 and December 17, 2012
Alachua County / Conservation Easement acquisition - Smith. No increase in surface runoff of pollutants due to land use change, continued aquifer recharge and ecosystem/habitat preservation; implement Alachua County Comp Plan Conservation and Open Space Element - Alachua County Forever Policy 6.2.1.
Page 61 of 106

Final Orange Creek Basin Management Action Plan Phase 2 – June 2014
PROJECT NUMBER - PROJECT NAME / WHICH
TYPE OF TMDL IS ADDRESSED?
WATERBODY NAME / WBID
LEAD ENTITY / PROJECT PARTNERS
COST / SOURCE OF FUNDING / COMPLETION OR EXPECTED
COMPLETION DATE GENERAL LOCATION / PROJECT DESCRIPTION
NEW23 - Wainberg Addition Number 2/ Addresses Nutrient TMDL
Newnans Lake / 2705B ACEPD $14,363 / Alachua County Forever Bond proceeds/ Complete - February 20, 2013
Alachua County / Land acquisition - Wainberg Addition. No increase in surface runoff of pollutants due to land use change, continued aquifer recharge and ecosystem/habitat preservation; implement Alachua County Comp Plan Conservation and Open Space Element - Alachua County Forever Policy 6.2.1.
NEW24 – Littoral Zone Planting 2008 / Addresses Nutrient TMDL
Newnans Lake / 2705B
FWC $3,000 / FWC /Complete 2008 Newnans Lake / Planting of 5,000 Paspalidium geminatum and 3,000 Schoenoplectus californicus.
NEW25 - Littoral Zone Planting 2009 / Addresses Nutrient TMDL
Newnans Lake / 2705B
FWC $2,250 / FWC / Complete 2009 Newnans Lake / Planting of 7,500 Paspalidium geminatum.
NEW26 – Littoral Zone Planting and Management 2011 / Addresses Nutrient TMDL
Newnans Lake / 2705B
FWC $1,900 / FWC / Completed 2011
Newnans Lake / Planting of 5,000 Paspalidium geminatum and management with herbicide of planting sites for pickerel weed and cupscale tussocks in habitat enhancement areas.
NEW27 – Littoral Zone Planting 2012 / Addresses Nutrient TMDL
Newnans Lake / 2705B FWC $2,280 / FWC / Completed 2012
Newnans Lake / Planting of 6,000 Paspalidium geminatum.
NEW28 - Duval Heights Drainage Improvements / Addresses Nutrient TMDL
Newnans Lake; Lake Forest Creek / 2705B
City of Gainesville $175,000 City of Gainesville Stormwater Management Utility Fee / Ongoing
Lake Forest Creek watershed / Construction of roadside swales to help prevent flooding of the existing paved streets and will provide additional treatment prior to discharging to the Duval Stormwater Park
NEW29 - Smokey Bear Road Underpass Improvements / Addresses Nutrient TMDL
Newnans Lake; Little Hatchet Creek / 2695
City of Gainesville $300,000 City of Gainesville Stormwater Management Utility Fee / Future / Funding to be approved or secured
Little Hatchet Creek watershed / underpass upgrade. Replacement and upgrade to an existing underpass for Little Hatchet Creek to prevent upstream flooding and erosion control
NEW30 - Little Hatchet and Lake Forest Creek Watershed Master Study / Addresses Nutrient TMDL
Newnans Lake; Little Hatchet Creek; Lake Forest Creek / 2695 ; 2705B
City of Gainesville $300,000 City of Gainesville Stormwater Management Utility Fee / Future
Little Hatchet and Lake Forest Creek watersheds / Conduct a watershed master study and plan for both watersheds to determine projects to benefit the watersheds along with Lake Newnan
NEW31 – Harvest of Rough Fish (Gizzard Shad) / Addresses Nutrient TMDL
Newnans Lake / 2705B SJRWMD / / Completed 2010 Newnans Lake / Harvest of rough fish, largely gizzard shad. Removal of fish helps to export TP load from lake. One year of three year project completed. 205,188 pounds of fish removed.
Page 62 of 106

Final Orange Creek Basin Management Action Plan Phase 2 – June 2014
Chapter 8: ORANGE LAKE
The pollutant of concern for Orange Lake is TP. Orange Lake, a shallow lake with a relatively large
surface area of 12,703 acres at median stage, naturally fluctuates between 2,745 acres and 15,600 acres
during drought and heavy rainfall, respectively (SJRWMD, 2006). Major sources of water to the lake
include interflow via Camps Canal and the River Styx from Newnans Lake and via Cross Creek from
Lochloosa Lake, surface runoff from the watershed, and direct precipitation into the lake. Water flows
out of the lake through a group of sinkholes located in the southwest part of the lake at Heagy Burry
Park and a notched, fixed-crest weir at the U.S. Highway 301 bridge into the headwater wetlands of
Orange Creek.
8.1 WATER QUALITY AND POLLUTANT SOURCES Water quality in Orange Lake has been declining since 1985. Annual average TP and TN
concentrations have increased between the 1995-2000 TMDL data period and the post BMAP period of
2008-2013 (Figure 12 and Figure 13). However, annual average chlorophyll-a concentrations declined
between the TMDL period and post-BMAP period (Figure 14). Water levels in the lake have been in
decline since about 1990. During the recent extended drought the lake did drain through its sinkhole.
Phytoplankton taxa present in Orange Lake are dominated by the blue-greens (Table 9). Blue-green
algal taxa represented 71% of the total biovolume of all algal taxa. This percentage is comparable to
Newnans Lake and Lochloosa Lake. Dominance of a lake’s algal population by blue-green taxa is
generally considered an indicator of a lake that is imbalanced.
Baseline loadings of TP to Orange Lake are 25,732 lbs/yr. Inflow from Camps Canal and the River Styx
swamp is the most significant TP source in Orange Lake, contributing 37.1% of the TP load (Figure
22). Together with inflow from Lochloosa Lake via Cross Creek (11.9%), loading from upstream
waterbodies and wetlands contributes 49% of the TP load into Orange Lake. Loading from water and
wetland areas, as well as atmospheric deposition (“uncontrollable” sources), comprises 32% of the TP
load into Orange Lake. In the initial TMDL calculations, 21.5% of the TP load in the Orange Lake
watershed was attributed to agricultural land.
Page 63 of 106

Final Orange Creek Basin Management Action Plan Phase 2 – June 2014
8.2 MANAGEMENT STRATEGIES To achieve the TMDL of 15,262 lbs/yr for Orange Lake, management strategies must reduce TP
baseline loadings by 45%. New management strategies to reduce or manage the sources of TP to
Orange Lake are listed in Table 11. A large portion of the Orange Lake watershed is involved in
silviculture activity, with most of this acreage held by several large industrial silviculture operators. All
of the large silviculture operators are participating in the Florida Forest Service BMP program.
Analyses conducted subsequent to the TMDL indicated that nutrient loading from silviculture areas
applying appropriate BMPs is roughly equivalent to loads from natural forest land uses. The proper use
of silviculture BMPs, as implemented through the Florida Forest Service BMP Program, is expected to
manage the loadings associated with silviculture activities. Besides silviculture, other primary
agriculture activities in the watershed with adopted BMP manuals include horse farms and cattle
operations. One of the goals for this second cycle of the BMAP is for FDACS to enforce compliance
with implementation of BMPs and to work with the Department to estimate the reduction in TP loading
from BMP implementation. Marion County has the Clean Farms Initiative to assist local farmers with
the implementation of BMPs, primarily for the management of animal waste and nutrients. The focus of
this initiative is horse farms.
Orange Lake is regularly managed for nuisance and invasive aquatic plants by the FWC. The lake is
also an important fish and wildlife habitat management area and the FWC periodically plants vegetation
and scrapes exposed lake bottom to remove unconsolidated sediment. The most recent activity was in
2011 with the planting of 175 wetland trees in the littoral zone and removal of 55 acres of exotic tree
species. Littoral zone plantings increase aquatic habitat and provide water quality improvements by
filtering runoff and stabilizing sediment.
The management strategies are expected to decrease TN and TP loadings. However, the degree of water
quality improvement is difficult to predict, as insufficient data were available to quantify TP nutrient
reductions from the majority of projects. In-lake habitat restoration and overall lake management may
be as important a component of restoring water quality as reducing watershed loadings. Improved
coordination and collaboration among the Department, FWC, and other members of the BWG on how to
manage invasive aquatic plants and aquatic habitat is one of the goals of the second BMAP iteration. As
the receiving water for both Lochloosa Lake and Newnans Lake, Orange Lake will also benefit from
Page 64 of 106

Final Orange Creek Basin Management Action Plan Phase 2 – June 2014
projects implemented in these two sub-basins that will decrease nutrient loading. The restoration of
water quality in Newnans Lake may have the greatest benefit for Orange Lake.
FIGURE 22: BASELINE TP LOADING TO ORANGE LAKE
TABLE 11: MANAGEMENT STRATEGIES TO REDUCE NUTRIENTS IN ORANGE LAKE PROJECT NUMBER -
PROJECT NAME / WHICH TYPE OF
TMDL IS ADDRESSED?
WATERBODY NAME / WBID
LEAD ENTITY / PROJECT
PARTNERS
COST / SOURCE OF FUNDING / COMPLETION OR
EXPECTED COMPLETION DATE
GENERAL LOCATION / PROJECT DESCRIPTION
OR17 - Cypress Strand Planting / Addresses Nutrient TMDL
Orange Lake / Unknown
FWC / ACEPD and two private landowners
$7,109 / FWC/ACEPD and Marion County provided in-kind services/ Completed - June 2009
Project located in Essen Run area of Orange Lake. A total of 2,000 wetland trees were planted on two sites totaling 3.5 acres. Purpose was to enhance forested wetland structure in an area that had been burned during the 2001 drought. A total of 1,500 bald cypress, 300 red maple and 200 Carolina ash in 3 gallon pots were planted. Stabilizes shoreline and provides forested wetland fish and wildlife habitat in an area which burned during the 2001 drought. Also provides a vegetated buffer to adjacent upland agricultural area (organic farming operation).
OR18 – Planting of Wetland Trees / Addresses Nutrient TMDL
Orange Lake / Unknown
FWC $1,225 / FWC / completed 2012
Planting of 175 trees comprising Taxodium distichum, Nyssa sylvatica, and Fraxinum caroliniana in littoral zone. Stabilizes shoreline and provides forested wetland fish and wildlife habitat. Also provides a vegetated buffer to adjacent upland.
OR19 – Exotic Tree Control / Addresses Nutrient TMDL
Orange Lake / Unknown
FWC $6,082 / FWC / Completed 2011
Removal of exotic trees from the littoral zone including Triadica sebifera and Melia azedarach Stabilizes shoreline and provides forested wetland fish and wildlife habitat. Also provides a vegetated buffer to adjacent upland.
Page 65 of 106

Final Orange Creek Basin Management Action Plan Phase 2 – June 2014
Chapter 9: LOCHLOOSA LAKE
A nutrient TMDL for Lochloosa Lake is under development with expected adoption into rule during this
second phase of the BMAP. TMDL water quality targets will define the allowable nutrient loading for
Lochloosa Lake and percent of reduction that will need to be made to achieve the TMDL. Management
strategies that address those reductions will be adopted into this BMAP at a later data.
Lochloosa Lake has an estimated median area of 6,114 acres (Department, 2008) and its contributing
watershed covers about 56,267 acres (SJRWMD, 2011). It is a tributary of Orange Lake discharging to
it through Cross Creek. The lake is designated as an Outstanding Florida Water by the Department.
9.1 WATER QUALITY AND POLLUTANT SOURCES Annual average TP (Figure 12) and TN (Figure 13) concentrations are higher for the post-BMAP
period of 2008-2013 compared to the TMDL period of 1995-2000. Chlorophyll-a concentrations
(Figure 14) for the post-BMAP period are lower than the TMDL period. The lower chlorophyll-a
concentration may be explained by the large variation in inter-annual density of phytoplankton taxa.
Phytoplankton populations present in the lake are dominated by blue-green taxa, but there is a large
variation in the amount of algae (Figure 23) between years. This inter-annual variability is more
pronounced for Lochloosa Lake than for either Orange Lake or Newnans Lake. Lake water levels have
been lower in recent years because of an extended drought. A second explanation for the lower
chlorophyll-a concentration in the post-BMAP period is the influence of extended drought on recovery
of phytoplankton populations.
Page 66 of 106

Final Orange Creek Basin Management Action Plan Phase 2 – June 2014
FIGURE 23: INTER-ANNUAL DISTRIBUTION OF PHYTOPLANKTON DENSITY EXPRESSED AS
BIOVOLUME FOR LOCHLOOSA LAKE
9.2 MANAGEMENT STRATEGIES New management strategies for Lochloosa Lake are listed in Table 12. Aquatic plant management is
periodically performed on this lake. Improved coordination and collaboration between the Department
and FWC on how to manage invasive aquatic plants and aquatic habitat is one of the priorities for this
second BMAP iteration. The TMDL will aide in identifying potential sources and set appropriate targets
for loading reductions. Future growth expected in the Lochloosa Lake watershed (Envision Alachua)
presents an opportunity to protect the lake.
TABLE 12: MANAGEMENT STRATEGIES TO REDUCE NUTRIENTS IN LOCHLOOSA LAKE PROJECT NUMBER -
PROJECT NAME / WHICH TYPE OF TMDL IS
ADDRESSED?
WATERBODY NAME / WBID
LEAD ENTITY / PROJECT PARTNERS
COST / SOURCE OF FUNDING / COMPLETION
OR EXPECTED COMPLETION DATE
GENERAL LOCATION / PROJECT DESCRIPTION
LOCH09 –NE 179th Street-Erosion Control/ Addresses Nutrient TMDL
Lochloosa Creek
Alachua County Public Works
Unknown/ Not applicable/ Complete - November 2010
Intersection of NE 179th Street and SR 26. / Construction of a sediment trap in the roadside swale of NE 179th Street to trap sediment from NE 179th Street that discharged into the swales on SR 26 and eventually into Lochloosa Creek. Prevents sediment and trash from entering streams and storm sewer system.
LOCH10 - Littoral Zone Planting 2009
Lochloosa Lake
FWC $3,750 /FWC / Complete 2009
Lochloosa Lake / Littoral zone planting of 5,000 Paspalidium geminatum and 5,000 Schoenoplectus californicus. Enhance aquatic habitat, stabilize bottom, and reduce resuspension of sediment.
LOCH11 – Cross Creek Exotic Plant Control
Cross Creek FWC $6,082.19 / FWC / Complete 2011
Cross Creek / Removal of exotic trees including Triadica sebifera. Improve aquatic habitat.
Page 67 of 106

Final Orange Creek Basin Management Action Plan Phase 2 – June 2014
Chapter 10: ASSESSING PROGRESS AND MAKING CHANGES
This chapter outlines the steps stakeholders will take to track progress in implementing projects and
observe the results of those projects in BMAP waterbodies. It outlines a process for communicating this
information among the BWG members. This chapter also includes changes and additions made to the
monitoring strategy during the first BMAP phase.
10.1 MONITORING WATER QUALITY AND POLLUTANT LOADS The Orange Creek BWG developed a strategy for monitoring water quality and measuring pollutant
loads that builds on existing programs being conducted by the Department, SJRWMD, Alachua County,
and LakeWatch. Using an adaptive management approach, the Department, in conjunction with the
BWG, will continue to develop the details of the strategy based on conditions and monitoring results.
10.1.1 MONITORING OBJECTIVES AND ANTICIPATED BENEFITS The overall purpose of this monitoring strategy is to support the implementation of the BMAP. Both the
primary and secondary objectives apply to waterbodies included as part of the BMAP.
Primary Objectives
1. Identify and track water quality trends in BMAP waterbodies to determine if TMDL
targets are being achieved.
2. Where feasible, measure the effectiveness of specific BMPs in reducing external loadings of
target pollutants.
Secondary Objectives
1. Measure reductions in watershed loadings of TMDL target pollutants.
2. Refine understanding of the type and relative magnitude of pollutant loading sources.
10.1.2 WATER QUALITY INDICATORS AND RESOURCE RESPONSES To achieve the objectives above, the monitoring strategy focuses on two types of indicators: core and
supplemental (Table 13). Core indicators are the minimum parameters that will be tracked, and these
relate directly to the parameters causing impairment in lakes and creeks. Alkalinity was added as a core
parameter as part of this second BMAP phase. Supplemental indicators support the interpretation of
Page 68 of 106

Final Orange Creek Basin Management Action Plan Phase 2 – June 2014
water quality data by providing a characterization of a the waterbody. As BMAP implementation moves
forward, core indicators are expected to reflect changes in water quality. The expected change is
indicated in Table 13.
TABLE 13: ANTICIPATED TRENDS IN CORE AND SUPPLEMENTAL WATER QUALITY INDICATORS INDICATOR PARAMETER LAKES CREEKS
Core Chlorophyll-a Decrease in concentration Not applicable
Core Phosphorus Decrease in concentration Decrease in concentration
Core Nitrogen, Nitrite and Nitrate Decrease in concentration Decrease in concentration
Core Total Kjeldahl Nitrogen Decrease in concentration Decrease in concentration
Core Fecal coliform Not applicable Decrease in concentration; fewer exceedances of criteria
Supplemental Specific conductance Monitored to facilitate interpretation of core indicator trends Not applicable
Supplemental Dissolved oxygen Monitored to facilitate interpretation of core indicator trends Not applicable
Core Alkalinity Monitored to facilitate interpretation of core indicator trends Not applicable
Supplemental pH Monitored to facilitate interpretation of core indicator trends Not applicable
Supplemental Temperature Monitored to facilitate interpretation of core indicator trends Not applicable
Supplemental Color Monitored to facilitate interpretation of core indicator trends Not applicable
Supplemental Turbidity Monitored to facilitate interpretation of core indicator trends
Monitored to facilitate interpretation of core indicator trends
Supplemental Total suspended solids Monitored to facilitate interpretation of core indicator trends
Monitored to facilitate interpretation of core indicator trends
Supplemental Total organic carbon Monitored to facilitate interpretation of core indicator trends
Monitored to facilitate interpretation of core indicator trends
Table 14 lists the anticipated resource responses, by waterbody type, that will be tracked for the BMAP
waterbodies. These responses represent the achievement of long-term goals to demonstrate restoration
of the Orange Creek Basin lakes. A significant amount of time may be needed for the changes in water
chemistry to be translated into resource responses such as shifts in algae species.
TABLE 14: ANTICIPATED RESOURCE RESPONSES TO IMPAIRMENT FOR NUTRIENTS AND COLIFORMS, BY WATERBODY TYPE
- = Empty cell RESOURCE RESPONSES LAKES (NUTRIENTS) CREEKS (COLIFORMS)
Changes in TSI X -
Shifts in algal species X -
Fewer than 10% exceedances of fecal coliform water quality standards - X
Page 69 of 106

Final Orange Creek Basin Management Action Plan Phase 2 – June 2014
10.1.3 MONITORING NETWORK The monitoring network outlined in this plan includes at least one station in each of the lakes and in
their primary tributary inflows and outflows. A number of stations are also located on the urban
tributaries for the purpose of tracking changes in fecal coliform bacteria. The current network of water
quality and flow stations will provide sufficient data to calculate pollutant loading trends, and will aide
in the identification of nutrient sources.
Figure 24, Figure 25, and Table 15 provide information on the monitoring locations, parameters, and
frequency of sampling. SJRWMD and ACEPD sample at these sites regularly as part of their routine
monitoring programs. Lake Watch volunteers also regularly monitor the four lakes. Individual
sites/parameters may be periodically added or removed, depending on environmental conditions,
resources, data review, and other pertinent factors. Careful consideration will be given before any site
or parameter is removed or modified. Any station modifications or presence of unusual conditions
should be noted in the field notes associated with specific sampling events. Every effort should be made
to communicate this information to other stakeholders to support the accuracy of future trend analyses.
Page 70 of 106

Final Orange Creek Basin Management Action Plan Phase 2 – June 2014
FIGURE 24: ACEPD SAMPLING STATIONS
Page 71 of 106

Final Orange Creek Basin Management Action Plan Phase 2 – June 2014
FIGURE 25: SJRWMD WATER QUALITY SAMPLING STATIONS, 2013
Page 72 of 106

Final Orange Creek Basin Management Action Plan Phase 2 – June 2014
TABLE 15: AMBIENT WATER QUALITY MONITORING STATIONS IN THE ORANGE CREEK BASIN * ACEPD field parameters: pH, dissolved, conductivity, turbidity, Secchi depth, depth of collection, depth of water column, air temperature, weather, cloud cover (lakes only), wind speed (lakes only), wind direction (lakes only), water temperature. ACEPD Surface Water Chemistry: The full suite of surface water parameters will be analyzed in the winter and summer quarters (Alkalinity, Calcium, Magnesium, Potassium, Iron, TP, field-filtered orthophosphate, Chlorine, color, sulfate, total suspended solids, total dissolved solids, ammonium, nitrogen oxides, total Kjeldahl nitrogen, TN, total organic carbon, Chlorophyll-a at SWB331 and ALACH sites on Paynes Prairie). Partial parameters alternating quarters (TP, field-filtered orthophosphate, nitrogen oxides, total Kjeldahl nitrogen, TN, ammonia, and potassium).
SUB-BASIN ENTITY STATION ID STATION DESCRIPTION LAT. LONG. STATION TYPE
SAMPLING FREQUENCY
YEAR SITE EST.
SAMPLING PARAMETERS * WBID
Newnans Lake and Hatchet Creek
SJRWMD NEW Newnans Lake center 29.6453 -82.22 Ambient Monthly 1994
Field parameters; Water chemistry;
Chlorophyll-a; Light attenuation;
2705B
Newnans Lake and Hatchet Creek
SJRWMD LFC329B Lake Forest Creek at 329B 29.6517 -82.2511 Ambient Monthly 1998 Field parameters; Water chemistry 2709
Newnans Lake and Hatchet Creek
SJRWMD HAT26 Hatchet Creek at SR 26 29.68783 -82.2063 Ambient Monthly 1994 Field parameters; Water chemistry 2688
Newnans Lake and Hatchet Creek
SJRWMD LHT26E Little Hatchet Creek east 29.68805 -82.22063 Ambient Monthly 1994 Field parameters; Water chemistry 2695
Newnans Lake and Hatchet Creek
SJRWMD LHAT26 Little Hatchet Creek 29.67963 -82.23443 Ambient Monthly 1994 Field parameters; Water chemistry 2695
Newnans Lake and Hatchet Creek
SJRWMD LHTNB
North branch of Little Hatchet Creek,
downstream of Airport Industrial Park
29.69322 -82.26565 Ambient Monthly 1996 Field parameters; Water chemistry 2695
Newnans Lake and Hatchet Creek
SJRWMD LHATWR Little Hatchet Creek on
Waldo Road NW of Gainesville Airport
29.69868 -82.2804 Ambient Monthly 2009 Field parameters; Water chemistry 2695
Newnans Lake and Hatchet Creek
SJRWMD LRC Lake Ridge Creek 29.66254 -85.2538 Ambient Monthly 2009 Field parameters; Water chemistry 2709
Newnans Lake and Hatchet Creek
SJRWMD GRSC Gum root Swamp Creek NE of Gainesville Airport 29.70037 -82.2547 Ambient Monthly 2009 Field parameters;
Water chemistry 2695
Page 73 of 106
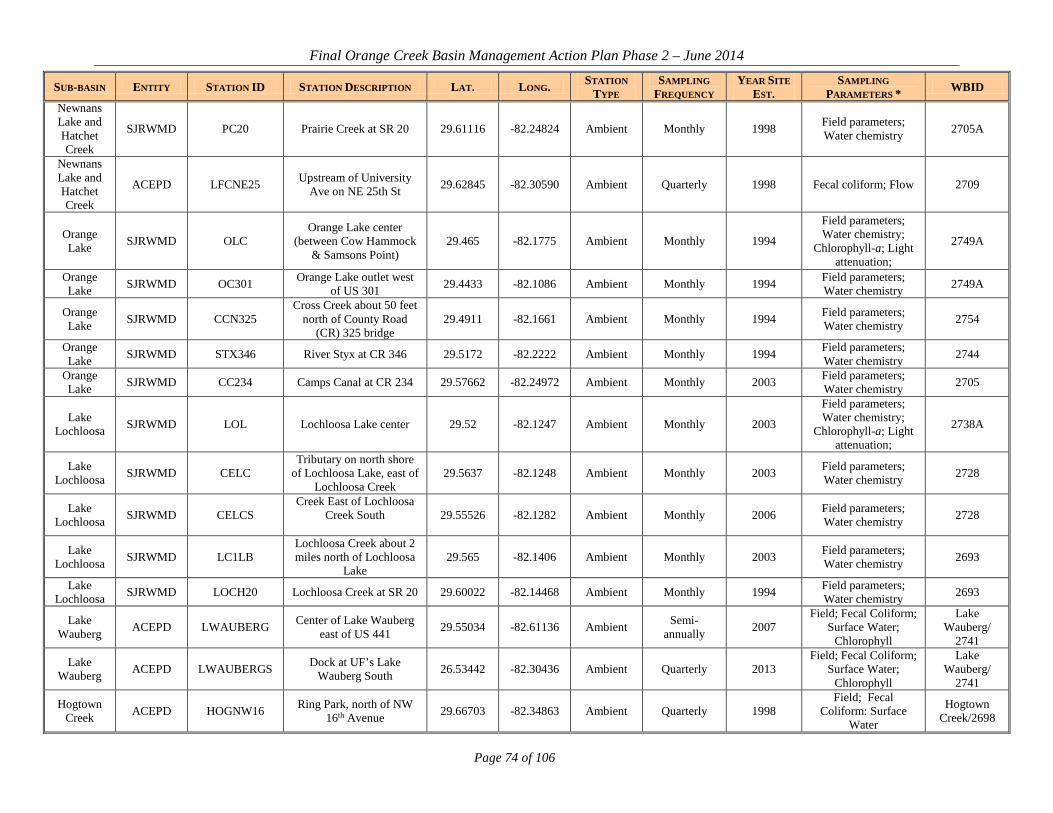
Final Orange Creek Basin Management Action Plan Phase 2 – June 2014
SUB-BASIN ENTITY STATION ID STATION DESCRIPTION LAT. LONG. STATION TYPE
SAMPLING FREQUENCY
YEAR SITE EST.
SAMPLING PARAMETERS * WBID
Newnans Lake and Hatchet Creek
SJRWMD PC20 Prairie Creek at SR 20 29.61116 -82.24824 Ambient Monthly 1998 Field parameters; Water chemistry 2705A
Newnans Lake and Hatchet Creek
ACEPD LFCNE25 Upstream of University Ave on NE 25th St 29.62845 -82.30590 Ambient Quarterly 1998 Fecal coliform; Flow 2709
Orange Lake SJRWMD OLC
Orange Lake center (between Cow Hammock
& Samsons Point) 29.465 -82.1775 Ambient Monthly 1994
Field parameters; Water chemistry;
Chlorophyll-a; Light attenuation;
2749A
Orange Lake SJRWMD OC301 Orange Lake outlet west
of US 301 29.4433 -82.1086 Ambient Monthly 1994 Field parameters; Water chemistry 2749A
Orange Lake SJRWMD CCN325
Cross Creek about 50 feet north of County Road
(CR) 325 bridge 29.4911 -82.1661 Ambient Monthly 1994 Field parameters;
Water chemistry 2754
Orange Lake SJRWMD STX346 River Styx at CR 346 29.5172 -82.2222 Ambient Monthly 1994 Field parameters;
Water chemistry 2744
Orange Lake SJRWMD CC234 Camps Canal at CR 234 29.57662 -82.24972 Ambient Monthly 2003 Field parameters;
Water chemistry 2705
Lake Lochloosa SJRWMD LOL Lochloosa Lake center 29.52 -82.1247 Ambient Monthly 2003
Field parameters; Water chemistry;
Chlorophyll-a; Light attenuation;
2738A
Lake Lochloosa SJRWMD CELC
Tributary on north shore of Lochloosa Lake, east of
Lochloosa Creek 29.5637 -82.1248 Ambient Monthly 2003 Field parameters;
Water chemistry 2728
Lake Lochloosa SJRWMD CELCS
Creek East of Lochloosa Creek South
29.55526 -82.1282 Ambient Monthly 2006 Field parameters;
Water chemistry 2728
Lake Lochloosa SJRWMD LC1LB
Lochloosa Creek about 2 miles north of Lochloosa
Lake 29.565 -82.1406 Ambient Monthly 2003 Field parameters;
Water chemistry 2693
Lake Lochloosa SJRWMD LOCH20 Lochloosa Creek at SR 20 29.60022 -82.14468 Ambient Monthly 1994 Field parameters;
Water chemistry 2693
Lake Wauberg ACEPD LWAUBERG Center of Lake Wauberg
east of US 441 29.55034 -82.61136 Ambient Semi-annually 2007
Field; Fecal Coliform; Surface Water;
Chlorophyll
Lake Wauberg/
2741
Lake Wauberg ACEPD LWAUBERGS Dock at UF’s Lake
Wauberg South 26.53442 -82.30436 Ambient Quarterly 2013 Field; Fecal Coliform;
Surface Water; Chlorophyll
Lake Wauberg/
2741
Hogtown Creek ACEPD HOGNW16 Ring Park, north of NW
16th Avenue 29.66703 -82.34863 Ambient Quarterly 1998 Field; Fecal
Coliform: Surface Water
Hogtown Creek/2698
Page 74 of 106

Final Orange Creek Basin Management Action Plan Phase 2 – June 2014
SUB-BASIN ENTITY STATION ID STATION DESCRIPTION LAT. LONG. STATION TYPE
SAMPLING FREQUENCY
YEAR SITE EST.
SAMPLING PARAMETERS * WBID
Hogtown Creek ACEPD HOG30US
North side of CR 30 (SW 20th Ave) upstream of
bridge 29.63839 -82.39219 Ambient Quarterly 1999
Field; Fecal Coliform: Surface
Water
Hogtown Creek/2698
Hogtown Creek ACEPD HOGSINK
Hogtown Creek approx. 100 meters upstream of
Haile Sink 29.62973 -82.41117 Ambient Quarterly 1998
Field; Fecal Coliform: Surface
Water ; Flow
Haile Sink/2717A
Hogtown Creek ACEPD POSNW16 South of NW 16th Ave
west of NW 27th Terr. 29.66662 -82.36423 Ambient Quarterly 1996 Field; Fecal
Coliform: Surface Water
Possum Creek/2696
Hogtown Creek ACEPD GLENSP Glen Springs at spring boil
in the concrete pool 29.67223 -82.34589 Ambient Quarterly 2005 Field; Flow; Micro; Surface Water
Hogtown Creek/2698
Sweetwater Branch ACEPD SWBSE4
Site is east of SE 4th St between SE 13th Lane and
SE 11th Place. 29.63805 -82.31809 Ambient Quarterly 2003
Field; Fecal Coliform: Surface
Water ; Flow
Sweetwater Branch/2711
Sweetwater Branch ACEPD SWB331
West of SR 331 (Williston Rd) just north of SE 16th
Ave. 29.63040 -82.32242 Ambient Quarterly 1994
Field; Fecal Coliform; Surface Water;
Chlorophyll (if also sampling on Paynes
Prairie)
Sweetwater Branch/2711
Tumblin Creek ACEPD TUMSW5
South of SW 5th Ave between SW 8th St and
SW 10th St. 29.64705 -82.33366 Ambient Quarterly 2001
Field; Fecal Coliform: Surface
Water ; Flow
Tumblin Creek/2718A
Tumblin Creek ACEPD TUM441 West of SW 13th Street
end of concrete channel. 29.63317 -82.34058 Ambient Quarterly 1998 Field; Fecal
Coliform: Surface Water ; Flow
Tumblin Creek/2718A
Tumblin Creek ACEPD BIVARM Bivens Arm Lake at US
441 29.62163 -82.34003 Ambient Semi-annually 1998
Field; Fecal Coliform; Surface Water;
Chlorophyll
Tumblin Creek
South/2718C
Alachua Sink ACEPD ALACHCHAN
Channel at Alachua Sink leading to the Primary
Sink Feature, gate code #0105
29.60542 -82.30189 Ambient Quarterly 1990 Field; Flow; Micro; Surface Water
Alachua Sink 2720A
Alachua Sink ACEPD BOULSP
Boulware Spring at the spring boil near base of
concrete wall 29.62097 -82.30724 Ambient Quarterly 2000 Field; Flow; Micro;
Surface Water Alachua Sink
2720A
Lochloosa Lake
Lake Watch Lochloosa Lake 3 sampling locations Unknown Unknown Ambient
Monthly March–
November; Annual
Vegetation Survey
Unknown TN, TP, Secchi depth, and chlorophyll-a 2738A
Page 75 of 106

Final Orange Creek Basin Management Action Plan Phase 2 – June 2014
SUB-BASIN ENTITY STATION ID STATION DESCRIPTION LAT. LONG. STATION TYPE
SAMPLING FREQUENCY
YEAR SITE EST.
SAMPLING PARAMETERS * WBID
Newnans Lake
Lake Watch Newnans Lake 3 sampling locations Unknown Unknown Ambient
Monthly; Annual
Vegetation Survey
Unknown
TN, TP, Secchi depth, and chlorophyll-a 2705B
Orange Lake
Lake Watch Orange Lake 3 sampling locations Unknown Unknown Ambient
Monthly March–
November Unknown
TN, TP, Secchi depth, and chlorophyll-a 2749A
Lake Wauberg
Lake Watch Lake Wauberg 3 sampling locations Unknown Unknown Ambient Monthly 1990
TN, TP, Secchi depth, and chlorophyll-a 2741
Page 76 of 106

Final Orange Creek Basin Management Action Plan Phase 2 – June 2014
10.1.3.1 Flow and Rain Data Measuring reductions in watershed loadings of TMDL target pollutants is another secondary objective
of the monitoring strategy. To achieve this, flow data are needed in conjunction with the water quality
parameters listed above. SJRWMD’s Hydrologic Data Services Section monitors water levels and flows
throughout the district, including the Orange Creek Basin. The section gathers continuous level data for
the three large lakes and flow data for the larger tributaries that discharge into these lakes. Table 16 and
Figure 26 identify the locations of discharge and water level monitoring stations in the basin.
ACEPD manages a contract to maintain five surface water gages and two rainfall gages in the Orange
Creek Basin for the City of Gainesville and Alachua County. These stations include discharge
monitoring of Tumblin Creek, Hogtown Creek, Possum Creek and Little Hatchet Creek and stage (level)
monitoring of Haile Sink. Both of the rainfall gages are currently located in the Sweetwater Branch
watershed, one in the headwaters off Waldo Road and the second at the GRU Sheetflow Restoration
Project.
Two rain gauges are regularly monitored in the basin: Kelly Generating Station (GRU) and Gainesville
Regional Airport (SJRWMD). In addition to these stations, next-generation radar data are also available
to track rainfall amounts. These are compiled in 15-minute time increments and are available basin-
wide. This dataset may be the most reliable for use in future trend analyses.
TABLE 16: DISCHARGE AND WATER LEVEL MONITORING STATIONS IN THE ORANGE CREEK BASIN
SUB-BASIN ENTITY STATION ID STATION DESCRIPTION LATITUDE LONGITUDE STATION TYPE
Sweetwater Branch SJRWMD 01980199 Sweetwater Branch 29.63021 -82.32223 Discharge Paynes Prairie SJRWMD 27274763 Paynes Prairie Channel 29.60252 -82.30295 Discharge
Newnans Lake SJRWMD 19244274 Lake Forest Creek CR329B 29.65194 -82.25139 Discharge
Newnans Lake SJRWMD 02840233 North Branch Little Hatchet Creek 29.69078 -82.25568 Discharge
Newnans Lake ACEPD LHATWALDO Little Hatchet Creek east of Waldo Rd. 29.69827 -82.27998 Discharge
Newnans Lake SJRWMD 08631958 Prairie Creek 29.61094 -82.24815 Discharge
Newnans Lake SJRWMD 04831007 Newnans Lake 29.63584 -82.24365 Water Level
Orange Lake SJRWMD 08661963 Camps Canal 29.57630 -82.24944 Discharge Orange Lake SJRWMD 02601462 Orange Lake Outlet 29.44178 -82.10851 Discharge Orange Lake SJRWMD 19274284 Cross Creek 29.48528 -82.16528 Discharge Orange Lake SJRWMD 19974721 River Styx 29.51711 -82.22254 Discharge Orange Lake SJRWMD 02611465 Orange Lake Boardman 29.46198 -82.19181 Water Level
Page 77 of 106

Final Orange Creek Basin Management Action Plan Phase 2 – June 2014
SUB-BASIN ENTITY STATION ID STATION DESCRIPTION LATITUDE LONGITUDE STATION TYPE
Lake Lochloosa SJRWMD 01930189 Lochloosa Creek 29.60022 -82.14468 Discharge Lake Lochloosa SJRWMD 19234272 Lochloosa Creek South 29.56500 -82.14056 Discharge Lake Lochloosa SJRWMD 71481615 Lochloosa Lake 29.51639 -82.10389 Water Level
Hatchet Creek SJRWMD 14342633 Hatchet Creek 29.69328 -82.20056 Discharge
Hogtown Creek ACEPD HOGNW16 Hogtown Creek at NW 16th Avenue 29.66703 -82.34863 Discharge
Hogtown Creek SJRWMD 08641960 Hogtown Creek at Arredondo 29.63827 -82.39254 Discharge
Haile Sink ACEPD HAILESINK Haile Sink (terminus of Hogtown Creek) 29.62878 -82.41096 Stage
Possum Creek ACEPD POSNW!6 Possum Creek at NW 16th Avenue 26.66662 -82.36423 Discharge
Tumblin Creek ACEPD TUM441 Tumblin Creek west of US Hwy 441 29.63317 -82.34058 Discharge
Page 78 of 106

Final Orange Creek Basin Management Action Plan Phase 2 – June 2014
FIGURE 26: SJRWMD DISCHARGE AND WATER LEVEL SAMPLING STATIONS
Page 79 of 106

Final Orange Creek Basin Management Action Plan Phase 2 – June 2014
10.1.4 QUALITY ASSURANCE/QUALITY CONTROL MECHANISMS The collection of both ambient and performance-based water quality data will be conducted in a manner
consistent with the Department’s standard operating procedures for quality assurance/quality control.
The most current version of these procedures can be downloaded from
http://www.dep.state.fl.us/water/sas/sop/sops.htm. All stakeholders contributing data in support of the
BMAP agree to follow these standard operating procedures.
SJRWMD staff and contractors collect, process, and preserve samples according to the SJRWMD’s
Standard Operating Procedures for the Collection of Surface Water Quality Samples and Field Data–
Feb. 13, 2004, as well as the Department’s standard operating procedures. Sampling completed by the
ACEPD is also consistent with the standard operating procedures established by the Department.
Through cooperation on TMDL-related data collection, the SJRWMD, ACEPD, and the Department
have consistently used similar standard operating procedures for field sampling and lab analyses. This
consistency will continue into the future to ensure that data can be used not only for tracking BMAP
progress but also for future TMDL evaluations and other purposes.
10.1.5 DATA MANAGEMENT MECHANISMS FOR DATA STORAGE AND RETRIEVAL Data collected through the above activities will need to be tracked, compiled, and analyzed for it to be
useful in support of the BMAP. The Florida Storage and Retrieval (STORET) database will serve as the
primary resource for storing data and providing access for all stakeholders. Stakeholders have agreed to
upload data to STORET in a timely manner, after the appropriate quality assurance/quality control
checks have been completed.
STORET uploads are only appropriate for data that is representative of ambient conditions.
Performance-based data collected as part of a localized source identification project, BMP investigation,
or similar activity are not representative of ambient water quality conditions. These data will not be
uploaded into the STORET database. Performance-based data will be maintained by the appropriate
entity. Stakeholders agree to provide this data to other BMAP partners upon request and when
appropriate for inclusion in BMAP data analyses and adaptive management evaluations.
Ambient water quality data collected by monitoring partners are available from each entity, as well as
the Department’s Impaired Waters Database. Florida LakeWatch data may be obtained at
http://lakewatch.ifas.ufl.edu/.
Page 80 of 106
Final Orange Creek Basin Management Action Plan Phase 2 – June 2014
The ACEPD hydrologic data is available on the ACEPD website at:
http://www.alachuacounty.us/Depts/EPD/WaterResources/CreeksAndLakes/Pages/Monitoring-
Programs-and-Data.aspx. SJRWMD flow data are available on the SJRWMD website at
http://floridaswater.com/toolsGISdata/.
10.1.6 BACTERIA SOURCE TRACKING PROTOCOL For those urban creeks impaired by fecal coliforms bacteria with adopted TMDLs, a protocol was
developed for how to investigate the sources of these bacteria. Local partners developing the protocol
included ACEPD, FDOH in Alachua County, City of Gainesville Stormwater Department, and GRU.
The protocol utilizes appropriate elements of a robust toolbox for finding fecal coliform sources that was
developed by the Department, in addition to extensive sampling and previous microbial source tracking
studies undertaken by partners. The toolbox references the following elements for guidance:
− Implementation Guidance for the Fecal Coliform Total Daily Maximum Loads Adopted
by the Florida Department of Environmental Protection, March 2011.
− Final Adopted Orange Creek BMAP (May 2008).
− Orange Creek BMAP Appendices (May 2008).
− Orange Creek BMAP Support Document (May 2008).
− OSTDS Decision Tool.
− Sewer Decision Tool.
− Stormwater Decision Tool.
Details on the protocol are included in Appendix B.
10.2 TRACKING AND FOLLOW-UP ACTIONS BMAP implementation will be a long-term process. Significant unknowns remain regarding nutrient
sources for Orange Creek Basin lakes and to a lesser extent bacteria sources for streams. The TMDLs
established for basin lakes most likely will not be achieved in the near term. The FWRA provides for
flexibility in the implementation of a BMAP by allowing a phased approach.
Page 81 of 106
Final Orange Creek Basin Management Action Plan Phase 2 – June 2014
In this second iteration of the BMAP, the Department will track projects and other implementation
efforts and monitor water quality in TMDL waterbodies to ensure that the BMAP is carried out and to
measure its effectiveness. The BWG will meet at least annually to discuss implementation issues,
consider new information, and determine other management strategies needed for waterbodies that are
not projected to meet their TMDLs.
Adaptive management involves setting up a mechanism for making course corrections in the BMAP
when circumstances change or feedback mechanisms indicate that a more effective strategy is needed.
Key components of adaptive management are tracking implementation, monitoring water quality and
pollutant loads, and holding periodic BWG meetings to share information and expertise. The FWRA
requires that the plan be revised, as appropriate, in collaboration with basin stakeholders.
Adaptive management measures include the following:
− Procedures to determine whether additional restoration actions are needed.
− Determining whether and when plan components need to be revised.
− Descriptions of the BWG’s role after BMAP completion.
10.3 COMMITMENT TO PLAN IMPLEMENTATION While the BMAP is linked by statute to permitting and other enforcement processes that affect
individual entities, successful implementation requires that local stakeholders willingly and consistently
work together to achieve adopted TMDLs. This collaboration fosters the sharing of ideas, information,
and resources. The members of the Orange Creek BWG have demonstrated their willingness to confer
and coordinate with and support each other in their efforts.
On a practical level, BMAP implementation also depends on adequate resources and necessary
authorizations. The management strategies contained in the BMAP are either under way or are planned
in good faith. Current and future actions are contingent on necessary funding and approvals for their
initiation and/or continuation.
BWG members have made commitments to address the following actions:
Page 82 of 106

Final Orange Creek Basin Management Action Plan Phase 2 – June 2014
− Continue to use an equitable and cost-effective, coordinated, comprehensive watershed
management approach that applies the best available science to achieve TMDL-related
pollutant load reductions and water quality improvements within a BWG member’s
authority.
− Seek necessary approvals and funding to implement consensus management strategies
identified in the BMAP and implement those actions as required approvals and funding
are secured.
− Track the implementation of management strategies for which a BWG member is
responsible to ensure that the BMAP is carried out.
− Inform the Department and the BWG of any permanent obstacles to carrying out
management strategies for which they are responsible, including technical, funding, and
legal obstacles.
− Conduct water quality monitoring (if applicable) according to the monitoring strategy
approved by the BWG.
− Continue to communicate and coordinate actions and funding across BWG member
agencies and community groups with regard to BMAP implementation.
Page 83 of 106

Final Orange Creek Basin Management Action Plan Phase 2 – June 2014
APPENDIX A: REFERENCES
Alachua County Environmental Protection Department. January 2004. Gainesville creeks: Storm event monitoring data 2003. Prepared for St. Johns River Water Management District, Palatka, Florida.
Alachua County Environmental Protection Department. June 2007. Gainesville creeks—A status report on baseflow water quality, stormwater and ecosystem health for the Orange Creek Basin. Prepared for St. Johns River Water Management District, Palatka, Florida.
Burger, C., and W. Magley. September 19, 2003. Total Maximum Daily Load for fecal coliform bacteria for Sweetwater Branch, Alachua County, Florida, WBID 2711. Tallahassee, Florida: Watershed Assessment Section, Florida Department of Environmental Protection.
Cohen, M.S. Lamsal, L. Korhnak and L. Long. 2008. Spatial nutrient loading and sources of phosphorus in the Newnans Lake watershed. Report to the St. Johns River Water Management District, Palatka, FL.
Cohen, M.S. L. Long and L. Korhnak. 2010. Ongoing assessment of nutrient sources to Newnans Lake, Florida. Report to the St. Johns River Water Management District, Palatka, FL.
CH2MHill. 1985. Tumblin Creek stormwater quality evaluation. James E. Scholl, P.E. Gainesville, Florida: CH2MHill.
Clark, W.E., R.H. Musgrove, C.G. Menke, and J.W. Cagle, Jr. 1964. Water resources of Alachua, Bradford, Clay, and Union Counties, Florida. Florida Geological Survey. Report of Investigations No. 35. Tallahassee, Florida.
Gao, X., and D. Gilbert. September 19, 2003. Nutrient Total Maximum Daily Load for Orange Lake, Alachua County, Florida. Tallahassee, Florida: Watershed Assessment Section, Florida Department of Environmental Protection.
Gao, X., D. Gilbert, and W. Magley. January 23, 2006. Nutrient TMDL for Alachua Sink, WBID 2720A. Tallahassee, Florida: Watershed Assessment Section, Florida Department of Environmental Protection.
Gao, X., and D. Gilbert. September 22, 2003. Final Nutrient Total Maximum Daily Load for Newnans Lake, Alachua County, Florida. Tallahassee, Florida: Watershed Assessment Section, Florida Department of Environmental Protection.
Lassiter, A., A. Schwartz, and W. Magley. September 16, 2003. Total Maximum Daily Load for iron for Hatchet Creek, Alachua County, Florida, WBID 2688. Tallahassee, Florida: Watershed Assessment Section, Florida Department of Environmental Protection.
Lippincott, C.L. 2011. Orange Creek Basin Surface Water Improvement and Management Plan. Prepared for St. Johns River Water Management District by Lippincott Consulting LLC. September 12, 2011.
Page 84 of 106

Final Orange Creek Basin Management Action Plan Phase 2 – June 2014
Minogue, P.J., et. al. September 13, 2013. Effectiveness of Silviculture Best Management Practices for Forest Fertilization in Pine Straw Production to Protect Water Quality in Florida: Four Year Monitoring Results and Interpretation. University of Florida. Institute of Food and Agricultural Sciences, North Florida Research and Education Center.
Opper, S.C. 1982. The hydrogeology of Lake Wauberg and vicinity, Alachua County, Florida. Master’s thesis, University of Florida.
Orange Creek Basin Working Group and Florida Department of Environmental Protection. 2008. Support document for the 2007 Orange Creek Basin Management Action Plan. Florida Department of Environmental Protection, Tallahassee, Florida.
Robison, C.P. 1992. An analysis of the Camps Canal Diversion. Palatka, Florida: St. Johns River Water Management District.
Rosenau, J., G. L. Faulkner, C. W. Hendry Jr., and R. W. Hull. 1977. Springs of Florida. Florida Geological Survey Bulletin No. 31. Prepared by the U.S. Geological Survey in cooperation with the Bureau of Geology, Division of Resource Management, and Bureau of Water Resources Management, Florida Department of Environmental Regulation.
Shelley, Z., and W. Magley. September 19, 2003. Total Maximum Daily Load for fecal coliform bacteria for Hogtown Creek, Alachua County, Florida, WBID 2698. Tallahassee, Florida: Watershed Assessment Section, Florida Department of Environmental Protection.
Shelly, Z., and W. Magley. September 19, 2003. Total Maximum Daily Loads for total and fecal coliform bacteria for Tumblin Creek, Alachua County, Florida, WBID 2718A. Tallahassee, Florida: Watershed Assessment Section, Florida Department of Environmental Protection.
Vowell, J.L. 2001. Using Stream Assessment to Monitor Best Management Practice Effectiveness. Forest Ecology and Management 134 (2001) 237-244, Elsevier.
Vowell, J.L. and Frydenborg, R.B. 2004. A Biological Assessment of Best Management Practice Effectiveness During Intensive Silviculture and Forest Chemical Application. Journal of Water, Air, and Soil Pollution: Focus Vol. 4(1), (2004) 299-309.
Weimer, J. 2006. Personal Communication. Park Biologist. Florida State Park Services, Paynes Prairie Preserve State Park.
Wu, T.S., A. Baniukiewicz, and D.K. Gilbert. September 19, 2003. Nutrient Total Maximum Daily Load for Lake Wauberg Outlet, Alachua County, Florida. Tallahassee, Florida: Watershed Assessment Section, Florida Department of Environmental Protection.
Page 85 of 106

Final Orange Creek Basin Management Action Plan Phase 2 – June 2014
APPENDIX B: BACTERIA SOURCE TRACKING PROTOCOL
In response to the adoption of fecal coliforms TMDLs for Sweetwater Branch, Tumblin Creek, and
Hogtown Creek, local stakeholders developed a set of protocols to identify locations with high fecal
coliform bacteria counts and identify and remediate the source. The outcomes of these protocols are
management actions or projects that will be undertaken to reduce bacterial contamination. Previous
sampling and studies led to the identification of priority hotspots, which are locations where consistent
elevated levels of fecal coliforms are found and may be associated with human waste. The toolbox
elements guide the investigation of these hotspots. The basic protocol is distilled in the following steps:
− ACEPD performs ambient sampling, targeted sampling and outfall and storm sewer
reconnaissance, and staff identifies anomalies warranting further investigation
− If source(s) is not identified, ACEPD notifies the other stakeholders.
− Geographic Information Systems mapping with past hot spots is utilized to locate
potential sources, such as wastewater and stormwater infrastructure in the focus area.
There are many potential sources of fecal coliforms bacteria in the urban environment. Some of the
most common ones that are considered include:
− Wastewater collection infrastructure (Figure B-1 and Figure B-2), both private and
GRU.
− OSTDS (Figure B-3).
− Wildlife and domesticated animals that are living near the creeks or in the storm sewer
system.
− Stormwater collection system (Figure B-4) conveyance, storage, illicit connections,
microbial films, and cross connections.
− Runoff from specific land uses including areas with animals, dog parks/walking areas,
and homeless camps.
Page 86 of 106

Final Orange Creek Basin Management Action Plan Phase 2 – June 2014
FIGURE B-1: PRIVATE WASTEWATER COLLECTION SYSTEMS AND PAST PRIORITY HOT SPOTS
Page 87 of 106

Final Orange Creek Basin Management Action Plan Phase 2 – June 2014
FIGURE B-2: GRU WASTEWATER COLLECTION SYSTEM INFRASTRUCTURE AND THE PAST PRIORITY
HOT SPOTS
Page 88 of 106

Final Orange Creek Basin Management Action Plan Phase 2 – June 2014
FIGURE B-3: OSTDS AND THE PAST PRIORITY HOT SPOTS
Page 89 of 106

Final Orange Creek Basin Management Action Plan Phase 2 – June 2014
FIGURE B-4: GAINESVILLE STORMWATER COLLECTION SYSTEM AND PAST PRIORITY HOTSPOTS
From ambient bacterial data collection the ACEPD identify general areas with high fecal coliforms
bacteria counts. They then perform a series of steps including outfall and storm sewer reconnaissance,
as well as target sampling to more accurately locate places with elevated fecal coliforms. The steps in
the protocol are outlined below:
− Staff walks the creeks to identify dry weather flows and potential sources of fecal
coliforms.
Page 90 of 106

Final Orange Creek Basin Management Action Plan Phase 2 – June 2014
− Sampling of storm sewer contributing to the creek or contributing tributary.
− When sampling shows high levels of fecal coliforms, further investigation.
− If flowing storm sewer during dry weather has elevated fecal coliforms, GRU or City of
Gainesville inspects the storm sewer with Alachua County staff in the area using remote
closed circuit television equipment, if necessary.
− If sanitary connection if found, GRU repairs line.
− If sanitary sewer not cause, other sources investigated with methods such as:
− GRU or City of Gainesville may jet and/or vacuum out the storm sewer to remove the
sediment and debris and ACEPD resamples.
− Cameras placed by ACEPD in storm sewer to monitor animal activity.
− FDOT assists, as needed, and performs routine inspections of its system.
− If septic tanks are the potential source, FDOH in Alachua County will inspect suspect
OSTDS.
FDOH in Alachua County has developed tools to support investigations into fecal coliforms sources in
urban creeks. When septic systems are indicated as a potential source FDOH takes the following steps:
− Qualitative evaluation of OSTDS functionality:
o Are there visible signs of system failure? (Yes or No).
− Evaluation of onsite soils to six feet below natural grade:
o Soil series identification per soil survey of Alachua County.
o Textural soils assessment utilizing U.S. Department of Agriculture methodology to six
feet below natural grade.
o Seasonal high water table identification.
− Setback measurements of infiltrative absorption surface of drainfield:
o Horizontal setback determination to creek.
o Vertical separation to seasonal high water table.
Page 91 of 106

Final Orange Creek Basin Management Action Plan Phase 2 – June 2014
− Potential impact to creek evaluated:
o Confirmed impact to creek:
Visible signs of untreated effluent impacting creek.
o Significant potential for adverse impact to creek:
No visible signs of impact to creek.
Horizontal setback to creek of less than 75 feet and/or vertical setback to
seasonal high water table of less than 24 inches.
o Minor potential for adverse impact to creek:
No visible signs of impact to creek.
Horizontal setback of greater than 75 feet.
Vertical setback to seasonal high water table of greater than 24 inches.
Page 92 of 106

Final Orange Creek Basin Management Action Plan Phase 2 – June 2014
FIGURE B-5: OSTDS GRAPHICAL TOOL THAT CAN BE UTILIZED FOR INVESTIGATION OF ELEVATED
FECAL COLIFORMS IN THE GAINESVILLE URBAN CREEKS
ACEPD continually conducts ORI activities systematically assessing flowing outfalls to resolve illicit
discharges and improve water quality. The ORI is an in-stream reconnaissance designed to establish
geospatial locations, record characteristics of individual stormwater system outfalls, and assess the
likelihood of illicit discharges. The ACEPD “hot spots” data were used to select and prioritize creeks
with elevated of fecal coliform concentrations for ORI evaluations. Details describing previous work
conducted by ACEPD in investigating the “hot spot” locations can be found in ACEPD’s May 2008
report, Fecal Coliform Bacteria, Fluorescent Whiting Agents, Bacteriological Indicators, and Microbial
Source Tracking Studies in Gainesville’s Urban Creek Microbial “Hot Spots,” available at:
Page 93 of 106

Final Orange Creek Basin Management Action Plan Phase 2 – June 2014
http://www.alachuacounty.us/Depts/EPD/WaterResources/CreeksAndLakes/Reports%20and%20Maps%
20Documents/ACEPD%20Micro%20Report%202008%20with%20Appendices.pdf.
The reconnaissance consists of systematically walking the selected creeks and recording information on
stormwater system outfalls (storm sewer) and system infrastructure such as: location, material, shape
dimensions (piping), flows, odor, color, turbidity, floatables (e.g., suds, foam, or sheen on the water),
outfall damage, deposits/stains, abnormal vegetation, poor pool quality, and pipe benthic growth.
FDOH in Alachua County assists with issues related to failing septic systems or other “sanitary
nuisances.” GRU provides assistance when needed to further isolate sources of a discharge. GRU has
the specialized equipment to video record the targeted stormwater system lines with closed-circuit
television using a tractor mounted camera. FDOT uses closed-circuit television methods when assessing
the stormwater systems they maintain. ACEPD works cooperatively with FDOT to determine the
source(s) of any illicit discharges they locate and refer to ACEPD for sampling. ACEPD uses a wildlife
camera mounted in selected locations to document the use of the stormwater conveyance system by
wildlife. Wildlife has been found to be a major contributor to fecal coliform in the Gainesville urban
area.
ACEPD continually works with FDOH in Alachua County, the City of Gainesville Public Works
Department, FDOT, and GRU to identify and resolve illicit discharges. The illicit discharge detection
activities conducted by ACEPD, including “hot spots” fecal coliform monitoring, are funded
cooperatively through the Gainesville Clean Water Partnership (City of Gainesville, Alachua County,
and FDOT). A report with further details and the findings of the ORI work (August 2008 through May
2012), Outfall Reconnaissance Inventory August 2008-May 2012, Gainesville, Florida – Tumblin Creek,
Sweetwater branch, Colclough Pond, and Selected Tributaries to Hogtown Creek, can be found at:
http://www.alachuacounty.us/Depts/EPD/WaterResources/CreeksAndLakes/Reports%20and%20Maps%
20Documents/ORI%202008-2012%20Final%20Report.pdf.
Page 94 of 106

Final Orange Creek Basin Management Action Plan Phase 2 – June 2014
APPENDIX C: MANAGEMENT STRATEGIES FROM THE FIRST BMAP ITERATION
The following tables list the management strategies adopted in the first BMAP phase that have been
modified since adoption. Management strategies were grouped in a table by category of activity. The
tables include a description of each project, the lead entity/project partners, cost and funding source(s),
schedule, and anticipated load reductions (if known).
Page 95 of 106

Final Orange Creek Basin Management Action Plan Phase 2 – June 2014
TABLE C-1: AGRICULTURAL BMPS PROJECT NUMBER -
PROJECT NAME / WHICH TYPE OF TMDL
IS ADDRESSED?
WATERBODY NAME / WBID
LEAD ENTITY / PROJECT PARTNERS
COST / SOURCE OF FUNDING / COMPLETION
OR EXPECTED COMPLETION DATE
GENERAL LOCATION / PROJECT DESCRIPTION
MARION01 - Clean Farms Initiative / Addresses Nutrient TMDL
Orange Lake; Lochloosa Lake / 2749; 2738A
Marion County Stormwater Section / Marion County Planning Department; Marion County Extension Service; Marion County Soil & Water Commission; Southwest Florida Water Management District
$55,000 (costs from Marion County General Revenue only) / Marion County Clean Water Assessment; General Revenue; Southwest Florida Water Management District grant / Ongoing
Marion County portion of Orange Creek Basin / The Clean Farms Initiative is designed to assist Marion County farm owners and managers with implementation of BMPs for animal waste and nutrient management and to recognize them for their cooperative efforts. The Initiative was begun by passage of Resolution 04-R-384, by the Marion County Board of County Commissioners, which recognizes the importance of agriculture to the county’s history and economy, while also recognizing the need to protect water resources. As part of the Initiative, a Farm Outreach Coordinator position was created. The Farm Outreach Coordinator position educates on water quality, targeting practices such as manure management and fertilization. Education is provided on BMPs, science-based and field-tested techniques meant to help protect and preserve the integrity of the ground and surface waters. Events and programs, ranging in size from a few to over a thousand, are developed and produced; tabling/networking at equine events is done regularly. Talks and presentations to various groups are also produced and given. Monthly articles written for trade journals, such as The Florida Horse, further enhance one-on-one farm consultations. Partnerships with government, NGO's and community agencies that share common goals are developed and sustained. The Marion County Soil & Water Commission has also established a program to recognize Farms of Environmental Distinction. Provides protection of ground water and surface water as well as wetlands from runoff from equine activities.
NUTRIENT03 - Silviculture BMP Implementation and Compliance / Addresses Nutrient TMDL
Orange Lake; Newnans Lake; Lochloosa Lake; Cross Creek / 2749; 2738A; 2754; 2705B
FDACS, Florida Forest Service / --
Not available / / Ongoing Silviculture lands in Alachua County and Marion County / BMPs for silviculture applied to industrial, public, and private lands. Silviculture BMP implementation and compliance. Silviculture BMPs were established in mid-1970s in response to Clean Water Act, and revised most recently in 2008. These BMPS are the minimum standards for protecting and maintaining water quality during ongoing silviculture activities, including forest fertilization. Ongoing projects include biennial BMP surveys and targeted training. Protection of streams and lakes from surface runoff from silviculture activities.
NUTRIENT06 - Cow/Calf BMPs / Addresses Nutrient TMDL
Newnans Lake; Orange Lake; Lochloosa Lake; Cross Creek / 2749A; 2705B; 2738A; 2754
FDACS, OAWP / Private landowners
Not available / General Inspection Trust Fund / Manual adopted in 2009, Implementation Ongoing
Marion County primarily; Alachua County / Cow/Calf BMP implementation and effectiveness verification. BMP implementation and effectiveness verification will be priority focus for FDACS in this basin as result of TMDL Program. Protection of streams and lakes from surface runoff generated by agricultural operations.
NUTRIENT08 - Sod BMPs / Addresses Nutrient TMDL
Newnans Lake; Orange Lake; Lochloosa Lake; Cross Creek / 2749A; 2705B; 2738A; 2754
FDACS, OAWP / Private landowners
Not available / General Inspection Trust Fund / Manual adopted in 2009, Implementation, Ongoing
Marion County primarily; Alachua County / Sod operation BMP implementation and effectiveness verification. Sod farm acreage in this basin is minimal. FDACS will evaluate need for BMP enrollment and implementation assurance for sod operations. Protection of streams and lakes from surface runoff generated by agricultural operations.
OR06 – Equine BMPs / Addresses Nutrient TMDL
Orange Lake; Newnans Lake; Lochloosa Lake; Cross Creek / 2749A; 2705B; 2738A; 2754
FDACS, OAWP / Private landowners
Not available / General Inspection Trust Fund / Manual adopted March 2012, Implementation Ongoing
Marion County primarily; Alachua County / Horse Farm BMP implementation and effectiveness verification. BMP manual adopted by DACS rule in March 2012. BMP implementation and effectiveness verification will be a priority focus for DACS in this basin as a result of the TMDL program. Protection of streams and lakes from surface runoff generated by agricultural activities.
Page 96 of 106
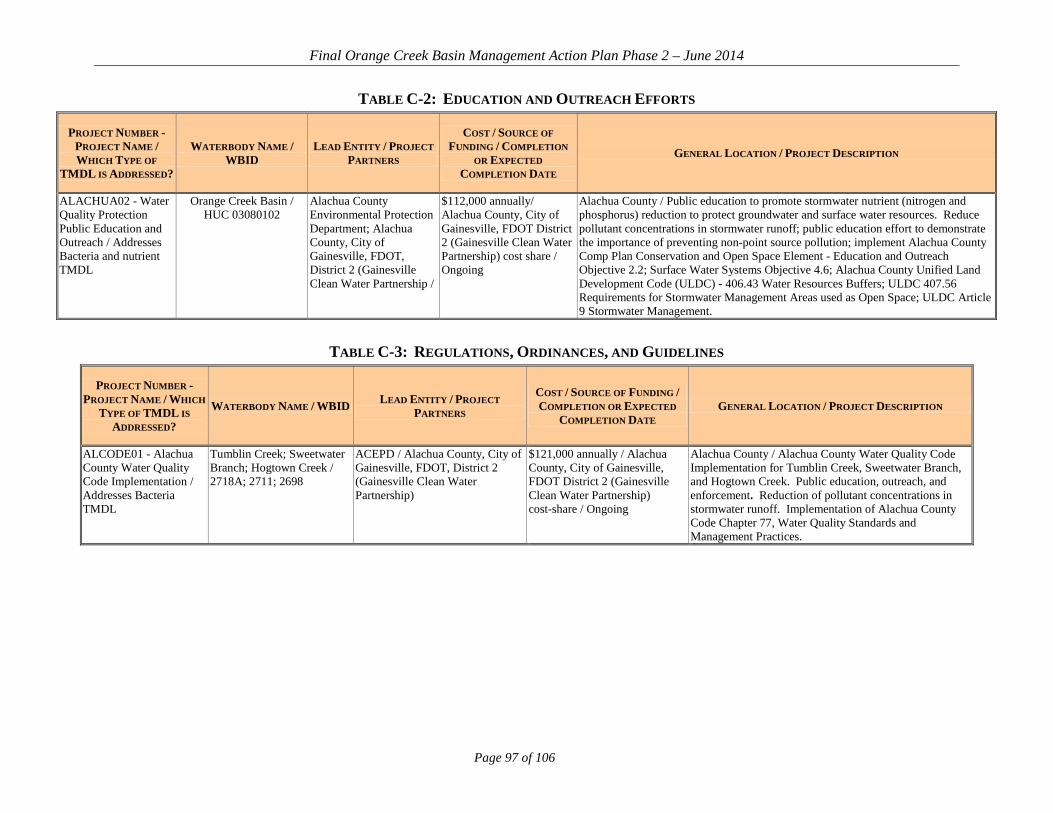
Final Orange Creek Basin Management Action Plan Phase 2 – June 2014
TABLE C-2: EDUCATION AND OUTREACH EFFORTS
PROJECT NUMBER - PROJECT NAME / WHICH TYPE OF
TMDL IS ADDRESSED?
WATERBODY NAME / WBID
LEAD ENTITY / PROJECT PARTNERS
COST / SOURCE OF FUNDING / COMPLETION
OR EXPECTED COMPLETION DATE
GENERAL LOCATION / PROJECT DESCRIPTION
ALACHUA02 - Water Quality Protection Public Education and Outreach / Addresses Bacteria and nutrient TMDL
Orange Creek Basin / HUC 03080102
Alachua County Environmental Protection Department; Alachua County, City of Gainesville, FDOT, District 2 (Gainesville Clean Water Partnership /
$112,000 annually/ Alachua County, City of Gainesville, FDOT District 2 (Gainesville Clean Water Partnership) cost share / Ongoing
Alachua County / Public education to promote stormwater nutrient (nitrogen and phosphorus) reduction to protect groundwater and surface water resources. Reduce pollutant concentrations in stormwater runoff; public education effort to demonstrate the importance of preventing non-point source pollution; implement Alachua County Comp Plan Conservation and Open Space Element - Education and Outreach Objective 2.2; Surface Water Systems Objective 4.6; Alachua County Unified Land Development Code (ULDC) - 406.43 Water Resources Buffers; ULDC 407.56 Requirements for Stormwater Management Areas used as Open Space; ULDC Article 9 Stormwater Management.
TABLE C-3: REGULATIONS, ORDINANCES, AND GUIDELINES
PROJECT NUMBER - PROJECT NAME / WHICH
TYPE OF TMDL IS ADDRESSED?
WATERBODY NAME / WBID LEAD ENTITY / PROJECT PARTNERS
COST / SOURCE OF FUNDING / COMPLETION OR EXPECTED
COMPLETION DATE GENERAL LOCATION / PROJECT DESCRIPTION
ALCODE01 - Alachua County Water Quality Code Implementation / Addresses Bacteria TMDL
Tumblin Creek; Sweetwater Branch; Hogtown Creek / 2718A; 2711; 2698
ACEPD / Alachua County, City of Gainesville, FDOT, District 2 (Gainesville Clean Water Partnership)
$121,000 annually / Alachua County, City of Gainesville, FDOT District 2 (Gainesville Clean Water Partnership) cost-share / Ongoing
Alachua County / Alachua County Water Quality Code Implementation for Tumblin Creek, Sweetwater Branch, and Hogtown Creek. Public education, outreach, and enforcement. Reduction of pollutant concentrations in stormwater runoff. Implementation of Alachua County Code Chapter 77, Water Quality Standards and Management Practices.
Page 97 of 106

Final Orange Creek Basin Management Action Plan Phase 2 – June 2014
TABLE C-4: RESTORATION AND WATER QUALITY IMPROVEMENT PROJECTS
PROJECT NUMBER - PROJECT NAME / WHICH
TYPE OF TMDL IS ADDRESSED?
WATERBODY NAME / WBID
LEAD ENTITY / PROJECT PARTNERS
COST / SOURCE OF FUNDING / COMPLETION OR EXPECTED
COMPLETION DATE GENERAL LOCATION / PROJECT DESCRIPTION
NEW15 - Newnans Lake Annual Aquatic Plant Maintenance Program / Addresses Nutrient TMDL
Newnans Lake / 2705B Invasive Plant Management Section, Habitat and Species Conservation Division, FWC / -
$35,000 annual cost / Invasive Plant Management Program / Ongoing
Newnans Lake, Alachua County / Annual maintenance program for control of non-native species hydrilla, water hyacinth, and water lettuce. Plant control is by herbicide application. Protects native plant communities and reduces organic muck buildup from growth of exotic species.
OR16 - Orange Lake Annual Aquatic Plant Maintenance Program / Addresses Nutrient TMDL
Orange Lake / 2749 Invasive Plant Management Section, Habitat and Species Conservation Division, FWC / -
$750,000 annual cost / Invasive Plant Management Program / Ongoing
Orange Lake / Annual maintenance program for control of non-native species hydrilla, water hyacinth, wild taro, and water lettuce. Protects native plant communities and reduces organic muck buildup from growth of exotic species.
LOCH08 – Lochloosa Lake Annual Aquatic Plant Maintenance Program
Lochloosa Lake / 2738A
Invasive Plant Management Section, Habitat and Species Conservation Division, FWC / -
/ Invasive Plant Management Program / Ongoing
Lochloosa Lake / Annual maintenance program for control of non-native species hydrilla, water hyacinth, wild taro, and water lettuce. Protects native plant communities and reduces organic muck buildup from growth of exotic species.
Page 98 of 106

Final Orange Creek Basin Management Action Plan Phase 2 – June 2014
TABLE C-5: SPECIAL STUDIES AND PLANNING EFFORTS
PROJECT NUMBER - PROJECT NAME / WHICH TYPE OF TMDL IS
ADDRESSED? WATERBODY NAME / WBID LEAD ENTITY / PROJECT
PARTNERS
COST / SOURCE OF FUNDING / COMPLETION
OR EXPECTED COMPLETION DATE
GENERAL LOCATION / PROJECT DESCRIPTION
NEW10 - Spatial Nutrient Loading Dynamics in the Newnans Lake Watershed / Addresses Nutrient TMDL
Newnans Lake / 2688; 2705B; 2728
SJRWMD / -- $151,000 / Legislative appropriation, Water Management Lands Trust Fund / Complete - December 2010
Newnans Lake watershed / To determine external sources of nutrient contributing to Newnans Lake. Data will be collected regarding spatial and temporal dynamics of nutrient pollutant loads in surface waters and ground water in Newnans Lake watershed. Data will be used to refine hydrologic models of nutrient loading to these lakes, critical to PLRG development.
LOCH01 - Development PLRGs for Lochloosa Lake
Lochloosa Lake; Cross Creek / 2738A; 2754
SJRWMD / -- $1,000,000 / SJRWMD ad valorem, Water Management Lands Trust Fund, legislative appropriations, Ecosystems Management Trust Fund, SWIM fund / On hold
Lochloosa Lake watershed / Development of science-based estimates of nutrient external load reductions needed to restore lakes to state water quality standards. Diagnostic studies, water quality data, and hydrologic models used to estimate target nutrient concentrations to meet water quality standards and nutrient load reductions needed to meet targets and restore water quality. Assist Department with development of TMDL.
MARION04 - Orange Creek Watershed Management Plan/ Addresses Nutrient TMDL
Orange Lake / 2749 Marion County Stormwater Section / --
$391,721 / Marion County Clean Water Assessment / Ongoing – estimated completion of current work is February 2014
Marion County portion of Orange Creek Basin (Orange Lake) / Watershed management plans will be completed county-wide and are used to identify and address Marion County water quality issues. The plans will include creation and maintenance of a comprehensive geodatabase for Marion County storm sewer system data, watershed boundaries and hydrologic features county-wide. The plans for Orange Creek have been initiated. The digital elevation model and watershed evaluation elements have been completed. The modeling parameterization, model development and verification, and floodplain analysis and delineation are in progress. The remaining work, the Floodplain Level of Service, the Surface Water Resource Assessment Report and the Capital Projects Report are scheduled for FY14/15, 15/16, and 16/17 respectively. Identify water quality issues and implement corrective actions.
OR01 - Development of PLRGs for Orange Lake / Addresses Nutrient TMDL
Orange Lake / 2749 SJRWMD / -- $1,000,000 / SJRWMD ad valorem, Water Management Lands Trust Fund, legislative appropriations, Ecosystems Management Trust Fund, SWIM fund / On hold
Orange Lake watershed / Development of science-based estimates of nutrient external load reductions needed to restore lakes to state water quality standards. Diagnostic studies, water quality data, and hydrologic models used to estimate target nutrient concentrations to meet water quality standards and nutrient load reductions needed to meet targets and restore water quality. Assist the Department in refinement of TMDL for Orange Lake.
Page 99 of 106

Final Orange Creek Basin Management Action Plan Phase 2 – June 2014
TABLE C-6: BASIC STORMWATER MANAGEMENT PROGRAM IMPLEMENTATION PROJECT NUMBER -
PROJECT NAME / WHICH TYPE OF TMDL IS
ADDRESSED?
WATERBODY NAME / WBID
LEAD ENTITY / PROJECT PARTNERS
COST / SOURCE OF FUNDING / COMPLETION OR EXPECTED
COMPLETION DATE GENERAL LOCATION / PROJECT DESCRIPTION
TP AND / OR TN LOADING REDUCTION
(LBS PER YEAR) URBAN01 - Street Sweeping / Addresses Bacteria and Nutrient TMDL
Hogtown Creek; Sweetwater Branch; Tumblin Creek; Little Hatchet Creek; Lake Forest Creek / 2698; 2711; 2718A; 2695; 2709
City of Gainesville / --
$568,000 / City of Gainesville Stormwater Management Utility Fee / Ongoing
Urban Area / Street sweeping of downtown Gainesville, major collector roads, and residential areas. Benchmark frequency for sweeping downtown area is twice per week in early morning with additional sweeping as needed during special events. Benchmark sweeping frequency for major roads is once every 4 weeks or as needed. Benchmark frequency of sweeping for residential areas is about 9 times annually. Performance measure of debris and sediment collected is 17,000 cubic yards per year. Remove debris, sediment, and potential pollutants from streets. Prevent entry into storm sewer system.
1,908 / 2,976
URBAN04 - State Roads Street Sweeping /Addresses Bacteria and Nutrient TMDL
Hogtown Creek; Sweetwater Branch; Tumblin Creek; Little Hatchet Creek; Lake Forest Creek / 2698; 2711; 2718A; 2695; 2709
FDOT, District 2 / -- $195,755 / FDOT, District 2 / Ongoing
Urban Area / Street sweeping of state roads within urbanized areas that have curb and gutter. Includes US441, SR26, SR20, SR24, SR128, SR 222, and SR121. Areas are swept by City of Gainesville and contract personnel for FDOT. Minimum benchmark sweeping frequency is quarterly. Performance benchmark for debris collected is 385 tons per year. Remove debris, sediment, and potential pollutants from streets. Prevent entry into storm sewer system.
269 / 421
URBAN08 - Alachua County Roads Street Sweeping / Addresses Bacteria and Nutrient TMDL
Hogtown Creek; Sweetwater Branch; Tumblin Creek; Little Hatchet Creek; Lake Forest Creek / 2698; 2711; 2718A; 2695; 2709
Alachua County / -- 113,876 annually / Gas Tax / Ongoing
Urban Area / Sweeping of Alachua County–maintained roads within urbanized area. Benchmark frequency for sweeping of roads with curb and gutter is recurring 60-day cycle. Approximately 3,944,200 lbs/yr of material collected. Remove debris, sediment, and potential pollutants from streets. Prevent entry into storm sewer system.
1,339 / 2,088
URBAN11 - FDOT Storm Sewer Geodatabase – Alachua County / Addresses Bacteria and Nutrient TMDL
HUC 03080102 / Orange Creek Basin /
FDOT, District 2 / Alachua County; City of Gainesville
$109,877 / FDOT, District 2 / Ongoing
Alachua County / Maintain comprehensive geodatabase for FDOT-related storm sewer system data in Alachua County. Coordinate with City of Gainesville and Alachua County Public Works for data compatibility. Provide location information of storm sewer infrastructure and allow for flow modeling and illicit discharge tracking.
Not applicable / Not applicable
URBAN13 - Gainesville Urban Area Storm Sewer Geodatabase / Addresses Bacteria and Nutrient TMDL
HUC 03080102 / Orange Creek Basin /
City of Gainesville / Alachua County, FDOT, District 2 (Gainesville Clean Water Partnership)
$69,000 annually / Alachua County, City of Gainesville cost-share / Ongoing
Gainesville Urban Area / Maintain comprehensive geodatabase for City of Gainesville and Alachua County storm sewer system data, watershed boundaries, and hydrologic features in Gainesville Urban Area. Coordinate with FDOT for data compatibility. Provide location information of storm sewer infrastructure and allow for flow modeling and illicit discharge tracking.
Not applicable / Not applicable
Page 100 of 106

Final Orange Creek Basin Management Action Plan Phase 2 – June 2014
PROJECT NUMBER - PROJECT NAME / WHICH
TYPE OF TMDL IS ADDRESSED?
WATERBODY NAME / WBID
LEAD ENTITY / PROJECT PARTNERS
COST / SOURCE OF FUNDING / COMPLETION OR EXPECTED
COMPLETION DATE GENERAL LOCATION / PROJECT DESCRIPTION
TP AND / OR TN LOADING REDUCTION
(LBS PER YEAR) MARION03 - Street Sweeping of Marion County Roads/ Addresses Nutrient TMDL
Orange Lake / 2749 Marion County Stormwater Section /
$46,000 per year countywide; $80 per year Orange Creek / Ongoing
Marion County portion of basin / Sweeping of Marion County–maintained roads in Orange Creek Basin. Sweeping of roads with curb and gutter is completed 9 times per year. Remove debris, sediment, and potential pollutants from streets. Prevent entry into storm sewer system. At one time Marion County was sweeping roads with swale that had issues with sedimentation collection. However, sweeping an uncurbed road was found to be significantly inefficient and the County moved to only sweeping curb and gutter road systems. There is only one stretch of curb and gutter road in the Orange Creek Basin. It is swept, but actual load contribution is low.
Unknown / Unknown
Page 101 of 106

Final Orange Creek Basin Management Action Plan Phase 2 – June 2014
TABLE C-7: CONSERVATION LAND ACQUISITION/BMP LAND ACQUISITION PROJECT NUMBER -
PROJECT NAME / WHICH TYPE OF TMDL IS
ADDRESSED?
WATERBODY NAME / WBID
LEAD ENTITY / PROJECT PARTNERS
COST / SOURCE OF FUNDING / COMPLETION OR EXPECTED
COMPLETION DATE GENERAL LOCATION / PROJECT DESCRIPTION
OR18 – Barr Hammock, Levy Prairie, Ledwith Lake Land Acquisitions/ Rayonier, Whitehurst, Hare, Perry Tracts, Butler Conservation Easement/ Addresses Nutrient TMDL
Orange Lake 2749 ACEPD/ Florida Communities Trust, North American Wetlands Conservation Act, Farm and Ranchland Protection Program, Private Donors
$15,334,139/ Alachua County Forever Bond proceeds/ Wild Spaces and Public Places sales tax ($4,026,614), Florida Communities Trust, North American Wetlands Conservation Act, Farm and Ranchland Protection Program, private cost share for remainder
Between Wacahoota Road, I-75, SR 121 and Marion County Line/ Land acquisition - Barr Hammock Levy Prairie Ledwith Lake/ No increase in surface runoff of pollutants due to land use change, continued aquifer recharge and ecosystem/habitat preservation; implement Alachua County Comp Plan Conservation and Open Space Element - Alachua County Forever Policy 6.2.1.
NEW02 - Newnans Lake Conservation Area / Addresses Nutrient
Newnans Lake; Hatchet Creek / 2705B;
SJRWMD / -- $5,727,400; $3,000,000 planned / Preservation 2000 / Ongoing
Alachua County; land around north and east side of Newnans Lake / Purchase of lands near and around Newnans Lake for conservation and public use. No increase in surface runoff of pollutants due to land use change.
NEW16 - Duval Neighborhood Stormwater Park Land AcquisitionNEW07 - Wainberg Land Acquisition/ Addresses Nutrient
Newnans Lake; Lake Forest Creek / 2705BNewnans Lake / 2705BHatchet Creek
City of Gainesville / Florida Communities
$238,291 total cost / $140,412 Florida Communities Trust; $97,879 Community Development Block Grant / Complete
East side of Gainesville / Land acquisition for subregional stormwater basin in nature park setting. Future stormwater basin will reduce pollutant load to Newnans Lake. Remainder of site will support ecosystem/habitat preservation, passive recreation, and environmental education.
OR08 - Freddy Wood Land Tract / Addresses Nutrient TMDLOR03 - Lochloosa Wildlife Conservation Area / Addresses Nutrient TMDL
Orange Lake / 2749; 2749A
ACEPD / U.S. Dept. of Agriculture Farm & Ranch Land Protection Program
Not available / Alachua County Forever Bond proceeds; Farm & Ranch Land Protection Program cost-share / Complete
Orange Lake / Land acquisition – Freddy Wood Tract. No increase in surface runoff of pollutants due to land use change, continued aquifer recharge and ecosystem/habitat preservation; implement Alachua County Comp Plan Conservation and Open Space Element - Alachua County Forever Policy 6.2.1.
OR09 - Rayonier Land Tract (River Styx wetland) / Addresses Nutrient TMDLOR08 - Freddy Wood Land Tract / Addresses Nutrient TMDL
Orange Lake / 2733; 2744; 2734
ACEPD / SJRWMD
River Styx / Land acquisition – Rayonier Tract River Styx. No increase in surface runoff of pollutants due to land use change, continued aquifer recharge and ecosystem/habitat preservation; implement Alachua County Comp Plan Conservation and Open Space Element - Alachua County Forever Policy 6.2.1.Orange Lake / Land acquisition – Freddy Wood Tract. No increase in surface runoff of pollutants due to land use change, continued aquifer recharge and ecosystem/habitat preservation; implement Alachua County Comp Plan Conservation and Open Space Element - Alachua County Forever Policy 6.2.1.Alachua County; land around Lochloosa Lake and around north side of Orange Lake / Land acquisition for Lochloosa Wildlife Conservation Area. No increase in surface runoff of pollutants due to land use change.
Page 102 of 106

Final Orange Creek Basin Management Action Plan Phase 2 – June 2014
TABLE C-8: WASTEWATER INFRASTRUCTURE MANAGEMENT, MAINTENANCE, REPAIR, AND UPGRADE PROJECT NUMBER -
PROJECT NAME / WHICH TYPE OF TMDL IS
ADDRESSED?
WATERBODY NAME / WBID
LEAD ENTITY / PROJECT PARTNERS
COST / SOURCE OF FUNDING / COMPLETION OR EXPECTED
COMPLETION DATE GENERAL LOCATION / PROJECT DESCRIPTION
URBAN12 - Sanitary Sewer System Geodatabase / Addresses Bacteria and Nutrient TMDL
HUC 03080102 / Orange Creek Basin
GRU / -- Included as part of Water/Wastewater Engineering Operations and Maintenance Budget / Water/Wastewater Engineering Operations and Maintenance Budget / Ongoing
Gainesville and environs (GRU Service Area) / Maintain comprehensive geodatabase for all GRU sanitary sewer system data. This includes any geodata acquired from studies related to water quality, such as septic tank studies and inflow and infiltration data. Provide location information of sewer infrastructure.
NUTRIENT02 - Main Street Water Reclamation Facility Annual Operation and Maintenance / Addresses Nutrient TMDL
Sweetwater Branch; Alachua Sink / 2720A; 2711
GRU / -- $14.987 million FY 2002-2006, about $3 million /year (includes cost of Kanapaha Water Reclamation Facility); $4.972 million FY 2007; $6,251,519 FY 2008; $6,293,107 FY 2009; $4,741,954 FY 2010; $5,230,561 FY 2011; $5,252,123 FY 2012/ $5,468,836 FY 2013 / GRU ratepayers / Ongoing
City of Gainesville / Alachua County / Maintenance to keep both water reclamation facilities in compliance with existing NPDES permit requirements. NPDES permit for domestic wastewater discharge. Maintain compliance with NPDES permit.
NUTRIENT09 - Main Street Water Reclamation Facility Phosphorus Removal Chemical Feed System / Addresses Nutrient TMDL
Sweetwater Branch; Alachua Sink / 2720A; 2711
GRU / -- FY 2013 $932,707 & $1,552,879 total GRU ratepayers / Ongoing
City of Gainesville / Alachua County / Maintenance to keep both water reclamation facilities in compliance with existing NPDES permit requirements. NPDES permit for domestic wastewater discharge. Maintain compliance with NPDES permit.
BACTERIA07 - Inflow and Infiltration Project - Phases I, II and III / Addresses Bacteria TMDL
Tumblin Creek; Sweetwater Branch; Hogtown Creek / 2718A; 2711; 2698
GRU / -- $2.372 million FY 2002-6, about $474,000 /year; $67,523 FY 2007; $550,088 FY 2008; $106,670 FY 2009; $187,328 FY10; $149,704 FY 2011; $242,147 FY 2012; $210,045 FY 2013 / GRU ratepayers / Ongoing
GRU Wastewater Collection System Service Area (115 square miles) including Urban Creek Watersheds / Inflow and Infiltration Project - Phases I, II, and III comprise intensive wastewater collection system integrity testing that utilizes smoke testing, dye testing, closed-circuit TV camera, and visual inspection to identify pipes with inflow and infiltration problems. Inspection followed by remedial repair of system defects. Phase III concentrated on covering all of GRU wastewater service area in Hogtown Creek, Tumblin Creek, and Sweetwater Branch watersheds. Minimizes possibility of wastewater releases. Though no association between background fecal coliform levels and GRU's wastewater collection system has been established, decreased probability of any contribution to fecal background levels is benefit of this project. ***Separation of project areas not feasible due to complexity and extent of GRU wastewater collection system service area projects.
Page 103 of 106

Final Orange Creek Basin Management Action Plan Phase 2 – June 2014
PROJECT NUMBER - PROJECT NAME / WHICH
TYPE OF TMDL IS ADDRESSED?
WATERBODY NAME / WBID
LEAD ENTITY / PROJECT PARTNERS
COST / SOURCE OF FUNDING / COMPLETION OR EXPECTED
COMPLETION DATE GENERAL LOCATION / PROJECT DESCRIPTION
BACTERIA08 - Sliplining Projects / Addresses Bacteria and Nutrient TMDL
Tumblin Creek; Sweetwater Branch; Hogtown Creek / 2718A; 2711; 2698
GRU / -- $4.7 million FY 1998-2006, about $522,000 /year; $203,922 FY 2007; $23,061 FY 2008; $421,005 FY 2009; $1,287,128 FY2010; $1,565,465 FY 2011; $2,230,574 FY 2012; $1,839,896 FY 2013 / GRU ratepayers / Ongoing
GRU Wastewater Collection System Service Area (115 square miles) including Urban Creek Watersheds / Trenchless restoration of City of Gainesville's wastewater collection system through sliplining. Though sliplining has been performed all over Gainesville wastewater service area, major part of work was performed in Tumblin Creek, Sweetwater Branch, and Hogtown Creek watersheds (>$1 million). Sliplining minimizes possibility of wastewater releases to creek. Though no association between background fecal coliform levels and GRU's Wastewater Collection System has been established, decreased probability of any contribution to fecal background levels is benefit of this project. ***Separation of project areas not feasible due to complexity and extent of GRU wastewater collection system service area.
BACTERIA09 - GRU Lift Station Annual Operation and Maintenance / Addresses Bacteria TMDL
Tumblin Creek; Sweetwater Branch; Hogtown Creek / 2718A; 2711; 2698
GRU / -- $1.236 million FY 2002-6, about $247,000 /year; $435,811 FY 2007; $498,225 FY 2008; $384,577 FY 09; $937,778 FY10; $1,220,499 FY 2011; $1,401,871 FY 2012; $1,734,192 FY 2013/ GRU ratepayers / Ongoing
GRU Wastewater Collection System Service Area (115 square miles) including Urban Creek Watersheds / Maintenance of City of Gainesville's wastewater collection system to maintain system integrity of lift stations. Includes control cabinet replacements, wet well coating, pump replacements, generators, odor control, soft start replacements, and overall lift station upgrades. Though no association between background fecal coliform levels and GRU's Wastewater Collection System has been established, decreased probability of any contribution to fecal background levels is benefit of this project. ***Separation of project areas not feasible due to complexity and extent of GRU wastewater collection system service area projects.
BACTERIA10 - GRU Wastewater System Capital Projects / Addresses Bacteria TMDL
Tumblin Creek; Sweetwater Branch; Hogtown Creek / 2718A; 2711; 2698
GRU / -- $52.542 million FY 2002-6, about $10.508 million /year; $7.919 million FY 2007; $6,820,747 FY 2008; $7,545,399 FY 2009; $7,765,300 FY10; $6,643,059 FY 2011; $9,143,825 FY 2012; $16,679,941 FY 2013 / GRU ratepayers / Ongoing
GRU Wastewater Collection System Service Area (115 square miles) including Urban Creek Watersheds / Capital improvements to City of Gainesville wastewater treatment and collection system. Includes all capital projects. Projects may include upgrades to force mains and gravity mains with rehabilitation and restoration force main rerouting, collection system integrity testing, air release valve replacement, sliplining, lift station abandonment, manhole replacement, service lateral cleanout, and miscellaneous repair, wastewater treatment facility upgrades and expansion. Though no association between background fecal coliform levels and GRU's Wastewater Collection System has been established, decreased probability of any contribution to fecal background levels is benefit of this project. ***Separation of project areas not feasible due to complexity and extent of GRU wastewater collection system service area projects.
Page 104 of 106

Final Orange Creek Basin Management Action Plan Phase 2 – June 2014
PROJECT NUMBER - PROJECT NAME / WHICH
TYPE OF TMDL IS ADDRESSED?
WATERBODY NAME / WBID
LEAD ENTITY / PROJECT PARTNERS
COST / SOURCE OF FUNDING / COMPLETION OR EXPECTED
COMPLETION DATE GENERAL LOCATION / PROJECT DESCRIPTION
BACTERIA11 - GRU Wastewater Collection System Annual Rehabilitation and Replacement / Addresses Bacteria TMDL
Tumblin Creek; Sweetwater Branch; Hogtown Creek / 2718A; 2711; 2698
GRU / -- $14.129 million FY 2002-6, about $2.826 million /year; $906,043 FY 2007; $552,809 FY 2008; $648,685 FY 2009; $1,147,712 FY10; $1,098,648 FY 2011; $1,225,083 FY 2012; $1,448,158 FY 2013 /GRU ratepayers / Ongoing
GRU Wastewater Collection System Service Area (115 square miles) including Urban Creek Watersheds / Rehabilitation and replacement of City of Gainesville's wastewater collection system to maintain system integrity. Minimizes possibility of wastewater release. Includes rehabilitation and upgrade of existing force mains and gravity mains. Though no association between background fecal coliform levels and GRU's Wastewater Collection System has been established, decreased probability of any contribution to fecal background levels is benefit of this project. ***Separation of project areas not feasible due to complexity and extent of GRU wastewater collection system service area projects.
BACTERIA12 - GRU Lift Station Rehabilitation and Replacement / Addresses Bacteria TMDL
Tumblin Creek; Sweetwater Branch; Hogtown Creek / 2718A; 2711; 2698
GRU / -- $4.29 million FY 2002-6, about $878,000 /year; $567,971 FY 2007; $1,051,377 FY 2008; $417,329 FY 2009; $887,492 FY10; $1,636,262 FY 2011; $1,127,401 FY 2012; $725,139 FY 2013 / GRU ratepayers / Ongoing
GRU Wastewater Collection System Service Area (115 square miles) including Urban Creek Watersheds / Rehabilitation and replacement of City of Gainesville's wastewater collection system to maintain system integrity. Helps minimize possibility of wastewater release. Includes GRU Lift Station Rehabilitation and Replacement; Upgrades; Abandonment plus extension. Though no association between background fecal coliform levels and GRU's Wastewater Collection System has been established, decreased probability of any contribution to fecal background levels is benefit of this project. ***Separation of project areas not feasible due to complexity and extent of GRU wastewater collection system service area projects.
BACTERIA13 - GRU Wastewater Collection System Annual Operation and Maintenance / Addresses Bacteria TMDL
Tumblin Creek; Sweetwater Branch; Hogtown Creek / 2718A; 2711; 2698
GRU / -- $8,874 million FY 2002-6, about $1.775 million /year; 1.819 million FY 2007; $2,006,830 FY 2008; $1,791,441 FY 2009 ; $1,630,491 FY 2010; $1,800,409 FY 2011; $1,826,814 FY 2012; $1,936,553 FY 2013/ GRU ratepayers / Ongoing
GRU Wastewater Collection System Service Area (115 square miles) including Urban Creek Watersheds / GRU Wastewater Collection System Annual Operation and Maintenance to maintain system integrity. Minimizes possibility of wastewater release. Includes rehabilitation and upgrade of existing force mains and gravity mains. Though no association between background fecal coliform levels and GRU's Wastewater Collection System has been established, decreased probability of any contribution to fecal background levels is benefit of this project. ***Separation of project areas not feasible due to complexity and extent of GRU wastewater collection system service area projects.
BACTERIA14 - Water/Wastewater Engineering Dept. Annual Operation and Maintenance Services / Addresses Bacteria and Nutrient TMDL
Hogtown Creek; Tumblin Creek; Sweetwater Branch; Alachua Sink / 2698; 2711; 2718A; 2720A
GRU / -- $2.737 million for FY 2002-6, about $547,000 /year; $649,999 FY 2007; $662,688 FY 2008; $672,974 FY 2009; $667,030 FY10; $733,034 FY 2011; $738,314 FY 2012; $738,299 FY 2013 / GRU ratepayers / Ongoing
GRU Wastewater Collection System Service Area (115 square miles) including Urban Creek Watersheds / Water/wastewater Engineering Dept. executes five-year scheduling system for initiating and administrating wastewater capital projects. Projects are timed and prioritized to ensure that facilities are available in timely manner to meet demands as needed to correct existing flow deficiencies, meet existing and future demands, maintain or improve system reliability and maintainability, minimize contamination potential, and comply with Florida Statutes, including concurrence requirements. Though no association between background fecal coliform levels and GRU's Wastewater Collection System has been established, decreased probability of any contribution to fecal background levels is benefit of this project.
Page 105 of 106

Final Orange Creek Basin Management Action Plan Phase 2 – June 2014
PROJECT NUMBER - PROJECT NAME / WHICH
TYPE OF TMDL IS ADDRESSED?
WATERBODY NAME / WBID
LEAD ENTITY / PROJECT PARTNERS
COST / SOURCE OF FUNDING / COMPLETION OR EXPECTED
COMPLETION DATE GENERAL LOCATION / PROJECT DESCRIPTION
BACTERIA15 - GRU Wastewater Collection System Annual Service Lateral Rehabilitation and Replacement / Addresses Bacteria TMDL
Hogtown Creek; Sweetwater Branch; Tumblin Creek / 2698; 2711; 2718A
GRU / -- $1.765 million for FY 2002-6, $353,000 /year; $414,653 FY 2007; $220,473 FY 2008; $218,068 FY 2009; $331,154 FY10; $543,650 FY 2011; $379,022 FY 2012; $458,104 FY 2013/ GRU ratepayers / Ongoing
GRU Wastewater Collection System Service Area (115 square miles) including Urban Creek Watersheds / Rehabilitation and replacement of City of Gainesville's wastewater collection system to maintain system integrity, specifically service laterals and cleanouts. Though no association between background fecal coliform levels and GRU's Wastewater Collection System has been established, decreased probability of any contribution to fecal background levels is benefit of this project. ***Separation of project areas not feasible due to complexity and extent of GRU WW collection system service area projects.
Page 106 of 106