Basics of Systolic Function - American Society of...
21
1/18/2017 1 Basics of Systolic Function Vera H. Rigolin, MD Professor of Medicine Northwestern University Feinberg School of Medicine Medical Director, Echocardiography Laboratory Northwestern Memorial Hospital Chicago, Illinois President-Elect, American Society of Echocardiography Disclosures • None that pertain to this presentation
Transcript of Basics of Systolic Function - American Society of...

1/18/2017
1
Basics of Systolic Function
Vera H. Rigolin, MDProfessor of Medicine
Northwestern University Feinberg School of MedicineMedical Director, Echocardiography Laboratory
Northwestern Memorial HospitalChicago, Illinois
President-Elect, American Society of Echocardiography
Disclosures
• None that pertain to this presentation

1/18/2017
2
Introduction
• Quantification of LV chamber size and function is the cornerstone of cardiac imaging
• Echo is the most commonly used non-invasive modality
• Standardization of methodology and interpretation is critical to patient care

1/18/2017
3
Linear Measurements
• Performed in the parasternal long axis view
• Measurement perpendicular to the LV long axis
• Measurement immediately below the MV leaflet tips
• 2D measurements preferred over M-mode
• Accurate in normal hearts, but uni-dimensional nature suboptimal for diseased ventricle
Volumetric Measurements
• Can be made with 2D or 3D echo
• Measurements made by tracing the interface between compacted myocardium and LV cavity
• Apical 4 and 2 chamber views used for 2D biplane measurement
• Contour closed at the mitral valve level by connecting the two opposite sections with a straight line
• LV length defined as the middle of the line at the mitral valve to most distant point of LV contour

1/18/2017
4
2 D LV Volumes and EF
LV Volumes/EF
– Volumes obtained from apical 4 and 2 chamber views
– EF calculated using modified Simpson’s method or disk summation method
The Echo Manual – 2nd Edition. Oh, JK et al (eds).
Lippincott Williams and Wilkins, 1999
Calculated vs Visual LVEF
• 43 studies were included in meta analysis
• Bland-Altman limits of agreement (95% CI) evaluated for Simpson’s rule and visual EF vs MUGA or cath EF
• Simpson’s rule, LVEF differences ranged from 7% to 25% (median 18%);
• Subjective visual assessment, LVEF differences ranged from 16% to 24% (median 19%).
• Harmonic imaging and contrast not used routinely
McGowen et al. Am Heart J 2003;146:388-397

1/18/2017
5
Accuracy of LVEF Using Four Different Methods
A=Fund
B=Fund+Cont
C=Harm
D=Harm+Cont
Nahar et al. Am J Cardiol 2000;86:1358-62
Can I Accurately Calculate the EF?

1/18/2017
6
Can I Accurately Calculate the EF Now?
Simpson’s Biplane EF

1/18/2017
7
Normal Values for LV Dimensions, volumes and EF
WASE Study – What does a normal echo look like across different ethnic groups?
• Observational, Cross-sectional
• ASE and its international alliance partners and global
partners
• Prospective Enrollment of 1700 healthy volunteers
• Biospecimen: single Echocardiogram
Dr Roberto Lang, WASE PI
Dr Federico Asch, WASE Co-PI

1/18/2017
8
Case Example
• 58 yr old female diagnosed with HER-2 positive, metastatic breast CA in 2004
• She was initially treated with AC, taxol followed by Trastuzumab
• MUGA EF prior to chemo=61%
• Followup MUGA: EF=34%
• Trastuzumab was stopped
Echo after stopping Trastuzumab
LVEF=36%

1/18/2017
9
Echo after heart failure treatment
LVEF=55%
Echo 1 yr later with continued Trastuzumab therapy
LVEF=45%

1/18/2017
10
LV Segments
Coronary Territories

1/18/2017
11
2D vs 3D Transducers
4 Chamber View

1/18/2017
12
2D and 3D Echo EF vs MR EF2D echo 3D Echo
Jenkins C et al. J Am Coll Cardiol 2004;44:878-86

1/18/2017
13
45 year old woman s/p mitral valve repair who also received chemo and XRT for breast cancer

1/18/2017
14
LV EF and Volumes
3D Echo Normal Values

1/18/2017
15
Longitudinal VelocityLongitudinal velocity
Systole
IVC
IVR
EA
Velocity
Diastole
Peak Systole
Adapted from Isaaz K. Current Opinions in Cardiology 2002; 17:431-442.
Lateral and Septal most reproducible.
Sa peak systolic myocardial velocity- absolute
Ea early diastolic myocardial velocity- absolute
Aa late diastolic myocardial velocity-absolute
10.8 ± 2.716.0 ± 3.710.9 ± 2.1Posterior
9.0 ± 3.613.2 ± 3.810.4 ± 2.0Anterior
10.1 ± 2.312.5 ± 2.69.3 ± 1.5Septal
9.5 ± 2.616.7 ± 3.910.8 ± 2.0Lateral
Aa (cm/sec)Ea (cm/sec)Sa (cm/sec)
Normal Pulsed DTI Velocities

1/18/2017
16
Myocardial Deformation Imaging:3 Principle Vectors in Strain
Longitudinal: apical view
Circumferential: parasternal view
Radial: parasternal viewJ Am Coll Cardiol. 2011;58(14):1401-1413.
• Strain is total deformation during the cardiac cycle relative to the initial length at the onset of the cardiac cycle.
– ε = (L - L0)/ L 0
• Strain is dimensionless and expressed in percentages.
Strain (ε)

1/18/2017
17
Strain ImagingStrain = % change in length of the myocardium
during relaxation and contraction
LALB
Strain =- LALB
LA
=DL
LA
LA = Myocardial length at end diastole
LB = Myocardial length at end systole
Courtesy of Ben Freed, MD
J Am Coll Cardiol. 2011;58(14):1401-1413
Speckle Tracking
1/18/2017
18
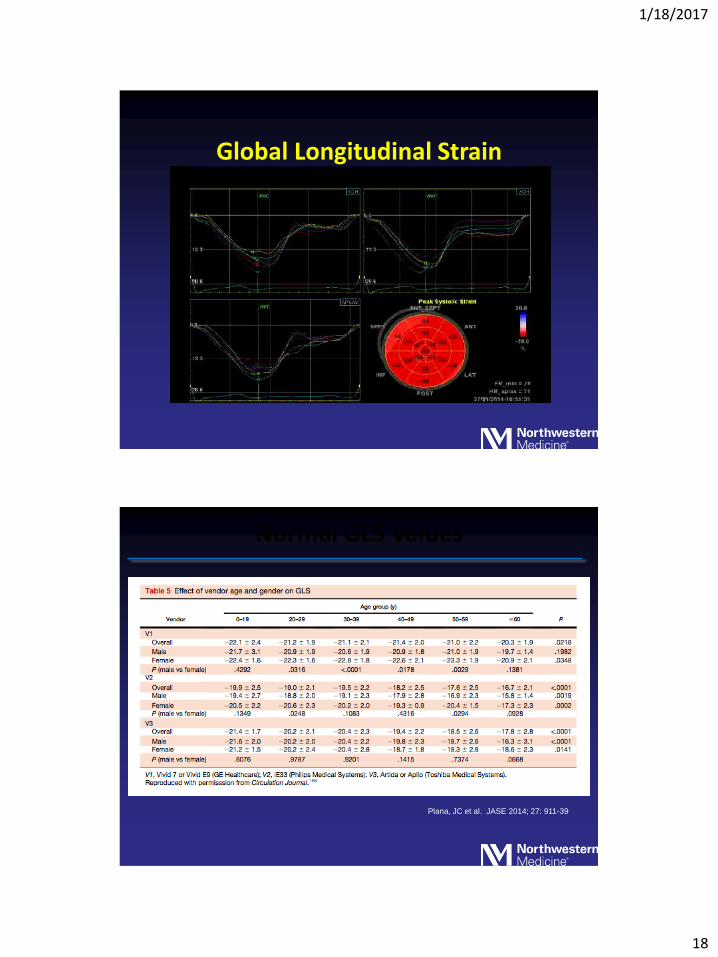
Global Longitudinal Strain
Normal GLS Values
Plana, JC et al. JASE 2014; 27: 911-39

1/18/2017
19
Twist-Torsion
Rüssel IK et al. J Am Coll Cardiol Imaging 2009;2(5):648-655
Twist-Torsion
• Can be assessed by tissue Doppler or speckle tracking
• Normal heart has pos rotation at base and neg at apex
• The difference between the two represents the total rotation
• Total rotation divided by the distance between the two analyzed segments results in calculation of torsion (the twist in degrees divided by the distance)

1/18/2017
20
Twist/Torsion in normal (top) and in pt with reduced LVEF (bottom)
Feigenbaum’s textbook of echocardiography, 6th ed
Copyright ©2009 American College of Cardiology Foundation. Restrictions may apply.
Tan, Y. T. et al. J Am Coll Cardiol 2009;54:36-46
Peak Apical Rotation and Untwist

1/18/2017
21
Summary
• Assessment of LV systolic function is the most frequently used tool in echo
• Accurate and reproducible measurements are critical for patient care
• 2D volumes and EF are most common measurements
• 3D echo has advantages over 2D echo
• Strain imaging shows promise
• Greater appreciation to differences in LV size and function according to gender and race
Thank You