
Basics of DCT, Quantization -...
34
1 Basics of DCT, Quantization and Entropy Coding Nimrod Peleg Update: April. 2007 Discrete Cosine Transform (DCT) • First used in 1974 (Ahmed, Natarajan and Rao). • Very close to the Karunen-Loeve * (KLT) transform (or: Hotelling ** Transform), that produces un-correlated coefficients • Coefficients can be quantized using visually- weighted quantization values. • A fast algorithm is available and similar to FFT. * Named after Kari Karhunen and Michel Loève ** Named after Harold Hotelling
Transcript of Basics of DCT, Quantization -...

1
Basics of
DCT,
Quantization
and
Entropy Coding
Nimrod Peleg
Update: April. 2007
Discrete Cosine Transform
(DCT)
• First used in 1974 (Ahmed, Natarajan and Rao).
• Very close to the Karunen-Loeve* (KLT) transform (or: Hotelling** Transform), that produces un-correlated coefficients
• Coefficients can be quantized using visually-weighted quantization values.
• A fast algorithm is available and similar to FFT.
* Named after Kari Karhunen and Michel Loève
** Named after Harold Hotelling

2
DCT Based Compression• HVS response is dependent on spatial frequency.
• We decompose the image into a set of waveforms, each with a particular spatial frequency
• DCT is a real transform.
• DCT de-correlating performance is very good.
• DCT is reversible (with Inverse DCT).
• DCT is a separable transform.
• DCT has a fast implementation (similar to FFT)
1/ 2 1
( ) ( ) ( )
0
( )
2 (2 1)
2
1 for i=02
1 Otherwise
N
u i i
i
i
uF A cos i f
N N
A
1D DCT* Transform:
*: one of four definitions !
DCT (Discrete Cosine Transform)
• The DCT helps separate the image into parts (or
spectral sub-bands) of differing importance, with
respect to the image's visual quality.

3
2D - DCT
• Image is processed one 8x8 block at a time
• A 2-D DCT transform is applied to the block:
– Perform nearly as well as the ideal K-L transform
– Closely related to the DFT transform
– Computationally efficient
7 7
0 0
( ) ( ) (2 1) (2 1)( , ) ( , )cos cos
4 16 16x y
C u C v x u y vF u v f x y
DCT coefficients Samples1
0( ) 2
1 0
nC n
n
2D-DCT Basic Functions
Original
image blockDC (flat) basis
functionAC basis functions
0
1

4
Why DCT and not FFT?
• DCT is similar to the Fast Fourier Transform
(FFT), but can approximate lines well with fewer
coefficients
A better
“De-Correlator”:
Concentrates energy
In the
“lower Frequencies”
Computing the 2D DCT • Factoring reduces problem to a series of 1D DCTs:
– apply 1D DCT (Vertically) to Columns
– apply 1D DCT (Horizontally) to resultant Vertical DCT
• Or alternatively Horizontal to Vertical.
Most software implementations use fixed point arithmetic.
Some fast implementations approximate coefficients so all
multiplies are shifts and adds.
World record is 11 multiplies and 29 adds. (C. Loeffler, A. Ligtenberg and G. Moschytz,
"Practical Fast 1-D DCT Algorithms with 11 Multiplications",
Proc. Int'l. Conf. on Acoustics, Speech, and Signal Processing 1989 (ICASSP `89), pp. 988-991)

5
1-D DCT Correlation Removal(original signal : yellow, DCT: green)
And in numbers...
670.0000 -308.3878 229.6567 231.0802
-120.2082 -509.6407 203.3661 69.0309
DCT Coeff. Values (Not normalized)
20 60 10 -90 80 120 20 115
Original Values
DCT
Compression ???
6
And the Answer ...
Quantization of DCT Coeff.
• Quantization reduces accuracy of the coefficients
representation when converted to integer.
• This zero‟s many high frequency coefficients.
• We measure the threshold for visibility of a given
basis function (coefficient amplitude that is just
detectable by human eye).
• We divide (Quantize) the coefficient by that value
(+ appropriate rounding to integer).

7
What is Quantization ?
• Mapping of a continuous-valued signal value x(n) onto a limited set of discrete-valued signal y(n) : y(n) = Q [x(n)]
such as y(n) is a “good” approximation of x(n)
• y(n) is represented by a limited number of bits
• We define Decision levels and Representation levels
Inverse Quantization
-9 -8 -7 -6 -5 -4 -3 -2 -1 0 1 2 3 4 5 6 7 8 9
-2 -1 0 1 2
-8 -4 0 4 8
Un-Quantized
DCT Coeff.
Quantization
Intervals
Quantized
DCT Coeff.
De-Quantized
DCT Coeff.

8
Inverse Quantization (Cont‟d)
Note that:
• Quantization factor is 4 (for the given example)
– A half of the Q-factor (i.e 2 for the above) is added to
coefficient magnitude before it is divided and truncated
– done in JPEG
• Linear quantization: for a given quantization value,
steps are uniform in size
• 8-bit sample transforms to 11-bit quantized DCT
coefficients, for Q value of 1
– for an 8-bit sample, quantization value of 16 produces 7-bit
DCT coefficients)
Luminance Q-Table
16 11 10 16 24 40 51 61
12 12 14 19 26 58 60 55
14 13 16 24 40 57 69 56
14 17 22 29 51 87 80 62
18 22 37 56 68 109 103 77
24 35 55 64 81 104 113 92
49 64 78 87 103 121 120 101
72 92 95 98 112 100 103 99

9
Chrominance Q-Table
17 18 24 47 99 99 99 99
18 21 26 66 99 99 99 99
24 26 56 99 99 99 99 99
47 66 99 99 99 99 99 99
99 99 99 99 99 99 99 99
99 99 99 99 99 99 99 99
99 99 99 99 99 99 99 99
99 99 99 99 99 99 99 99
Quality Factor• For other quality factors, the elements of
these quantization matrices are multiplied by the compression factor α, defined as:
• The minimum legal α·Q(u,v) is 1
– This cannot be a lossless compression !!!
501 _ 50
_
2 _2 51 _ 99
100
q JPEGq JPEG
q JPEGq JPEG
Quantization table and quality factor are not specified in the
Standard – just recommended (Annex K)

10
Notes on Q-Tables
• Visibility measured for:
– 8x8 DCT basis functions
– Luminance resolution: 720x576
– Chrominance resolution: 360x576
– Viewing distance: 6 times screen width
• Noticeable artifacts on high-quality displays, since
little is known about visibility thresholds when
more than one coefficient is zero (simultaneously)
More About JPEG DCT Process
• Zero-shift on input samples to convert range
from 0:255 to -128:127, reduces internal
precision requirements in DCT calculations.
• DCT is always done on 8x8 blocks:
– Spatial frequencies in the image and of the
cosine basis are not precisely equivalent.
– “Blocking artifacts” appear if not enough AC
coeff. are taken.
11
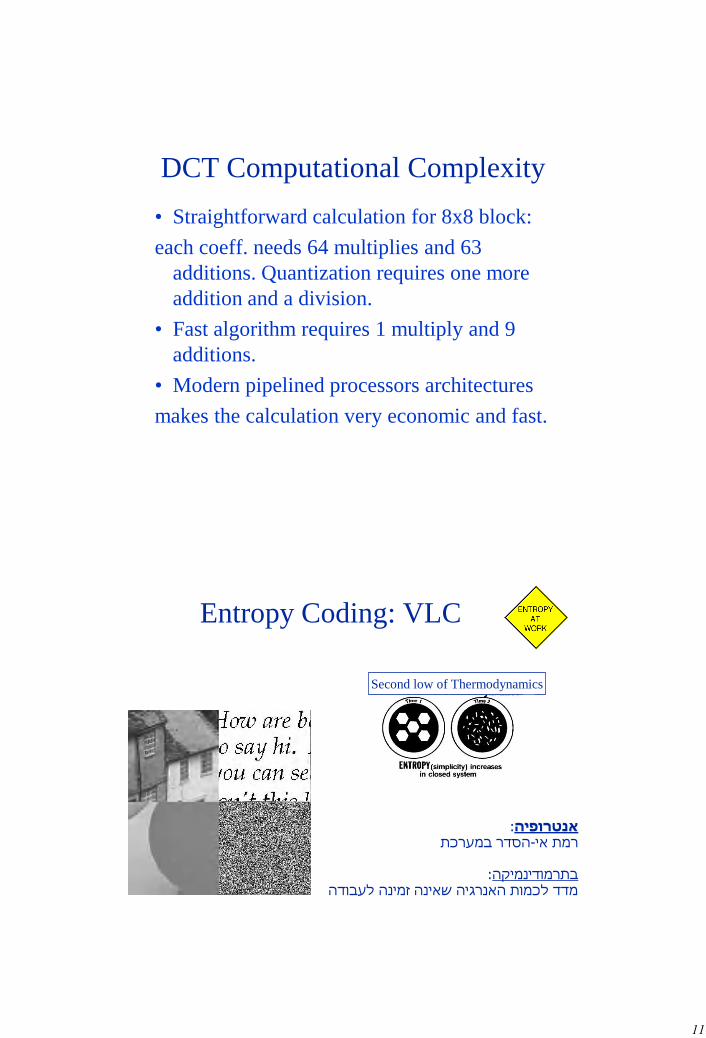
DCT Computational Complexity
• Straightforward calculation for 8x8 block:
each coeff. needs 64 multiplies and 63
additions. Quantization requires one more
addition and a division.
• Fast algorithm requires 1 multiply and 9
additions.
• Modern pipelined processors architectures
makes the calculation very economic and fast.
Entropy Coding: VLC
:אנטרופיההסדר במערכת-רמת אי
בתרמודינמיקה:מדד לכמות האנרגיה שאינה זמינה לעבודה
Second low of Thermodynamics

12
Entropy Encoding
• Amount of information in a symbol: FPi
log 21
• Entropy of an Image:
“Average amount of information”
• A source with M possible symbols, With a
uniform distribution:
M
i
PiPiH1
21 [bit] log
• Shannon Theorem:
H= minimum number of bits to code the source
The Shannon Theorem
• Shannon (1948) showed that for the coding of
a discrete (independent) source, a uniquely
decodable binary code exists, with average
codeword length : H(Y(n)) Save
• Shannon also showed that for this source, a
binary prefix code (such as Huffman) exists,
and holds: Save H(Y(n)) +1

13
The Shannon Theorem (Cont‟d)
• If N independent symbols are taken together
we get: Save H(Y(n)) +1/N
• For very large N , Save is very close to the
entropy, but the practical problems become
severe:
– coding delay
– complexity
– size of VLC tables
k-th order entropy 1/2
• For an „alphabet‟ A (set of symbols):
M
xx
kkk
kAk
xxPxxPk
H...1
[bit] ),...(log),...(1
121
• The important property of the entropy is:
0)()(2log 1 XHXHA kk
• The expected value (per-letter in „A‟ !) is
always grater than or equal to entropy:
)(
),...( 1XH
n
XXLEn
n
Shannon, Theorem 1

14
k-th order entropy 2/2
• Shannon, Theorem 2
There exists a coding algorithm such that:
n
XHn
XXLEn
n 1)(
),...( 1
• Important to remember:
for a “memoryless” source (symbols are
independent): entropy of any order is equal
to the first order entropy !
Influence of block length
• Does theorem 2 mean that for memory-less
source, we can reach entropy by 1-symbol
blocks?
Consider a binary source with entropy : H1=0.4
According to the above, the lower bound is H1 +1/n ,
with n=1 we get : 0.5 + 1 =1.5 bpp
But …
we can easily do it with 1 bpp ….

15
Huffman Coding
– The symbol with the highest probability is
assigned the shortest code and vice versa.
– Codewords length is not fixed (VLC)
– A codeword cannot be a prefix for another
codeword (Self Synchronized Code)
Huffman Coding Example
Q1
Q2
Q3
Q4
Q5
Q6
Q7
Q8
0.4
0.2
0.12
0.08
0.08
0.08
0.03
0.01
Symbol Pi Binary
000
0.04
0.12
0.16
0.24
0.36
0.6
1.0
1
1
1
1
1
1
1
0
0
0
0
0
0
Huffman
1
0 1 1
00 0 1
0 1 0 1
0 1 0 0
0 0 0 1
0 0 0 0 1
0 0 0 0 0
001
010
011
100
101
110
111
16
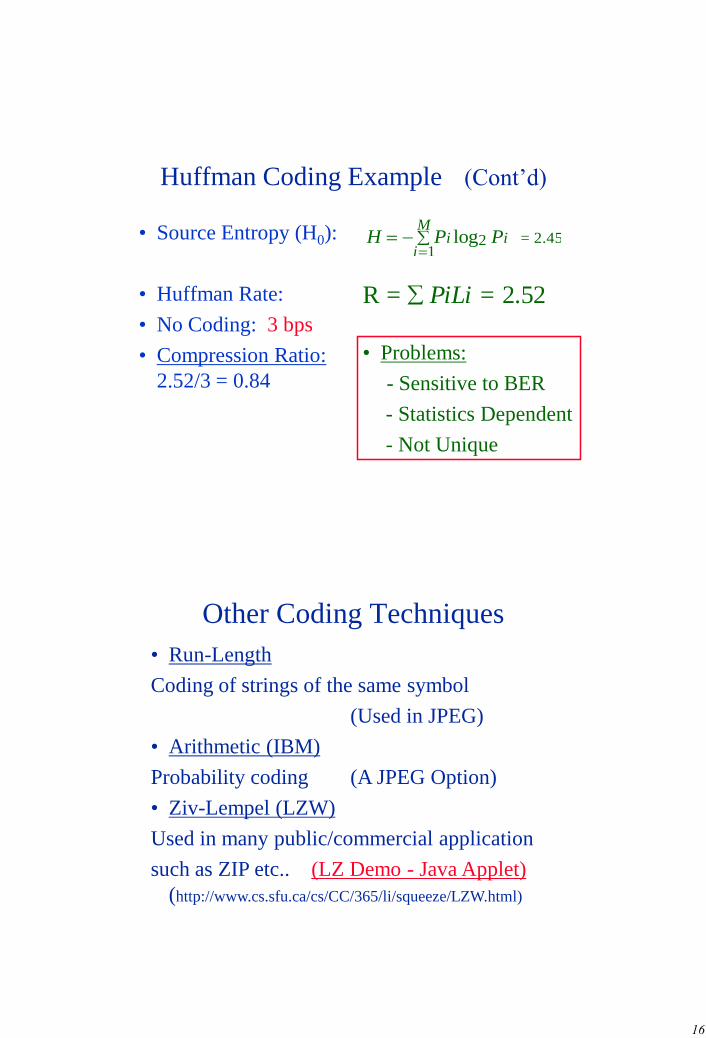
Huffman Coding Example (Cont‟d)
• Source Entropy (H0):
• Huffman Rate:
• No Coding: 3 bps
• Compression Ratio:
2.52/3 = 0.84
H P Pii
Mi
12log = 2.45
R = = 2.52PiLi
• Problems:
- Sensitive to BER
- Statistics Dependent
- Not Unique
Other Coding Techniques
• Run-Length
Coding of strings of the same symbol
(Used in JPEG)
• Arithmetic (IBM)
Probability coding (A JPEG Option)
• Ziv-Lempel (LZW)
Used in many public/commercial application
such as ZIP etc.. (LZ Demo - Java Applet)
(http://www.cs.sfu.ca/cs/CC/365/li/squeeze/LZW.html)

17
So…how JPEG do it ?
• The theoretical entropies of each quuantized DCT sub-band are known.
• In practice this would be a poor way to code the data because:
– 64 separate entropy codes would be required, each requiring many extra states to represent run-length coding of zeros.
– The statistics for each code are likely to vary significantlyfrom image to image.
– To transmit the code table for each sub-band as header information would involve a large coding overhead.
– Coding the sub-bands separately does not take account of the correlations which exist between the positions of the non-zero coefficients in one sub-band with those of nearby sub-bands.
Dc Coefficient: DPCM
• The first coefficient (0) of each block is the DC coef, which represents the mean value of the pixels in the block
• The DC coefficients have significant local correlations, so differential coding is used: the difference between the current DC coefficient and that of the previous block– The blocks are scanned from left to right, row by row. The first
block in each row is coded with respect to zero.
Next slide:
• The histogram of entropies of the DC coefficients differences is compared with that of the raw DC coefs
• We note the histogram peak around zero and see that the entropy is reduced from 6.42 bits to 6.07 bits.

18
Entropy Histograms of DC Coefficients
With
Differential
Coding
Coding the DC Coefficients
• The size of the differences can in theory be up to
±(255×8) =±2040 if the input pixels occupy the range -128 to +127 (The DCT has a gain of 8 at very low frequencies)
• Hence the Huffman code table would have to be quite large.
• JPEG adopts a much smaller code by using a form of floating-point representation, where Size is the base-2 exponent and Additional Bits are used to code the polarity and precise amplitude
• There are only 12 Sizes to be Huffman coded, so specifying the code table can be very simple and require relatively few bits in the header: 16 header bytes + 12 codes = 28 bytes for the DC table.

19
The DC Codes
• Only Size needs to be Huffman coded in the above scheme:
within a given Size, all the input values have sufficiently similar
probabilities
• Each coded Size is followed by the appropriate number of Additional
Bits to define the sign and magnitude of the coefficient difference exactly
The Run-Size Technique
• The remaining 63 quantized AC-coefficients usually contain many zeros and so are coded with a combined run-amplitude Huffman code.
• The codeword represents the run-length of zeros before a non-zero coefficient and the Size of that coefficient.
• This is followed by the Additional Bits which define the coefficient amplitude and sign precisely.
• This 2-dimensional Huffman code (Run, Size) is efficient because there is a strong correlation between the Size of a coefficient and the expected Run of zeros which precedes it: small coefficients usually follow long runs; larger coefficients tend to follow shorter runs.

20
The AC Run-Size Table • To keep the code table size n below 256, only the following
Run and Size values are coded: Run=1→15 ; Size=1→10
These require 150 codes.
• Two extra codes, corresponding to (Run,Size) = (0,0) and (15,0)
are used for EOB (End-of-block) and ZRL (Zero run length).
• EOB is transmitted after the last non-zero coef in a 64-vector.
It is omitted in the rare case that the final element is non-zero.
• ZRL is transmitted whenever Run>15: a run of 16 zeros which can
be part of a longer run of any length.
• Hence a run of 20 zeros followed by -5 would be coded as:
(ZRL) (4,3) 010
The AC Huffman Table

21
Run-Level Coding
• After zizag scan:
[-33, 21, -3, -2, -3, -4, -3, 0, 2, 1, 0, 1, 0, -2, -1, -1, 0, 0, 0, -2, 0, 0, 0, 0, 0, 0, 0, 0, 0, 0, 0, 1, 0, 0, 0, 0, 0, 0, 0, 0, 0, 0, 0, 0, 0, 0, 0, 0, 0, 0, 0, 0, 0, 0, 0, 0, 0, 0, 0, 0, 0, 0, 0]
• After run-level coding:
(0,-33) (0,21) (0,-3) (0,-2) (0,3)(0,-4) (0,-3) (1,2) (0,1) (1,1) (1,-2) (0,-1) (0,-1) (3,-2) (11,1)
A Coding ExampleAssume the values of a quantized DCT
matrix are given (Zig-Zag order):
42 16 -21 10 -15 0 0 0
3 -2 0 2 -3 0 0 0
0 0 2 -1 0 0 0 0
0 0 0 0 0 0 0 0
0 0 0 0 0 0 0 0
0 0 0 0 0 0 0 0
0 0 0 0 0 0 0 0
0 0 0 0 0 0 0 0

22
A Coding Example (Cont‟d)
• If the DC value of the previous block was
44, then the difference is -2. If Huffman
codeword for size=2 is 011 then the
codeword for the DC is: 01101
• Using Annex K in the JPEG for the
luminance AC coeff., we receive the
following codewords:
A Coding Example (Cont‟d)
Value Run/Size Huffman Ampl. Total bits
16 0/5 11010 10000 10
-21 0/5 11010 01010 10
10 0/4 1011 1010 8
-15 0/4 1011 0000 8
3 3/2 111110111 11 11
-2 0/2 01 01 4
2 1/2 11011 10 7
-3 0/2 01 00 4
2 5/2 11111110111 10 13
-1 0/1 00 0 3
EOB 0/0 1010 4

23
A Coding Example (Cont‟d)
• Compression results:
– DC coeff. : 5 bits
– AC coeff. : 82 bits
– Average bitrate: 87/64 = 1.36 bit/pixel
– Starting from 8 bpp resolution, the compression
ratio is : 8/1.36 = 5.88
A Coding Example (Cont‟d)
• Run-length coding contribution:
Direct Huffman coding of DC differentials [-2047,
2047] and AC differentials [-1023,1023] requires
code tables with 4,095 and 2,047 entries
respectively.
By Huffman coding only the (run,size) pairs, tables
are reduced to 12 and 161 entries respectively

24
(Run,Size) and Quantization
Histogram of the (Run,Size)
codewords for the DCT of Lenna,
quantised using Qlum.
Histogram of the (Run,Size)
codewords for the DCT of Lenna,
quantised using 2Qlum.
The bin number represents the decoded byte value
Figure 1 Figure 2
(Run,Size) and Quantization Cont‟d
• Note the strong similarity between the histograms, despite the fact that figure 2 represents only 2/3 as many events.
• Only the EOB probability changes significantly– because its probability goes up as the number of events (non-zero
coefficientss) per block goes down.
• It turns out that the (Run,Size) histogram remains relatively constant over a wide range of images and across different regions of each image. – This is because of the strong correlation between the run lengths
and expected coefficients sizes.
• The number of events per block varies considerably depending on the local activity in the image, but the probability distribution of those events (except for EOB) changes much less.

25
(Run,Size) and Quantization Cont‟d
Comparing the mean bit rates to code Lenna for the two
quantization matrices with the theoretical entropies:
• We see the high efficiency of the (Run,Size) code at two quite different
compression factors. This tends to apply over a wide range of images and
compression factors and is an impressive achievement.
• There is very little efficiency loss if a single code table is used for many images,
which can avoid the need to transmit the 168 bytes of code definition in the header of
each image. Using the recommended JPEG default luminance tables (Annex K.3.3)
the above efficiencies drop to 97.35% and 95.74% respectively.
Arithmetic Coding
• Used in both JPEG and JBIG
• Also known as QM-Coder (A “child” of
well-known Q-Coder)
• A Binary coder (1 or 0 symbols only)
• descriptor is decomposed into a tree of
binary decisions
• Rather than assigning intervals to the
symbols it assigns intervals to the most and
less probable symbols (MPS, LPS) ...

26
Arithmetic Coding (Cont‟d)
...Then orders the symbols such that the LPS
sub-interval is above the MPS:
A
0
A-Pe*ALPS Subinterval =Pe*A
MPS Subinterval = (1-Pe)*A
Pe: LPS Probability Estimate
Arithmetic Coding (Example)
Assume quad-dictionary:
a (Pa=1/2 -> .100)
b (Pb=1/4 -> .010)
c (Pc=1/8 -> .001)
d (Pd=1/8 -> .001)
0 .100 .110 .111 1
a b c d
Codewords as joints of units interval
• This is an accumulative probabily function :
• Each “code point” is the probability sum of previous probabilities
• The length of the interval on the right side of the point is equal to
probability of the symbol
• Intervals in our case: [0, 0.1) , [0.1, 0.11), ....
)(...)1()0()()(0
xpppkpxFx
k

27
Arithmetic Coding (Example)
Successive Subdivision
of unit interval: a a b ...
a b c d 1
.010
.0010
New_Code = Current_Code + A*Pi A:interval length
Pi: probability
New_A = Current_A + Pi
Arithmetic Coding Main Problems
• Needs „infinite precision‟ for interval A
• Needs a multiplication for interval
subdivision: A*Pe
• Results about 10% better than Huffman but
more complicated

28
A Coding Example
• The accumulative distribution function of the random
variable X with optional values {0,1,2,3,4} are:
F(x)P(x)X
0.20.20
0.2+0.1=0.30.11
0.2+0.1+0.4=0.70.42
0.2+0.1+0.4+0.2=0.90.23
0.2+0.1+0.4+0.2+0.1=10.14
A Basic coding and decoding algorithm
• We have n open segments [a,b), where n is the size of the alphabet we use:
0 0.2 0.3 0.7 0.9 1
0 1 2 3 4
F(0) F(1) F(2) F(3) F(4)

29
A Coding Example: 1/5
• We‟ll represent the “message” “1432” using the accumulative distribution function we have:
0
0.2
0.3
0.7
0.9
1
0
1
2
3
4
A Coding Example: 2/5
• We‟ll represent the “message” “1432” using the accumulative distribution function we have:
• First letter: 1
0.2
0.22
0.23
0.23
0.29
0.3
0
1
2
3
4
0
0.2
0.3
0.7
0.9
1
0
1
2
3
4

30
A Coding Example: 3/5
• We‟ll represent the “message” “1432” using the accumulative distribution function we have:
• Second letter: 4
0.29
0.292
0.293
0.297
0.299
0.3
0
1
2
3
4
0
0.2
0.3
0.7
0.9
1
0
1
2
3
4
0.2
0.22
0.23
0.23
0.29
0.3
0
1
2
3
4
A Coding Example: 4/5
• We‟ll represent the “message” “1432” using the
accumulative distribution function we have:
• Third letter: 3.
0.297
0.2974
0.2976
0.2984
0.2988
0.299
0
1
2
3
4
0.29
0.292
0.293
0.297
0.299
0.3
0
1
2
3
4
0
0.2
0.3
0.7
0.9
1
0
1
2
3
4
0.2
0.22
0.23
0.23
0.29
0.3
0
1
2
3
4

31
A Coding Example: 5/5
• We‟ll represent the “message” “1432” using the accumulative distribution function we have:
• Fouth letter: 2
0.2976
0.2984
0.297
0.2974
0.2976
0.2984
0.2988
0.299
0
1
2
3
4
0.29
0.292
0.293
0.297
0.299
0.3
0
1
2
3
4
0
0.2
0.3
0.7
0.9
1
0
1
2
3
4
0.2
0.22
0.23
0.23
0.29
0.3
0
1
2
3
4
Choosing the coding word
• The string “1432” should be represented by a binary word in the boundary[0.2976,0.2984)
• For simplicity, lets choose the middle point: 0.298
• 0.29810=0.0100110001001001101110…2
• It can be shown that we need bit to represent the exact message, where p is the boundary size, in our case: p= 0.0008, so we need 12 bits
• Since the two zeros at the end mean nothing we can use a shorter string: 0.0100110001
1log p

32
Decoding Procedure
0
0.2
0.3
0.7
0.9
1
0
1
2
3
4
0
0.2
0.3
0.7
0.9
1
0
1
2
3
4
0.2
0.22
0.23
0.23
0.29
0.3
0
1
2
3
4
0.2
0.22
0.23
0.23
0.29
0.3
0
1
2
3
4
0.2
0.22
0.23
0.23
0.29
0.3
0
1
2
3
4
0.29
0.292
0.293
0.297
0.299
0.3
0
1
2
3
4
0.29
0.292
0.293
0.297
0.299
0.3
0
1
2
3
4
0.297
0.2974
0.2976
0.2984
0.2988
0.299
0
1
2
3
4
0.297
0.2974
0.2976
0.2984
0.2988
0.299
0
1
2
3
4
0.2976
0.2984
We just need to “open” the boundary where 0.298 is in,
the same way we encoded it, letter by letter.
Mathematical Formulation
)()('
)1()('
xFlowhighlowhigh
xFlowhighlowlow
• Through every step we are inside the boundary [low,high)
• We begin in the area [0,1) so we initialize with
low=0, high=1
• Every step, we get x, and need to calculate the
•next boundary limits low’, high’
• F(x) is the accumulative distribution function

33
Pro‟s
• Adaptive : optional, even “on-the-fly”,
using symbols probability or other
mathematical model
– No need to send side information !
• The coding algorithm is not depended on
the probability (or other) model
• Very efficient …
And Con‟s …
• Computational complexity: need floating
point arithmetic
• Sensitive to BER
• Decoding can‟t be parallelized
• Not progressive: no output until the whole
message is coded
• Message length or “end-of-message” sign
are needed

34
Advanced Algorithms
• Progressive: we want to have the output
start before the “end-of-message”
– There are coding/decoding “predictive”
algorithms
• Fixed point arithmetic
– There are fixed point and table based methods
An excellent reference...
• By Ilan Sutskover,
can be found in the course web site