Basic Sampling & Review of Statistics. Basic Sampling What is a sample? Selection of a subset of...
21
Basic Sampling & Review of Statistics
-
Upload
clifford-allison -
Category
Documents
-
view
237 -
download
0
Transcript of Basic Sampling & Review of Statistics. Basic Sampling What is a sample? Selection of a subset of...

Basic Sampling & Review of Statistics

Basic Sampling
What is a sample? Selection of a subset of elements from a larger
group of objects Why use a sample?
Saves Time Money
Accuracy Lessens non-sampling error

Basic Sampling
Major definitions Sample population – entire group of people from whom the
researcher needs to obtain information Sample element -- unit from which information is sought
(consumers) Sampling unit -- elements available for selection during the
sampling process (consumers who are in the US at the time of the study)
Sampling frame -- list of all sampling units available for selection to the sample (list of all consumers who are in the US at the time of the study)
Sampling error -- difference between population response and sample response
Non-sampling error – all other errors that emerge during data collection

Basic Sampling
Procedure for selecting a sample Define the population – who (or what) we want
data from Identify the sampling frame – those available to
get data from Select a sampling procedure – how we are
going to obtain the sample Determine the sample size (n) Draw the sample Collect the data

Basic Sampling
General Types of Samples Non-probability – selection of element to be included in
final sample is based on judgment of the researcher Probability – each element of population has a known
chance of being selected Selection of element is chosen on the basis of
probability
Characteristics of probability samples Calculation of sampling error (+ or - z (x))
Make inferences to the population as a whole

Non-Probability samples
Convenience Sample is defined on the basis of the convenience of the
researcher Judgment
Hand-picked sample because elements are thought to be able to provide special insight to the problem at hand
Snowball Respondents are selected on the basis of referrals from other
sample elements Often used in more qualitative/ethnographic type studies
Quota Sample chosen such that a specified proportion of elements
possessing certain characteristics are approximately the same as the proportion of elements in the universe

Probability Samples
Simple random sample (SRS) Assign a number to each sampling unit Use random number table
Systematic Sample Easy alternative to SRS
Stratified sample Divide population into mutually exclusive strata Take a SRS from each strata

Probability Samples
Cluster sample Divide population into mutually exclusive clusters
Select a SRS of clusters One-stage -- measure all members in the cluster Two-stage --measure a SRS within the cluster
Area sample One-stage -- Choose an SRS of blocks in an
area; sample everyone on the block Two-stage -- Choose an SRS of blocks in an
area; select an SRS of houses on the block

Random Number Table
80147 27404 38749 31272 53703 59853 88288 29540 32340 50499 69466 59448 16059 46226 82283 20995 57976 47035 26741 87624 04973 06042 02837 12450 83611 70130 84015 42358 67330 65857 96833 03905 09246 93224 41290 70534 56244 25672 90829 95360 34881 89760 98565 25268 45158 85488 11382 86815 60516 12855 55839 53444 07514 71861 05378 78270 86152 35949 86556 08178 96428 31677 25932 69725 11787 59044 43831 36354 58785 91492 19927 61180 37422 55580 01105 91088 47699 51308 13923 52635 63057 78675 58380 19264 36613 37681 34477 44090 88692 01769 15655 73998 98969 97496 28472 35545 40885 24863 72929 02174

Hypothetical Sample Populations
Respondent Number
Income ($,000)
Education (Years)
Yogurt Consumption (Cartons/Year)
Satisfaction Level (1 – 7)
City
1 56 8 73 1 Madison2 60 9 3 3 Milwaukee3 64 11 95 5 Milwaukee4 68 11 71 4 Milwaukee5 72 11 86 6 Madison6 76 12 40 2 Milwaukee7 80 12 21 7 Madison8 84 12 81 7 Madison9 88 12 65 7 Madison10 92 12 44 7 Milwaukee11 96 13 80 4 Other12 100 13 12 5 Madison13 104 14 43 2 Milwaukee14 108 14 56 4 Milwaukee15 112 15 35 7 Madison16 116 16 17 1 Other17 120 16 72 3 Milwaukee18 124 17 70 3 Milwaukee19 128 18 80 7 Madison20 132 20 15 4 Madison

Review of Statistics
Probability Samples – note that statistical error can be computed when they are used Thus, need to know about statistics
Descriptive statistics Estimates of descriptions of a population
Statistical terms used in sampling Mean ( or xxi/n
Variance (2 or s2) -- xi-x)2/n - 1 Standard Deviation ( or s) – Square Root (Variance)

Review of Statistics
Inferential Statistics Terms
Parameter -- Statistic -- x
Sample Statistics Best estimate of population parameter Why? -- Central Limit Theorem

Review of Statistics
Central Limit Theorem Based on the distribution of the means of
numerous samples Sampling Distribution of Means
Theorem states: as sample size (n) approaches infinity (gets large), the
sampling distribution of means becomes normally distributed with mean () and standard deviation (√n)
Allows the calculation of sampling error ( s√n) Thus a confidence interval can be calculated
Review of Statistics
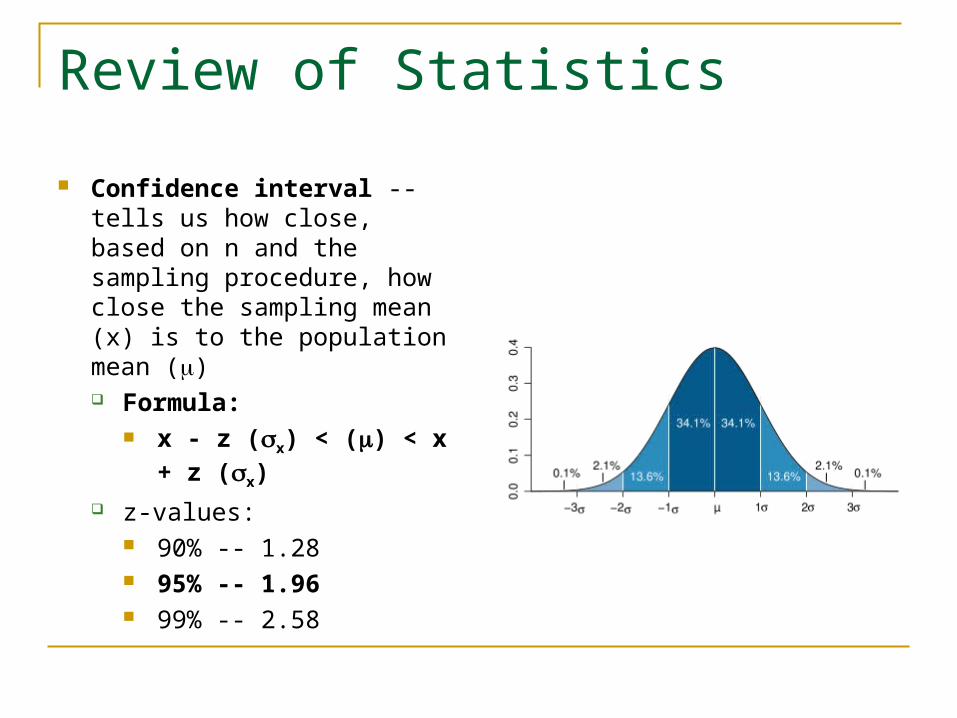
Confidence interval -- tells us how close, based on n and the sampling procedure, how close the sampling mean (x) is to the population mean () Formula:
x - z (x) < () < x + z (x)
z-values: 90% -- 1.28 95% -- 1.96 99% -- 2.58

Review of Statistics
Confidence interval -- interpretation For the same sampling procedure, 95 out 100
calculated confidence intervals would include the true mean ()

Sample Size
Sample size and total error Larger n increases probability of non-sampling
error Larger n reduces sampling error (√n) Effect on n on total error?
Can pre-determine the level of error (by setting n) Depends mainly on the method of analysis

Sample Size
Sample size when research objective is estimate a population parameter CI = x ± z Sx
CI = x ± 1.96 (s/ √n) n = x ± z2 s2/ h2
n = (1.96)2 s2/ h2
n = (3.84) s2/ h2
s = expected standard deviation h = absolute precision of the estimate (or with of the
desired confidence interval)
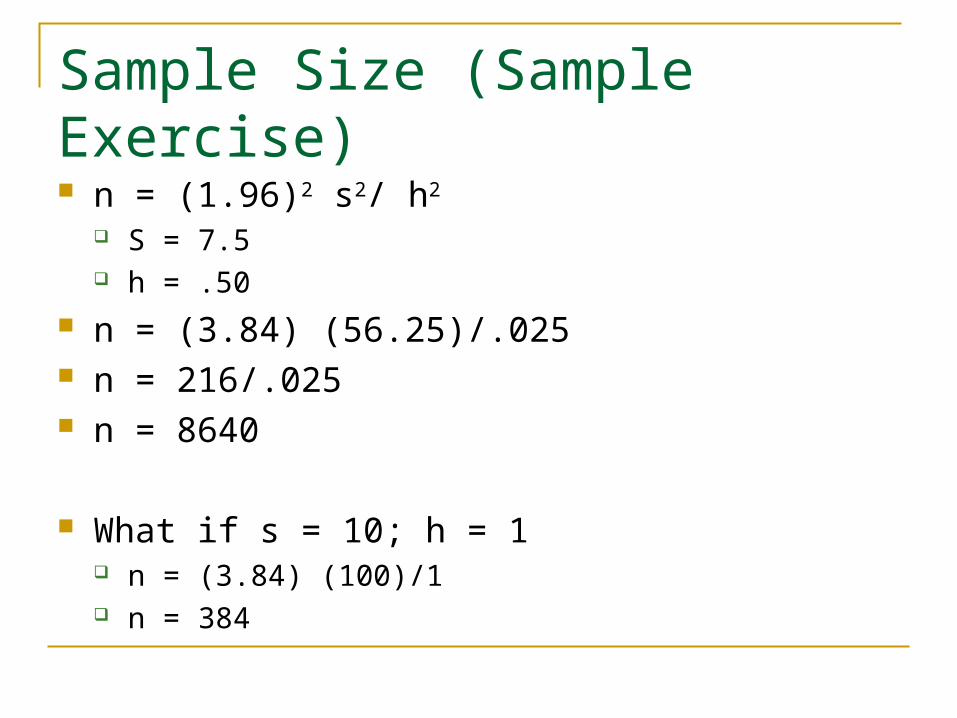
Sample Size (Sample Exercise) n = (1.96)2 s2/ h2
S = 7.5 h = .50
n = (3.84) (56.25)/.025 n = 216/.025 n = 8640
What if s = 10; h = 1 n = (3.84) (100)/1 n = 384

Sample Size (Conclusion)
Unaffected by size of universe Affected by
Choice of Desired Precision of Confidence Interval
Estimate of standard deviation

Sample Size
Sample size estimation With cross-tabulation
based research Objective is to get a
minimum of 25 subjects per cell
Must estimate relationship up front – what is smallest cell
<30 30+ Total
Fem .25 .35 .60
Male .30 Smallest (.10)
.40
Total .55 .45

Sample Size
Know smallest cell size should be 25
Calculate Total Sample size 25 is 10% of sample
Total Sample size 25 = .10 n 25/.10 = n 250 = n
<30 30+ Total
Fem
Male 25
Total