Basic powder diffraction and the Rietveld...
66
Basic powder diffraction and the Rietveld method Paul Henry Instrument Scientist – ISIS/STFC, UK Adj. Prof. in Neutron Scattering – CTH, Göteborg, Sweden SoNS Neutron School Erice, 4-13 th July 2018
Transcript of Basic powder diffraction and the Rietveld...

Basic powder diffraction and the Rietveld method
Paul Henry Instrument Scientist – ISIS/STFC, UK
Adj. Prof. in Neutron Scattering – CTH, Göteborg, Sweden
SoNS Neutron School
Erice, 4-13th July 2018
Outline
• Basic introduction to diffraction
• Diffraction measurements
• Diffraction & periodicity
• X-rays or neutrons?
• Structure solution and refinement – Phase problem
– Other factors contributing to observed intensity
– The Rietveld method
– Common problems
• Reading and literature

Basic introduction to diffraction
• The lattice
• Crystal systems
• Centering
• 3-D lattice types
• Miller indices/planes
• Bragg equation
• Ewald Sphere
• Reciprocal lattice
• Conditions for observing diffraction
• Laue diffraction

Lattice & unit cells: 1-D
Lattice + Motif = Structure
The motif can be an atom, molecule, part of a molecule or several molecules

Lattice & unit cell: 2-D
All the cells highlighted are equally valid. All will reproduce the 2-D lattice array. The convention is too choose the smallest cell that also represents the symmetry of the structure.
Lattice & unit cell: centering
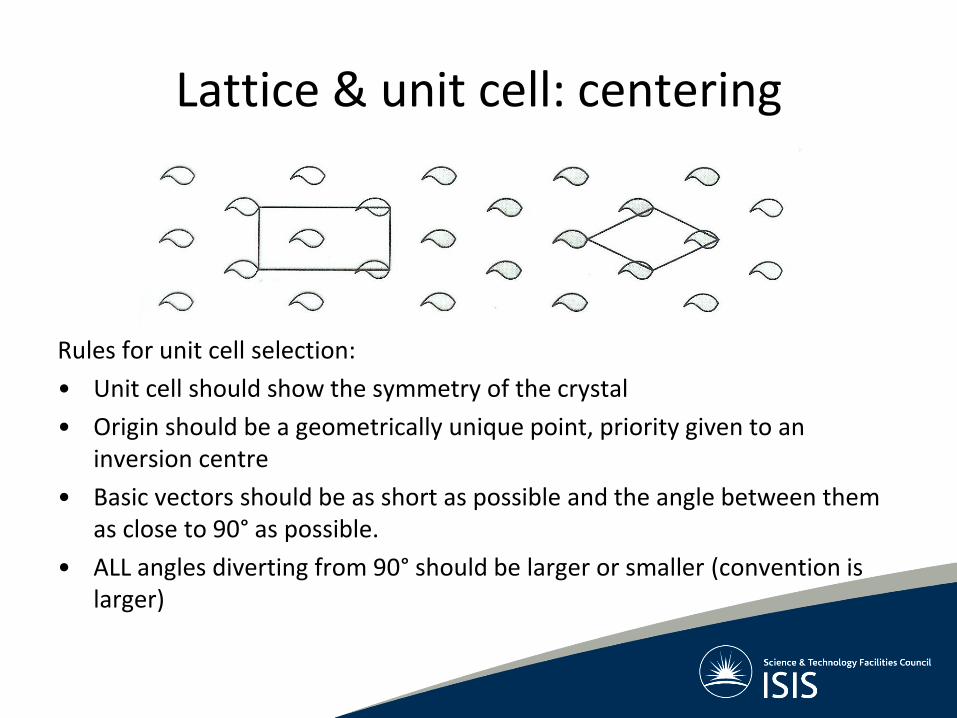
Rules for unit cell selection:
• Unit cell should show the symmetry of the crystal
• Origin should be a geometrically unique point, priority given to an inversion centre
• Basic vectors should be as short as possible and the angle between them as close to 90° as possible.
• ALL angles diverting from 90° should be larger or smaller (convention is larger)

Lattice & unit cell: 3-D
The unit cell has lattice
parameters defined by the cell
length a, b, and c, and the cell
angles a, b, and g:
g is angle between a and b
b is angle between a and c
a is angle between b and c
Atomic positions are given as
xyz coordinates:
x is fraction of a axis
y is fraction of b axis
z is fraction of c axis Conventions
• cell parameters are in Å or pm
• Angles are in °
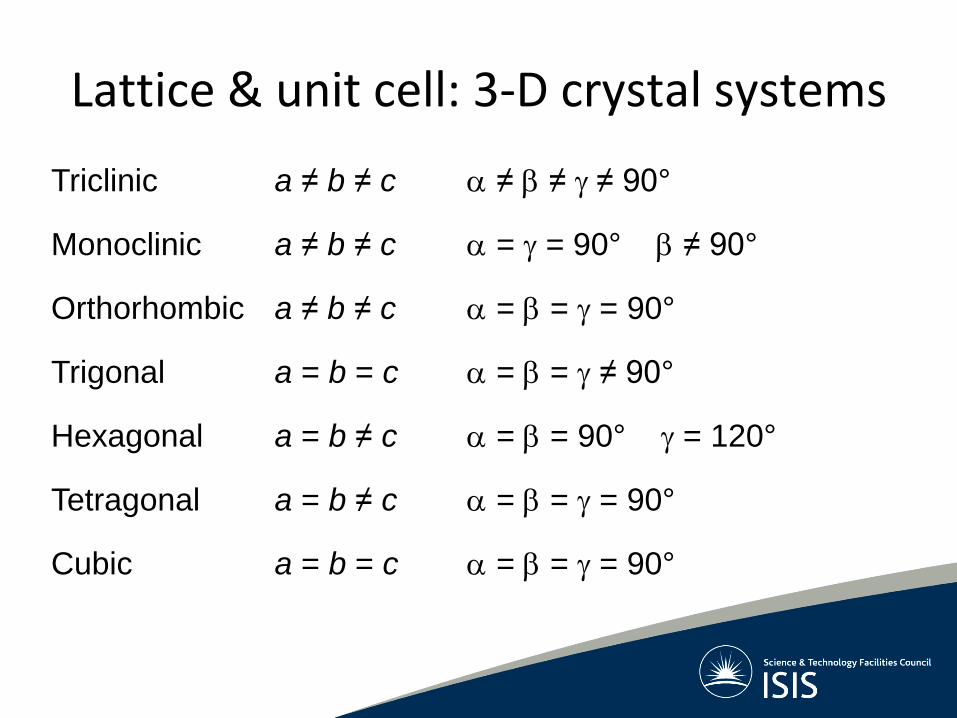
Lattice & unit cell: 3-D crystal systems
Triclinic
Monoclinic
Orthorhombic
Trigonal
Hexagonal
Tetragonal
Cubic
a ≠ b ≠ c
a ≠ b ≠ c
a ≠ b ≠ c
a = b = c
a = b ≠ c
a = b ≠ c
a = b = c
a ≠ b ≠ g ≠ 90°
a = g = 90° b ≠ 90°
a = b = g = 90°
a = b = g ≠ 90°
a = b = 90° g = 120°
a = b = g = 90°
a = b = g = 90°

Lattice & unit cell: 3-D cell setting
NB: Atom types are identical even though coloured differently
Primitive P
Body centred I
Face centred F
Side centred C (A/B)

Lattice & unit cell: 3-D lattice types
7 crystal classes 14 Bravais Lattice types 230 space groups

Miller indices / planes
Unit cell planes can be defined by the notation called Miller indices. The Miller index is given as a hkl number where h, k, and l are reciprocals of the plane with the x, y, and z axes. To obtain the Miller indices of a given plane requires the following steps:
Step 1. The plane in question is placed on a unit cell. Step 2. Find its intercepts with each of the crystal axes. Step 3. The reciprocal of the intercepts are taken. Step 4. Multiply by a scalar to get a ratio of integers.
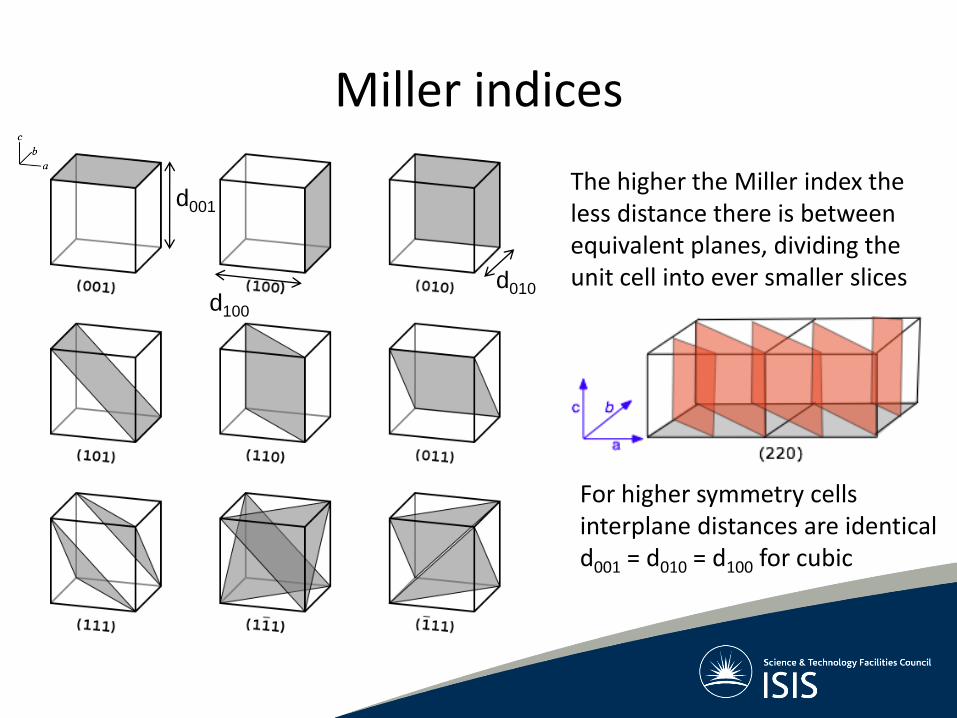
Miller indices
d001
d100
d010
For higher symmetry cells interplane distances are identical d001 = d010 = d100 for cubic
The higher the Miller index the less distance there is between equivalent planes, dividing the unit cell into ever smaller slices

The Bragg equation
• Constructive interference occurs when the waves reflected from adjacent scattering planes remain in phase – diffraction peak is observed
• The path difference travelled by waves between adjacent planes must be an integral multiple of the wavelength
n = 2dsin

Distance between Miller planes

Ewald sphere
• A sphere of radius 1/λ (2-D projection shown above)
• Potential diffracted X-rays/neutrons can be along any radius from the centre of the sphere to the circumference (including out of plane in the projection above). This represents the experimental possibilities (λ, possible 2θs)

Reciprocal lattice
• Alternative view of the crystal structure (hk0 plane illustrated)
• The reciprocal lattice consists of points which represent diffraction possibilities
• Each point can be labeled with a Miller index
• The units of this lattice are a*, b* and c* and any point can be reached using the vector equation d* = ha* + kb* + lc*
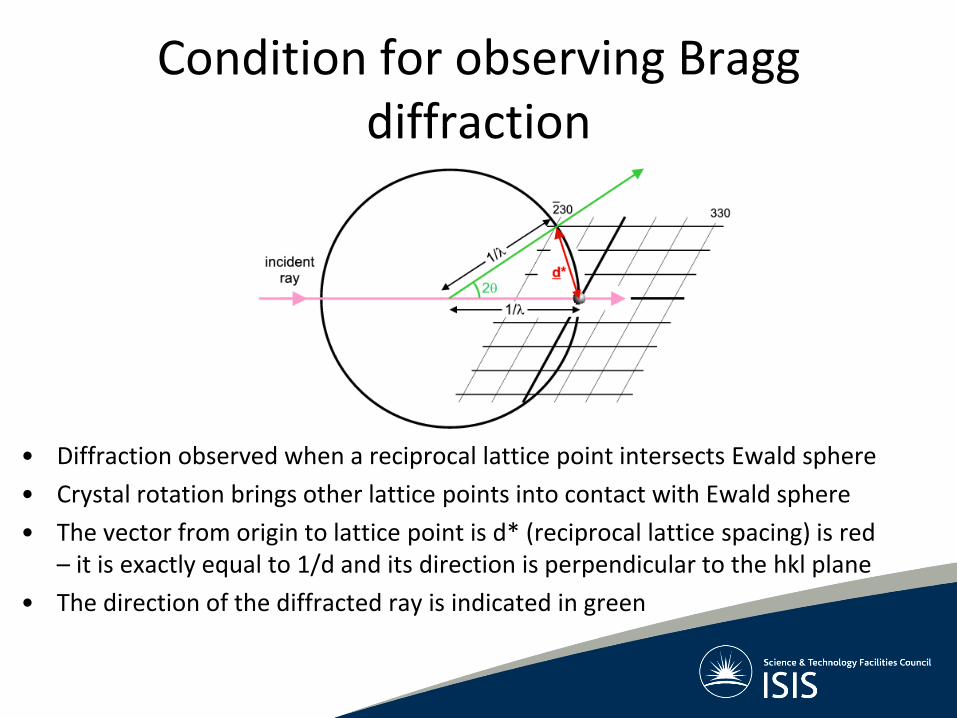
Condition for observing Bragg diffraction
• Diffraction observed when a reciprocal lattice point intersects Ewald sphere
• Crystal rotation brings other lattice points into contact with Ewald sphere
• The vector from origin to lattice point is d* (reciprocal lattice spacing) is red – it is exactly equal to 1/d and its direction is perpendicular to the hkl plane
• The direction of the diffracted ray is indicated in green
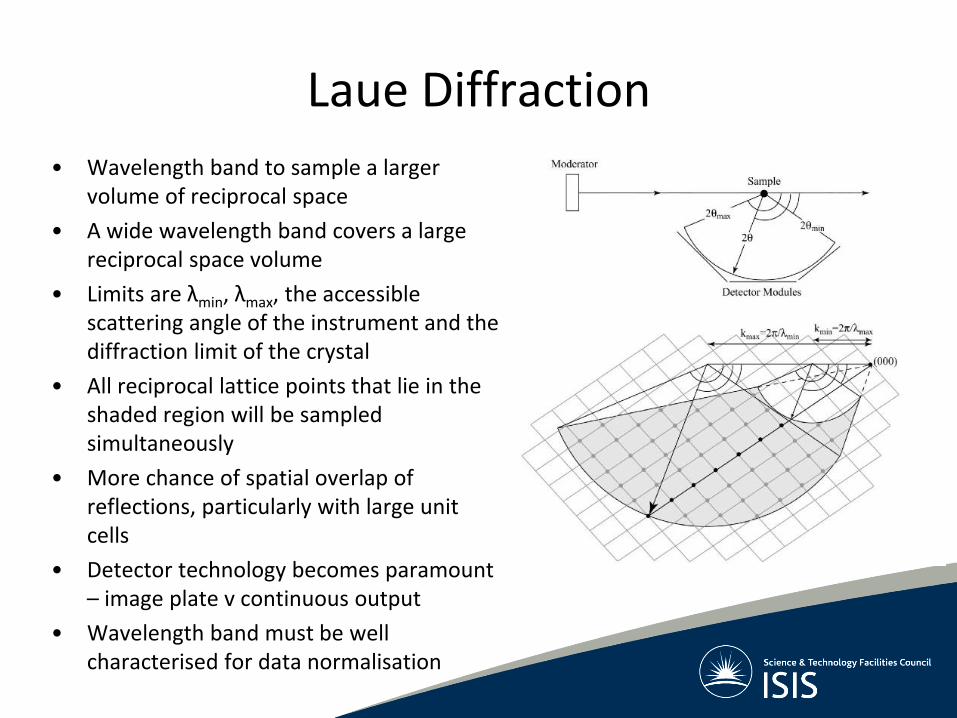
Laue Diffraction
• Wavelength band to sample a larger volume of reciprocal space
• A wide wavelength band covers a large reciprocal space volume
• Limits are λmin, λmax, the accessible scattering angle of the instrument and the diffraction limit of the crystal
• All reciprocal lattice points that lie in the shaded region will be sampled simultaneously
• More chance of spatial overlap of reflections, particularly with large unit cells
• Detector technology becomes paramount – image plate v continuous output
• Wavelength band must be well characterised for data normalisation

Diffraction measurements

Single crystal diffraction

Single Crystal Diffraction
Direct observation of the reciprocal lattice
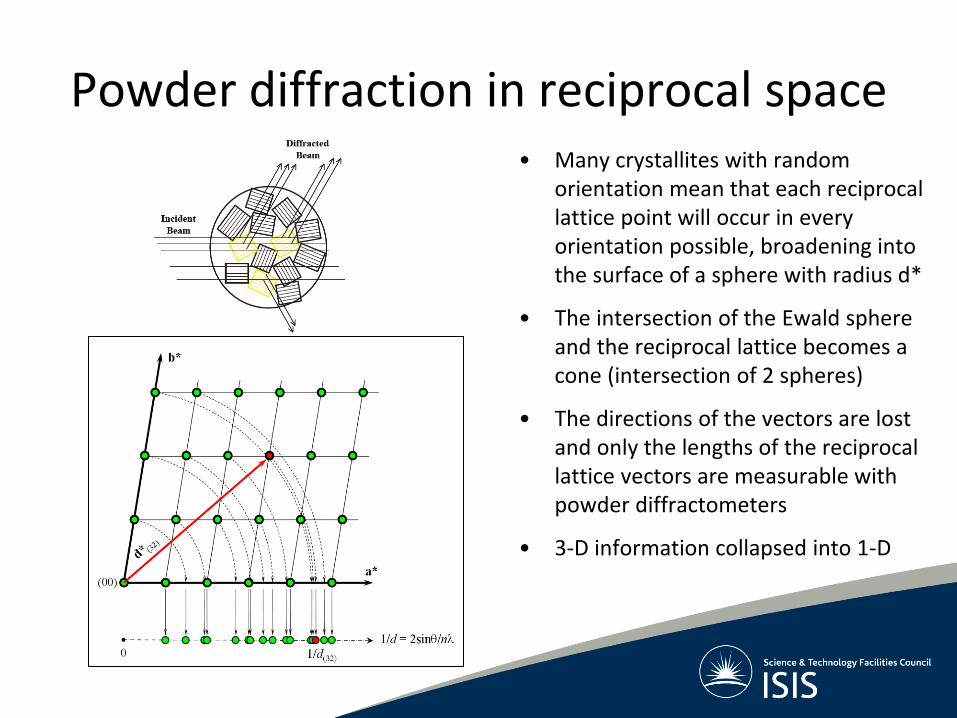
Powder diffraction in reciprocal space • Many crystallites with random
orientation mean that each reciprocal lattice point will occur in every orientation possible, broadening into the surface of a sphere with radius d*
• The intersection of the Ewald sphere and the reciprocal lattice becomes a cone (intersection of 2 spheres)
• The directions of the vectors are lost and only the lengths of the reciprocal lattice vectors are measurable with powder diffractometers
• 3-D information collapsed into 1-D
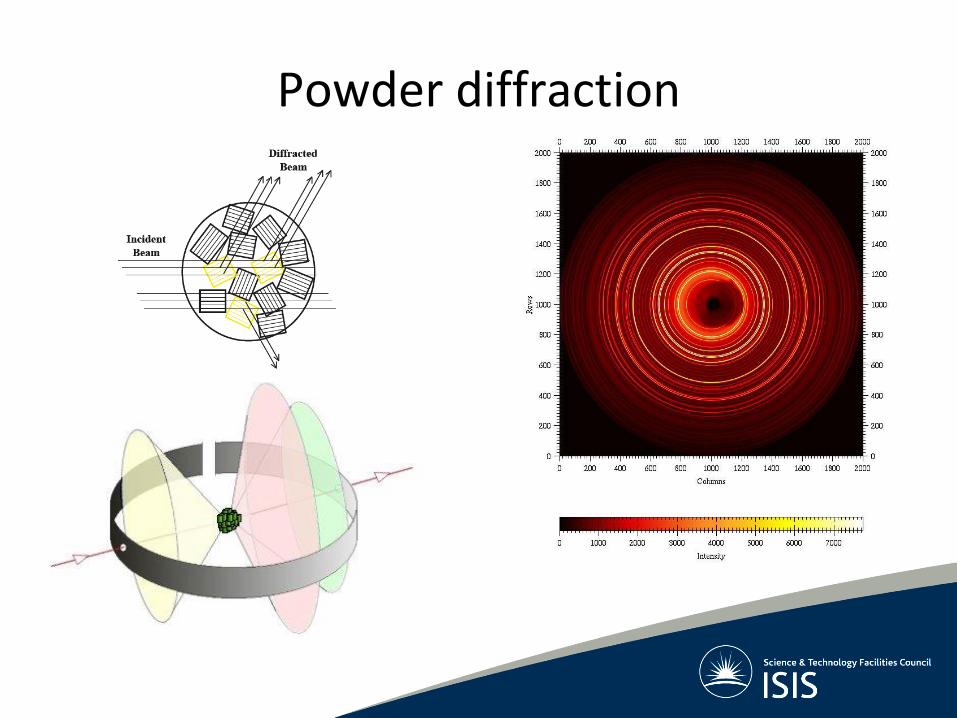
Powder diffraction

Powder diffraction
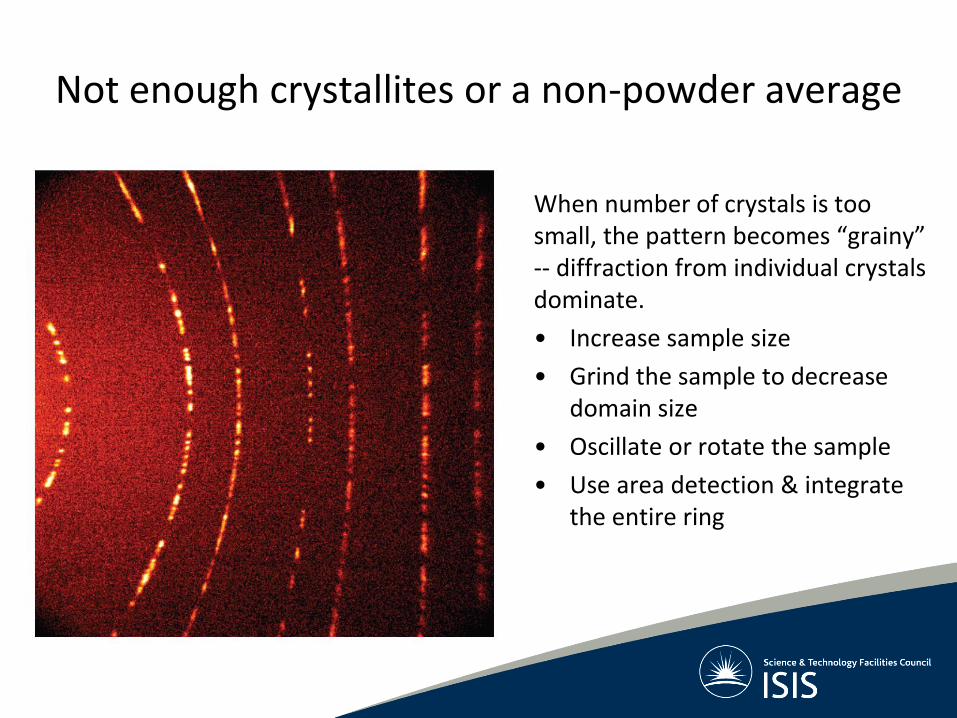
Not enough crystallites or a non-powder average
When number of crystals is too small, the pattern becomes “grainy” -- diffraction from individual crystals dominate.
• Increase sample size
• Grind the sample to decrease domain size
• Oscillate or rotate the sample
• Use area detection & integrate the entire ring

Not enough crystallites or a non-powder average
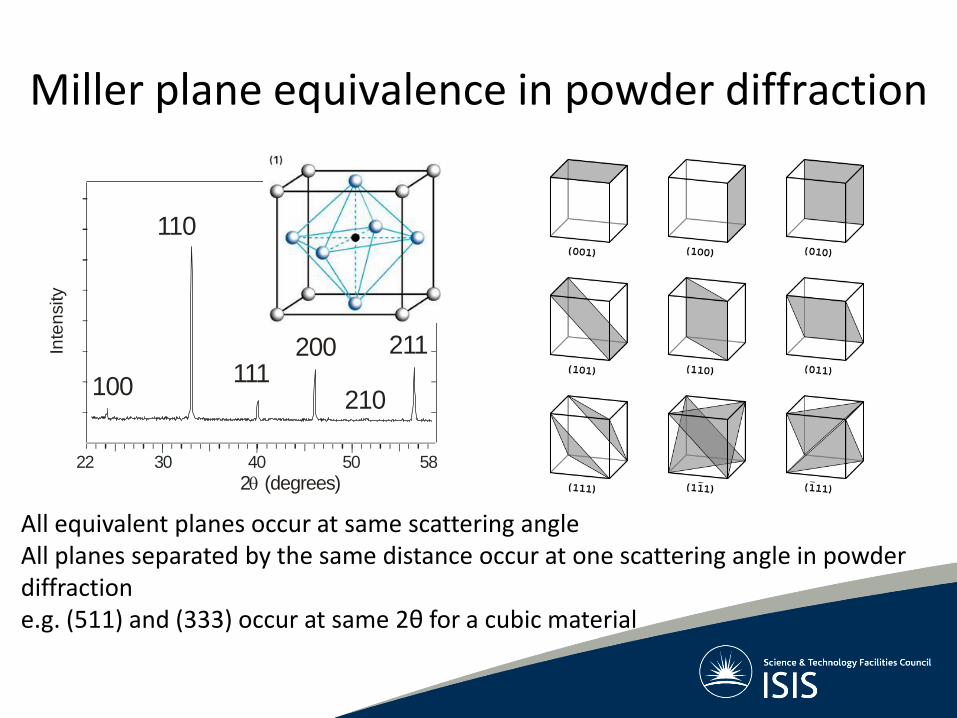
Miller plane equivalence in powder diffraction
22 30 40 50 58
Inte
nsity
2 (degrees)
100
110
111 200
210
211
All equivalent planes occur at same scattering angle All planes separated by the same distance occur at one scattering angle in powder diffraction e.g. (511) and (333) occur at same 2θ for a cubic material

Diffraction and periodicity

Diffraction: Order and periodicity • It was long thought that to give rise to diffraction a structure must be both
ordered and periodic – in order to fill all available space and requires translational symmetry.
• This is represented by the crystallographic restriction theorem where only 2-, 3-, 4- and 6-fold rotational symmetries are allowed in periodic arrays.
• Aperiodic tiling patterns were discovered by mathematicians in the 1960s – popularised by Penrose tiling in the 1970s.
• Quasicrystals, displaying 5- or 10-fold rotational symmetry were discovered in the 1980s by Dan Shechtman and caused a paradigm shift in crystallography.
• Quasicrystals are ordered, aperiodic structures that lack translational symmetry but are formed from a large number of elements with regular spacing – hence they diffract.
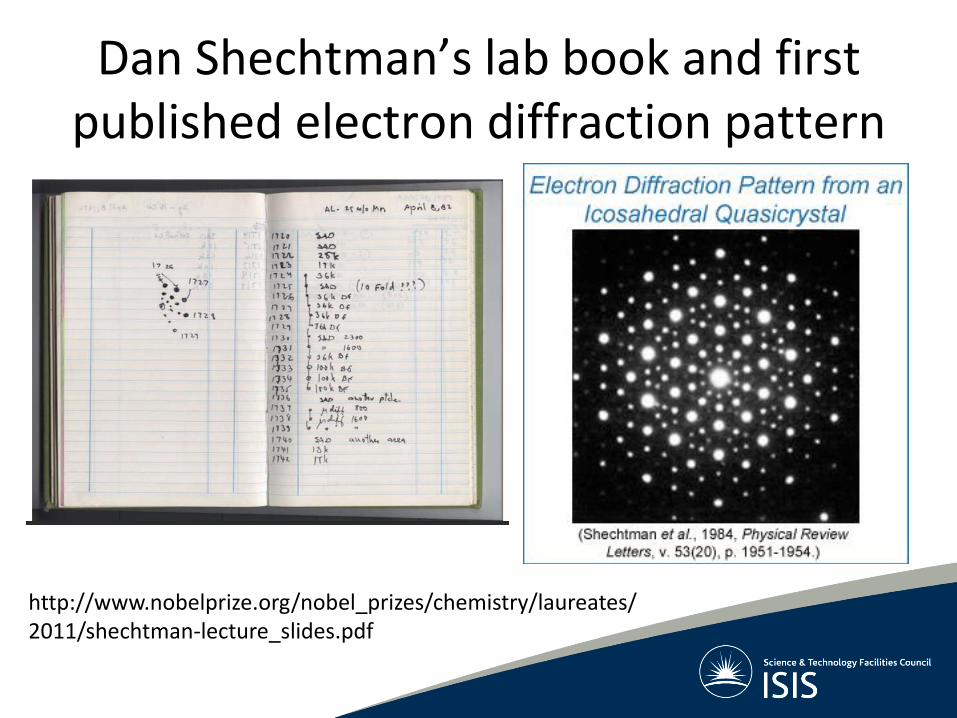
Dan Shechtman’s lab book and first published electron diffraction pattern
http://www.nobelprize.org/nobel_prizes/chemistry/laureates/2011/shechtman-lecture_slides.pdf
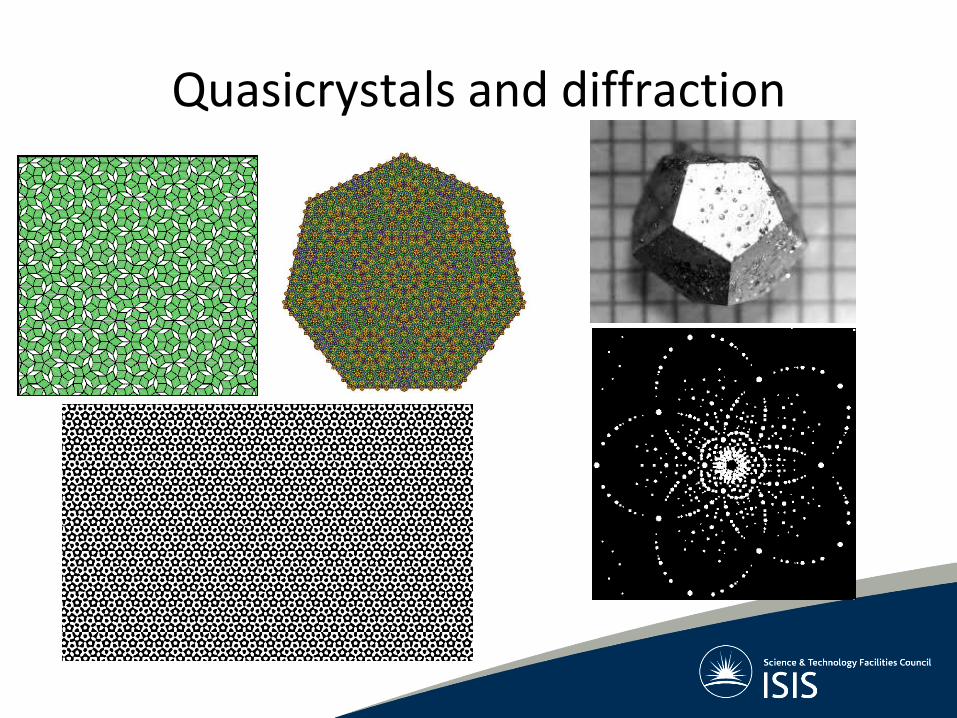
Quasicrystals and diffraction

Using X-rays or neutrons for powder diffraction?
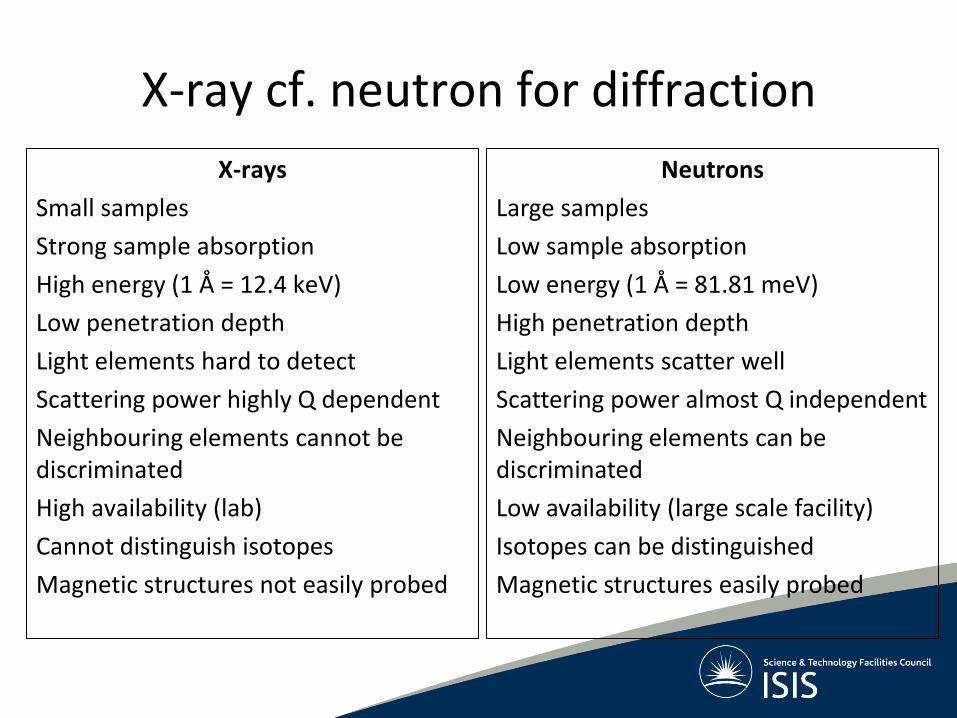
X-ray cf. neutron for diffraction
X-rays
Small samples
Strong sample absorption
High energy (1 Å = 12.4 keV)
Low penetration depth
Light elements hard to detect
Scattering power highly Q dependent
Neighbouring elements cannot be discriminated
High availability (lab)
Cannot distinguish isotopes
Magnetic structures not easily probed
Neutrons
Large samples
Low sample absorption
Low energy (1 Å = 81.81 meV)
High penetration depth
Light elements scatter well
Scattering power almost Q independent
Neighbouring elements can be discriminated
Low availability (large scale facility)
Isotopes can be distinguished
Magnetic structures easily probed

X-rays and neutrons are complementary probes for diffraction
Neutrons
X-rays
Electrons
Neutron diffraction is used for problems that X-rays cannot address or
inadequately address

Structure solution & refinement

Structure solution and refinement

Process for structure solution

Another view of structure solution

Intensity and structure factor
Ihkl |Fhkl|2
Fhkl Σ fi exp[2i(hxi + kyi + lzi)] exp(-UiQ2/2)
Measured intensity proportional to Fhkl2 and so we cannot tell
whether Fhkl is positive or negative – the Phase problem
fi is the scattering power (form factor of the ith site i.e. (xi,yi,zi) and incudes fractional occupancy
Contribution of the ith site to the Fhkl in question
Atomic displacement of the ith atom site
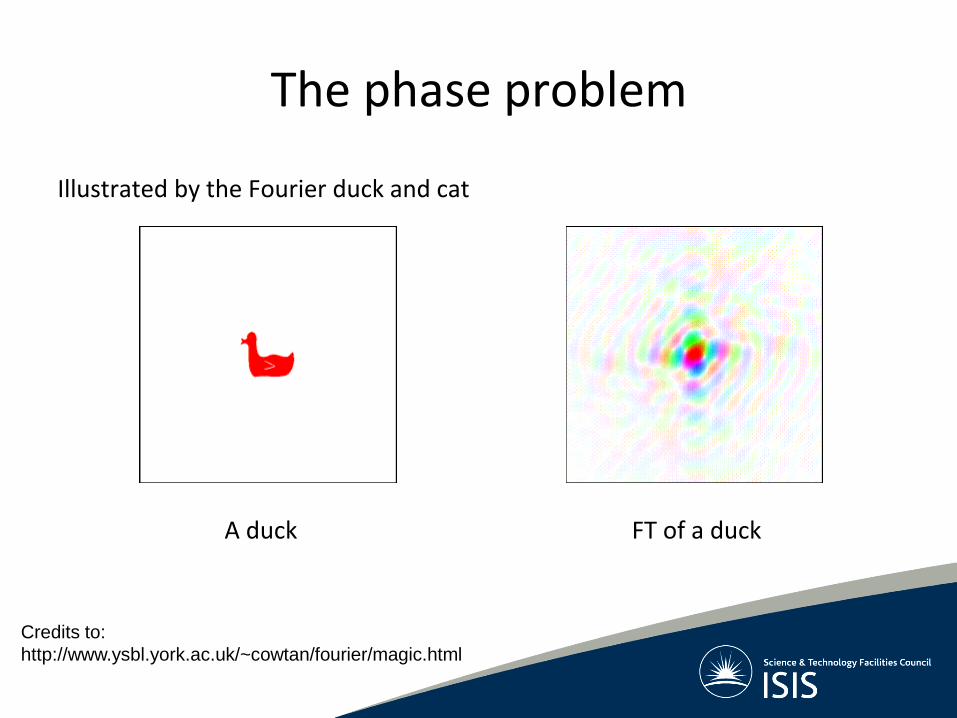
The phase problem
Illustrated by the Fourier duck and cat
A duck FT of a duck
Credits to:
http://www.ysbl.york.ac.uk/~cowtan/fourier/magic.html

The phase problem
Illustrated by the Fourier duck and cat
A cat FT of a cat
Credits to:
http://www.ysbl.york.ac.uk/~cowtan/fourier/magic.html

The phase problem Let’s go a step further and mix them up. What happens if we take the magnitudes of the duck transform and the phases of the cat transform?
FT with the brightness (magnitudes) of the duck FT and the colours (phases) from the cat FT
Credits to:
http://www.ysbl.york.ac.uk/~cowtan/fourier/magic.html

The phase problem
And the other way round? Cat FT magnitudes and duck FT phases…
In each case the image that contributed the phases is still visible, whereas the image that contributed the magnitudes is gone!
Credits to:
http://www.ysbl.york.ac.uk/~cowtan/fourier/magic.html
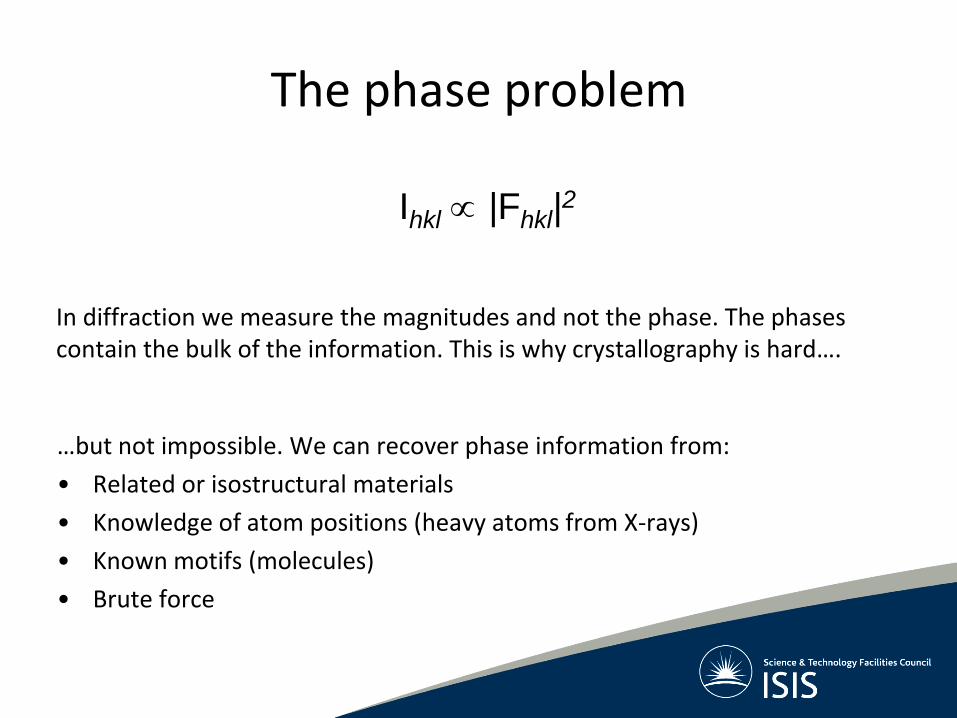
The phase problem
Ihkl |Fhkl|2
In diffraction we measure the magnitudes and not the phase. The phases contain the bulk of the information. This is why crystallography is hard….
…but not impossible. We can recover phase information from:
• Related or isostructural materials
• Knowledge of atom positions (heavy atoms from X-rays)
• Known motifs (molecules)
• Brute force

Other factors contributing to measured intensity
IK=SMKLK|FK|2PKAKEK
• S is an arbitrary scale factor – used to adjust the relative contribution of individual phases to the
overall diffraction pattern
• M is the multiplicity of the reflection – accounts for the fact that some observed diffraction peaks are
actually the product of multiple equivalent planes diffracting at the same position 2θ (for example, (001) (100) (010) etc in cubic)
– automatically calculated based on the crystal structure
• L is the Lorentz polarization factor • P is the modification of intensity due to preferred orientation • A is the absorption correction • E is the extinction correction • F is the structure factor, which is the amplitude of the scattering
due to the crystal structure

Process of structure refinement

The Rietveld method
• Originally written to analyse neutron powder
diffraction data
• Both nuclear and magnetic structure refinement
• Adapted for X-ray methods in 1977 by Young
• Thousands of publications per year published
using the method
• It is the reason powder crystallography is so
successful!!
Hugo M. Rietveld 1932-2016
“NASA would never have sent an X-ray powder diffractometer to
Mars without the Rietveld method” (David Blake, 2012)

Rietveld refinement software
Many programs out there. Well used examples include:
• GSAS
• GSAS-II
• Fullprof
• Topas
• Jana
• Maud
• Reitan
• BGMN
• Etc…

The Rietveld method What it is not:
• For phase identification
• For structure solution
What it can tell us:
• Phase quantities
• Unit cell dimensions
• Atomic coordinates / bond lengths / substitutions and vacancies
• Strain and texture effects
What you need:
• Good quality data
• A good starting structural model
• An instrument description file
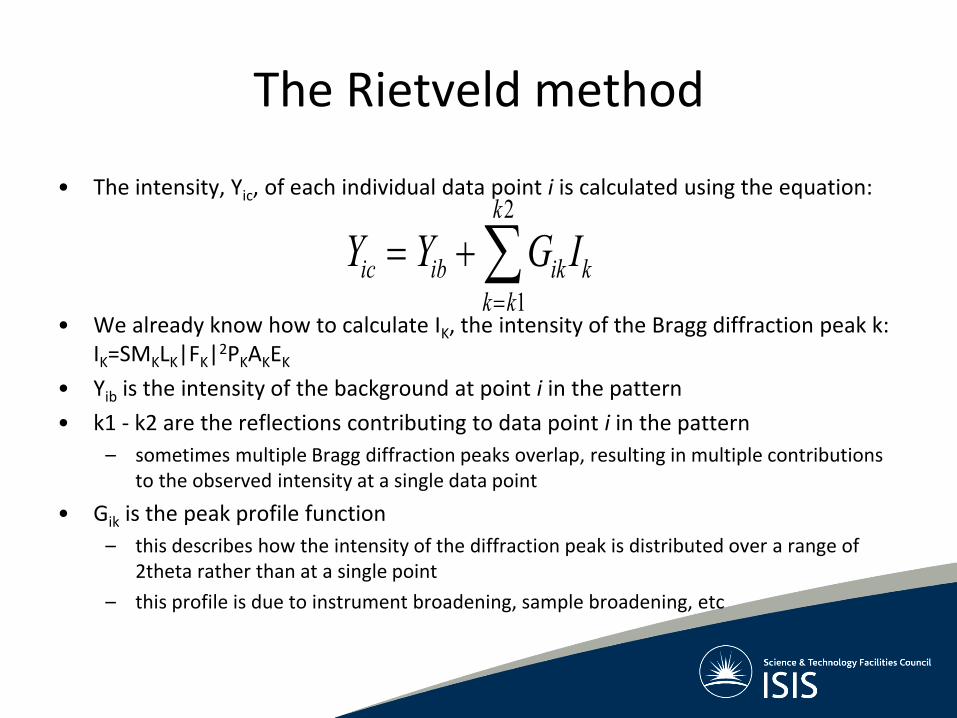
• The intensity, Yic, of each individual data point i is calculated using the equation:
• We already know how to calculate IK, the intensity of the Bragg diffraction peak k: IK=SMKLK|FK|2PKAKEK
• Yib is the intensity of the background at point i in the pattern
• k1 - k2 are the reflections contributing to data point i in the pattern
– sometimes multiple Bragg diffraction peaks overlap, resulting in multiple contributions to the observed intensity at a single data point
• Gik is the peak profile function
– this describes how the intensity of the diffraction peak is distributed over a range of 2theta rather than at a single point
– this profile is due to instrument broadening, sample broadening, etc
The Rietveld method
Y Y G Iic ib ik k
k k
k
1
2

The Rietveld method

Basic refinement procedure
Experimental diffraction pattern
Starting crystal structure (.cif, ICSD)
Instrument file (.inst, LaB6 standard)
Refine: • Background • Lattice parameters • Peak intensities • Peak shapes • Peak positions • Phase fractions
Assess: • Goodness of fit/R
factors • Impurity phases • Peak/background
shapes • Difference pattern
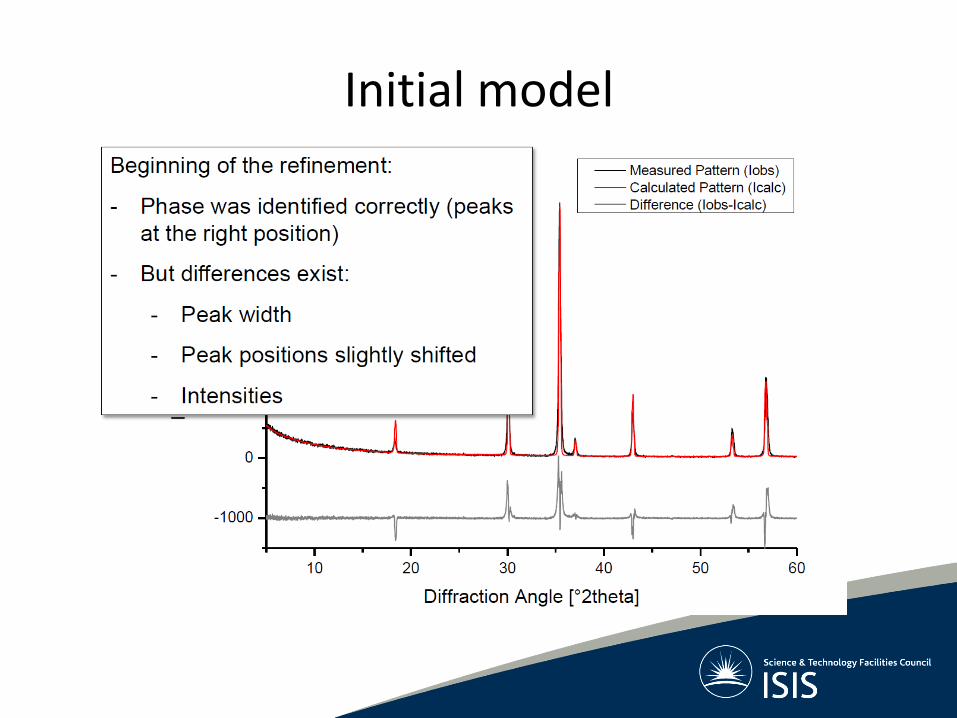
Initial model

Final refined model

Common mismatches in data and model

Peak position mismatch
Wrong peak positions? Refine:
• Unit cell dimensions
• Zero point
• Sample height

Lattice parameters / zero point refined

Wrong absolute intensities
Incorrect overall scaling factor

Refined scale factor
Better but still not fixed
Refine atomic model, site occupancy factors, displacement parameters, preferred orientation

Refined atomic model
Better but still not complete
Refine peakshape, crystallite size and micro-strain

Final fit
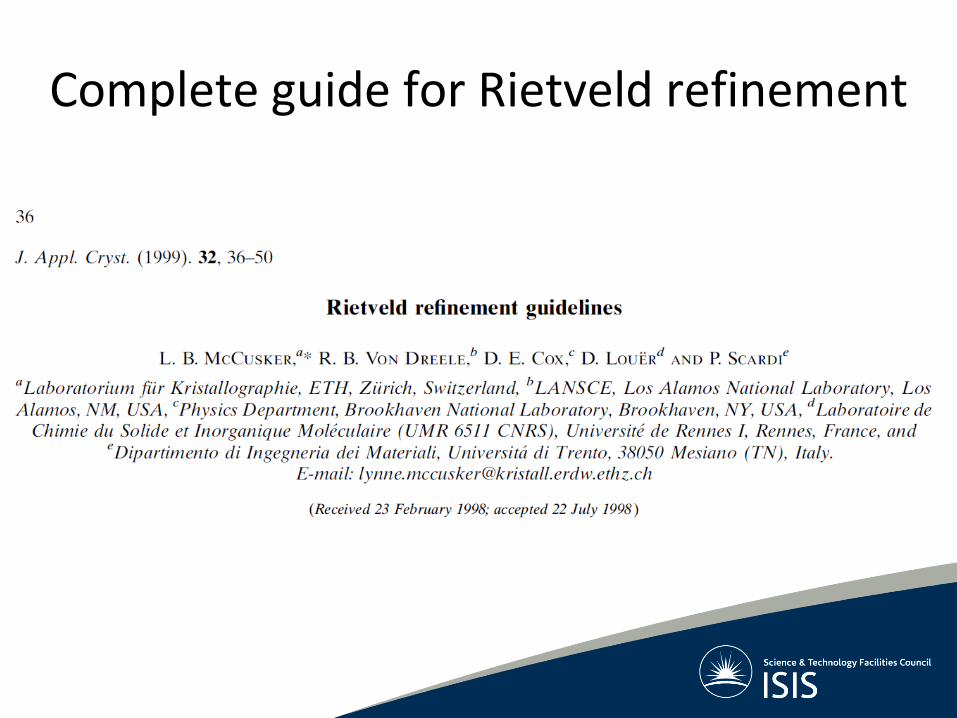
Complete guide for Rietveld refinement

Wise words…

Background and theory
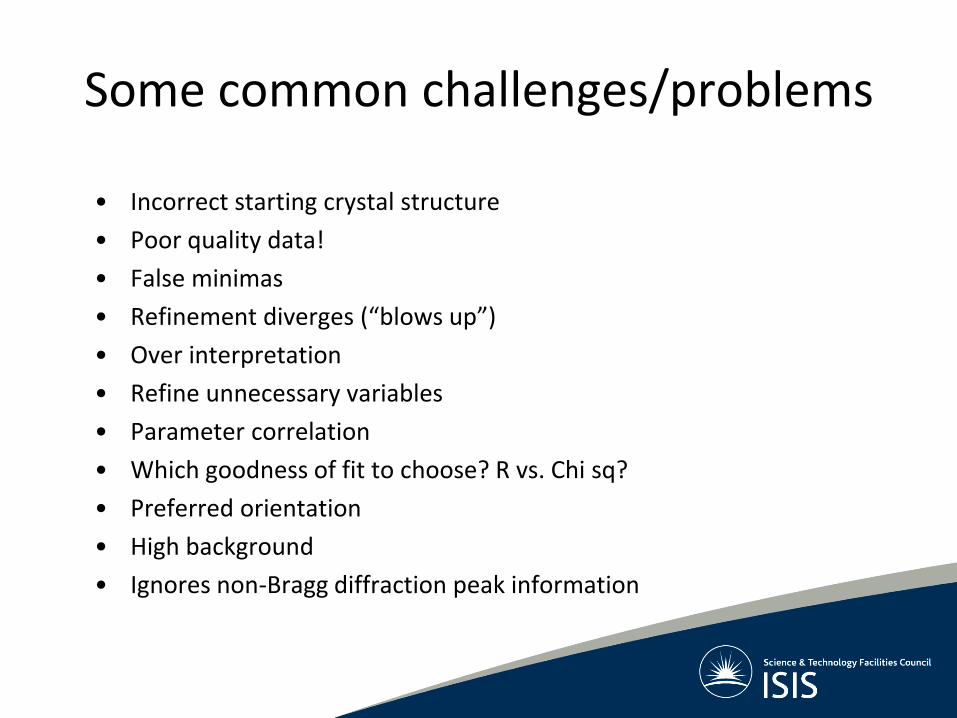
Some common challenges/problems
• Incorrect starting crystal structure
• Poor quality data!
• False minimas
• Refinement diverges (“blows up”)
• Over interpretation
• Refine unnecessary variables
• Parameter correlation
• Which goodness of fit to choose? R vs. Chi sq?
• Preferred orientation
• High background
• Ignores non-Bragg diffraction peak information

Links to useful information
Rietveld videos…
• https://www.youtube.com/watch?v=rG14YjLK9xQ
• https://www.youtube.com/watch?v=mnxd5ACqR9E
• https://www.youtube.com/watch?v=mcuLF0Szd4w
Rietveld Tutorial links
• http://www.ccp14.ac.uk/solution/gsas/gsastutorials.html
Quasicrystal books and structure analysis
• https://www.jstor.org/stable/24936867?seq=1#page_scan_tab_contents
• https://www.ncbi.nlm.nih.gov/pmc/articles/PMC5099788/