
Basic Hydrology & Hydraulics: DES 601 Module XX Precipitation and Design Storms.
60
Basic Hydrology & Hydraulics: DES 601 Module XX Precipitation and Design Storms
-
Upload
cathleen-johnston -
Category
Documents
-
view
226 -
download
2
Transcript of Basic Hydrology & Hydraulics: DES 601 Module XX Precipitation and Design Storms.

Basic Hydrology & Hydraulics: DES 601
Module XXPrecipitation and Design Storms

Precipitation
CloudsClouds
CloudsClouds
Surface Water Body
Lake or Stream
Ocean
Groundwater Flow
Surface Runoff
Precipitation
Transpira
tion
Evaporation
SunSun
Precipitation
There are four variables of engineering interest:
• Spatial: the average rainfall over the area
• Intensity: how hard it rains
• Duration: how long it rains at any given
intensity
• Frequency: how often (probability) it rains at
any given intensity and duration

Precipitation• Unlike flood frequency the rainfall probabilities
are expressed as a combination of frequency (same idea as AEP), depth, and duration.
• The inclusion of depth and duration reflects that different “storms” can produce the same total depth, but deliver that depth over much different times
Module 7

Precipitation
• The statistical relationships are expressed in either:
• Depth-Duration-Frequency (DDF curves)
• Intensity-Duration-Frequency (IDF curves)
Module 7

Depth-Duration-Frequency
• Depth of rainfall is the accumulated depth (in a gage) over some time interval.
• Duration, Tc , is that time interval. ()
• Frequency is the probability (like AEP) of observing the depth over the given duration.
Module 7

Depth-Duration-Frequency (DDF)
• DDF curvee.q. 12 hour, 100-year (AEP=1%), depth is 70 millimeters
FrequencyAEP; ARI
Duration
Depth

Depth-Duration-Frequency Tools
• DDF estimates for a location can be constructed from maps of depth for a given duration and AEP.
• Such maps are available from:• NWS TP40 (online)• NWS HY35 (online)• Texas DDF Atlas (online)

Harris County 3 hour, 5-year (AEP=20%) depth = 3.6 inches
Location
ARI (AEP = 1/5 = 20%)
Duration = 3 hour
DDF Data Sources

Intensity-Duration-Frequency• An alternate form of DDF is to present the
magnitude as an intensity (a rainfall rate).
• Intensity is the ratio of an accumulated depth to some averaging time, usually the duration.
Intensity is NOT the instantaneous rainfall rate

Depth, Intensity, and Duration
• Conversion from Depth-Duration to Intensity-Duration is obtained by the ratio of depth to duration.
• Conversion from Intensity-Duration to Depth-Duration is obtained by multiplication.
using same duration!

Intensity-Depth Relationship
• Intensity (average rate) from depthe.q. 12 hour, 100-year (AEP=1%), depth is 70 mm
average intensity is 70mm/12hr = 5.8 mm/hr
Duration
Depth
Module 7

Intensity-Duration-Frequency• IDF curves
e.q. 20 min, 5-year (AEP=20%), intensity is 5.5 in/hr
FrequencyAEP; ARI
Intensity

Example: Intensity for Harris County
• Estimate the rainfall intensity for a 50%-chance, 2 hour storm for Harris County using the DDF Atlas• Step 1: Select the AEP (50% = 2yr storm)• Step 2: Locate maps for 2-year storm (Figures 4-
15 in the DDF Atlas)• Step 3: Find the map that corresponds to a 2-
hour storm.• Step 4: Locate Harris County, estimate the depth
from the contour lines.• Step 5: Compute the intensity from
Module 7

Example: Intensity for Harris County
• Step 2: Locate maps for 2-year storm
• Step 3: Find the map for the 2-hour storm.
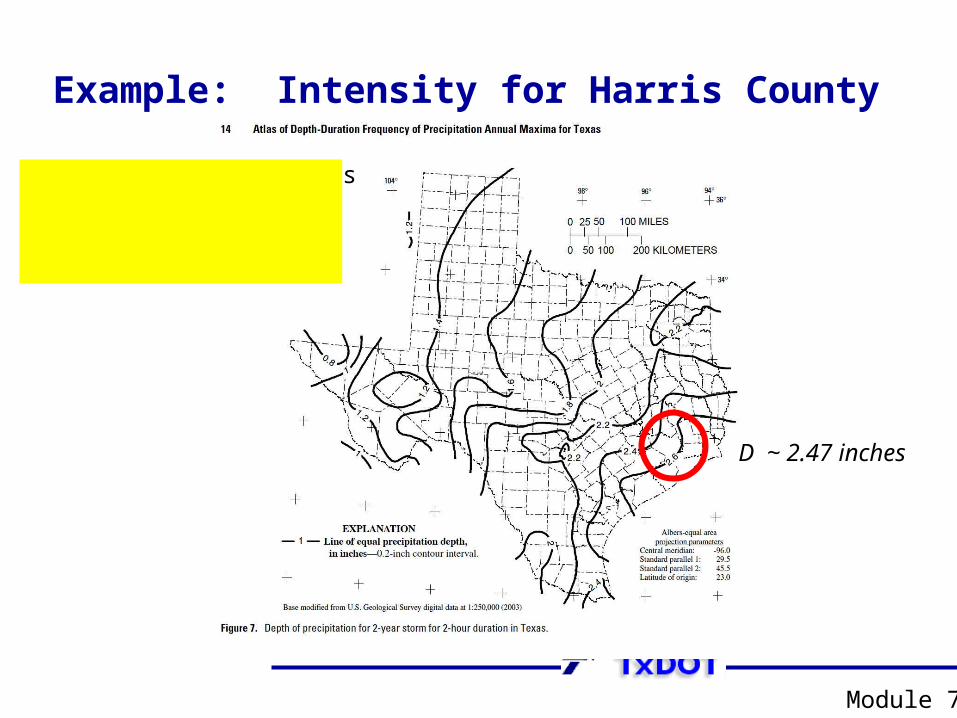
Example: Intensity for Harris County
• Step 4: Locate Harris County, estimate the depth from the contour lines.
Module 7
D ~ 2.47 inches

Example: Intensity for Harris County
• Step 5: Compute the intensity from
Module 7

Intensity-Duration-Frequency Tools
• EBDLKUP-NEW.xlsx is a spreadsheet tool that represents the rainfall IDF as the power law equation
• The coefficients E,B, and D are different for each county and each mapped AEP.
• The coefficients, E, B, and D, are based upon the information contained in the DDF Atlas (maps).

Intensity-Duration-Frequency Tools• The coefficient B has different numerical value in US
customary and SI unit system.
• The returned intensity is inches-per-hour in the US customary system
• The returned intensity is millimeters-per-hour in the SI system
• The duration Tc does not need to correspond to a mapped value.
Module 7

EBDLKUP-NEW.xlsx
• The spreadsheet is distributed as a .ZIP archive
• The archive includes the spreadsheet, the research report, a tutorial video, and a tutorial document.• The video and tutorial document are hyperlinks within the
spreadsheet – the links will not work if the spreadsheet is moved to a different directory from these files; however the spreadsheet itself will function fine without the files, but the user wont be able to access the video or tutorials.
Module 7

EBDLKUP-NEW.xlsx
Module 7
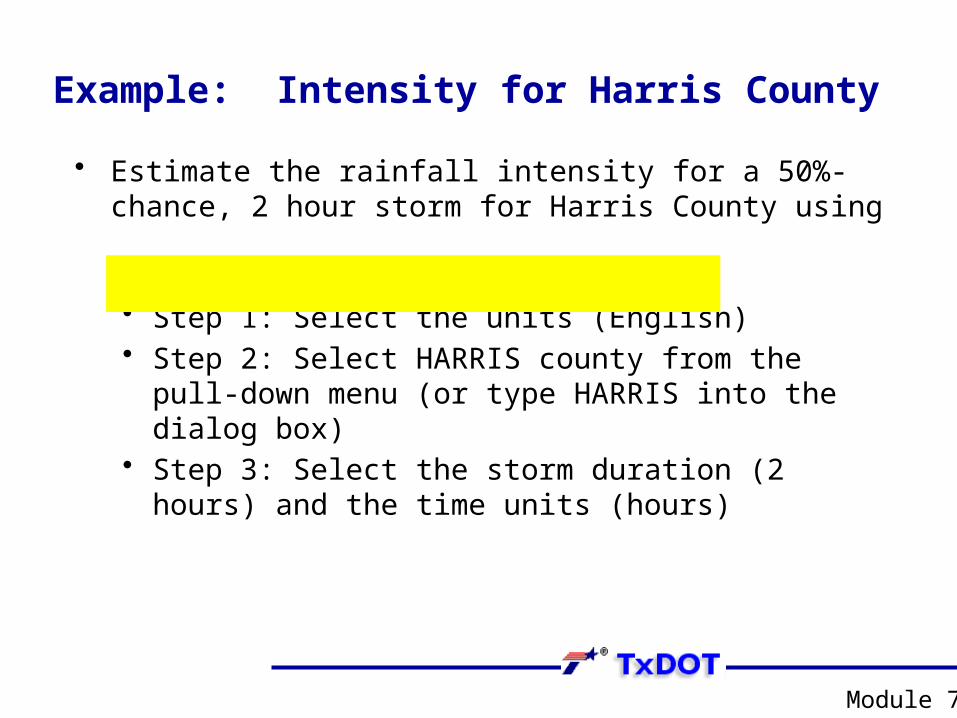
Example: Intensity for Harris County
• Estimate the rainfall intensity for a 50%-chance, 2 hour storm for Harris County using EBDLKUP-NEW.xlsx.• Step 1: Select the units (English)• Step 2: Select HARRIS county from the pull-down
menu (or type HARRIS into the dialog box)• Step 3: Select the storm duration (2 hours) and
the time units (hours)
Module 7

Example: Intensity for Harris County
• Step 1: Select the units (English)
Module 7

Example: Intensity for Harris County
• Step 2: Select HARRIS county from the pull-down menu
Module 7

Example: Intensity for Harris County• Step 3: Enter the storm duration (2 hours) and select the
time units (hours)
Module 7

Example: Intensity for Harris County• Step 4: Find result for desired AEP (2-yr is 50% storm)
Module 7

Purpose of the Tools
Module 7
• The EBDLKUP-NEW tool greatly reduces effort required to interpolate duration values that are not mapped.
• The E, B, and D values can be entered into GeoPack Drainage (or WinStorm) for drainage design.
Comparison of the Tools
Module 7
• The results from the map and the spreadsheet tool are nearly the same.
• The results are not identical because:• The map requires the designer to estimate a
depth based on nearby contour lines• The EBDLKUP-NEW uses the estimated depth at
the county centroid• The EBDLKUP-NEW tool reduces effort required to
interpolate duration values that are not mapped• The E, B, and D values can be entered into GeoPack
Drainage (or WinStorm) for drainage design.

Design Storms
• Design storms are rainfall distributions that represent temporal patterns of a storm.
• A rainfall distribution is also called a hyetograph.
• Rainfall distributions are used when we need to estimate an entire hydrograph.

Rainfall distributions
• Each “block” represents the amount of rainfall for the time interval
• The diagram is called “incremental” rainfall
• The running sum of the blocks is the “cumulative” rainfall
Rainfall distributions
• Design storm (distributions) are created from historical storms and analyzed to generate statistical models of rainfall.
• Design storm distributions are typically dimensionless hyetographs
• NRCS Type Storms• Empirical Texas Hyetographs

Texas Empirical Hyetographs
• Alternative to SCS Type Curves is the Texas Empirical Hyetographs
• Based on Texas data.
• Reflects “front loading” observed in many real storms.
• Rescales time and depth.

Texas Empirical Hyetographs
Rescale Time
Res
cale
Dep
th
Average Intensity

Texas Empirical Hyetographs
• The 50th percentile curves represents the median behavior of observed storms in Texas that were known to produce runoff.
• To use the curves:1. Select a desired AEP.2. Select the desired storm duration.3. Use DDF Atlas or EBDLKUP-NEW to estimate the
storm depth for the selected AEP and duration.4. Multiply the time axis by the storm duration.5. Multiply the depth axis by the storm depth.
• Result is a cumulative design storm distribution for given duration and AEP.

Example: Texas Empirical Hyetographs
• Construct a design storm for the 3-hour, 2-year rainfall in Harris County using the Texas Empirical Hyetograph
1. Obtain the depth from the DDF Atlas2. Rescale the depth and time using the Texas
Empirical Hyetograph
Module 8

Example: Texas Empirical Hyetographs
1. Obtain the depth from the DDF Atlas
Module 8
D ~ 2.6 inches

Example: Texas Empirical Hyetographs2. Rescale depth and time using the Texas Hyetograph
2.60 inches
1.36 inches
1.93 inches
3 ho
urs
2 ho
urs
1 ho
urs
Texas Empirical Hyetographs Tools
• The empirical hyetograph is tedious to generate from the curves if short time intervals are desired (say every 10 minutes).
• TXHYETO.xlsx is a spreadsheet tool that approximated the 50th percentile curve and the 90th percentile curve using a distribution-mixture function model.
Texas Empirical Hyetographs Tools
• The empirical hyetograph is tedious to generate from the curves if short time intervals are desired (say every 10 minutes).
• TXHYETO.xlsx is a spreadsheet tool that approximates the 50th percentile curve and the 90th percentile curve using a distribution-mixture function model.
• TXHYETO.xlsx can be used stand-alone, but it was built to be used in conjunction with EBDLKUP-NEW.xlsx

TXHYETO.xlsx
• The spreadsheet is distributed as a .ZIP archive
• The archive includes the spreadsheet, the research report, a tutorial video, and a tutorial document.• The video and tutorial document are hyperlinks within the
spreadsheet – the links will not work if the spreadsheet is moved to a different directory from these files; however the spreadsheet itself will function fine without the files, but the user wont be able to access the video or tutorials.

TXHYETO.xlsx

Example: Texas Empirical Hyetographs
• Construct a design storm in 10 minute increments for a 3-hour, 2-year rainfall in Harris County using the TXHYETO.xlsx and EBDLKUP-NEW.xlsx
1. Obtain the intensity value from EBDLKUP-NEW.xlsx2. Multiply this value by the duration (3 hours) to obtain the
storm depth.3. Enter the total duration into TXHYETO.xlsx4. Enter the total depth into TXHYETO.xlsx5. Enter time step size into TXHYETO.xlsx
• Result is a design storm for specified AEP, depth, and duration.

Example: Texas Empirical Hyetographs
1. Obtain the intensity value from EBDLKUP-NEW.xlsx

Example: Texas Empirical Hyetographs
2. Multiply this value by the duration (3 hours) to obtain the storm depth.

Example: Texas Empirical Hyetographs3. Enter the total
duration into TXHYETO.xlsx

Example: Texas Empirical Hyetographs
4. Enter the total depth into TXHYETO.xlsx

Example: Texas Empirical Hyetographs
5. Enter time step size into TXHYETO.xlsx• The spreadsheet
automatically fills the depth column with the cumulative depths for each time increment
Texas Empirical Hyetographs
• The result is then ready to paste into HEC-HMS or similar tools that make use of a design storm.
• The next example illustrates using the two tools to input a design storm into HEC-HMS

Integrated EBDLKUP, TXHYETO and HEC-HMS Example
• The result is then ready to paste into HEC-HMS or similar tools that make use of a design storm.
• The next example illustrates using the two tools to input a design storm into HEC-HMS

Integrated EBDLKUP, TXHYETO and HEC-HMS Example
• Consider a watershed with the properties in the figure.
• The watershed is located in Dallas County, Texas
• Estimate the response of a 5-year, 3-hour storm using HEC-HMS

Integrated EBDLKUP, TXHYETO and HEC-HMS Example
• Estimate the response of a 5-year, 3-hour storm using HEC-HMS
• EBDLKUP-NEW estimates the intensity as 1.01 in/hr
• The product of that intensity and duration estimates the depth as 3.03 inches

Integrated EBDLKUP, TXHYETO and HEC-HMS Example
• Enter the duration and depth into TXHYETO
• Enter the desired simulation time step (10 minutes this example)
• Result is a design storm that can be supplied to HEC-HMS

Integrated EBDLKUP, TXHYETO and HEC-HMS Example
• HMS model ready to receive the hyetograph (How to build model is covered in DES-606)

Integrated EBDLKUP, TXHYETO and HEC-HMS Example
• Select the design storm from TXHYETO

Integrated EBDLKUP, TXHYETO and HEC-HMS Example
• Select destination (in time) for the storm in HMS

Integrated EBDLKUP, TXHYETO and HEC-HMS Example
• Paste the the design storm into HMS

Integrated EBDLKUP, TXHYETO and HEC-HMS Example
• Fill missing values (see the report) and plot the storm to verify successful paste.

Integrated EBDLKUP, TXHYETO and HEC-HMS Example
• Run HEC-HMS to estimate the discharge hydrograph at the watershed outlet

Summary
• Rainfall is described by DDF or IDF curves• DDF values are obtained from NWS or similar
sources – they are mapped to locations• EBDLKUP-NEW can be used to estimate rainfall
intensity (for use with the rational equation) directly.
• EBDLKUP-NEW can be used to estimate DDF values• The duration does not need to match a mapped time
value.

Summary• Design storms are used to estimate temporal
behavior during a storm – required when need to estimate an entire hydrograph
• Design storms based on the Texas Empirical Hyetographs can be built using TXHYETO
• The result from TXHYETO can be directly pasted into HEC-HMS (or SWMM)


