Basic Ground Flare Noise Propagation - University of...
27
Basic Ground Flare Noise Propagation BRYAN L. BECK, P.E. Senior Flare Applications Engineer UOP Callidus
Transcript of Basic Ground Flare Noise Propagation - University of...
Basic Ground Flare Noise Propagation
BRYAN L. BECK, P.E.
Senior Flare Applications Engineer
UOP Callidus

1
ContentsIntroduction ............................................................................................................................................ 3
Sound Basics............................................................................................................................................ 3
Figure 1: Hearing Loss vs. Age, Frequency, and Sex ............................................................................. 3
Figure 2: Sound Pressure Level (SPL) and Sound Pressure (Pa)1 ........................................................... 4
Figure 3: Equal Loudness Curves (Fletcher-Munson Curves) ................................................................ 5
Figure 4: A-Weighted Adjustments to Noise Measurement ................................................................. 6
Table 1: Permissible Noise Exposures .................................................................................................. 7
Noise Propagation ................................................................................................................................... 8
Directivity ................................................................................................................................................ 9
Figure 5: Directivity Index at Stack Exit, Large Diameter Stack8 .......................................................... 10
Atmospheric Absorption ........................................................................................................................ 10
Figure 6: Atmospheric Absorption vs. Frequency5 ............................................................................. 11
Figure 7: Vegetation Attenuation vs. Frequency7............................................................................... 12
Reflection .............................................................................................................................................. 12
Figure 8: Direct Path vs. Reflected Sound .......................................................................................... 13
Refraction ............................................................................................................................................. 13
Figure 9: Refraction of an Elevated Source ........................................................................................ 14
Barriers ................................................................................................................................................. 14
Figure 10: Ground Flare Sound Path with Solid Barrier ...................................................................... 15
Figure 11: Ground Flare Sound Path with High Air Flow Barrier ......................................................... 16
Figure 12: Transmission Loss Through Steel Plate9 ............................................................................ 16
Totally Enclosed Ground Flare (TEGF) Combustion Noise Testing ........................................................... 17
Figure 13: Totally Enclosed Ground Flare (TEGF) ............................................................................... 17
Figure 14: Digital Combustion Model, Typical Side-Fired Totally Enclosed Ground Flare (TEGF) ......... 18
Table 2: Totally Enclosed Ground Flare Measurement Points ............................................................ 19
Figure 15: Elevation View, Sound Measurement Points ..................................................................... 19
Figure 16: Plan View, Sound Measurement Points ............................................................................ 19
Table 2: Totally Enclosed Ground Flare Measurement Data .............................................................. 21
Figure 17: Totally Enclosed Ground Flare Noise Test, Steam Only ...................................................... 22
Figure 18: Comparative Noise Profile, A-Weighted ............................................................................ 23

2
Figure 19: Comparative Noise Profile, Unweighted ........................................................................... 24
Conclusions and Summary ..................................................................................................................... 25
References ............................................................................................................................................ 26

3
IntroductionIn recent years, global demand for ground-based flare systems has increased greatly. Groundflares have many advantages over a typical elevated flare, including reduced flame visibility andgreater smokeless capacity. These two features of ground flares are well-suited to usage inpopulated or heavily industrialized areas where the visible flame and smoke production of anelevated flare would have a significant impact on the surrounding community.
The noise principles presented in this paper are not new. This paper is an attempt to presentthe basic principles of environmental noise in such a way that the flare operator can make aninformed decision regarding the flare technology selected.
SoundBasicsSound is the result of a vibrating source generating a series of pressure waves in the air. Noiseis sound from any source that results in annoyance and/or hearing loss.1 The human ear isextremely sensitive to these small pressure waves. The normal ear of a young person candetect pressures as low as 20 Pa. This represents a ratio of 1:2 x 10¹⁰ to normal atmosphericpressure.2 In other words, a pressure change of 0.000 000 02% is audible to the human ear atcertain frequencies.
The normal ear of a young person can hear all frequencies ranging from 20 Hz to 20,000 Hz.3 Asa person ages, the ability to hear higher frequencies gradually diminishes. Hearing loss at highfrequencies is more prevalent in men than women.
Figure 1: Hearing Loss vs. Age, Frequency, and Sex
[Harry F. Olson. Modern Sound Reproduction. Krieger Publishing Company, 1978]
Because the range of human hearing encompasses such a broad range, sound is normallymeasured on a log-based scale known as the Decibel (dB) scale.

4
decibel = 10Log( )
Total acoustic energy is very difficult to measure; however, acoustic energy is proportional tothe square of the sound pressure.
decibel = 10Log( )
This can be restated as:
decibel = 20Log( )
The reference sound pressure (zero on the decibel scale) is set at 20 Pa.
Figure 2: Sound Pressure Level (SPL) and Sound Pressure (Pa)1
As the decibel scale is a logarithmic scale, the rules for adding logarithms must be followedwhen adding the sound pressure level (SPL) of two sources. For example, if you have two 85 dBsources side-by-side, the total SPL is 88 dBa. The formula for adding multiple sources in decibelunits is:

5
= 10 ( 10( ))
The human ear is not equally sensitive across the entire audible spectrum. At typical officevolume, the ear is significantly more sensitive to sound in the region from 2,000 to 5,000 Hzthan at other frequencies as is shown in the following graph.
Figure 3: Equal Loudness Curves (Fletcher-Munson Curves)
(R. Nave. “Equal Loudness Curves” hyperphisics.phy-astr.gsu.edu. Retrieved July 12, 2013, fromhttp://hyperphysics.phy-astr.gsu.edu/sound/eqloud.html)
In order to compensate for variations in sensitivity across the audible spectrum, a weightingfactor is normally applied to SPL measurements taken in industrial environments. The mostcommon is “A” weighting. Measurements adjusted by the “A” weighting are normally referredto in units of dBA. By using A-weighting to adjust SPL measurement, the resultingmeasurement more accurately reflects the response of the human ear.

6
Figure 4: A-Weighted Adjustments to Noise Measurement
In order to limit hearing damage in the United States, the US Occupational Health and SafetyAdministration (OSHA) has issued regulations concerning noise exposure in the workplace.These regulations establish dose limits based on sound pressure level vs. exposure time.Similar regulations exist in other countries. The OSHA standard effectively limits long termpersonnel noise exposure to <90 dBA.

7
Table 1: Permissible Noise Exposures
(29 CFR 1910.95(b)(2) Table G-16)
Duration per Day, HoursSound Level dBA Slow
Response
8 90
6 92
4 95
3 97
2 100
1 ½ 102
1 105
½ 110
¼ or Less 115
The total noise dose for an individual can be calculated using the equation:
% =
For this equation, Ci is the actual time exposed to each dB level and Ti is the actual timeexposed at each noise level. In addition to the maximum limits, a dose in excess of 50% will beplaced in a hearing conservation program. For example, exposure to 90 dBA in excess of fourhours would exceed 50% dose and would require a hearing conservation program for theemployee. There are several employer requirements associated with a hearing conservationprogram, including a requirement for annual employee audiograms provided free of charge bythe employer.
Additional studies have shown that continuous noise exposure to 70 dBA or less over a forty-year working life would produce virtually no hearing loss. Exposure to 75 dBa or less for eight

8
hours per day over a forty-year working life was found to be acceptable. Both criteria are veryrestrictive and have not been incorporated into OSHA regulations.4
Flare specifications are often written that require flares to operate at 85 dBa or less at themaximum rate. For an elevated flare designed for emergency service, designing the flare for 85dBA or less at the maximum emergency rate might result in greatly increased flare cost for verylittle value. First, an emergency flare will only operate at high rates for short periods of time.Second, the radiant heat generated by an emergency flare at high waste gas flow rates willgenerally force personnel to evacuate the area long before noise damage occurs. However,efforts to reduce the noise profile of a flare system at sustained rates could provide moreenvironmental benefit for the cost incurred.
NoisePropagationNoise propagation in an industrial environment is affected by geometrical spreading,atmospheric refraction, attenuation and reflection due to barriers, atmospheric absorption, andattenuation from intervening vegetation.5 The noise field emitted from a flare is generally splitinto two fields: far field and near field. In the far field, the noise source is normally modeled aspoint source. The point source approximation is often applied to elevated flare tip because theelevated tip will usually be a significant distance from a measuring location.
Noise propagation from a point source undergoes spherical spreading. During sphericalspreading the sound pressure is proportional to the area of the sphere. Therefore, for eachdoubling in distance from the point source the sound pressure level will be reduced by 6 dB.6
Sound calculations in the near field will be much more difficult. In the near field, there may bemultiple noise sources or a large noise source spread over some distance.6 Noise propagation isnot spherical in the near field. For example, if a noise monitor were mounted on an elevatedplatform near a flare tip, noise would not appear to be spreading spherically. Instead, the noisewould be emitted from multiple locations, including:
Jet noise at the flare exitCombustion noise along the length of the flameJet noise from assist steam
For flare equipment near field noise is extremely difficult to calculate. For elevated flares nearfield noise calculations are normally not of concern. Anyone standing in the near field of anelevated flare would likely be injured by the flame long before the noise because a safetyconcern.
9
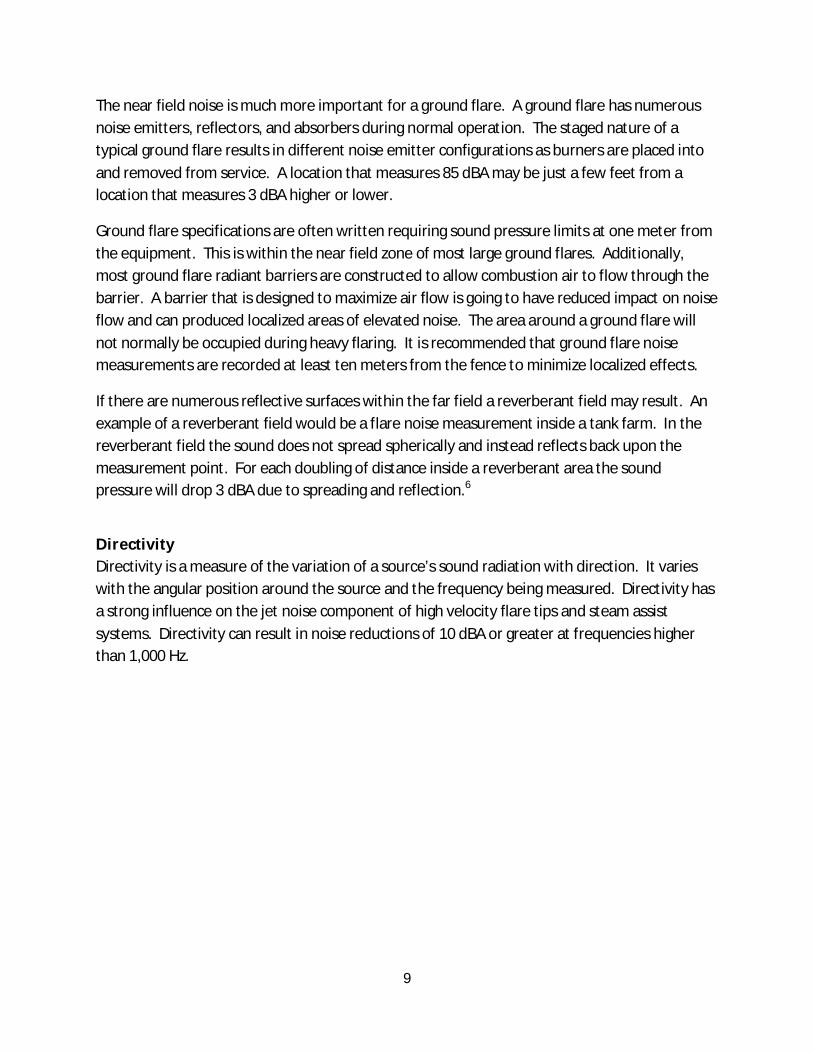
The near field noise is much more important for a ground flare. A ground flare has numerousnoise emitters, reflectors, and absorbers during normal operation. The staged nature of atypical ground flare results in different noise emitter configurations as burners are placed intoand removed from service. A location that measures 85 dBA may be just a few feet from alocation that measures 3 dBA higher or lower.
Ground flare specifications are often written requiring sound pressure limits at one meter fromthe equipment. This is within the near field zone of most large ground flares. Additionally,most ground flare radiant barriers are constructed to allow combustion air to flow through thebarrier. A barrier that is designed to maximize air flow is going to have reduced impact on noiseflow and can produced localized areas of elevated noise. The area around a ground flare willnot normally be occupied during heavy flaring. It is recommended that ground flare noisemeasurements are recorded at least ten meters from the fence to minimize localized effects.
If there are numerous reflective surfaces within the far field a reverberant field may result. Anexample of a reverberant field would be a flare noise measurement inside a tank farm. In thereverberant field the sound does not spread spherically and instead reflects back upon themeasurement point. For each doubling of distance inside a reverberant area the soundpressure will drop 3 dBA due to spreading and reflection.6
DirectivityDirectivity is a measure of the variation of a source’s sound radiation with direction. It varieswith the angular position around the source and the frequency being measured. Directivity hasa strong influence on the jet noise component of high velocity flare tips and steam assistsystems. Directivity can result in noise reductions of 10 dBA or greater at frequencies higherthan 1,000 Hz.

10
Figure 5: Directivity Index at Stack Exit, Large Diameter Stack8
AtmosphericAbsorptionAir is not a perfect transmitter of sound. As sound energy passes through the air it is absorbedby the gasses that make up the atmosphere. The absorption of sound is particularlypronounced at high frequencies but is almost negligible at low frequencies.

11
Figure 6: Atmospheric Absorption vs. Frequency5
Ground cover and trees also serve to attenuate noise. The noise is attenuated by reflection andabsorption of the leaves. While vegetation is normally limited inside an industrial facility,vegetation is often left as a visual screen between an industrial facility and surroundingresidential areas. Vegetation provides very good attenuation of high frequency noise but itsimpact on low frequency noise is limited. Deciduous trees provide an insignificant amount ofnoise reduction during the winter months.
The graph below is a sample plot of vegetation attenuation versus frequency. Actualvegetation attenuation will vary widely based on the type, thickness, and height of thevegetation.7

12
Figure 7: Vegetation Attenuation vs. Frequency7
ReflectionSound waves will reflect from hard surfaces. Different surfaces reflect noise differently.Surfaces such as grass or snow tend to absorb more sound and reflect less than surfaces such asgravel or water.
An observer close to the ground could receive both direct path sound waves and reflectedsound waves from the ground. However, this rarely doubles the amount of sound receivedbecause the reflected sound wave is rarely perfectly in phase with the direct path sound wave.Under certain conditions, the reflected sound wave will be near 180 out-of-phase with thedirect path sound wave, resulting in partial cancellation of the direct path noise near grade. Inthe United States and Canada the regulatory receiver height is 1.5 meters, which means thereceiver could be in the cancellation zone. In Europe, the regulatory receiver height is 4meters, which means the receiver will always be above a potential noise cancellation zone.5

13
Figure 8: Direct Path vs. Reflected Sound
RefractionThe speed of sound (a) in dry air at 0 C and one atmosphere is 330 meters per second. Thespeed of sound in air is proportional to the square root of the temperature.10
Sound waves will travel in a straight line in a homogenous atmosphere. In an outdoor industrialenvironment the atmosphere is rarely homogenous. There will normally be wind, temperature,and humidity variations across a given vertical column of air. As sound passes through thesevariations, the local speed of sound will vary, resulting in curving of the sound propagationpath.
The following figure represents a flat location with solar heating of the ground. Solar heatingresults in higher temperatures near grade causing the sound to curve upwards. The lower arc isthe limiting arc and just grazes the ground before curving upwards. The curvature of the arccreates a shadow zone in which flare noise is only audible through diffraction or reflection fromadjacent structures.5

14
Figure 9: Refraction of an Elevated Source
A problematic case is a negative temperature inversion in which the temperature increaseswith increasing elevation. During temperature inversion conditions, the flare sound path curvesdownward towards grade. Under ideal conditions, the noise reflects upward from grade andcurves back towards grade. This is particularly noticeable over water and other flat, hardsurfaces. The sound cannot escape upwards and only spreads over two dimensions rather thanthree. This results in noise propagation over extremely long distances. This effect is not limitedto temperature inversions. Wind at high elevations can also refract sound downward.5
BarriersAny large and dense object that blocks the path of a sound wave is considered a barrier.5
Some examples include a concrete wall, a tank, a building, or a solid radiation barrier around arectangular ground flare. These barriers create a shadow zone. Sound does not have a directpath into the shadow zone and must enter the zone by diffraction around the barrier,diffraction over the barrier, or transmission through the barrier. Dense barriers are typicallydefined has having a mass per unit area of 20 kg/m2 or greater excluding framing. A densebarrier will have transmission loss in excess of 25 dB at 500 Hz.5 For engineering purposesdirect sound transmission through the dense barrier can be ignored.
The amount of attenuation due to diffraction over a barrier is primarily determined by theFresnel number.
=2
15
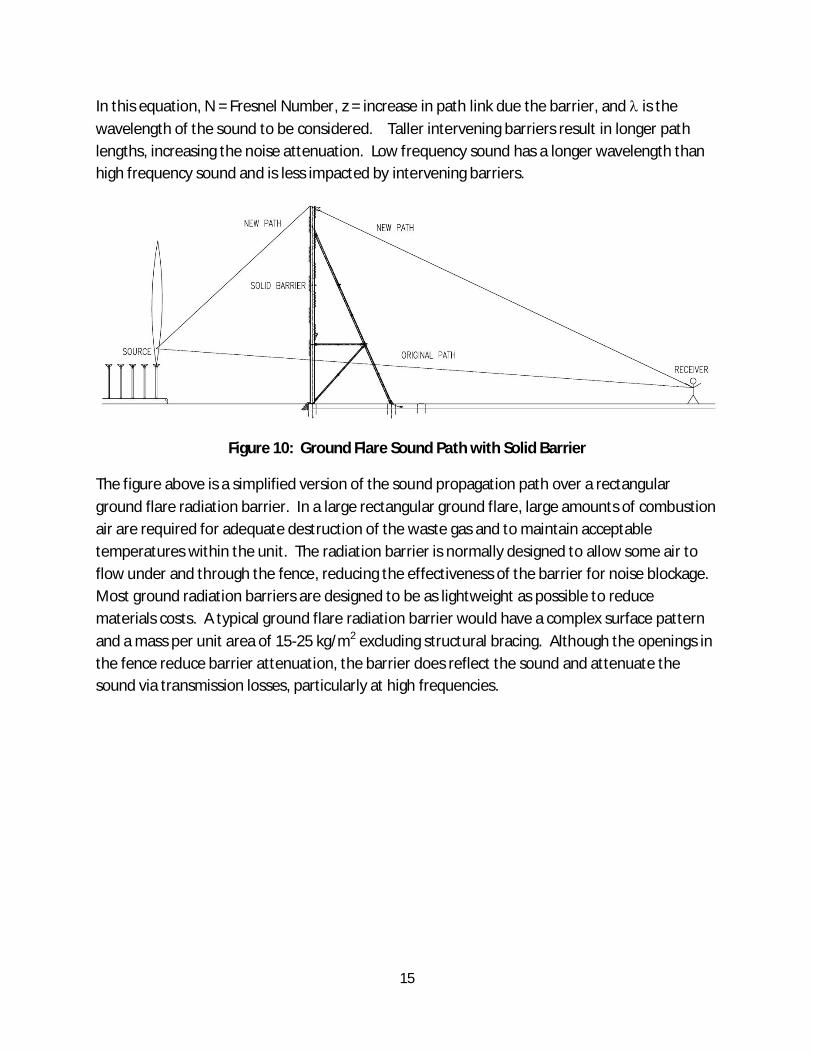
In this equation, N = Fresnel Number, z = increase in path link due the barrier, and is thewavelength of the sound to be considered. Taller intervening barriers result in longer pathlengths, increasing the noise attenuation. Low frequency sound has a longer wavelength thanhigh frequency sound and is less impacted by intervening barriers.
Figure 10: Ground Flare Sound Path with Solid Barrier
The figure above is a simplified version of the sound propagation path over a rectangularground flare radiation barrier. In a large rectangular ground flare, large amounts of combustionair are required for adequate destruction of the waste gas and to maintain acceptabletemperatures within the unit. The radiation barrier is normally designed to allow some air toflow under and through the fence, reducing the effectiveness of the barrier for noise blockage.Most ground radiation barriers are designed to be as lightweight as possible to reducematerials costs. A typical ground flare radiation barrier would have a complex surface patternand a mass per unit area of 15-25 kg/m2 excluding structural bracing. Although the openings inthe fence reduce barrier attenuation, the barrier does reflect the sound and attenuate thesound via transmission losses, particularly at high frequencies.

16
Figure 11: Ground Flare Sound Path with High Air Flow Barrier
Figure 12: Transmission Loss Through Steel Plate9

17
TotallyEnclosedGroundFlare(TEGF)CombustionNoiseTestingUOP Callidus designs, manufactures, and installs cylindrical enclosed-flame flares. They aremarketed as Totally Enclosed Ground Flares (TEGFs). Major components of a TEGF normallyinclude:
Self-supporting, refractory-lined, open top combustion cylinder.Stainless steel high stability burner system. The burners may be side fired or bottomfired.Lower combustion air windows at the bottom of the cylinder. The majority of thecombustion air is drawn into the unit via natural draft in the combustion cylinder.Lower wind fence. The lower wind fence blocks crosswind through the unit, protectsthe surroundings from direct radiation from the flame, and reduces medium and high-frequency jet noise.Staging control system. The staging control system matches the numbers of burners onservice with the system demand.Continuous burner pilots.Burner smokeless assist system. At low firing rates, small amounts steam, air, or assistgas is normally injected into the flame to promote mixing and eliminate smoke. At highfiring rates the assist system is not normally needed for smokeless operation.Access ladders, platforms, and sampling points as required.
Figure 13: Totally Enclosed Ground Flare (TEGF)
18
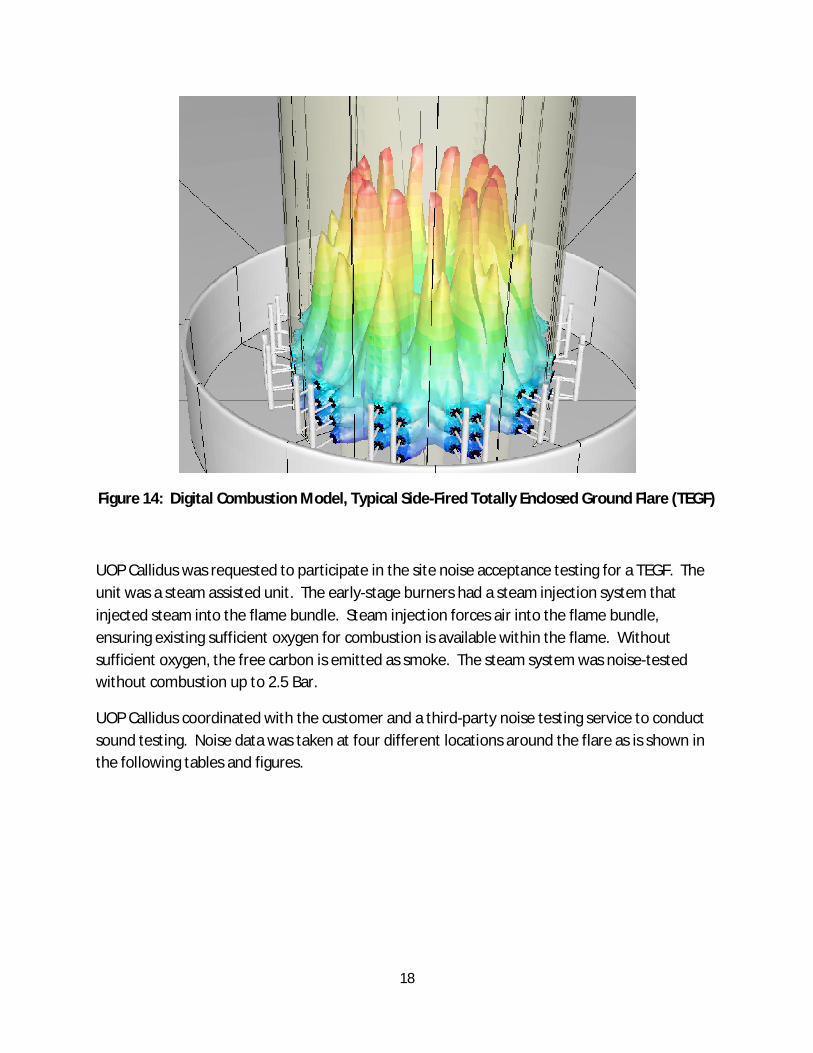
Figure 14: Digital Combustion Model, Typical Side-Fired Totally Enclosed Ground Flare (TEGF)
UOP Callidus was requested to participate in the site noise acceptance testing for a TEGF. Theunit was a steam assisted unit. The early-stage burners had a steam injection system thatinjected steam into the flame bundle. Steam injection forces air into the flame bundle,ensuring existing sufficient oxygen for combustion is available within the flame. Withoutsufficient oxygen, the free carbon is emitted as smoke. The steam system was noise-testedwithout combustion up to 2.5 Bar.
UOP Callidus coordinated with the customer and a third-party noise testing service to conductsound testing. Noise data was taken at four different locations around the flare as is shown inthe following tables and figures.
19
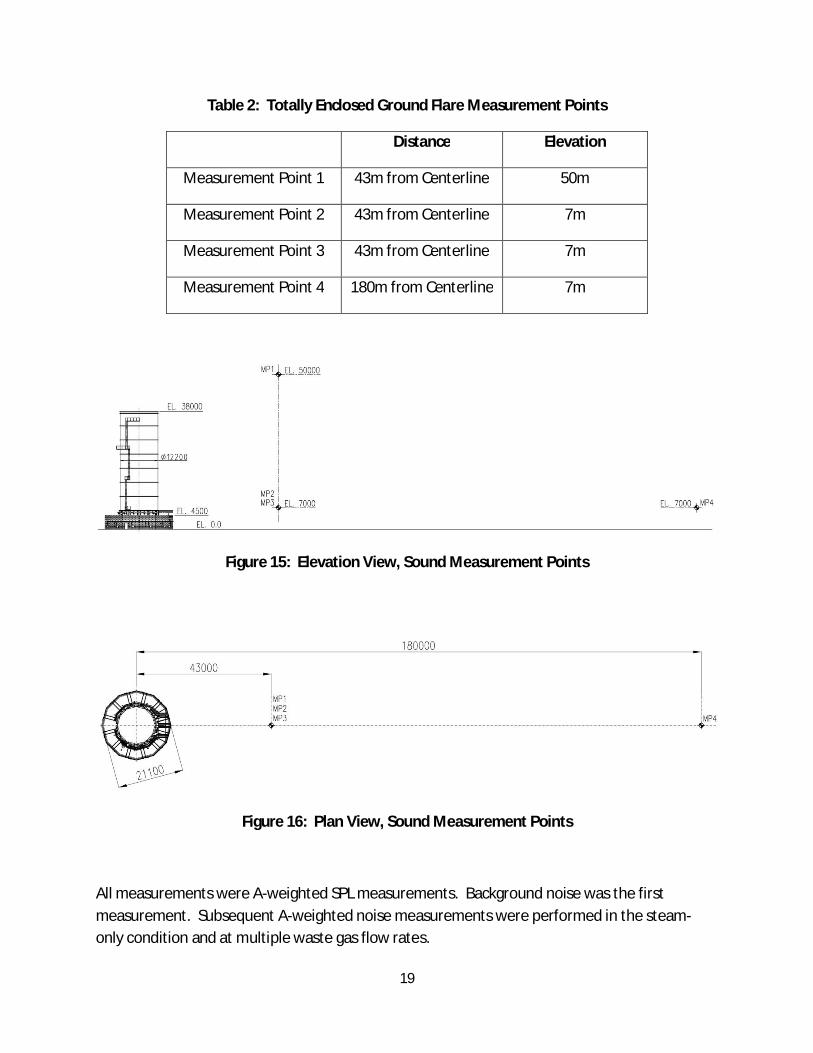
Table 2: Totally Enclosed Ground Flare Measurement Points
Distance Elevation
Measurement Point 1 43m from Centerline 50m
Measurement Point 2 43m from Centerline 7m
Measurement Point 3 43m from Centerline 7m
Measurement Point 4 180m from Centerline 7m
Figure 15: Elevation View, Sound Measurement Points
Figure 16: Plan View, Sound Measurement Points
All measurements were A-weighted SPL measurements. Background noise was the firstmeasurement. Subsequent A-weighted noise measurements were performed in the steam-only condition and at multiple waste gas flow rates.

20
With a known background level, SPL was calculated for each sampled case. MP1 was found tobe the loudest location despite being further from the burners than MP2 or MP3. Possibleexplanations include:
Directivity effects on the flow and combustion noise at the stack exit.Heavy refraction of the burner jet noise and combustion noise.
o Upward velocity of the combustion products would tend to refract the noiseupwards
o Higher temperatures between the burners would cause the burner jet noise torefract upward as it traveled laterally across the unit.
Less noise diffusion of the noise exiting the upper portion of the stack. Noise from thelower portion of the stack would be required to propagate through a more tortuouspath through the combustion windows, past the burners and piping, and over the windfence.

21
Table 2: Totally Enclosed Ground Flare Measurement Data
Waste Gas (tons/hr) Steam(tons/hr)
MP1 MP2 MP3 MP4
- - 70 64 63 61 BackgroundMeasurement
- 28 78.2 74.0 72.2 61 2.5 Bar SteamPressure
Steam Only- 2 78.0 73.0 72.2 61 2.0 Bar Steam
PressureSteam Only
- 19.5 77.4 72.0 72.0 61 1.5 Bar SteamPressure
Steam Only26.5 7 78.0 71.5 72.8 6272.5 9.5 79.6 73.0 74.2 6582 11 79.8 72.5 73.4 62.596 12 80.3 72.5 72.8 63.5
107 15 80.1 72.0 72.9 63Burners Forced
UnstableWith Steam Injection20 tons/hr Waste Gas
Not Recorded 85.4 - 85.5 74 Strong Vibrationsand Oscillations
Burners at Stability Limit100 tons/hr Waste Gas
Not Recorded 83.4 - 80.5 -
Burners at Stability Limit100 tons/hr Waste Gas
Not Recorded 81.0 - 76.5 -
Three steam system noise tests were performed at various flow rates. Steam system noise wasmuch less than background noise levels below 500 Hz.
Background noise was found to be inconsequential for all combustion measurements.

22
Figure 17: Totally Enclosed Ground Flare Noise Test, Steam Only
The most noteworthy portion of the combustion data plot is the noise impact of flameinstability. When the flame was purposely driven unstable through excess steam injection, theburners would oscillate between lit and unlit at 34 to 39 Hz, creating a heavy resonance effectin the combustion cylinder. Even though the waste gas flow rate was relatively low, the noiselevel was very loud in the 31.5 Hz frequency band. The high noise was easily corrected byreducing the steam flow to the burners until the burners became stable.
Two additional data sets were added to the combustion data plots. The first is the API 537combustion noise spectrum data set. The API 537 noise spectrum is based on the original workby T.J. Smith and J. K. Kilham. “Noise Generation by Open Turbulent Flames”, The Journal of theAcoustical Society of America, Volume 35, Number 5. May 1963. The original noise spectrumresearch was based on very small flame jets 9.5mm (0.375”) in diameter and smaller. Itcorrelates well above 500 Hz, but does not appear to correlate well at lower frequencies.
The second data set is a typical jet engine backblast noise spectrum.11 Far more research hasbeen done regarding jet engine backblast than has been done on continuous flaring. The A-weighted jet noise spectrum also does not closely correlate with the ground flare noisespectrum.
23
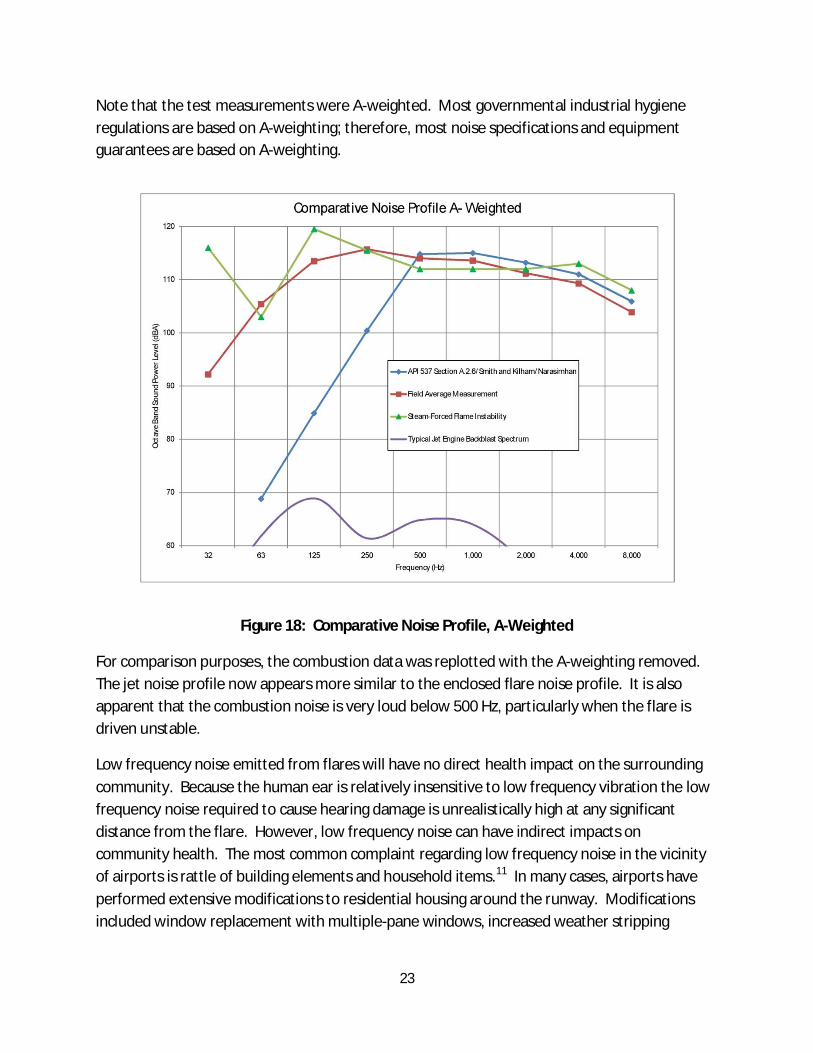
Note that the test measurements were A-weighted. Most governmental industrial hygieneregulations are based on A-weighting; therefore, most noise specifications and equipmentguarantees are based on A-weighting.
Figure 18: Comparative Noise Profile, A-Weighted
For comparison purposes, the combustion data was replotted with the A-weighting removed.The jet noise profile now appears more similar to the enclosed flare noise profile. It is alsoapparent that the combustion noise is very loud below 500 Hz, particularly when the flare isdriven unstable.
Low frequency noise emitted from flares will have no direct health impact on the surroundingcommunity. Because the human ear is relatively insensitive to low frequency vibration the lowfrequency noise required to cause hearing damage is unrealistically high at any significantdistance from the flare. However, low frequency noise can have indirect impacts oncommunity health. The most common complaint regarding low frequency noise in the vicinityof airports is rattle of building elements and household items.11 In many cases, airports haveperformed extensive modifications to residential housing around the runway. Modificationsincluded window replacement with multiple-pane windows, increased weather stripping

24
around doors and windows to stop rattle, and additional attic insulation. Cost is typically in therange of $15,000 to $30,000 per house.11
Figure 19: Comparative Noise Profile, Unweighted
This raises an important point. There aren’t many actions that can be done to reduce lowfrequency noise in residential areas around flare systems. The first solution and most obvioussolution would be to flare less. The second solution is driven by the results of the steaminstability test. The flare burner assist gas system must be operated correctly. If the flare isoperated incorrectly the system will produce extreme low frequency noise.
A third solution would be burner design; however, there are physical limitations regarding whatcan be accomplished via burner design. Consider a modern commercial jet engine. Millions ofdollars of dedicated research and development are expended for each new jet engine design tominimize the low frequency rumble. Even with such a massive expenditure, airports are payingfor attic insulation in surrounding homes because the low frequency noise still exists. Even amedium-sized rectangular ground flare (500,000 kg/hr) burns more fuel at emergency ratesthan dozens of fully-loaded Boeing 777’s at takeoff.
Many low frequency noise reduction solutions have been tried at airports:
25
Trees and shrubs are ineffective noise attenuators at low frequencies.Air absorption is minimal for low frequency noise.Barriers close the source (such as a flare radiant barrier) are ineffective as low frequencynoise simply diffuses over or through the barrier.Barriers can be effective if placed close to the receiver. For example, a 15 foot barrierlocated within 50-100’ of a residence provides some low frequency attenuation withinthe shadow.
One possible solution would be residential-scale active noise cancellation. Active noisecancellation is commonly used in stereo headsets for travelers. Active noise cancellation worksby generating a sound signal that is out of phase with the sound signal from a noise source. Byoverlaying two waves that are out of phase, the noise signal is reduced or eliminated. Thistechnology is commonly used in noise-cancelling headphones.
ConclusionsandSummaryAs is shown in the aforementioned data set, properly operating flare systems can produce asignificant amount of low-frequency combustion noise. Current industry references mightunderestimate the amount of low-frequency noise produced. It is well established that lowfrequency noise can travel extremely long distances with much less attenuation than highfrequency noise. Airport and traffic studies have demonstrated that low frequency noise willnot produce hearing damage, but it can result in significant quality of life issues in thesurrounding community. When placing a ground flare within a residential area, the impact oflow frequency noise upon residential areas should be closely evaluated.

26
References1. Patrick N. Breysse and Peter S. J. Lees, “Noise”, Johns Hopkins School of Public Health,
20062. Leo L. Beranek, “Basic Acoustical Quantities: Levels and Decibels” in Istvan L. Ver and
Leo L. Beranke (Ed.), Noise and Vibration Control Engineering Principles andApplications, Wiley, New Jersey, 2006
3. Sebastian Haskel and David Sygoda. Biology, A Contemporary Approach. New York:Amsco, 1996
4. Suzanne D. Smith, Charles W. Nixon, and Henning E. Von Gierke, “Damage Risk Criteriafor Hearing and Human Body Vibration” in Istvan L. Ver and Leo L. Beranke (Ed.), Noiseand Vibration Control Engineering Principles and Applications, Wiley, New Jersey, 2006
5. Ulrich J. Kurze and Grant S. Anderson, “Outdoor Sound Propagation” in Istvan L. Ver andLeo L. Beranke (Ed.), Noise and Vibration Control Engineering Principles andApplications, Wiley, New Jersey, 2006
6. William W. Lang, George C. Maling, Jr., Matthew A. Nobile, and Jiri Tichy,“Determination of Sound Power Levels and Directivity of Noise Sources” in Istvan L. Verand Leo L. Beranke (Ed.), Noise and Vibration Control Engineering Principles andApplications, Wiley, New Jersey, 2006
7. C. M. Kalansuriya, A. S. Pannila, and D. U. J. Sonnadara, “Effect of roadside vegetation onthe reduction of traffic noise levels”, Proceeding of the Technical Sessions 25, 1-6,Institute of Physics Sri Lanka, 2009
8. Martin Hirschorn, Noise Control Reference Handbook, 1989 Edition. IndustrialAcoustics Company, 1989
9. Istan L. Ver, “Interaction of Sound Waves with Solid Surfaces” in Istvan L. Ver and Leo L.Beranke (Ed.), Noise and Vibration Control Engineering Principles and Applications,Wiley, New Jersey, 2006
10. Michael R. Lindeburg, Mechanical Engineering Reference Manual, Twelfth Edition. PPIBelmont, California. 2006
11. Ben H. Sharp, Yuri A. Gurovich, and William W. Albee, “Status of Low-Frequency AircraftNoise Research and Mitigation”, Wyle Acoustics Group, Arlington, Virginia, 2001
12. N. D. Narasimhan, “Predict flare noise”, Hydrocarbon Processing, April 198613. T. J. B. Smith and J. K. Kilham, “Noise Generation by Open Turbulent Flames”, The
Journal of the Acoustical Society of America, Volume 35 Number 5, May 196314. American National Standards Institute/American Petroleum Institute, “Flare Details for
General Refinery and Petrochemical Service, “ ANSI/API Standard 537 Second Edition,Washington, D.C., December 2008