Basic epidemiologic concept
106
Dr. Mehrdad Askarian, MD, MPH Professor of Community Medicine Shiraz Medical School
Transcript of Basic epidemiologic concept
Dr. Mehrdad Askarian, MD, MPH
Professor of Community Medicine
Shiraz Medical School
Basic
Epidemiologic
Concepts
Basic Epidemiologic Concepts
Greek language
Epi: upon
Demos: population
Logy: study of
Epidemiology is defined as:
Basic Epidemiologic Concepts
• Epidemiology is defined as:– The study of something that affects a
population.– Study of factors that determine the
occurrence and distribution of disease in population.
– One of the ways in which diseases are studied.
Basic Epidemiologic Concepts
• So, there are four levels at which the scientific study of disease can be approached:
– The submolecular or molecular level
– The tissue or organ level
– The level of individual patients
– The level of population
Epidemiologic Measurements
• Frequency– The frequency of a disease, injury or death
can be measured in different ways, and it can be related to different denominators, depending on the purpose of the research and the availability of data.
• The concepts of incidence and prevalence are of fundamental importance to all epidemiology.
Epidemiologic Measurements
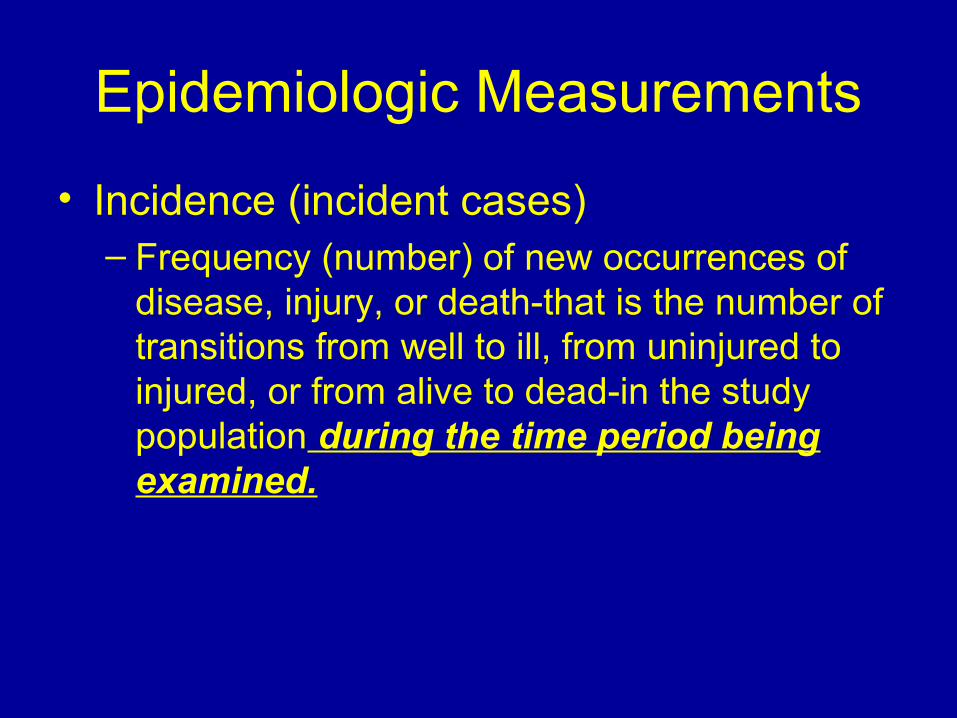
• Incidence (incident cases)– Frequency (number) of new occurrences of
disease, injury, or death-that is the number of transitions from well to ill, from uninjured to injured, or from alive to dead-in the study population during the time period being examined.
Epidemiologic Measurements
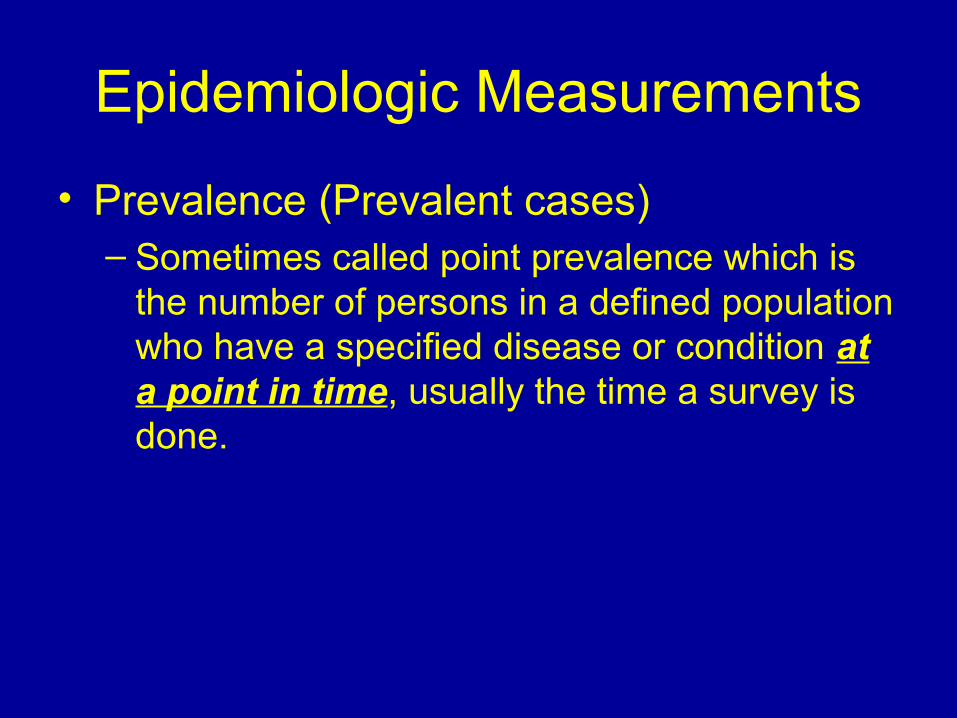
• Prevalence (Prevalent cases)– Sometimes called point prevalence which is
the number of persons in a defined population who have a specified disease or condition at a point in time, usually the time a survey is done.
Epidemiologic Measurements
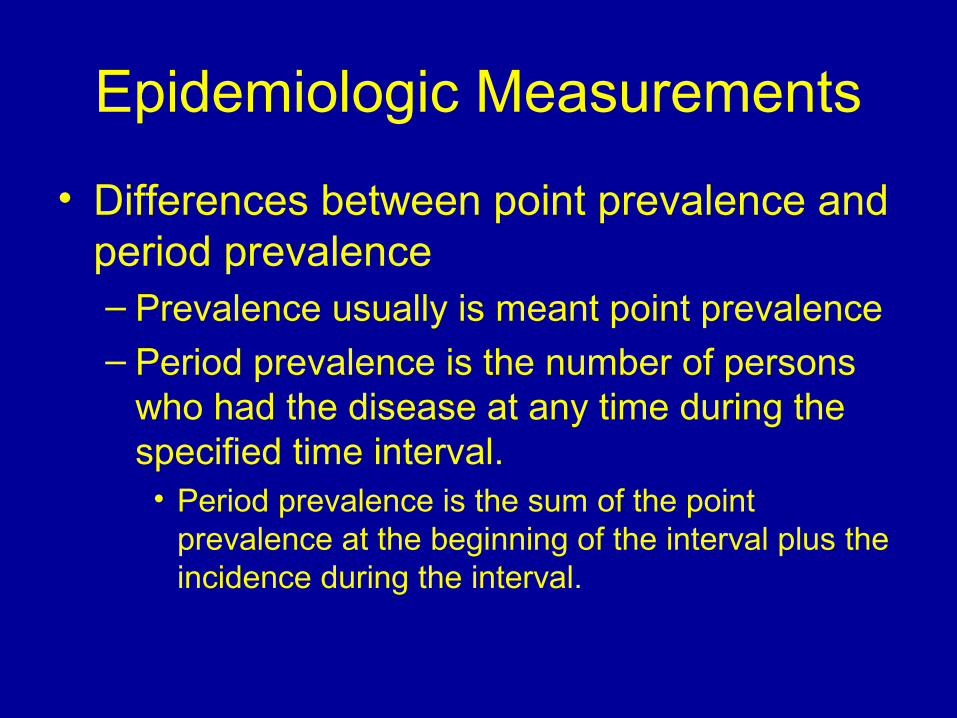
• Differences between point prevalence and period prevalence– Prevalence usually is meant point prevalence– Period prevalence is the number of persons
who had the disease at any time during the specified time interval.
• Period prevalence is the sum of the point prevalence at the beginning of the interval plus the incidence during the interval.
Epidemiologic Measurements (concepts)
Jan 1 Dec 31
1
2
3
4
5
6
7
8
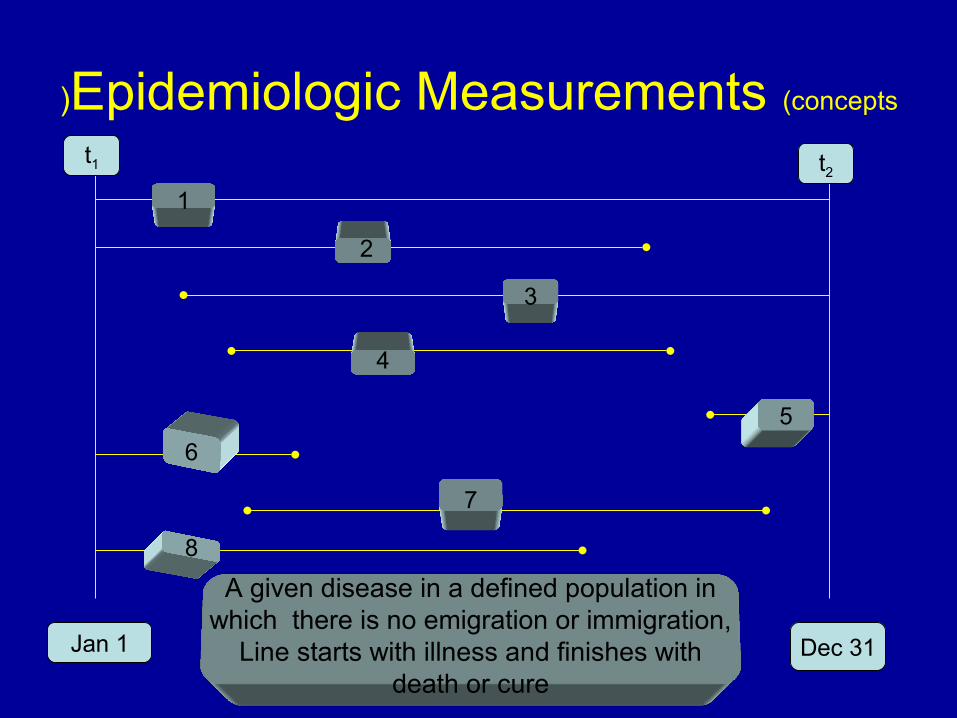
A given disease in a defined population in which there is no emigration or immigration,
Line starts with illness and finishes with death or cure
t1 t2
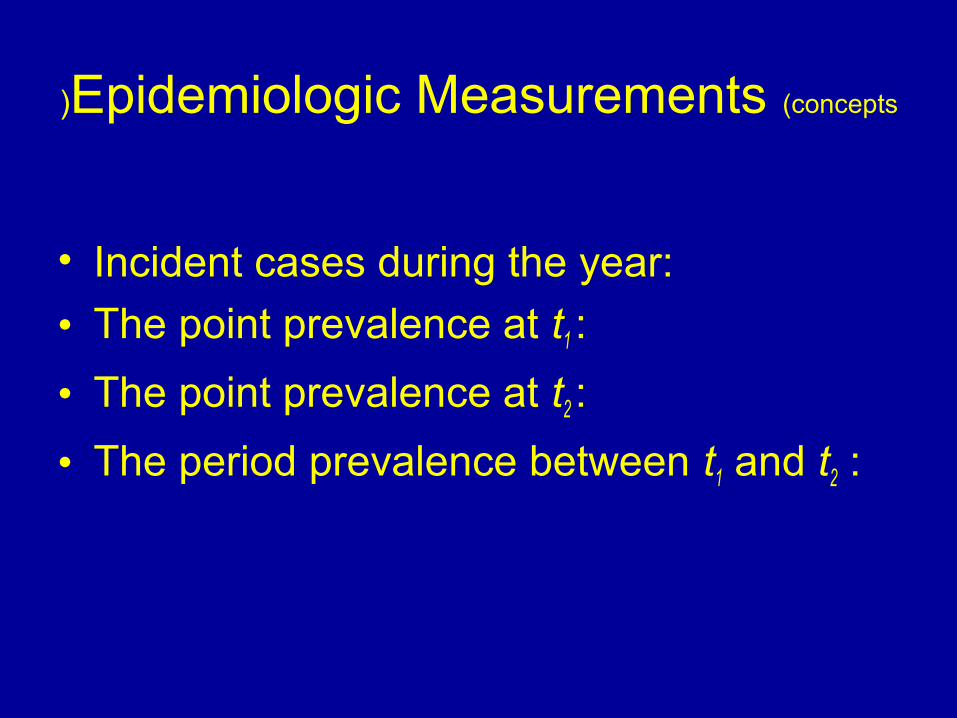
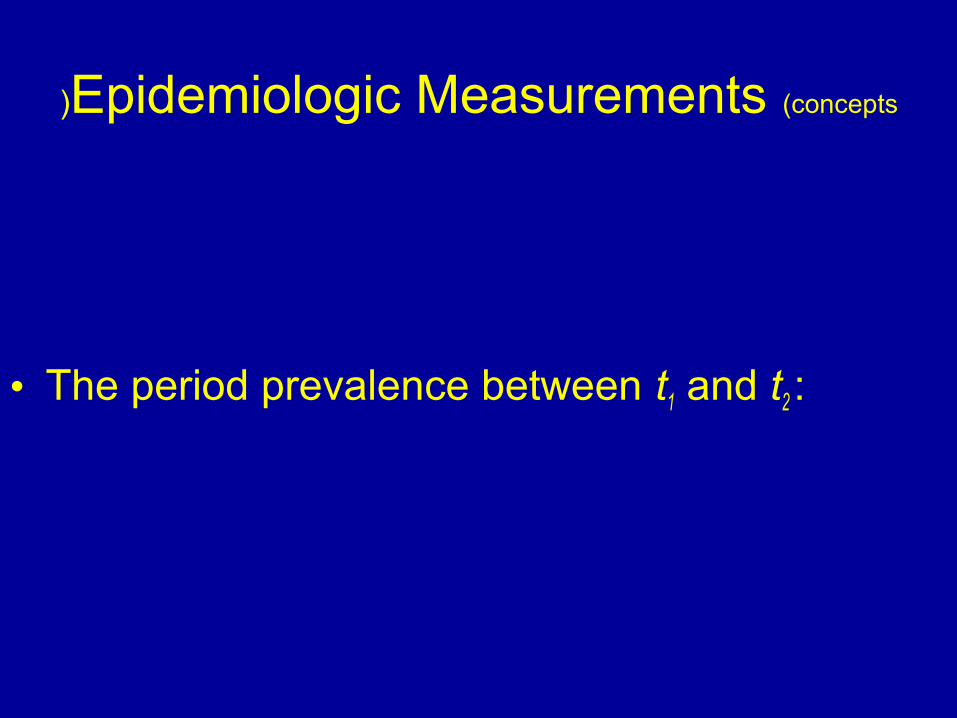
Epidemiologic Measurements (concepts)
• Incident cases during the year:
• The point prevalence at t1 :
• The point prevalence at t2 :
• The period prevalence between t1 and t2 :

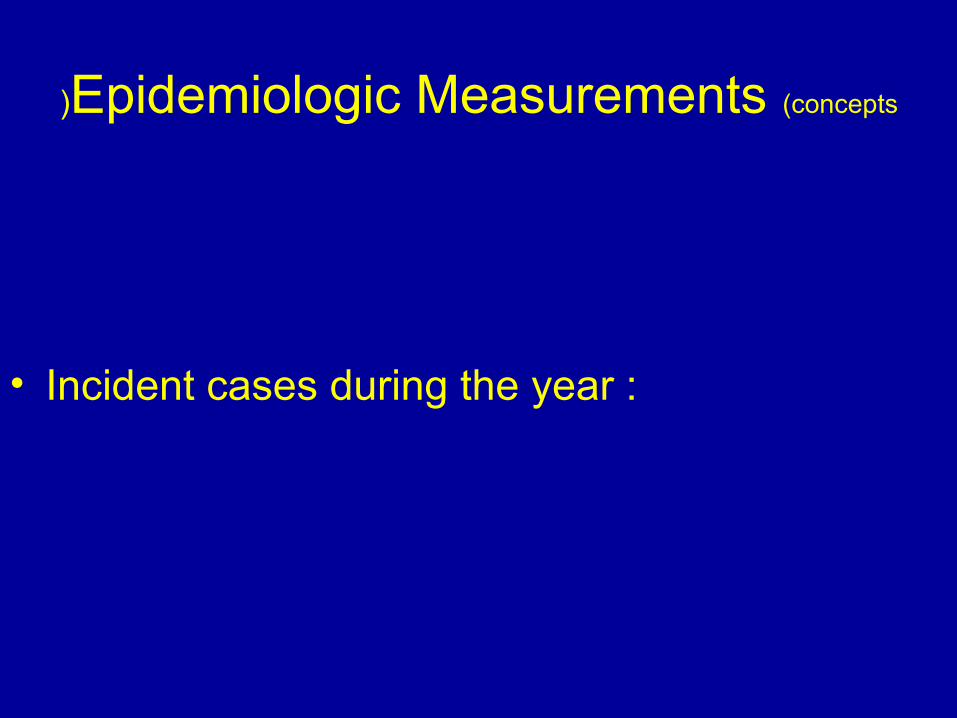
Epidemiologic Measurements (concepts)
• Incident cases during the year :


Epidemiologic Measurements (concepts)
Jan 1 Dec 31
1
2
3
4
5
6
7
8
A given disease in a defined population in which there is no emigration or immigration,
Line starts with illness and finishes with death or cure
t1 t2
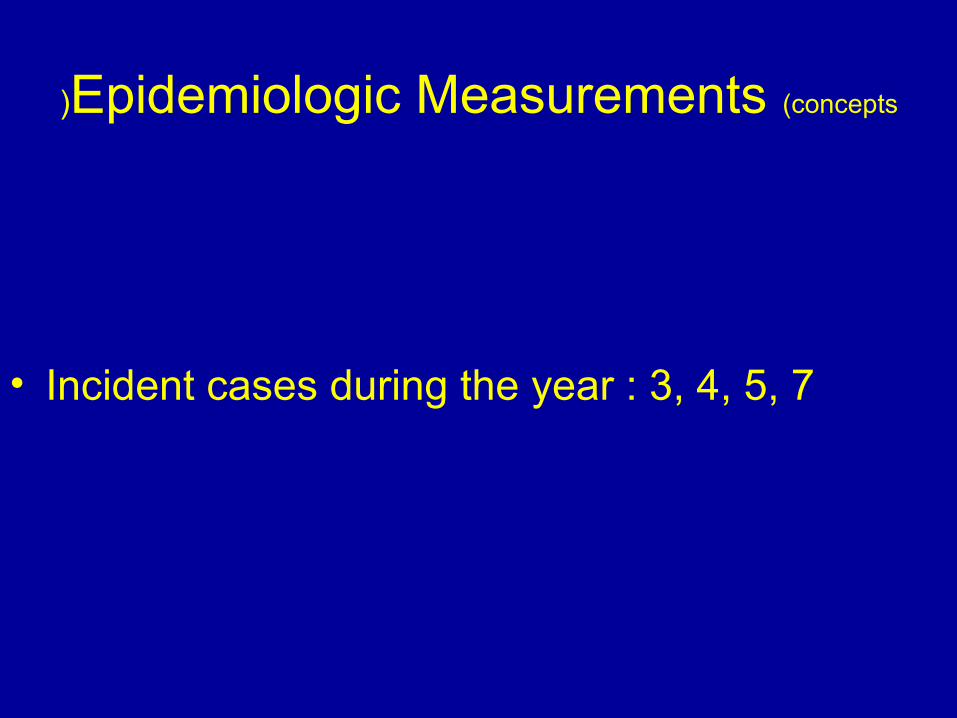
Epidemiologic Measurements (concepts)
• Incident cases during the year : 3, 4, 5, 7

Epidemiologic Measurements (concepts)
Jan 1 Dec 31
1
2
3
4
5
6
7
8
Incident cases during the year : 3, 4, 5, 7
t1 t2
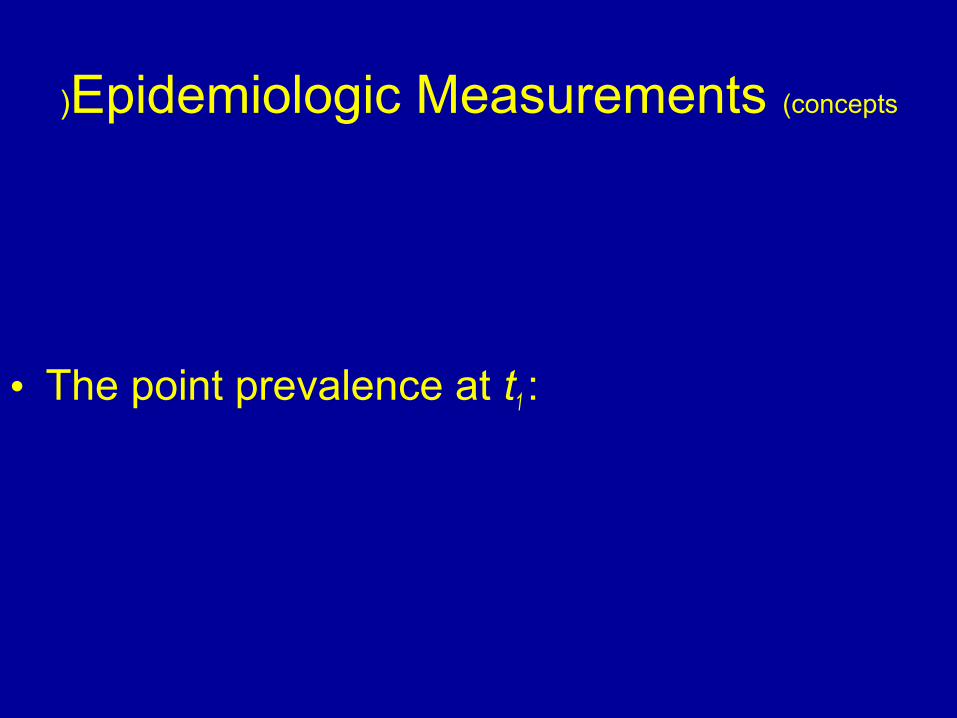
Epidemiologic Measurements (concepts)
• The point prevalence at t1 :


Epidemiologic Measurements (concepts)
Jan 1 Dec 31
1
2
3
4
5
6
7
8
A given disease in a defined population in which there is no emigration or immigration,
Line starts with illness and finishes with death or cure
t1 t2
Epidemiologic Measurements (concepts)
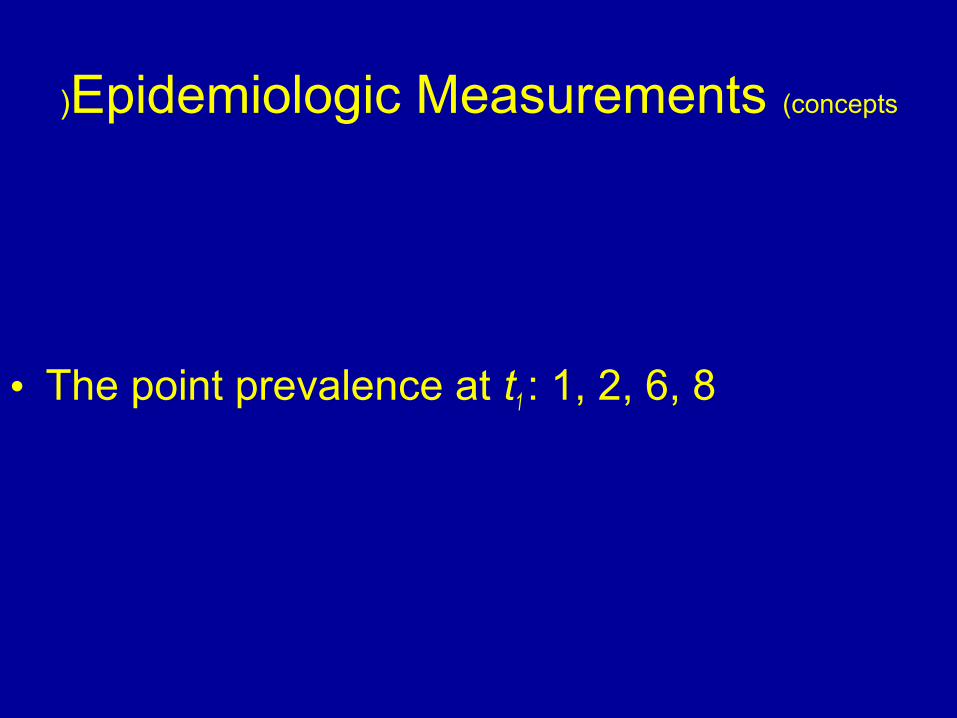
• The point prevalence at t1 : 1, 2, 6, 8

Epidemiologic Measurements (concepts)
Jan 1 Dec 31
1
2
3
4
5
6
7
8
The point prevalence at t1 : 1, 2, 6, 8
t1 t2
Epidemiologic Measurements (concepts)
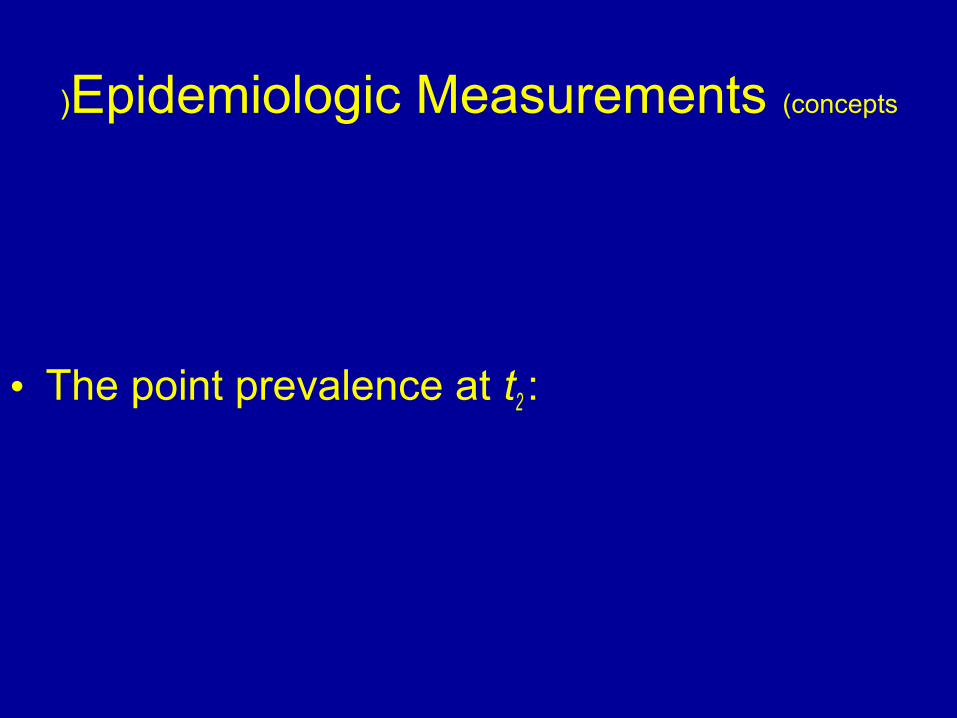
• The point prevalence at t2 :


Epidemiologic Measurements (concepts)
Jan 1 Dec 31
1
2
3
4
5
6
7
8
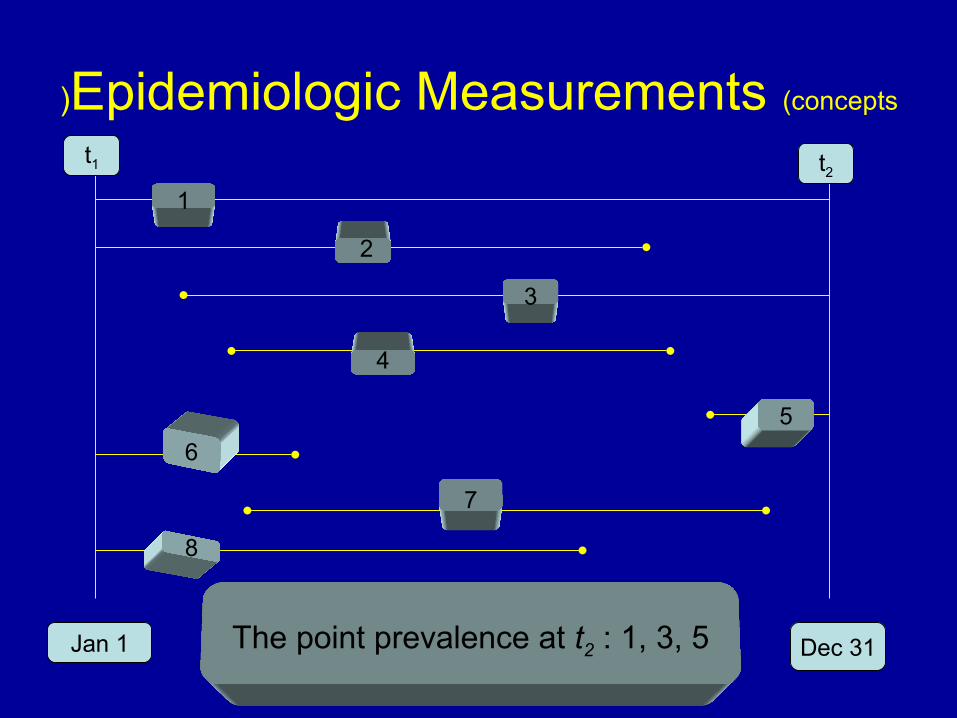
A given disease in a defined population in which there is no emigration or immigration,
Line starts with illness and finishes with death or cure
t1 t2
Epidemiologic Measurements (concepts)
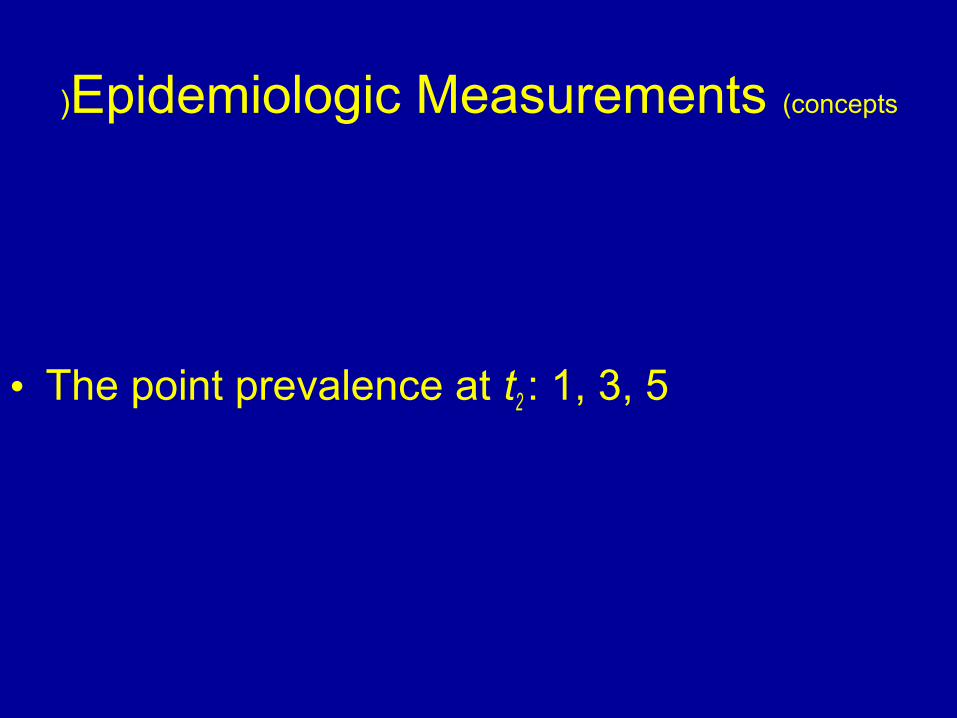
• The point prevalence at t2 : 1, 3, 5
Epidemiologic Measurements (concepts)
Jan 1 Dec 31
1
2
3
4
5
6
7
8
The point prevalence at t2 : 1, 3, 5
t1 t2
Epidemiologic Measurements (concepts(
• The period prevalence between t1 and t2 :


Epidemiologic Measurements (concepts(
Jan 1 Dec 31
1
2
3
4
5
6
7
8
A given disease in a defined population in which there is no emigration or immigration,
Line starts with illness and finishes with death or cure
t1 t2
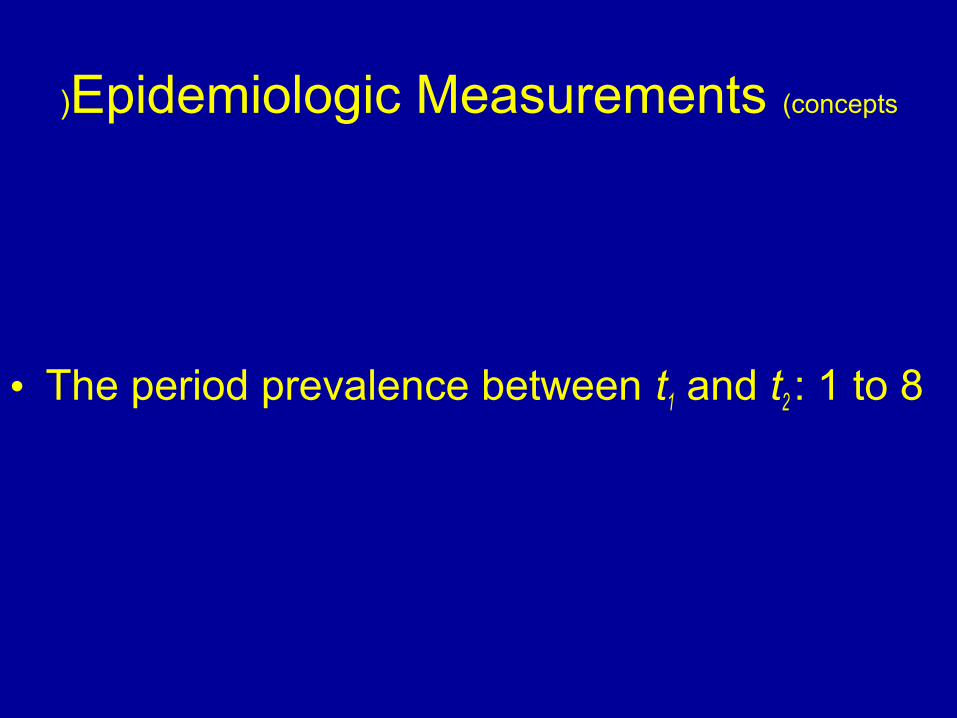
Epidemiologic Measurements (concepts(
• The period prevalence between t1 and t2 : 1 to 8

Epidemiologic Measurements (concepts(
Jan 1 Dec 31
1
2
3
4
5
6
7
8
The period prevalence between t1 and t2 : 1 to 8
t1 t2
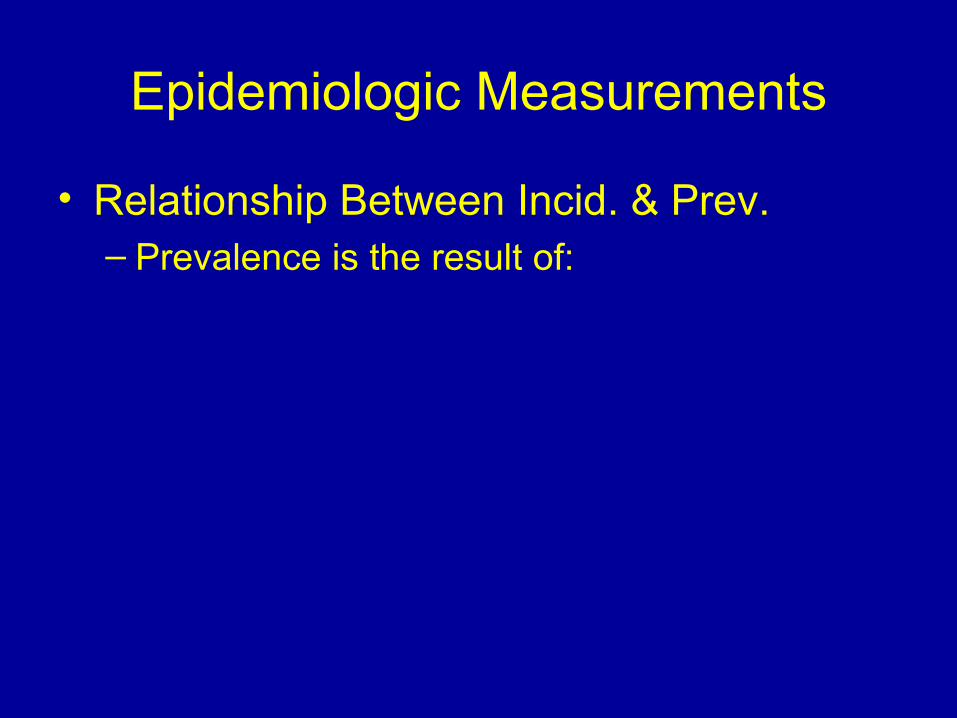
Epidemiologic Measurements
• Relationship Between Incid. & Prev.– Prevalence is the result of:

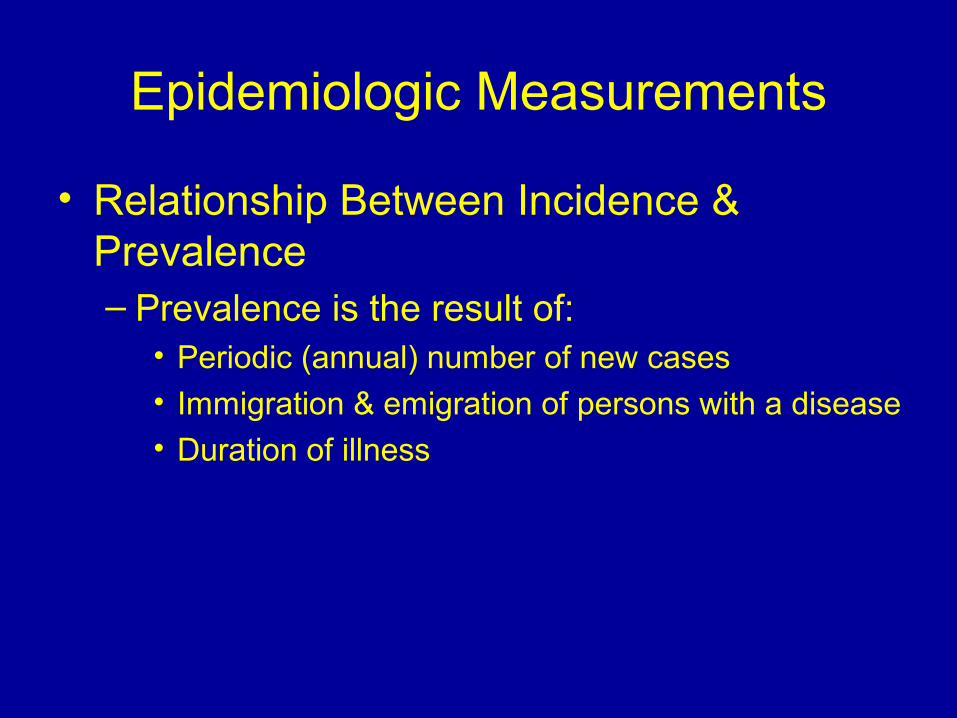
Epidemiologic Measurements
• Relationship Between Incidence & Prevalence– Prevalence is the result of:
• Periodic (annual( number of new cases
• Immigration & emigration of persons with a disease• Duration of illness
Epidemiologic Measurements
P=I*D

Risk• Epidemiologically risk is defined as:
– The proportion of persons who are unaffected at the beginning of a study period but who undergo the risk event during the study period
– The risk event may be death, disease, injury, & the persons at risk for the event are called a cohort.
– Cohort is clearly defined group of persons studied over time.
Limitations of the Concept of Risk
• Who is truly at risk? (susceptible population( who is Ab negative?
• Risk of death from an infectious disease looks simple but is actually complex;
WHY?

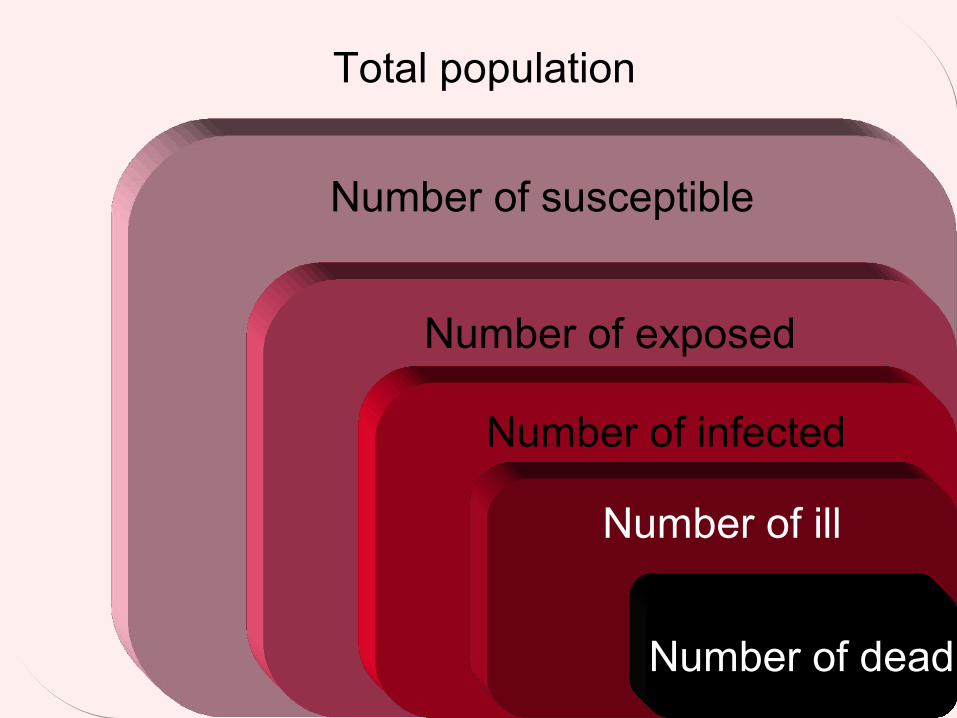
Total population Total population
Number of susceptible
Number of exposed
Number of infected
Number of ill
Number of dead
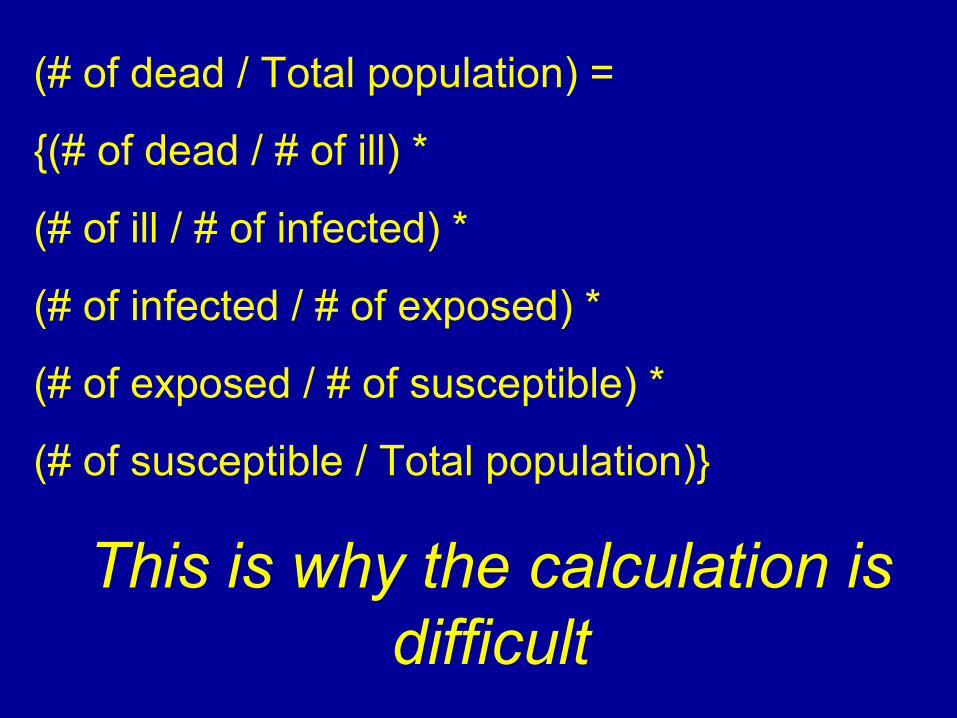
(# of dead / Total population( =
{(# of dead / # of ill( *
(# of ill / # of infected( *
(# of infected / # of exposed( *
(# of exposed / # of susceptible( *
(# of susceptible / Total population(}
This is why the calculation is difficult

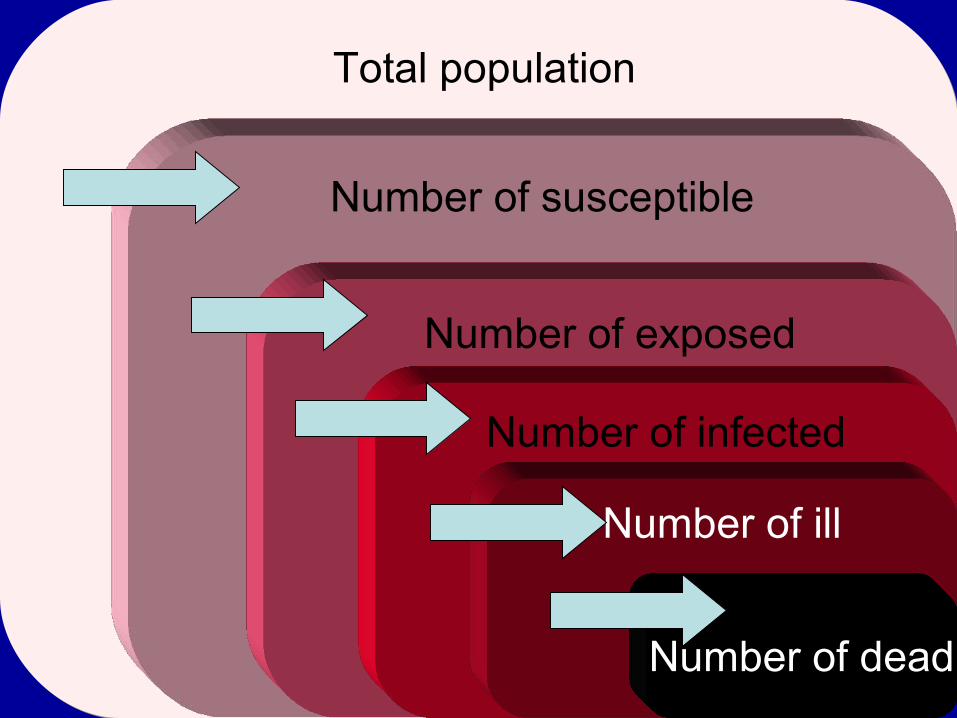
Total population Total population
Number of susceptible
Number of exposed
Number of infected
Number of ill
Number of dead
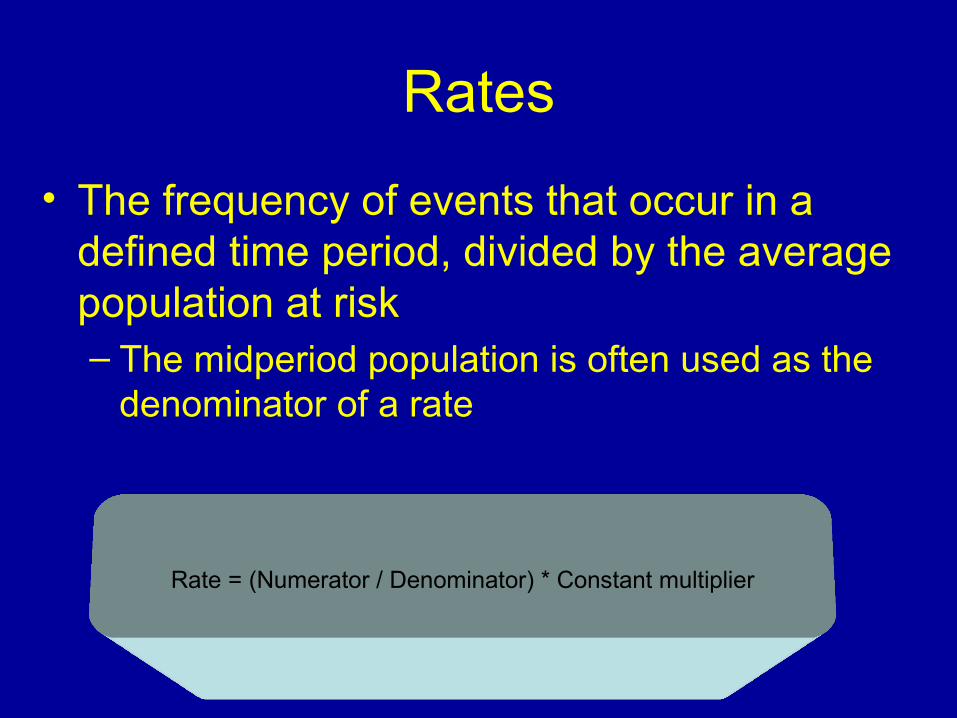
Rates
• The frequency of events that occur in a defined time period, divided by the average population at risk – The midperiod population is often used as the
denominator of a rate
Rate = (Numerator / Denominator( * Constant multiplier
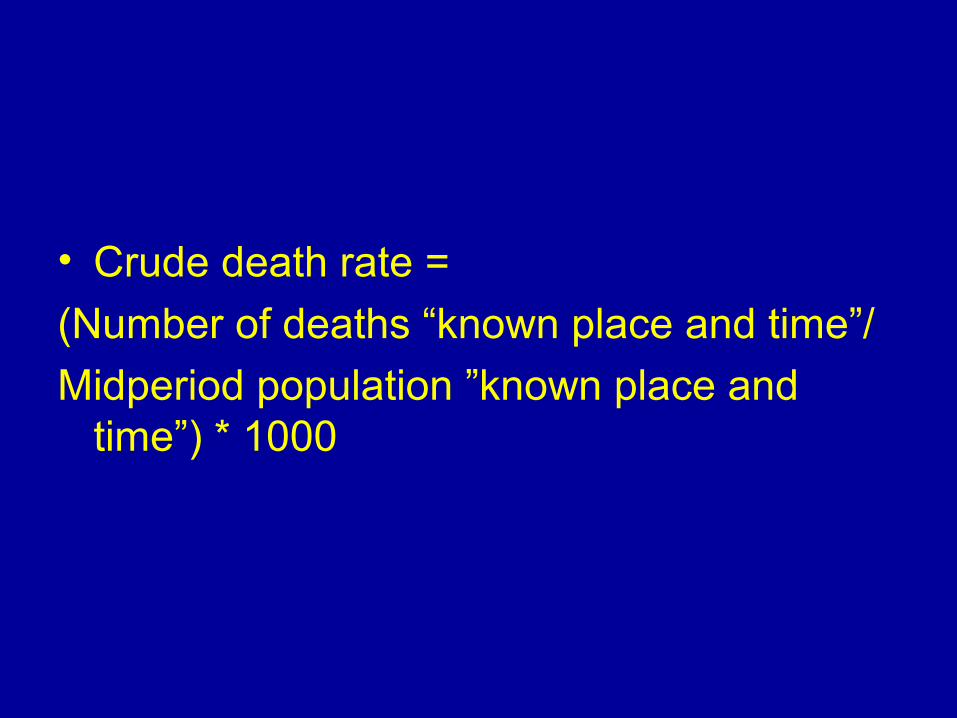
• Crude death rate =
(Number of deaths “known place and time”/
Midperiod population ”known place and time”( * 1000
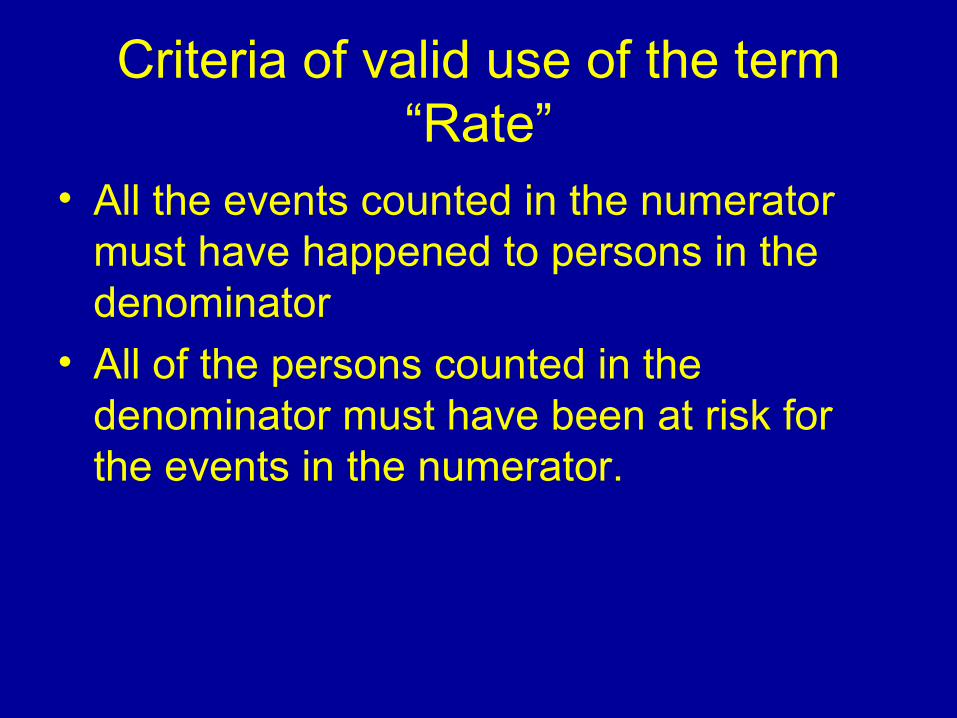
Criteria of valid use of the term “Rate”
• All the events counted in the numerator must have happened to persons in the denominator
• All of the persons counted in the denominator must have been at risk for the events in the numerator.
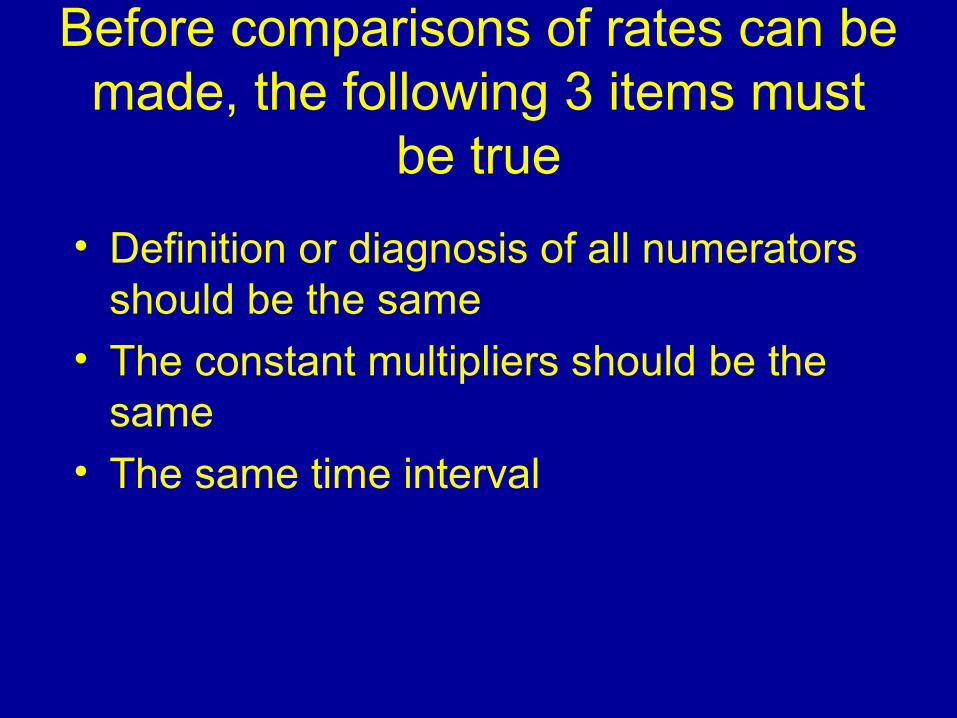
Before comparisons of rates can be made, the following 3 items must
be true
• Definition or diagnosis of all numerators should be the same
• The constant multipliers should be the same
• The same time interval
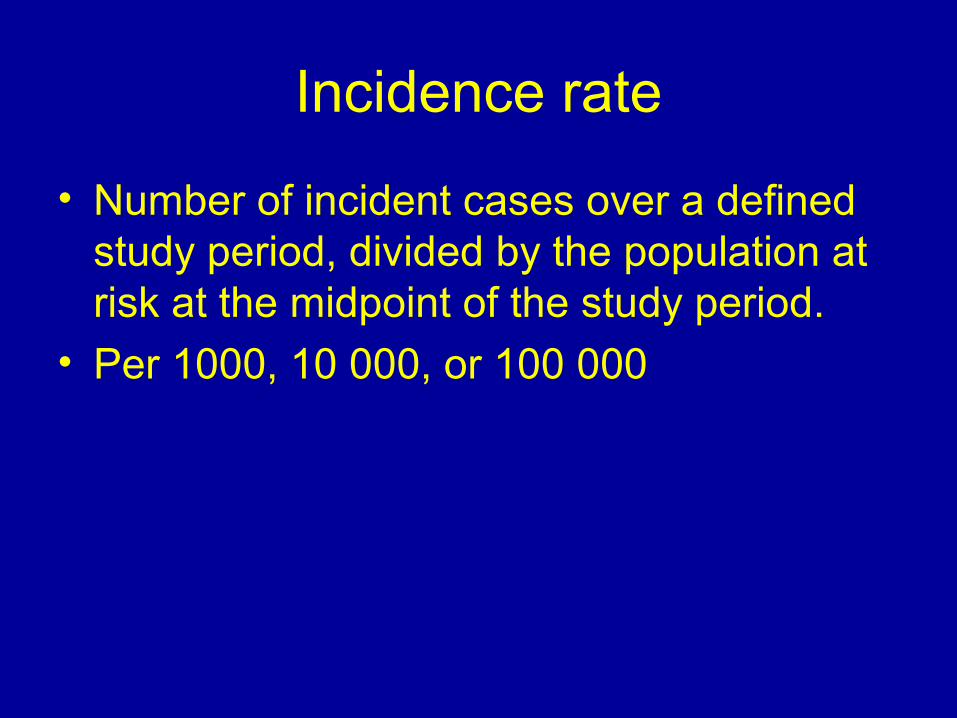
Incidence rate
• Number of incident cases over a defined study period, divided by the population at risk at the midpoint of the study period.
• Per 1000, 10 000, or 100 000
Prevalence rate
• Actually a proportion and not a rate, however the term is common in use and is:– The proportion of persons with a defined
disease or condition at the time of study
Incidence density
• Frequency (density( of new events per person-time and is especially useful when the event of interest can occur in a person more than once during the study period
Use of crude rates vs. specific rates
• Categories of rates– Crude rates– Specific rates– Standardized rates
Use of crude rates vs. specific rates
• Categories of rates– Those that apply to an entire population,
without reference to any characteristics of the individuals in it (crude rates(.
Use of crude rates vs. specific rates
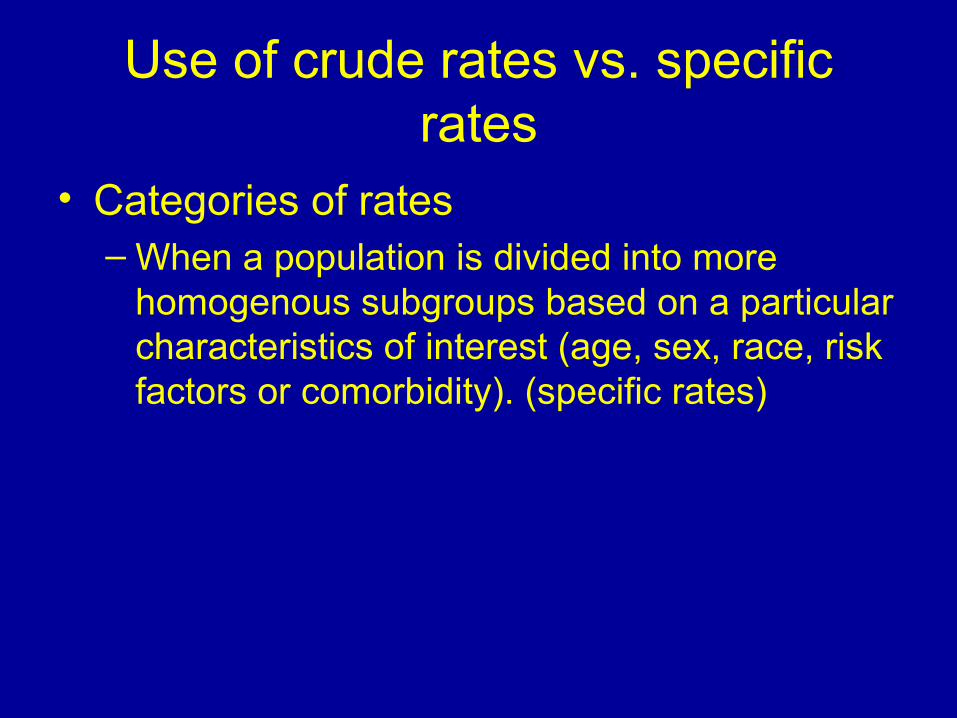
• Categories of rates– When a population is divided into more
homogenous subgroups based on a particular characteristics of interest (age, sex, race, risk factors or comorbidity). (specific rates)
Use of crude rates vs. specific rates
• Categories of rates
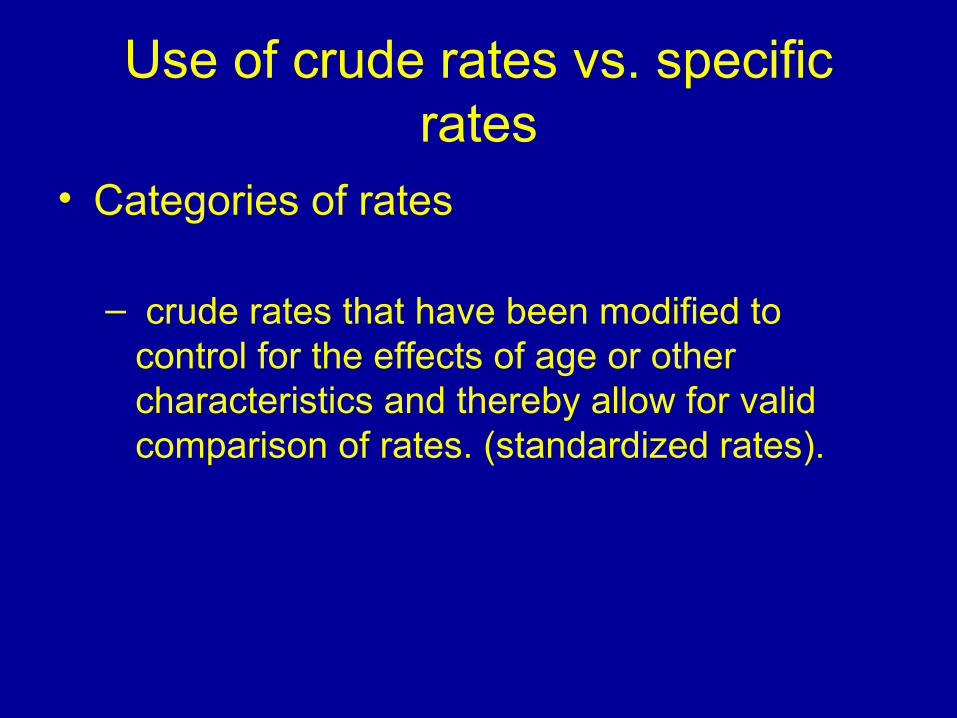
– crude rates that have been modified to control for the effects of age or other characteristics and thereby allow for valid comparison of rates. (standardized rates).
Use of crude rates vs. specific rates
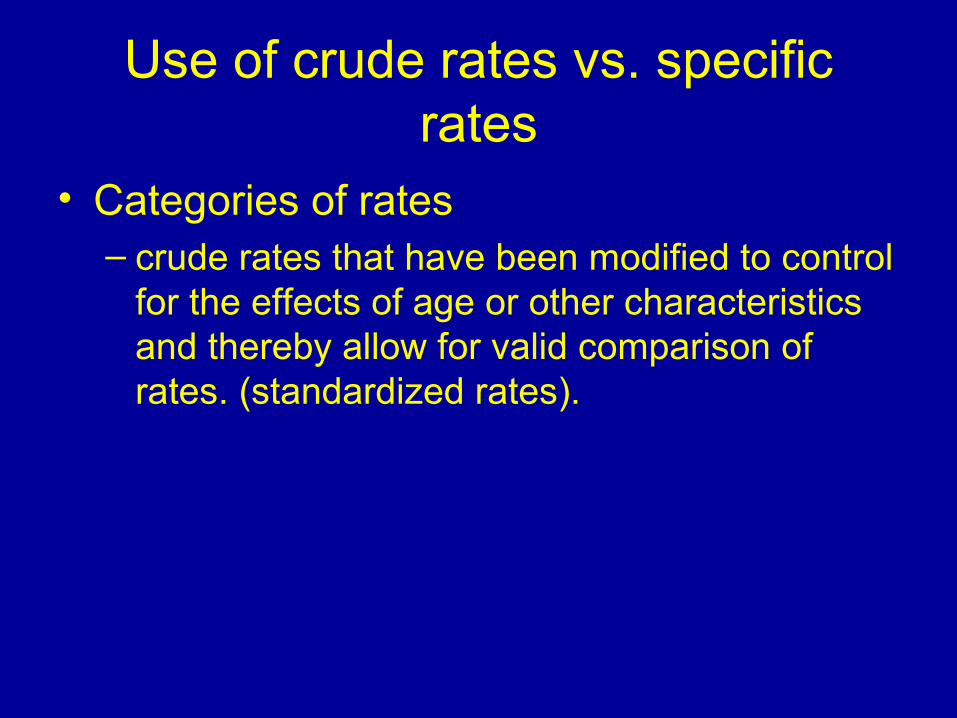
• Categories of rates– crude rates that have been modified to control
for the effects of age or other characteristics and thereby allow for valid comparison of rates. (standardized rates).
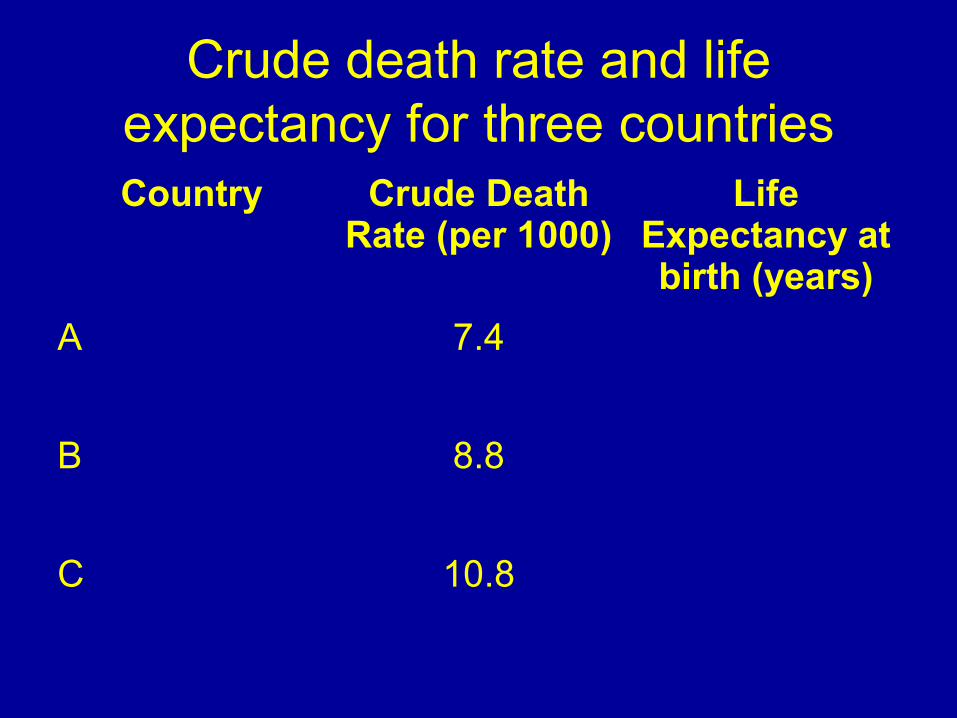
Crude death rate and life expectancy for three countriesCountry Crude Death
Rate (per 1000)Life
Expectancy at birth (years)
A 7.4
B 8.8
C 10.8
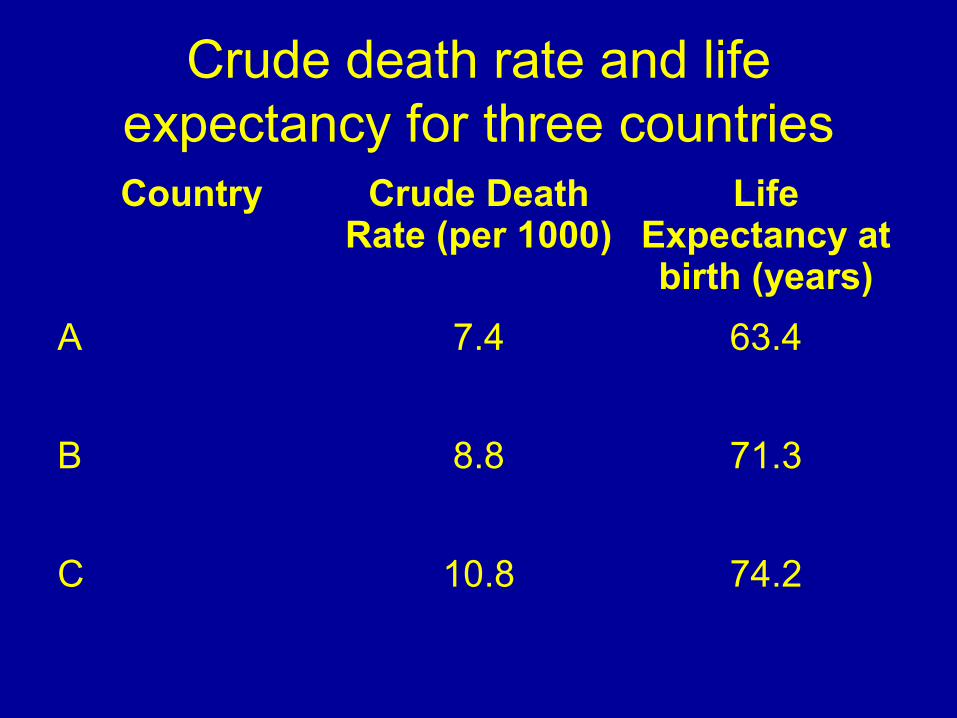
Crude death rate and life expectancy for three countriesCountry Crude Death
Rate (per 1000)Life
Expectancy at birth (years)
A 7.4 63.4
B 8.8 71.3
C 10.8 74.2
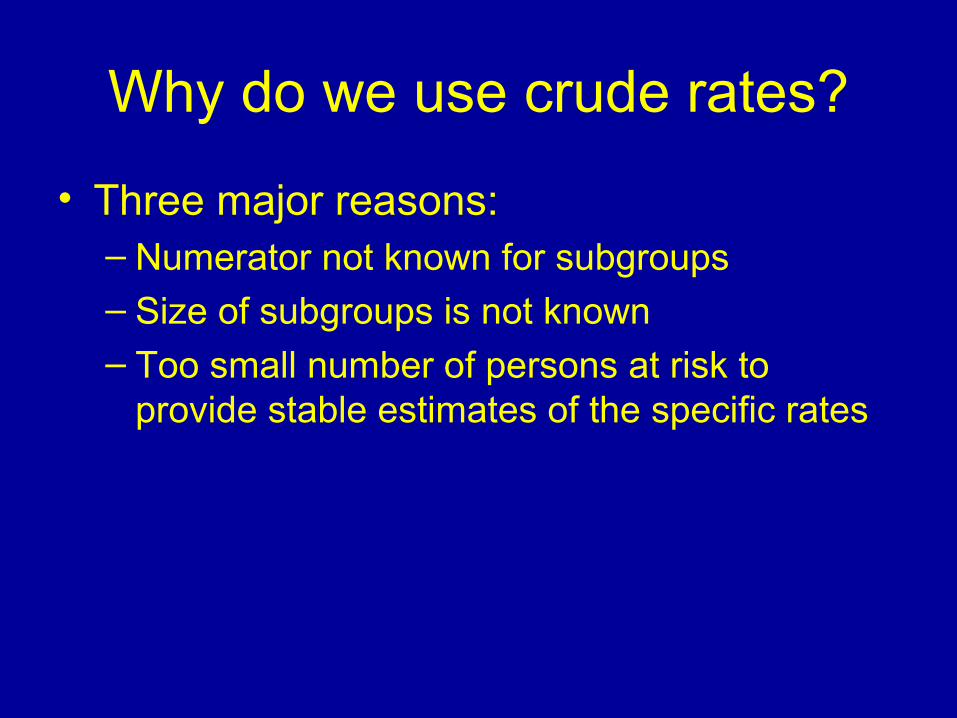
Why do we use crude rates?
• Three major reasons:– Numerator not known for subgroups– Size of subgroups is not known– Too small number of persons at risk to
provide stable estimates of the specific rates
Standardization
• Direct
• Indirect
Direct standardization
• Most commonly used method to remove the biasing effect of the differing age structure of different populations.
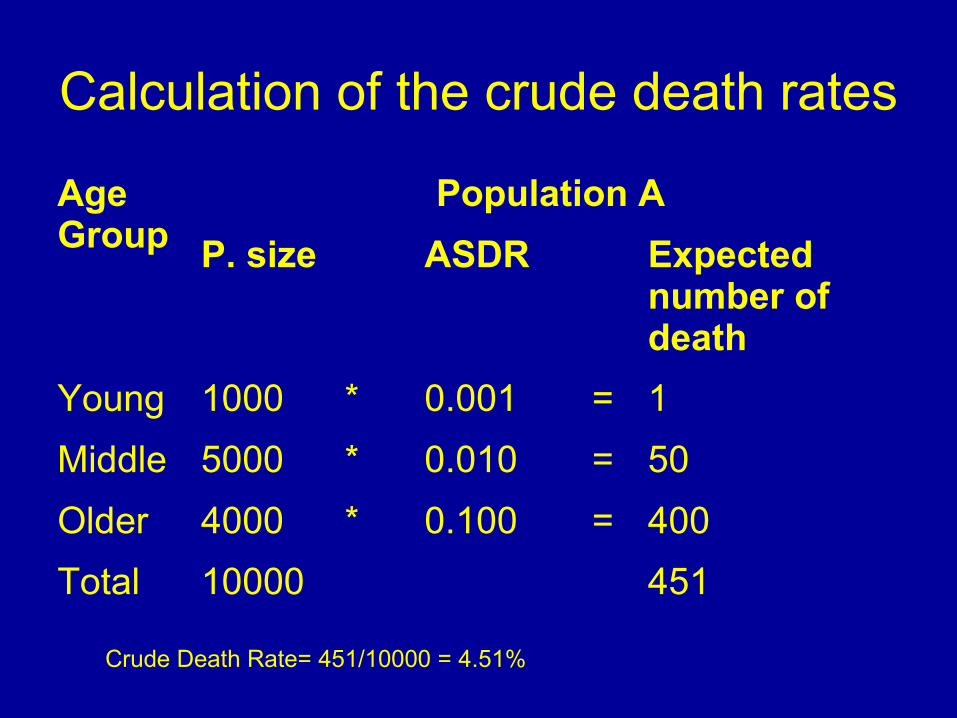
Calculation of the crude death rates
Age Group
Population A
P. size ASDR Expected number of death
Young 1000 * 0.001 = 1
Middle 5000 * 0.010 = 50
Older 4000 * 0.100 = 400
Total 10000 451
Crude Death Rate= 451/10000 = 4.51%
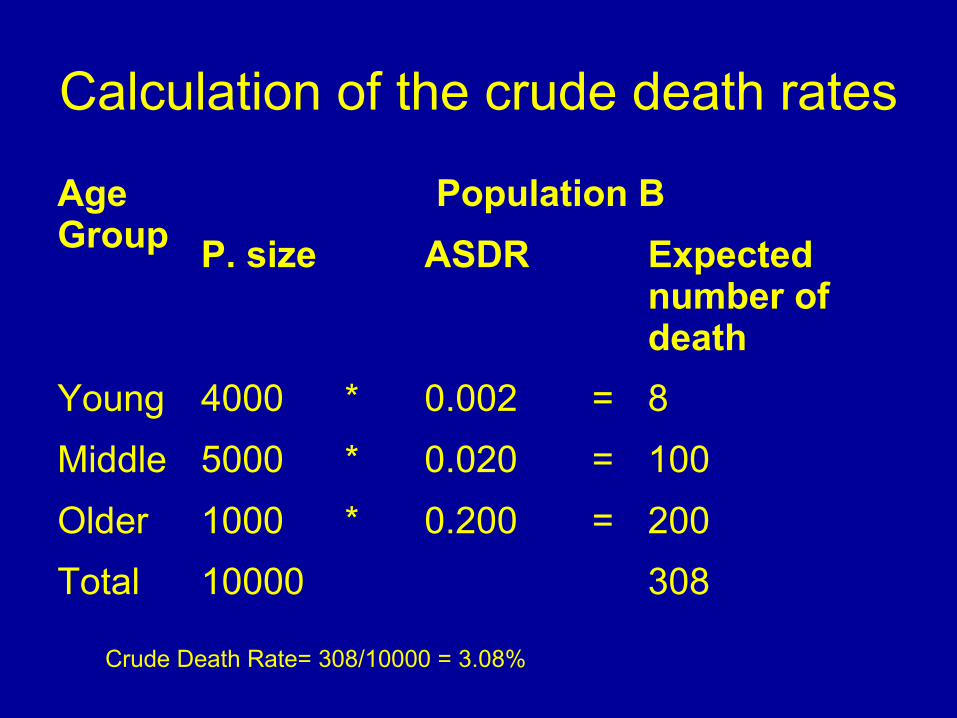
Calculation of the crude death rates
Age Group
Population B
P. size ASDR Expected number of death
Young 4000 * 0.002 = 8
Middle 5000 * 0.020 = 100
Older 1000 * 0.200 = 200
Total 10000 308
Crude Death Rate= 308/10000 = 3.08%
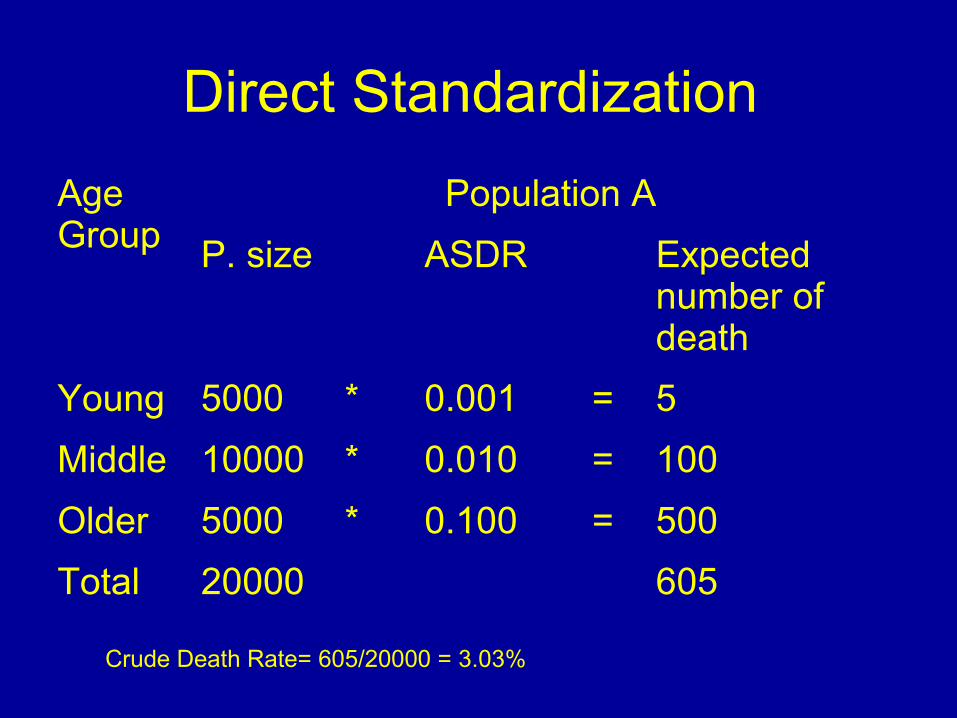
Direct Standardization
Age Group
Population A
P. size ASDR Expected number of death
Young 5000 * 0.001 = 5
Middle 10000 * 0.010 = 100
Older 5000 * 0.100 = 500
Total 20000 605
Crude Death Rate= 605/20000 = 3.03%
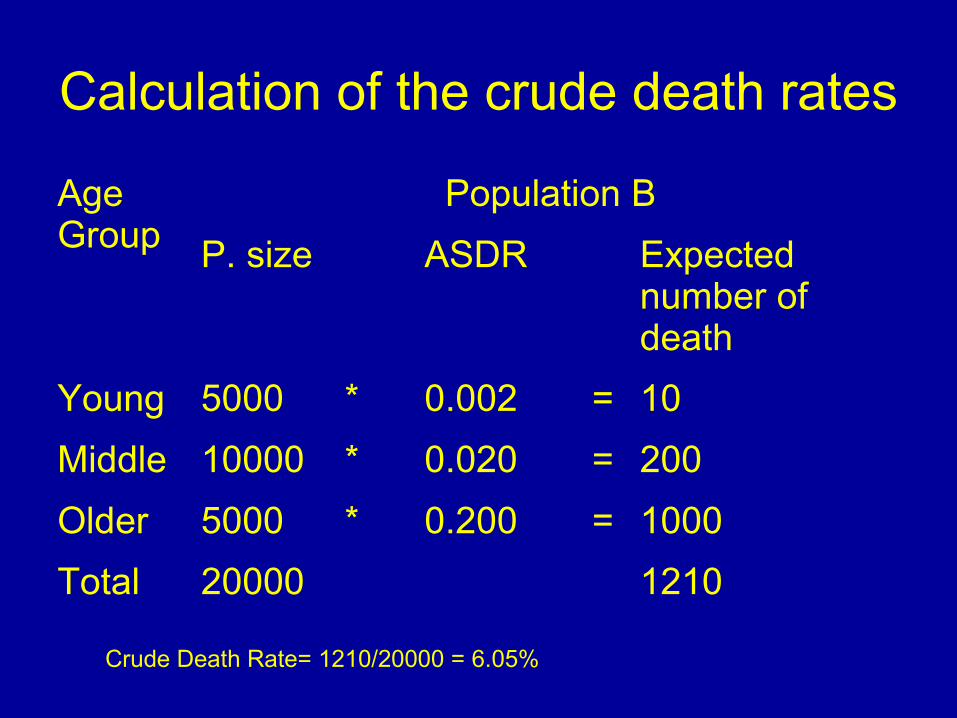
Calculation of the crude death rates
Age Group
Population B
P. size ASDR Expected number of death
Young 5000 * 0.002 = 10
Middle 10000 * 0.020 = 200
Older 5000 * 0.200 = 1000
Total 20000 1210
Crude Death Rate= 1210/20000 = 6.05%

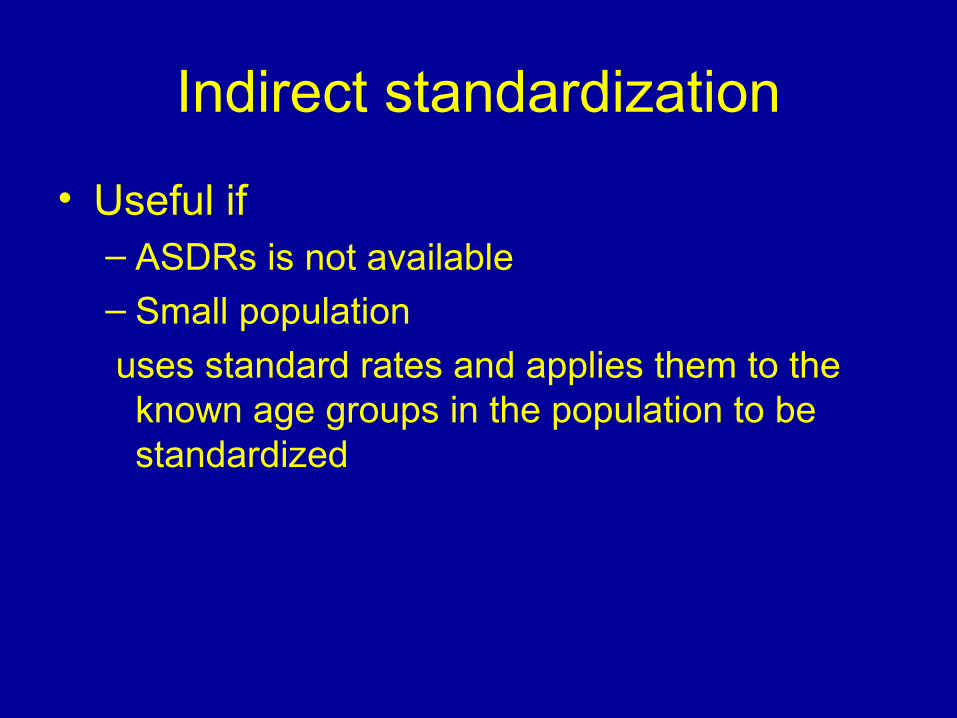
Indirect standardization
• Useful if – ASDRs is not available– Small population
uses standard rates and applies them to the known age groups in the population to be standardized

Indirect standardization
Age Group
Males in the standard population
Prop of stand Pop.
ASDR Observed death rate
Young 0.4 * 0.0001 = 0.00004
Middle 0.3 * 0.0010 = 0.00030
Older 0.3 * 0.0100 = 0.00300
Total 1 0.00334
observed Death Rate= 0.00334, or 334/10000
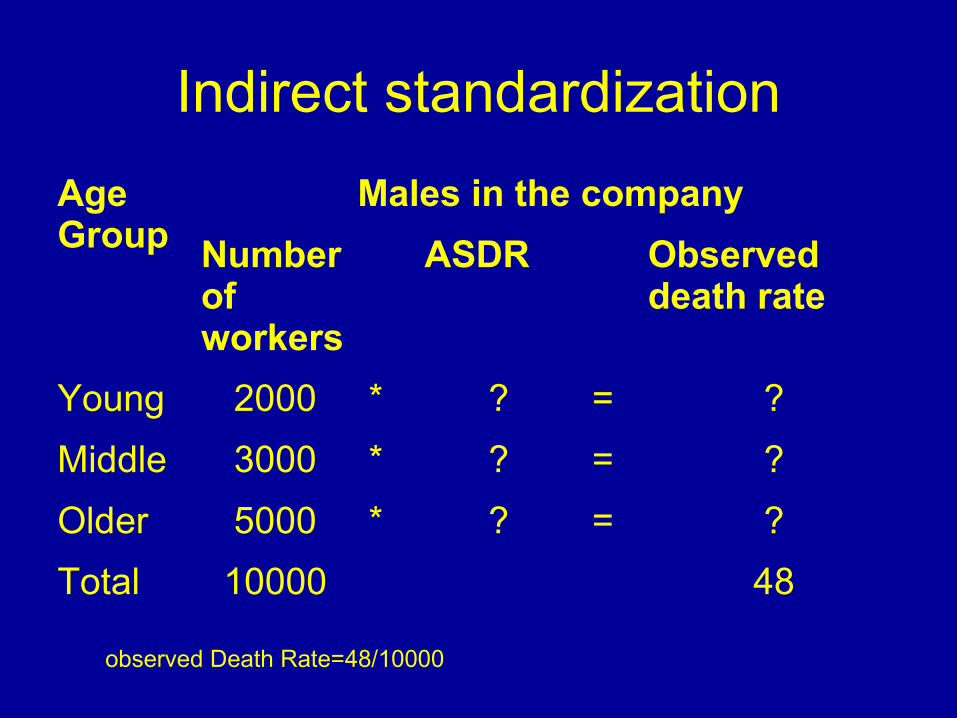
Indirect standardization
Age Group
Males in the company
Number of workers
ASDR Observed death rate
Young 2000 * ? = ?
Middle 3000 * ? = ?
Older 5000 * ? = ?
Total 10000 48
observed Death Rate=48/10000
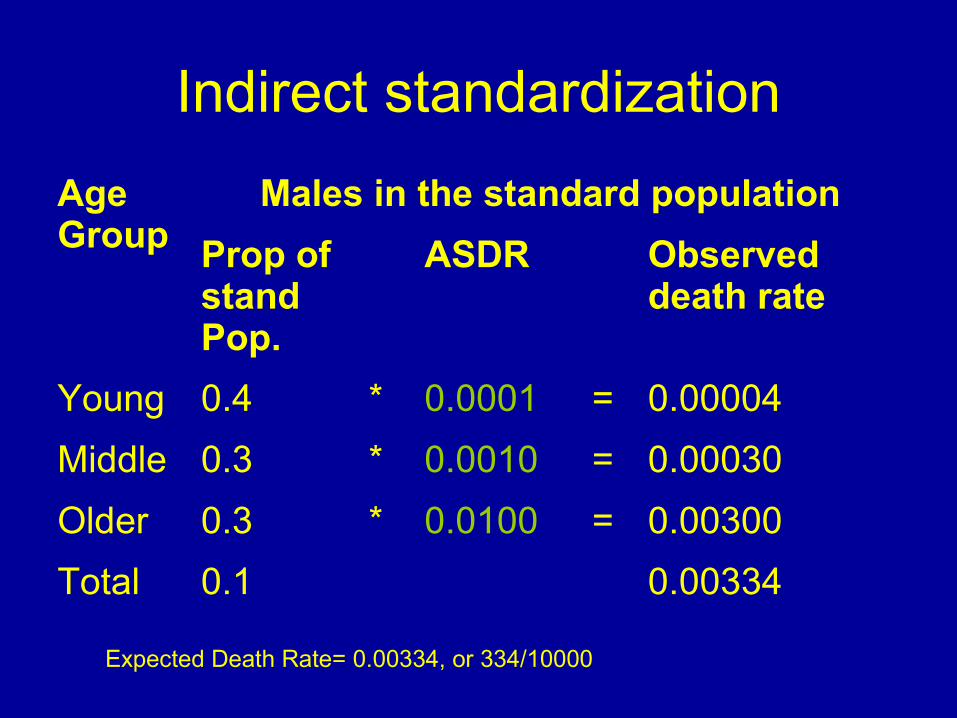
Indirect standardization
Age Group
Males in the standard population
Prop of stand Pop.
ASDR Observed death rate
Young 0.4 * 0.0001 = 0.00004
Middle 0.3 * 0.0010 = 0.00030
Older 0.3 * 0.0100 = 0.00300
Total 0.1 0.00334
Expected Death Rate= 0.00334, or 334/10000
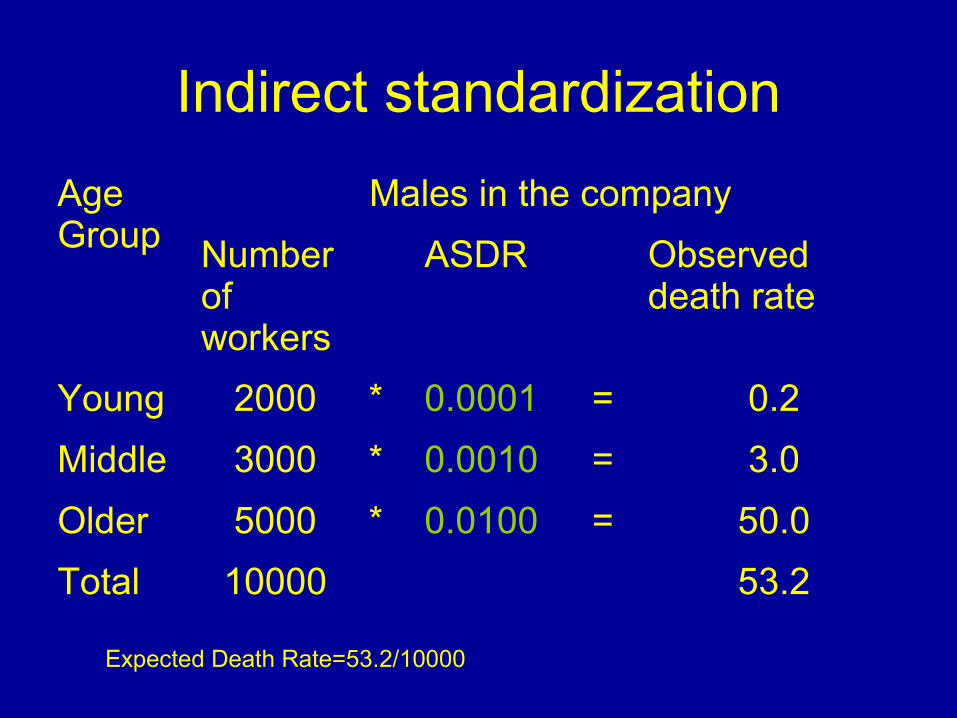
Indirect standardization
Age Group
Males in the company
Number of workers
ASDR Observed death rate
Young 2000 * 0.0001 = 0.2
Middle 3000 * 0.0010 = 3.0
Older 5000 * 0.0100 = 50.0
Total 10000 53.2
Expected Death Rate=53.2/10000
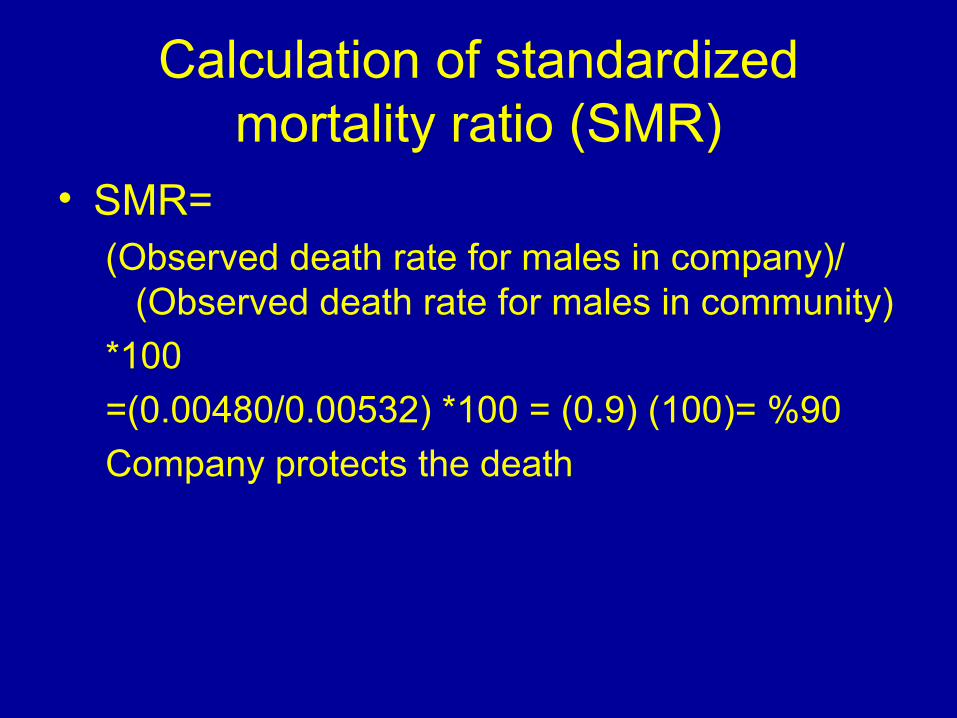
Calculation of standardized mortality ratio (SMR)
• SMR=(Observed death rate for males in company)/
(Observed death rate for males in community)
*100
=(0.00480/0.00532) *100 = (0.9) (100)= %90
Company protects the death
SMR
• If SMR:
• >1
• <1
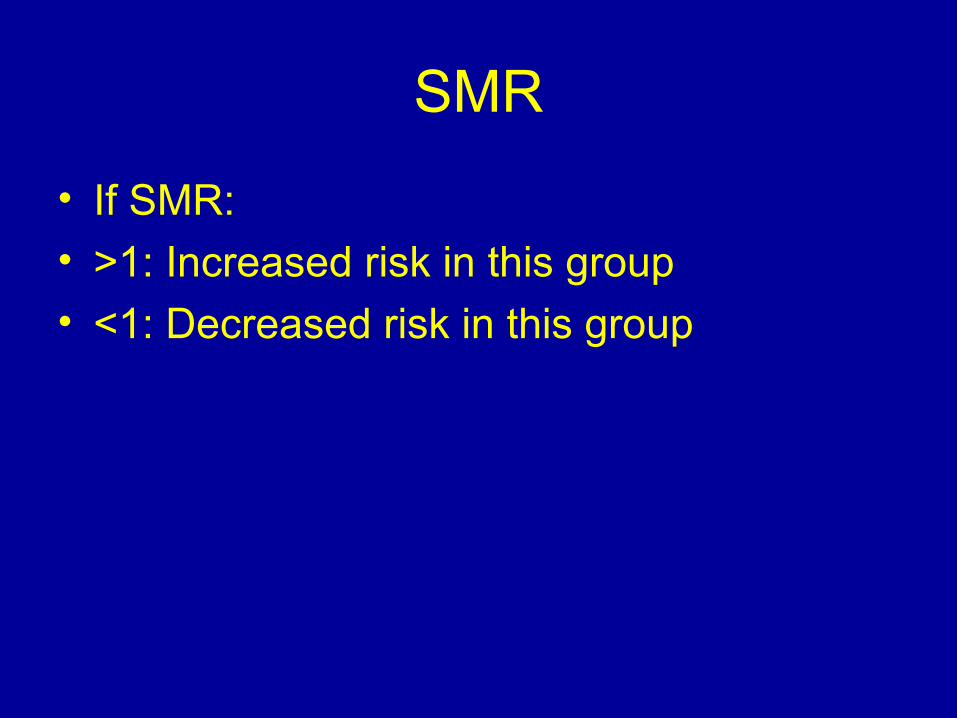
SMR
• If SMR:
• >1: Increased risk in this group
• <1: Decreased risk in this group
Epidemiologic Methods
• Primary concern is to study disease occurrence in people, these studies can be classified as:– Observational– Experimental
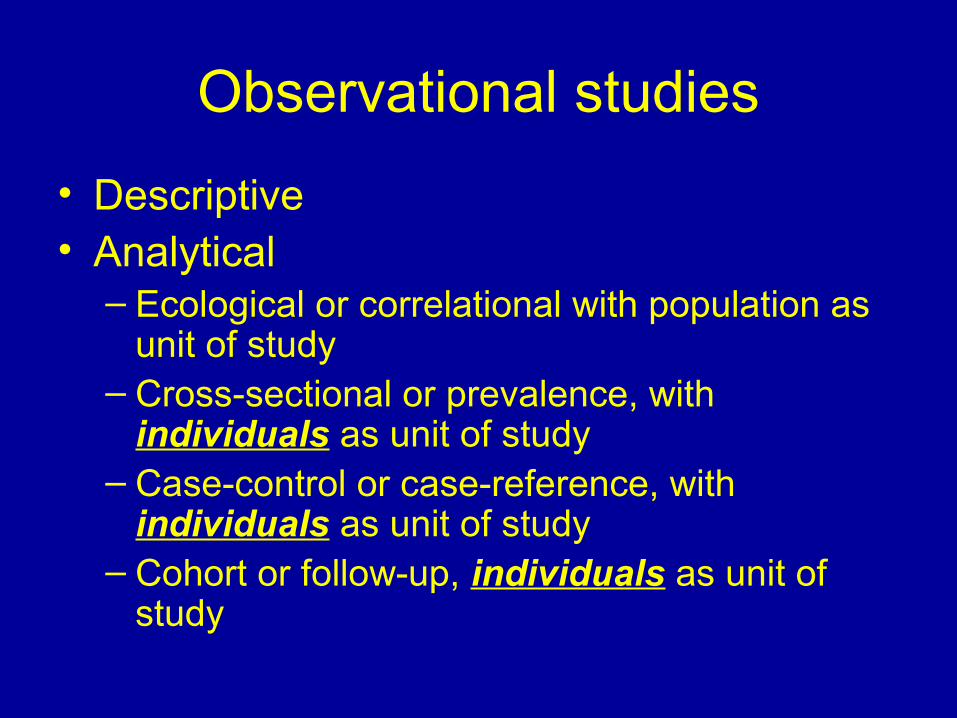
Observational studies
• Descriptive • Analytical
– Ecological or correlational with population as unit of study
– Cross-sectional or prevalence, with individuals as unit of study
– Case-control or case-reference, with individuals as unit of study
– Cohort or follow-up, individuals as unit of study
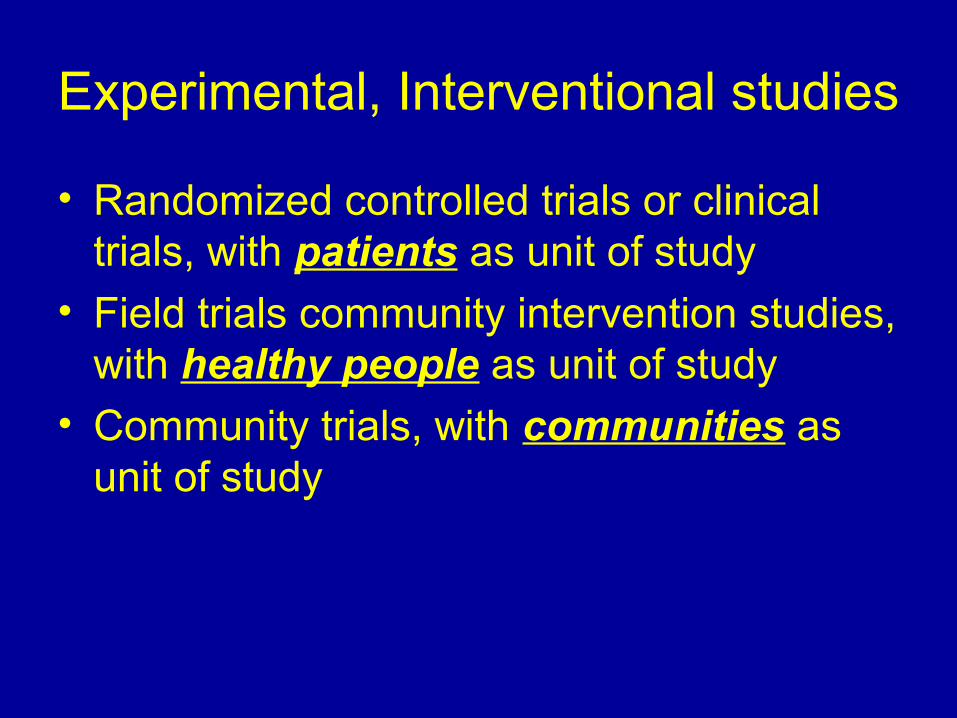
Experimental, Interventional studies
• Randomized controlled trials or clinical trials, with patients as unit of study
• Field trials community intervention studies, with healthy people as unit of study
• Community trials, with communities as unit of study
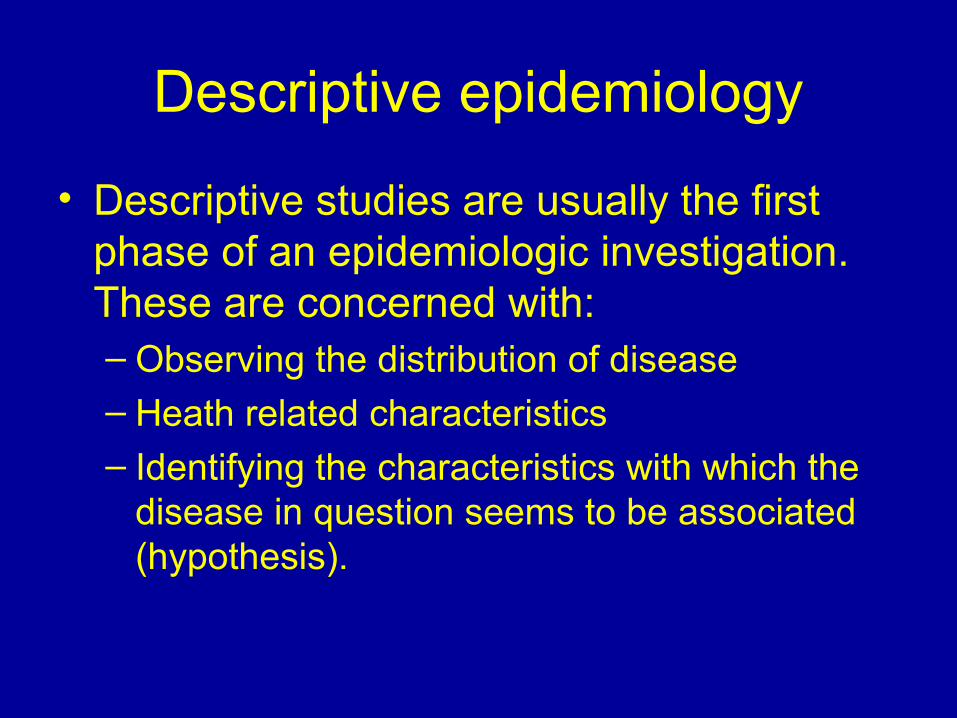
Descriptive epidemiology
• Descriptive studies are usually the first phase of an epidemiologic investigation. These are concerned with:– Observing the distribution of disease– Heath related characteristics– Identifying the characteristics with which the
disease in question seems to be associated (hypothesis).


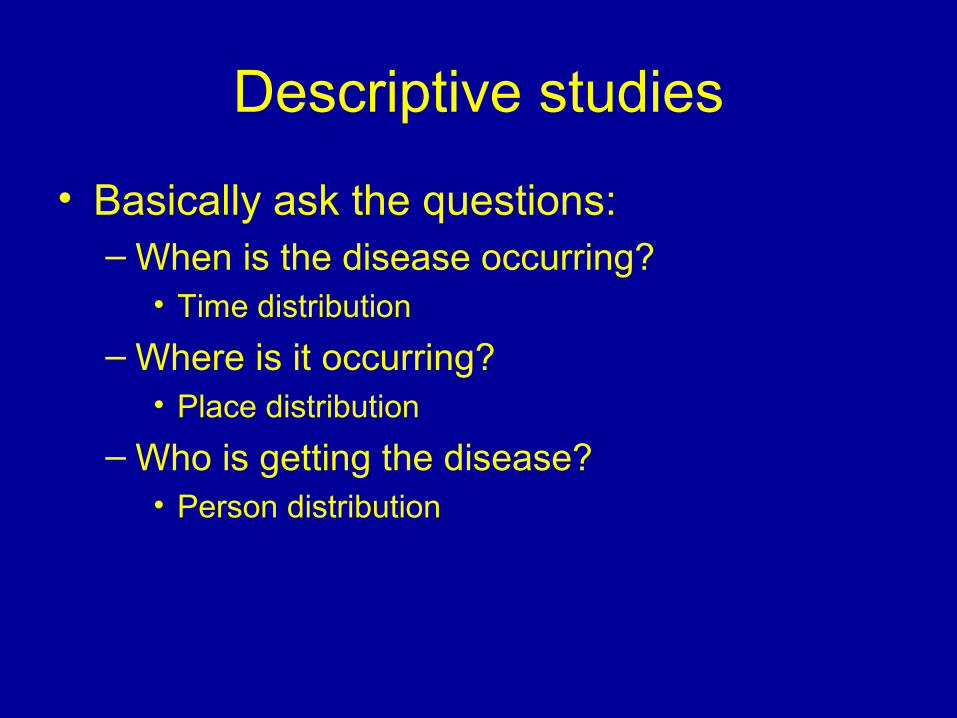
Descriptive studies
• Basically ask the questions:– When is the disease occurring?
• Time distribution
– Where is it occurring?• Place distribution
– Who is getting the disease?• Person distribution
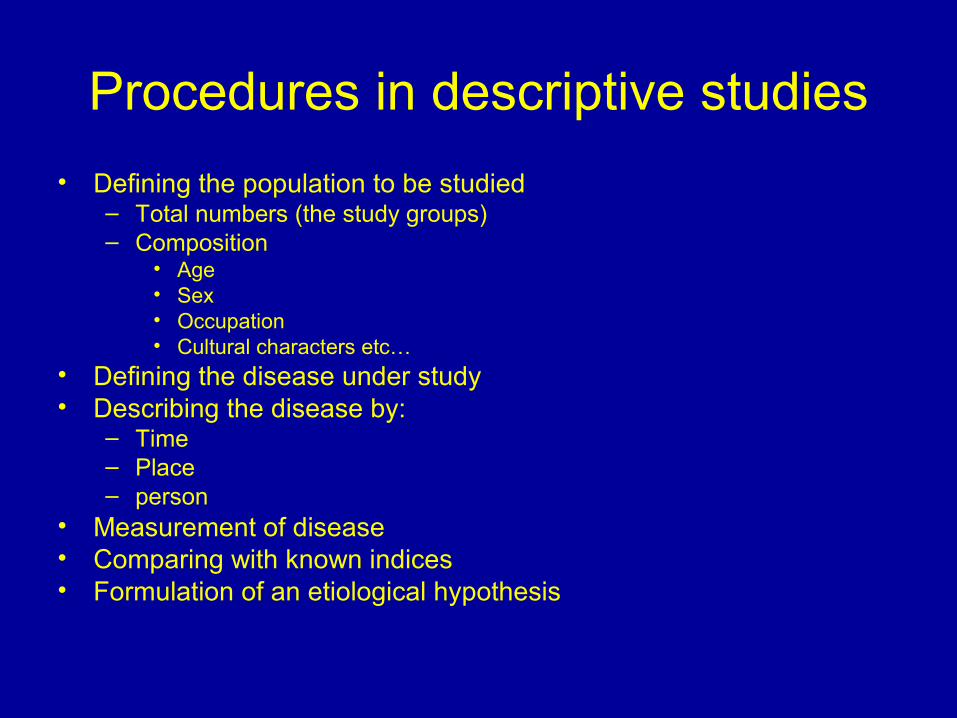
Procedures in descriptive studies
• Defining the population to be studied– Total numbers (the study groups)– Composition
• Age• Sex• Occupation• Cultural characters etc…
• Defining the disease under study• Describing the disease by:
– Time– Place– person
• Measurement of disease• Comparing with known indices• Formulation of an etiological hypothesis
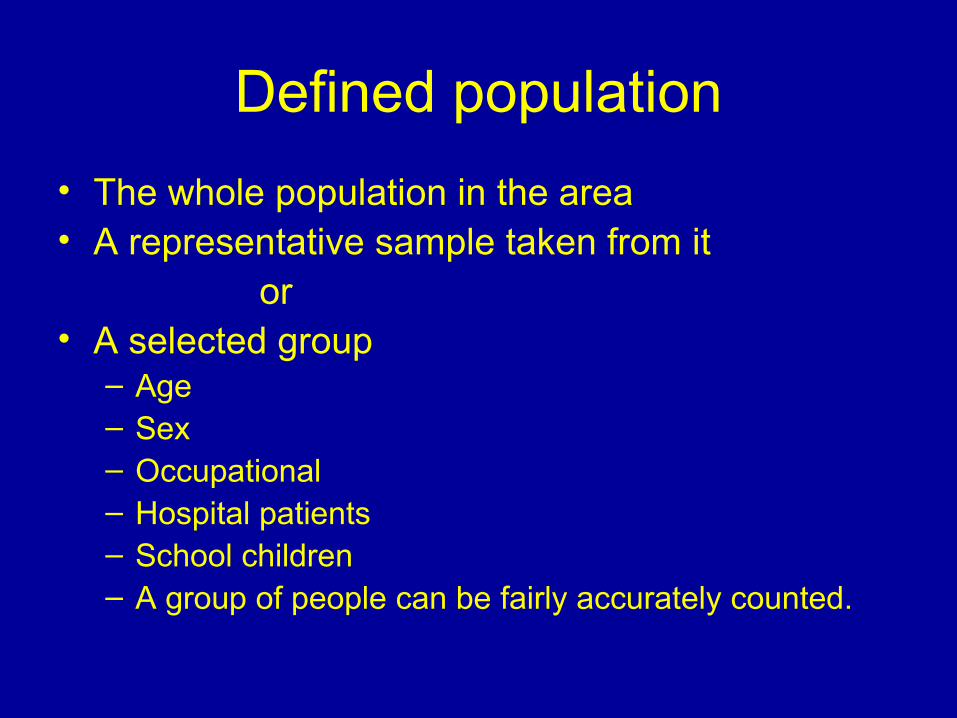
Defined population
• The whole population in the area• A representative sample taken from it or• A selected group
– Age– Sex– Occupational– Hospital patients– School children– A group of people can be fairly accurately counted.

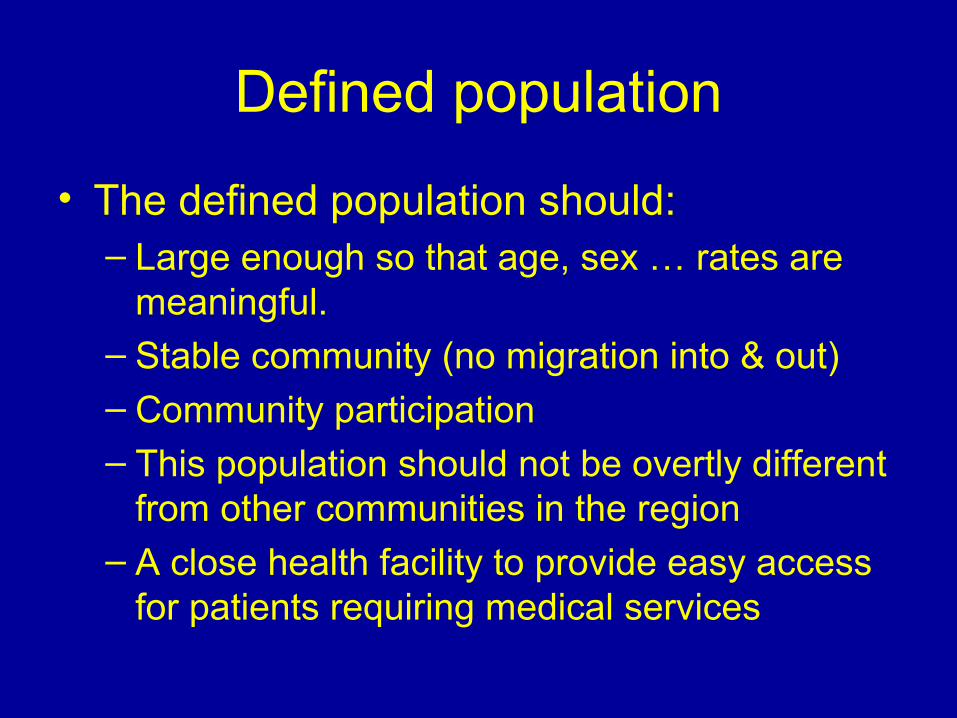
Defined population
• The defined population should:– Large enough so that age, sex … rates are
meaningful. – Stable community (no migration into & out)– Community participation– This population should not be overtly different
from other communities in the region– A close health facility to provide easy access
for patients requiring medical services
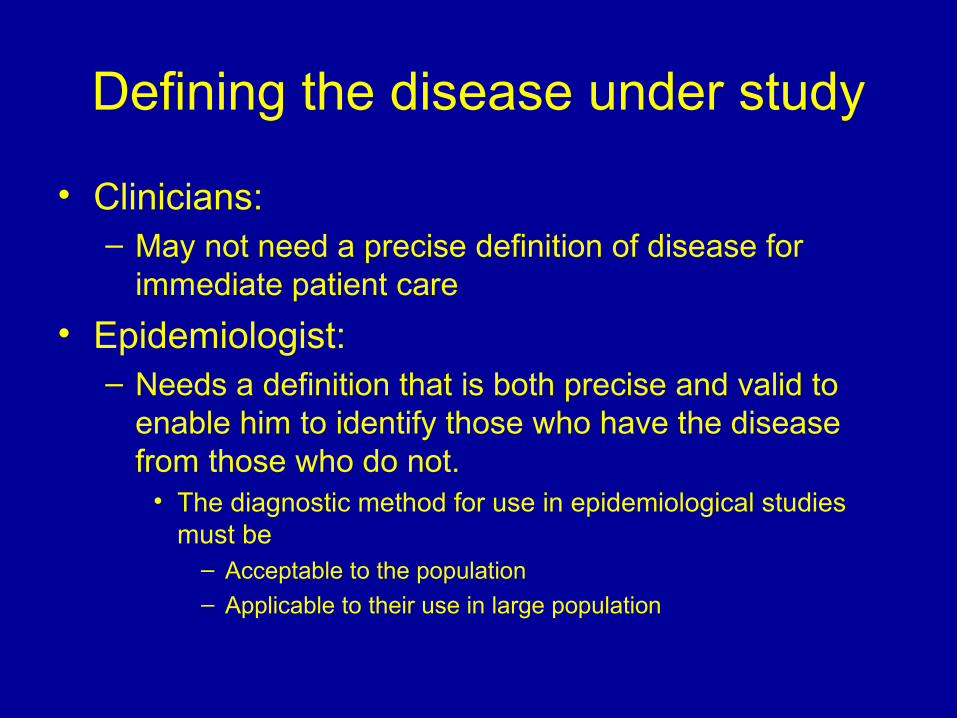
Defining the disease under study
• Clinicians: – May not need a precise definition of disease for
immediate patient care
• Epidemiologist:– Needs a definition that is both precise and valid to
enable him to identify those who have the disease from those who do not.
• The diagnostic method for use in epidemiological studies must be
– Acceptable to the population– Applicable to their use in large population
Describing the disease
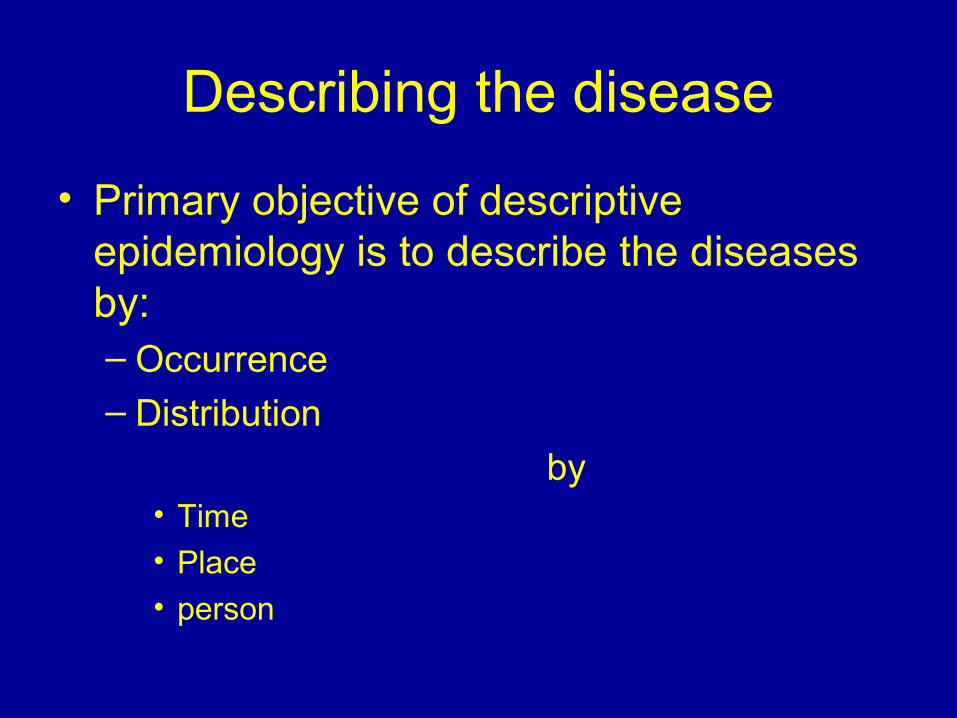
• Primary objective of descriptive epidemiology is to describe the diseases by:– Occurrence– Distribution
by• Time
• Place
• person
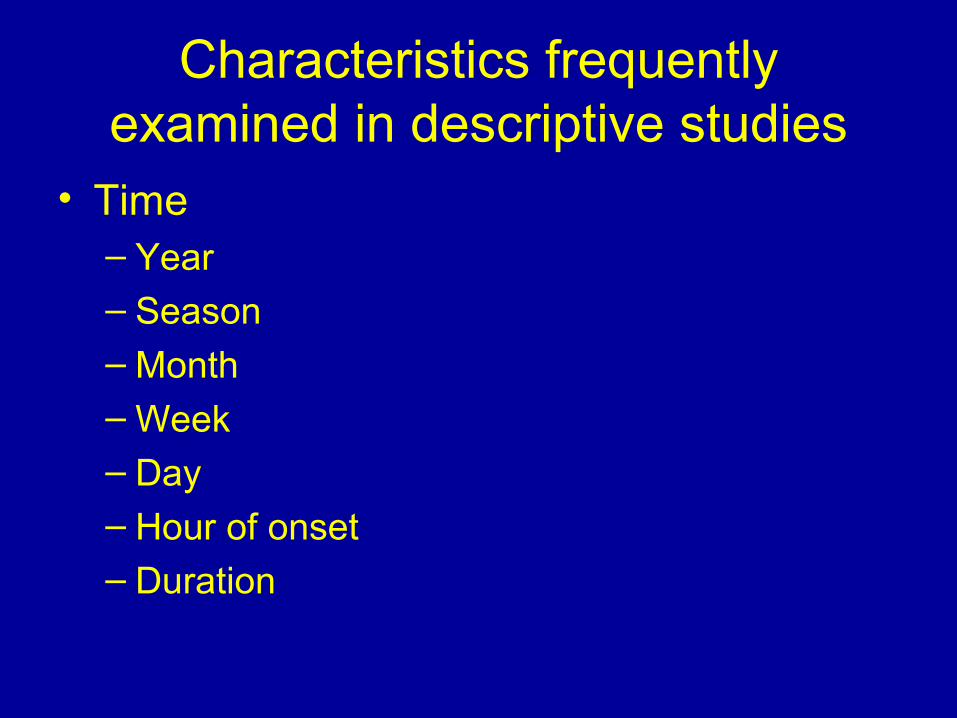
Characteristics frequently examined in descriptive studies
• Time– Year– Season– Month– Week– Day– Hour of onset– Duration
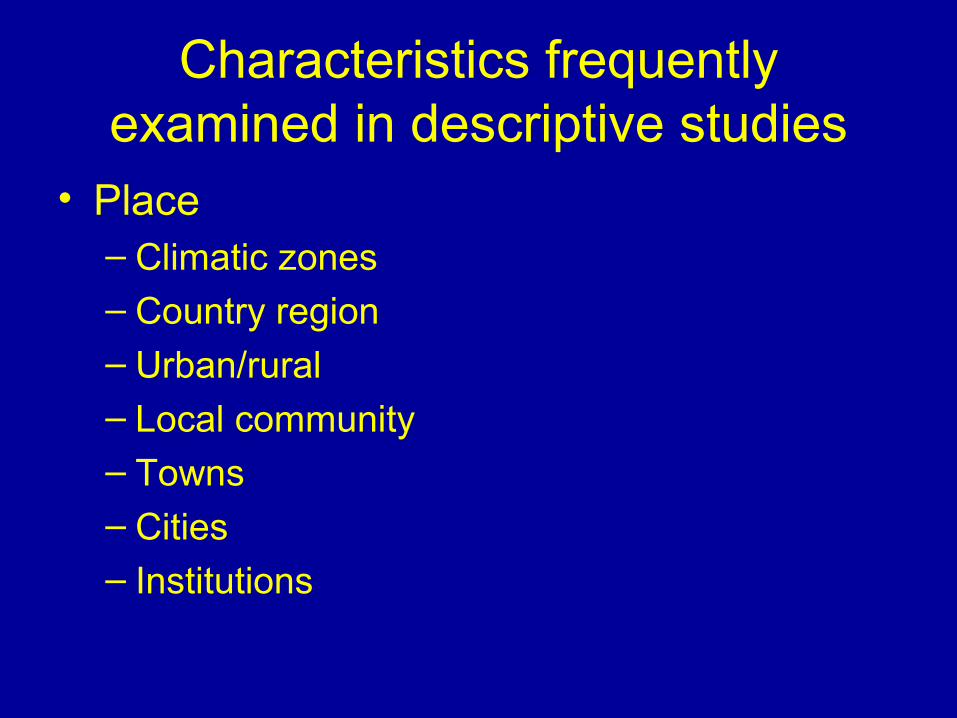
Characteristics frequently examined in descriptive studies
• Place– Climatic zones– Country region– Urban/rural– Local community– Towns– Cities– Institutions
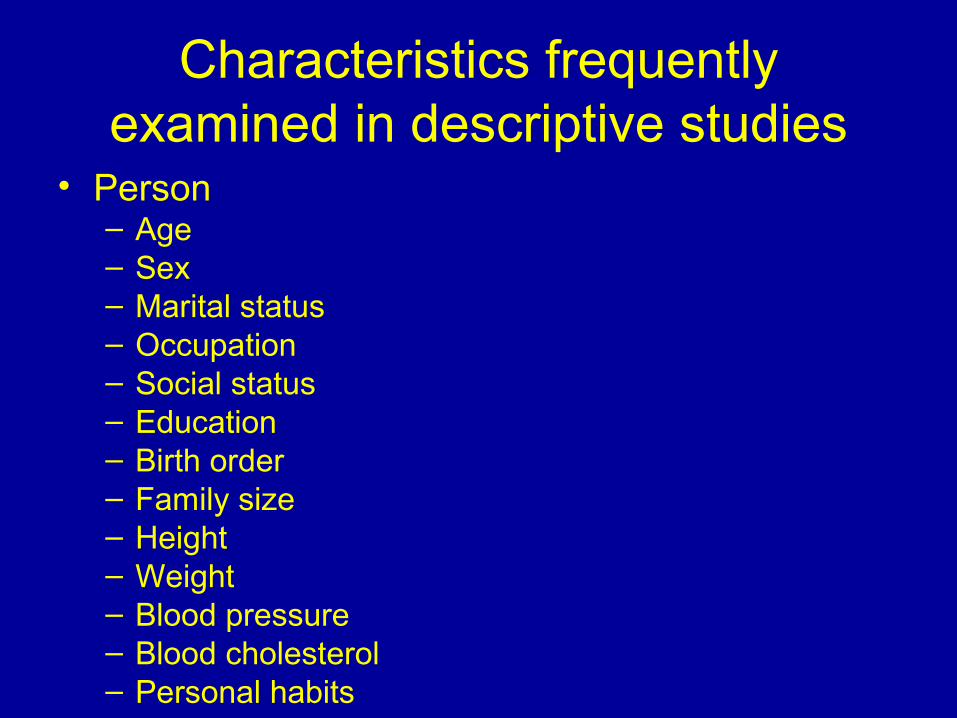
Characteristics frequently examined in descriptive studies
• Person– Age– Sex– Marital status– Occupation– Social status– Education– Birth order– Family size– Height– Weight– Blood pressure– Blood cholesterol– Personal habits
Time distribution
• Pattern may be described by the time of occurrence– Week– Month– Year– The day of week– Hour of onset
Time distribution
• Time distribution shows raises questions:– Seasonal occurrence– Periodic increase or decrease– Following a consistent time trend
All of the above mentioned issues may yield important clues about the source and etiology of the disease, suggesting potential preventive measures.
Kinds of epidemiologic time trends
• Short-term fluctuations
• Periodic fluctuations
• Long term or secular trends

Short-term fluctuations
• Epidemic
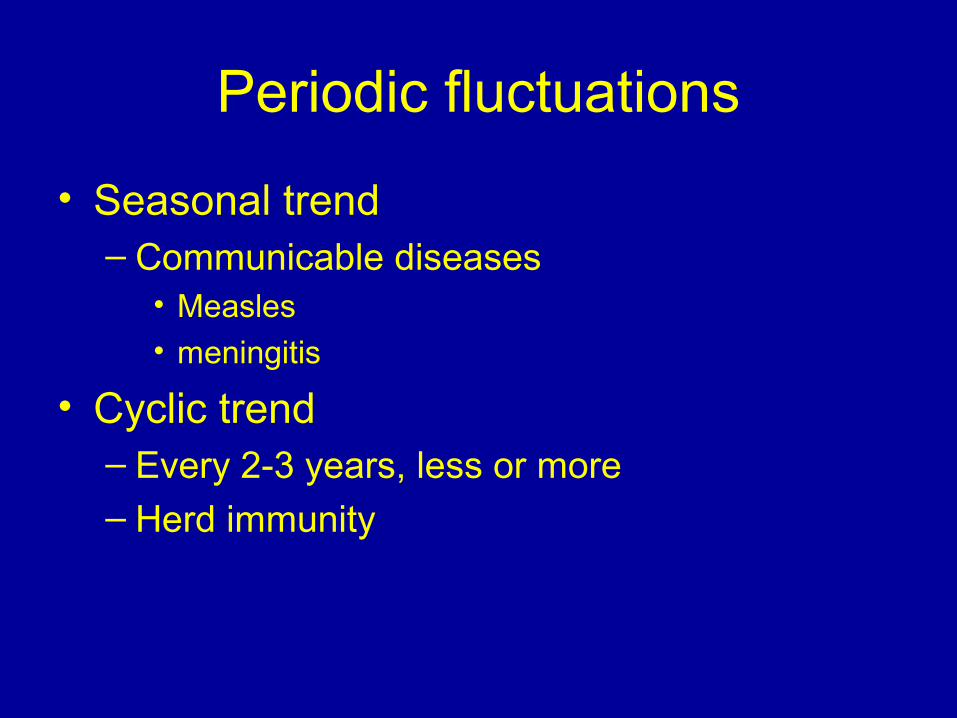
Periodic fluctuations
• Seasonal trend – Communicable diseases
• Measles
• meningitis
• Cyclic trend– Every 2-3 years, less or more– Herd immunity
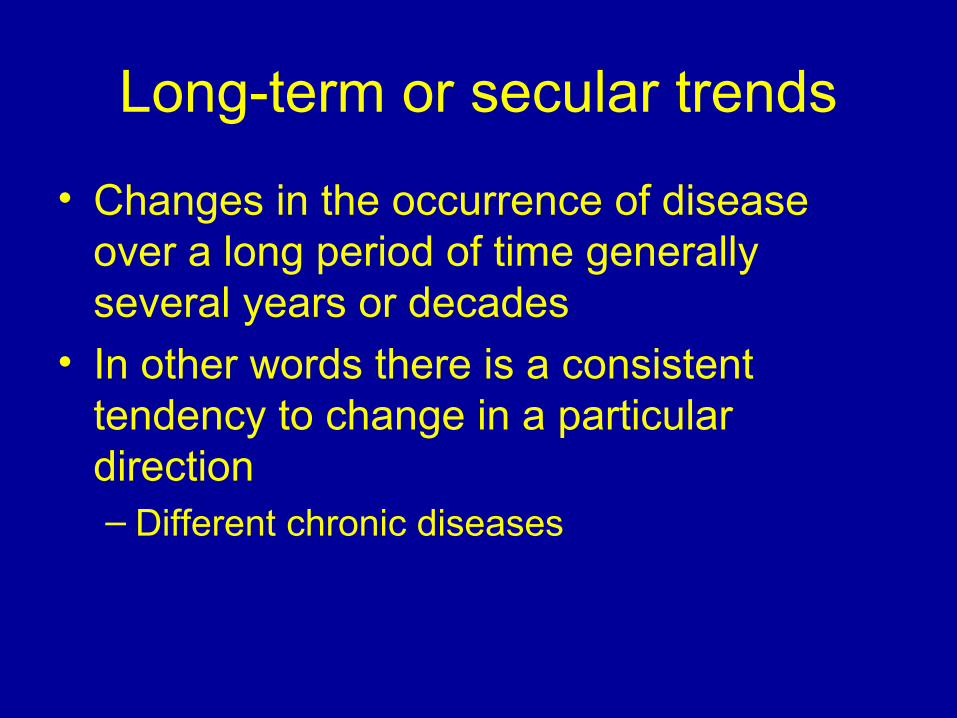
Long-term or secular trends
• Changes in the occurrence of disease over a long period of time generally several years or decades
• In other words there is a consistent tendency to change in a particular direction – Different chronic diseases
Place distribution
• International variations
• National variations
• Rural – Urban differences
• Local distributions
• Migration studies
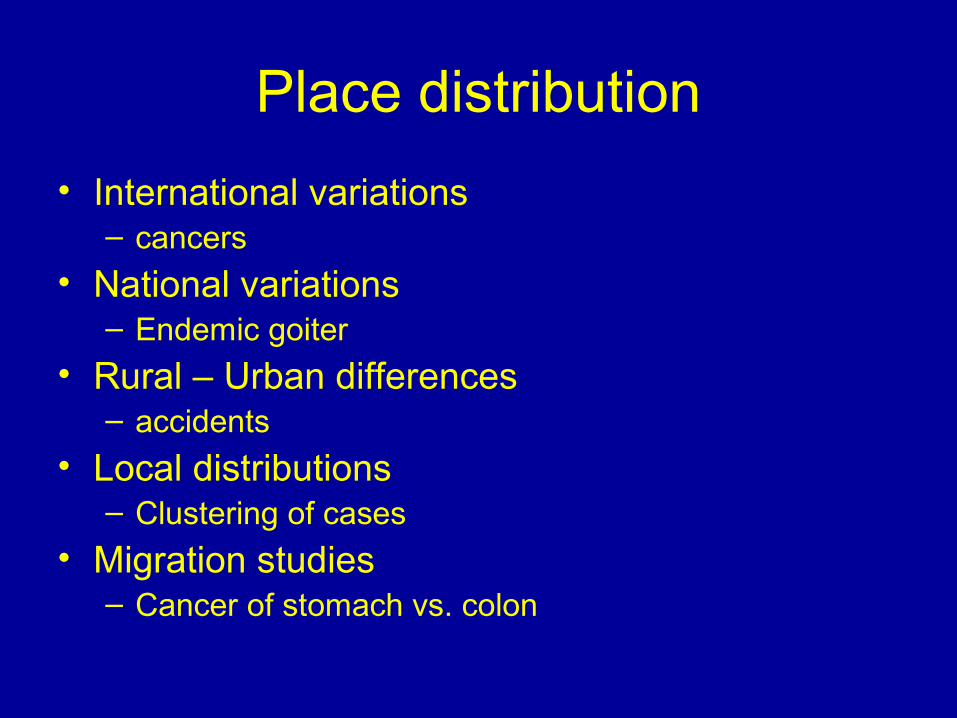
Place distribution
• International variations – cancers
• National variations– Endemic goiter
• Rural – Urban differences– accidents
• Local distributions– Clustering of cases
• Migration studies– Cancer of stomach vs. colon
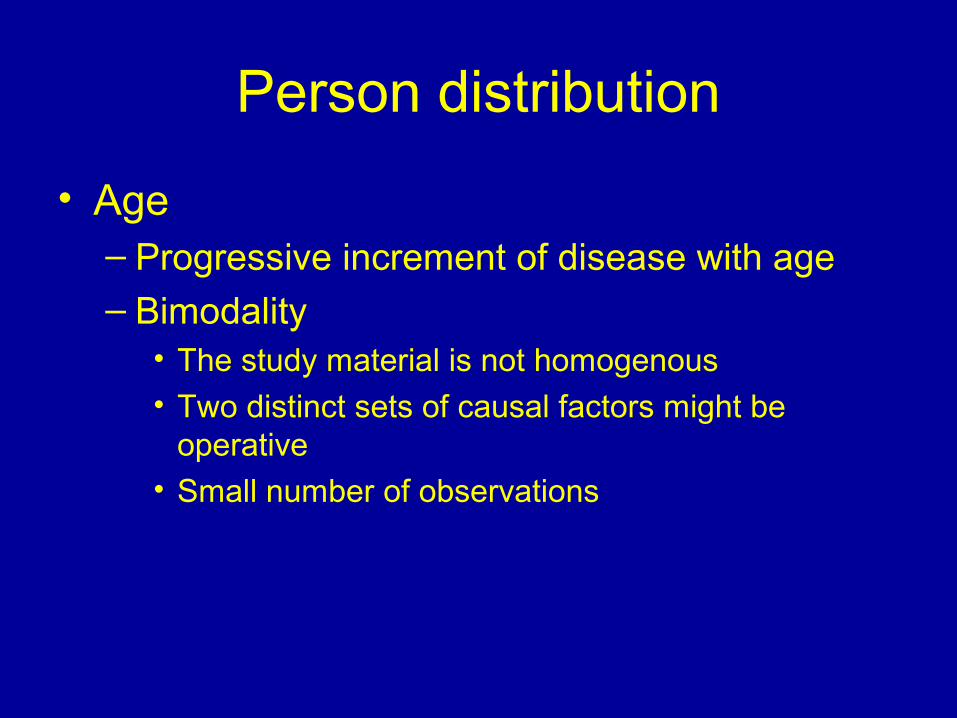
Person distribution
• Age– Progressive increment of disease with age– Bimodality
• The study material is not homogenous• Two distinct sets of causal factors might be
operative• Small number of observations
Person distribution
• Sex– Basic biological differences– Cultural and behavioral differences
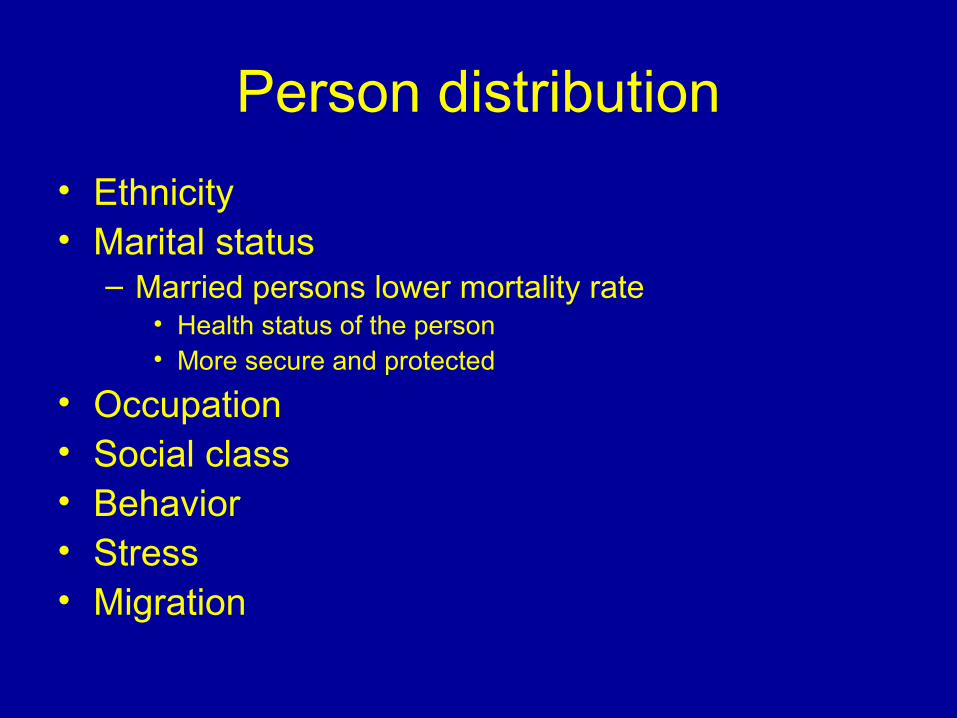
Person distribution
• Ethnicity• Marital status
– Married persons lower mortality rate• Health status of the person• More secure and protected
• Occupation• Social class• Behavior• Stress• Migration
Measurement of disease
• Cross sectional
• Longitudinal

Any comments?

Thank you for your kind
attention!