Basic Concepts: Drag - Sustainability Workshop - Drag Page 4 2 2 1 F C D A V The Drag Force is given...
19
© 2011 Autodesk Freely licensed for use by educational institutions. Reuse and changes require a note indicating that content has been modified from the original, and must attribute source content to Autodesk. www.autodesk.com/edcommunity Education Community Basic Concepts: Drag
Transcript of Basic Concepts: Drag - Sustainability Workshop - Drag Page 4 2 2 1 F C D A V The Drag Force is given...
© 2011 Autodesk Freely licensed for use by educational institutions. Reuse and changes require a note indicating that content has been modified from the original, and must attribute source content to Autodesk. www.autodesk.com/edcommunity
Education Community
Basic Concepts: Drag
© 2011 Autodesk Freely licensed for use by educational institutions. Reuse and changes require a note indicating that content has been modified from the original, and must attribute source content to Autodesk. www.autodesk.com/edcommunity
Education Community
Objectives Section I – Basic Concepts
Module - Drag
Page 2
Introduce the drag force that acts on a body moving through a fluid
Discuss the velocity and pressure distributions acting on the body
Introduce the drag equation
Show how the drag coefficient can be determined from a CFD program
© 2011 Autodesk Freely licensed for use by educational institutions. Reuse and changes require a note indicating that content has been modified from the original, and must attribute source content to Autodesk. www.autodesk.com/edcommunity
Education Community
Drag Section I – Basic Concepts
Module - Drag
Page 3
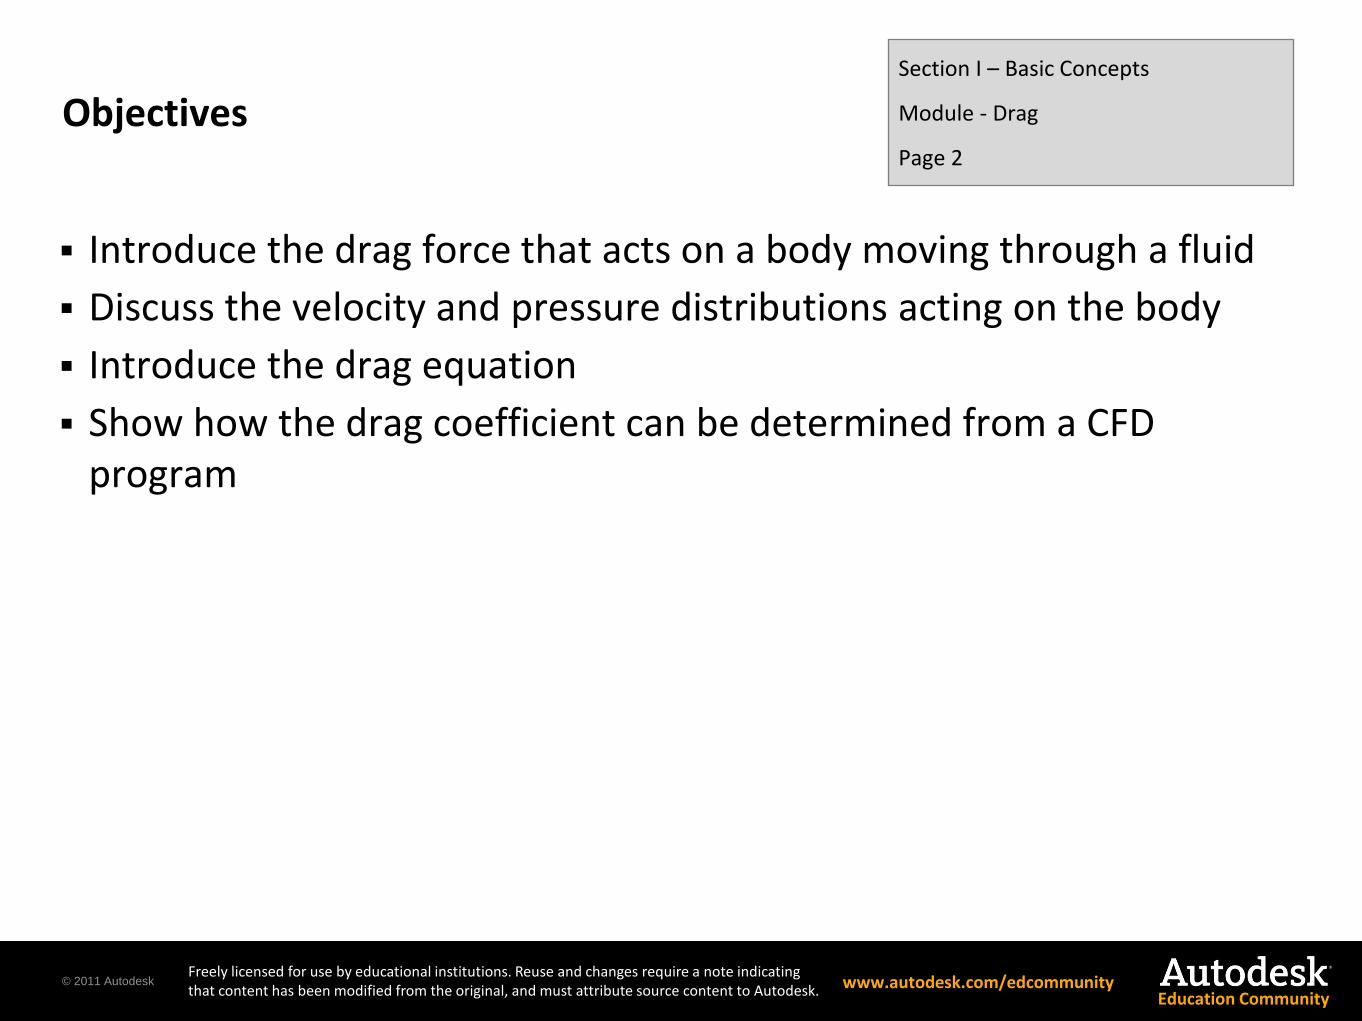
When an object moves through a fluid, there is a force acting on the body by the fluid.
The force acts in the opposite direction of the relative velocity between the fluid and the body.
The force depends on the shape and size of the body, as well as the density, viscosity, and velocity of the fluid.
Velocity Drag Force
© 2011 Autodesk Freely licensed for use by educational institutions. Reuse and changes require a note indicating that content has been modified from the original, and must attribute source content to Autodesk. www.autodesk.com/edcommunity
Education Community
Drag Equation Section I – Basic Concepts
Module - Drag
Page 4
2
2
1VACF D
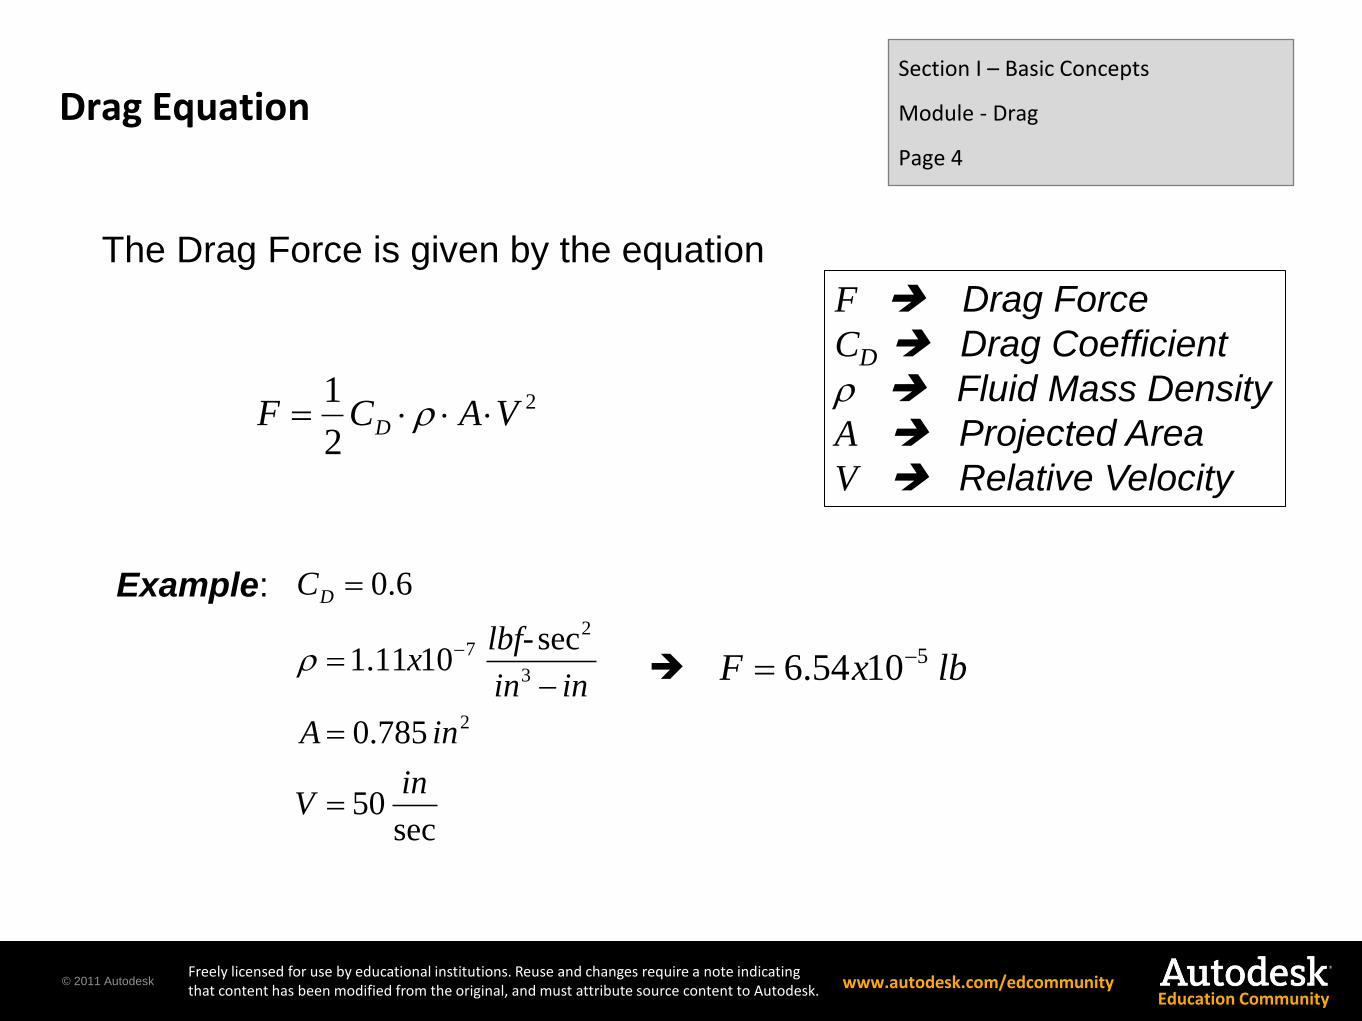
The Drag Force is given by the equation
F Drag Force
CD Drag Coefficient
Fluid Mass Density
A Projected Area
V Relative Velocity
Example:
sec 50
785.0
sec 1011.1
6.0
2
3
27
inV
inA
inin
lbf-x
CD
lbxF 1054.6 5
© 2011 Autodesk Freely licensed for use by educational institutions. Reuse and changes require a note indicating that content has been modified from the original, and must attribute source content to Autodesk. www.autodesk.com/edcommunity
Education Community
Reynolds Number
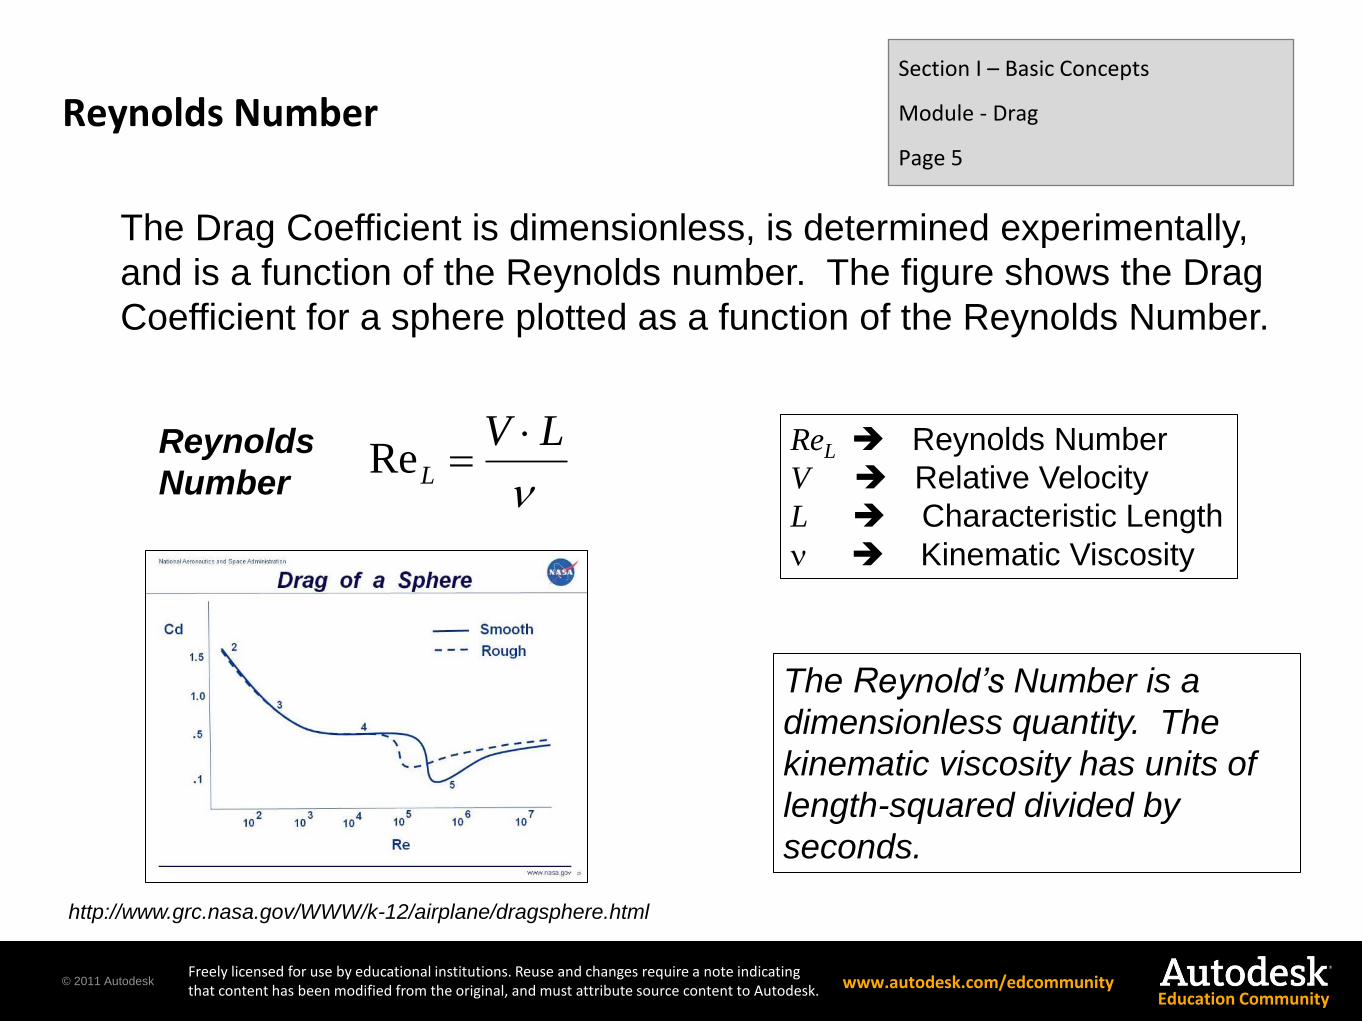
The Drag Coefficient is dimensionless, is determined experimentally,
and is a function of the Reynolds number. The figure shows the Drag
Coefficient for a sphere plotted as a function of the Reynolds Number.
Section I – Basic Concepts
Module - Drag
Page 5
LVL
Re
ReL Reynolds Number
V Relative Velocity
L Characteristic Length
Kinematic Viscosity
http://www.grc.nasa.gov/WWW/k-12/airplane/dragsphere.html
The Reynold’s Number is a
dimensionless quantity. The
kinematic viscosity has units of
length-squared divided by
seconds.
Reynolds
Number
© 2011 Autodesk Freely licensed for use by educational institutions. Reuse and changes require a note indicating that content has been modified from the original, and must attribute source content to Autodesk. www.autodesk.com/edcommunity
Education Community
Example - Sphere Section I – Basic Concepts
Module - Drag
Page 6
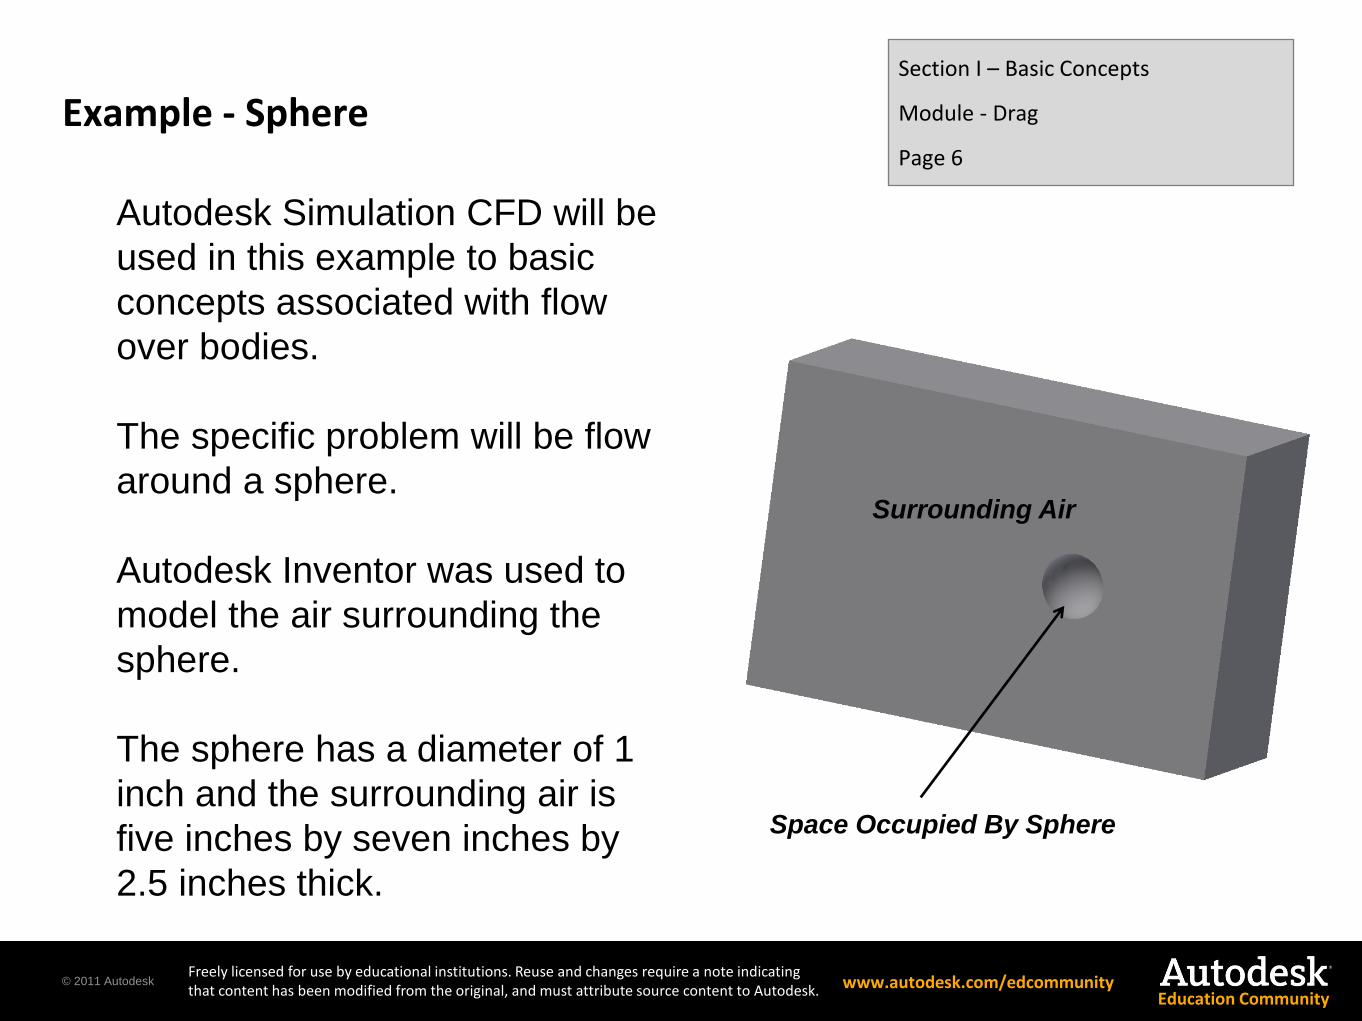
Autodesk Simulation CFD will be
used in this example to basic
concepts associated with flow
over bodies.
The specific problem will be flow
around a sphere.
Autodesk Inventor was used to
model the air surrounding the
sphere.
The sphere has a diameter of 1
inch and the surrounding air is
five inches by seven inches by
2.5 inches thick.
Space Occupied By Sphere
Surrounding Air
© 2011 Autodesk Freely licensed for use by educational institutions. Reuse and changes require a note indicating that content has been modified from the original, and must attribute source content to Autodesk. www.autodesk.com/edcommunity
Education Community
Input Data Section I – Basic Concepts
Module - Drag
Page 7
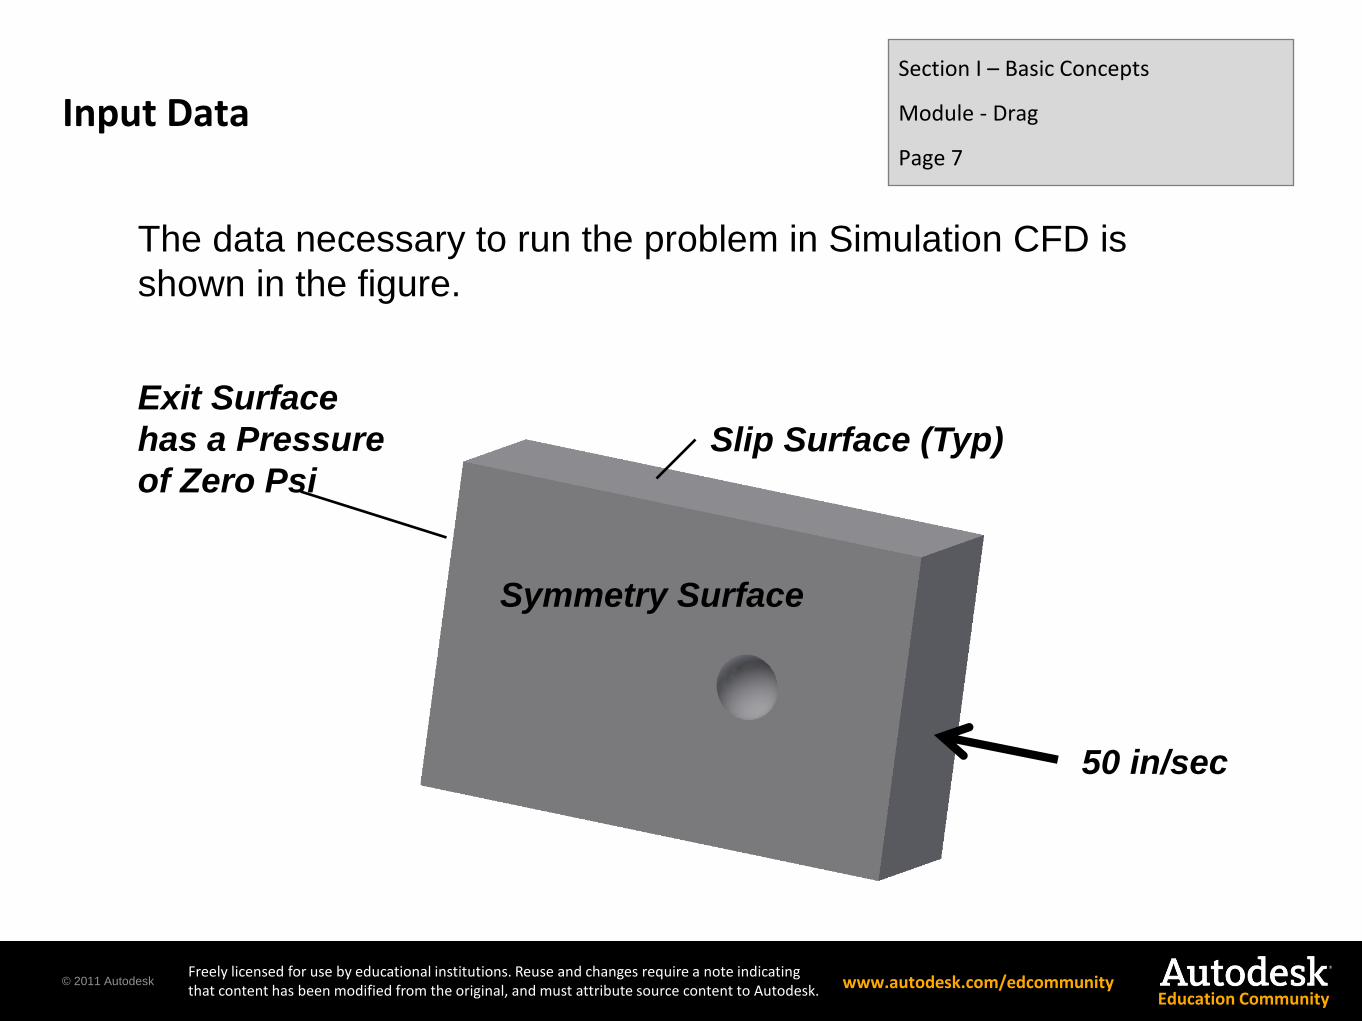
50 in/sec
Exit Surface
has a Pressure
of Zero Psi
Symmetry Surface
Slip Surface (Typ)
The data necessary to run the problem in Simulation CFD is
shown in the figure.
© 2011 Autodesk Freely licensed for use by educational institutions. Reuse and changes require a note indicating that content has been modified from the original, and must attribute source content to Autodesk. www.autodesk.com/edcommunity
Education Community
Velocity Distribution Section I – Basic Concepts
Module - Drag
Page 8
High Velocity
Region Zero Velocity
Zero Velocity
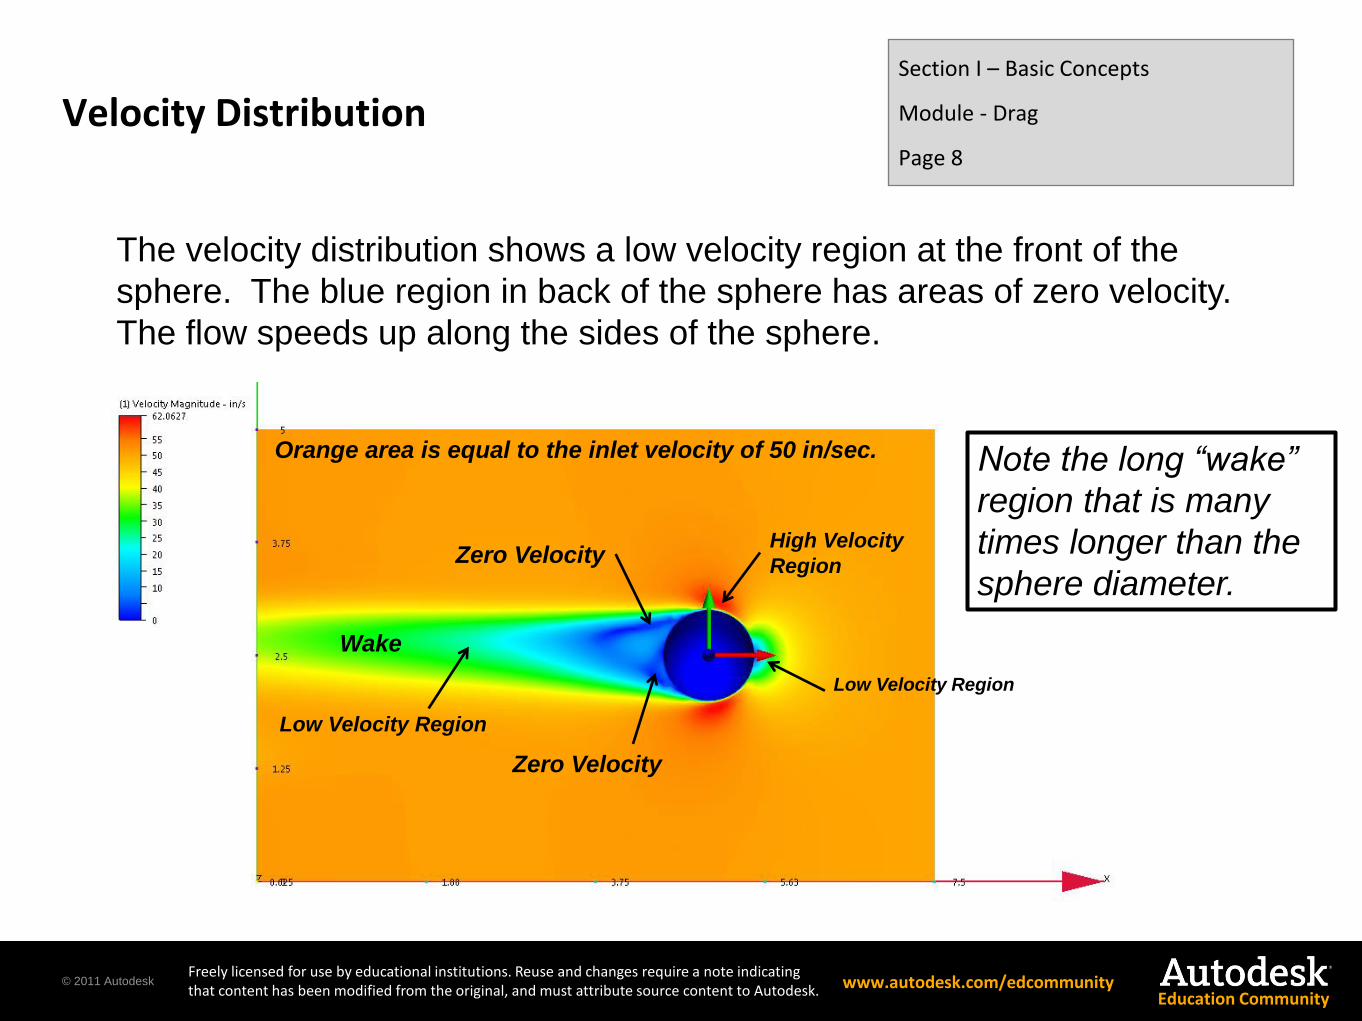
Orange area is equal to the inlet velocity of 50 in/sec.
Wake
Note the long “wake”
region that is many
times longer than the
sphere diameter.
Low Velocity Region
Low Velocity Region
The velocity distribution shows a low velocity region at the front of the
sphere. The blue region in back of the sphere has areas of zero velocity.
The flow speeds up along the sides of the sphere.
© 2011 Autodesk Freely licensed for use by educational institutions. Reuse and changes require a note indicating that content has been modified from the original, and must attribute source content to Autodesk. www.autodesk.com/edcommunity
Education Community
Pressure Distribution Section I – Basic Concepts
Module - Drag
Page 9
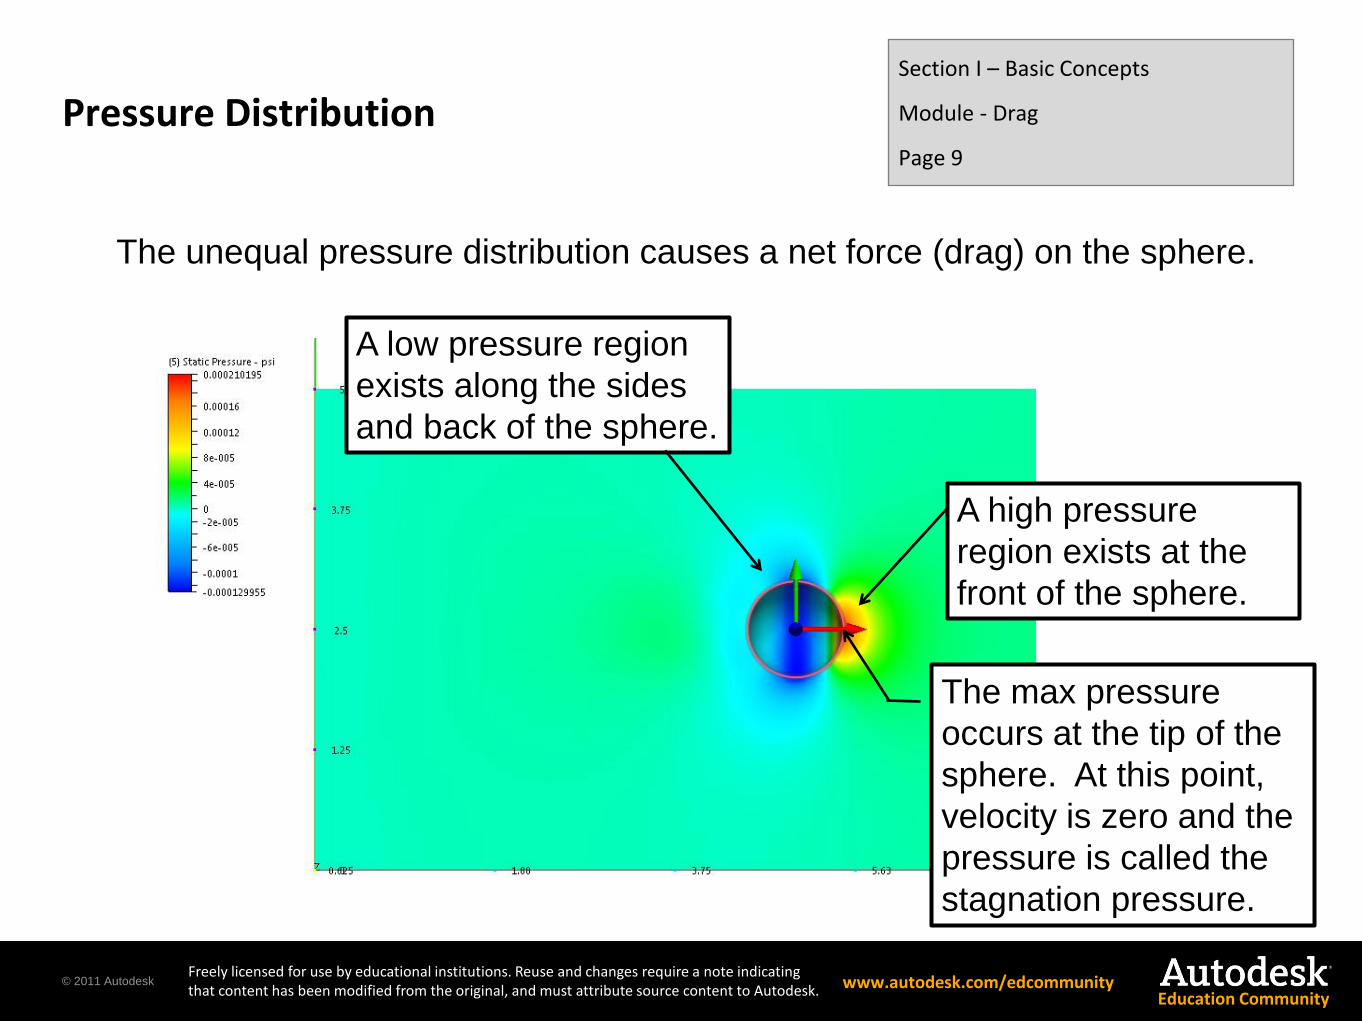
A high pressure
region exists at the
front of the sphere.
The max pressure
occurs at the tip of the
sphere. At this point,
velocity is zero and the
pressure is called the
stagnation pressure.
A low pressure region
exists along the sides
and back of the sphere.
The unequal pressure distribution causes a net force (drag) on the sphere.
© 2011 Autodesk Freely licensed for use by educational institutions. Reuse and changes require a note indicating that content has been modified from the original, and must attribute source content to Autodesk. www.autodesk.com/edcommunity
Education Community
Recirculation Section I – Basic Concepts
Module - Drag
Page 10
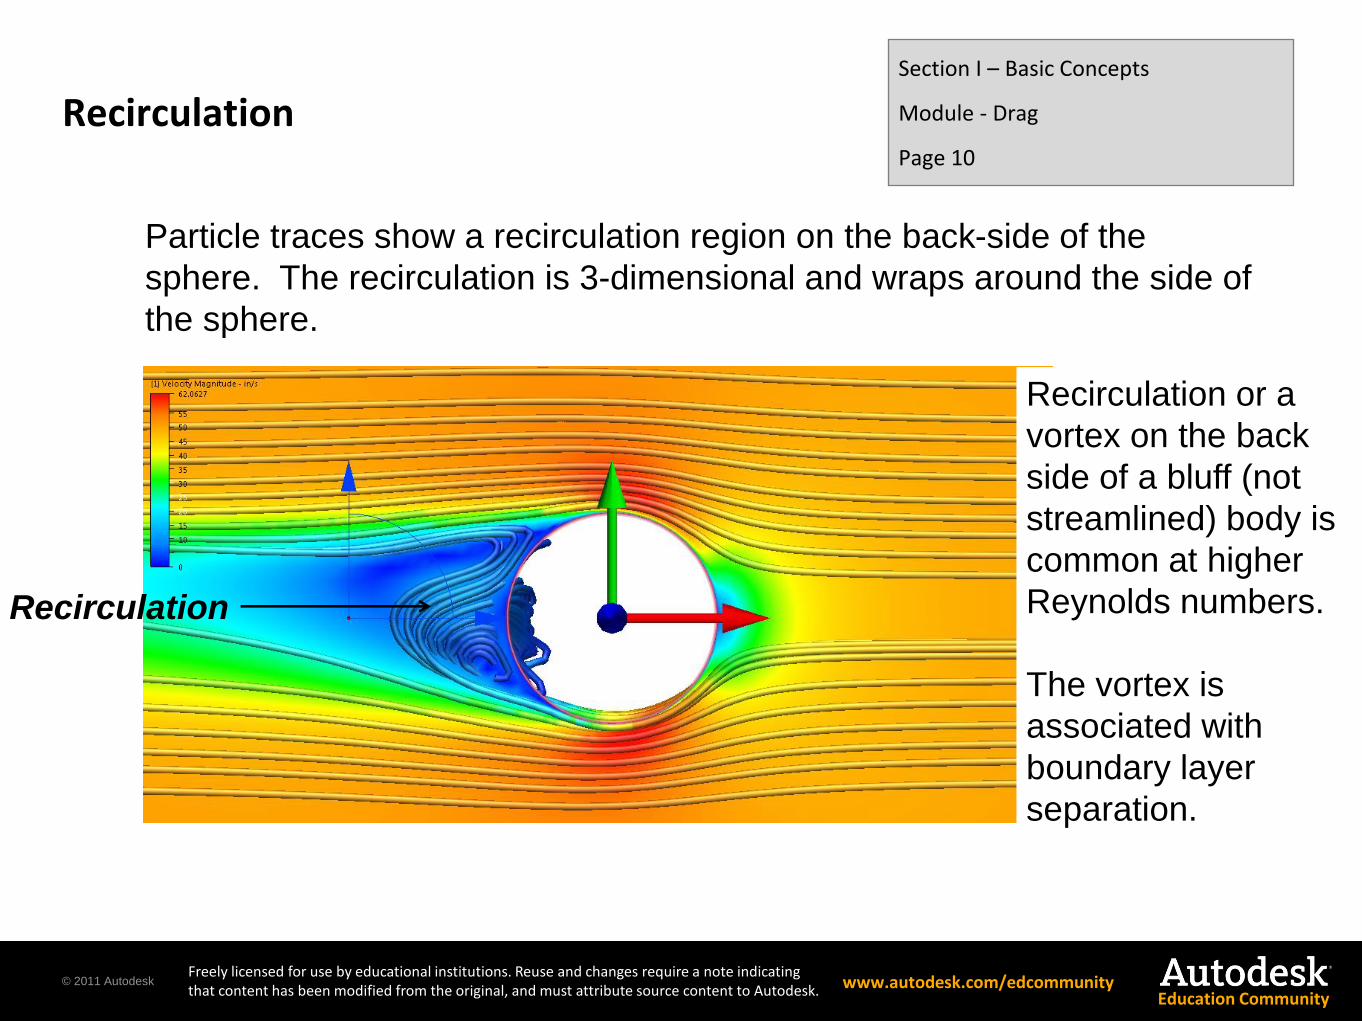
Particle traces show a recirculation region on the back-side of the
sphere. The recirculation is 3-dimensional and wraps around the side of
the sphere.
Recirculation
Recirculation or a
vortex on the back
side of a bluff (not
streamlined) body is
common at higher
Reynolds numbers.
The vortex is
associated with
boundary layer
separation.
© 2011 Autodesk Freely licensed for use by educational institutions. Reuse and changes require a note indicating that content has been modified from the original, and must attribute source content to Autodesk. www.autodesk.com/edcommunity
Education Community
Drag Force Section I – Basic Concepts
Module - Drag
Page 11
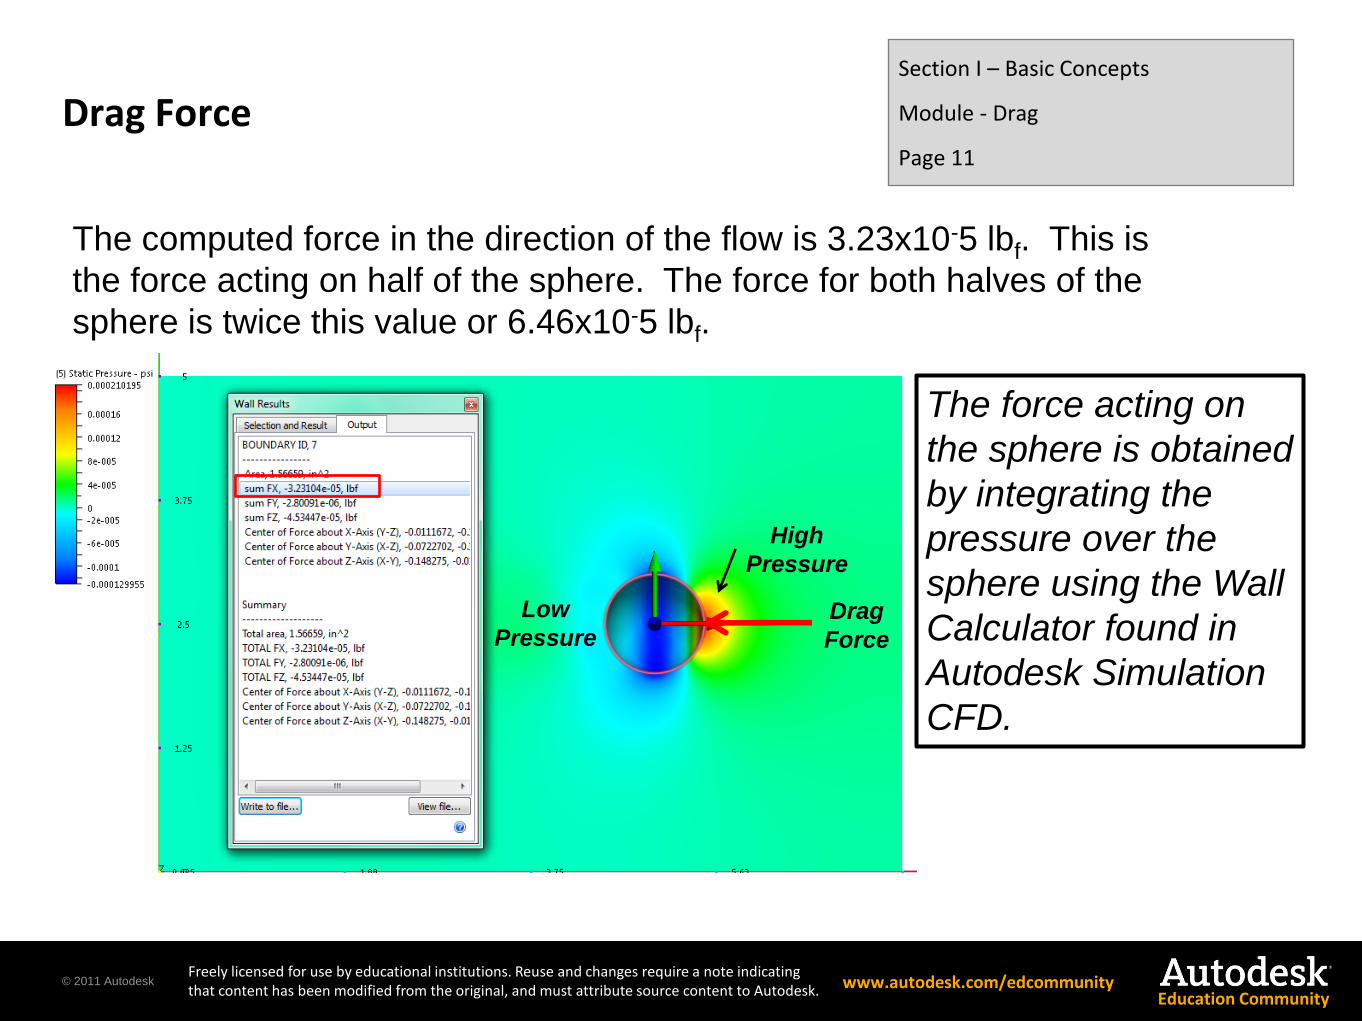
The computed force in the direction of the flow is 3.23x10⁻⁵ lbf. This is
the force acting on half of the sphere. The force for both halves of the
sphere is twice this value or 6.46x10⁻⁵ lbf.
The force acting on
the sphere is obtained
by integrating the
pressure over the
sphere using the Wall
Calculator found in
Autodesk Simulation
CFD.
Low
Pressure
High
Pressure
Drag
Force
© 2011 Autodesk Freely licensed for use by educational institutions. Reuse and changes require a note indicating that content has been modified from the original, and must attribute source content to Autodesk. www.autodesk.com/edcommunity
Education Community
Drag Coefficient Section I – Basic Concepts
Module - Drag
Page 12
593.0
785.0sec
50sec
1011.1
1046.62
2
785.04
1
4
120,2
sec0236.0
1sec
50
Re
2
2
3
27
5
2
2
22
2
inin
inin
lbfx
lbfx
AV
FC
ininD
A
in
inin
DV
d
D
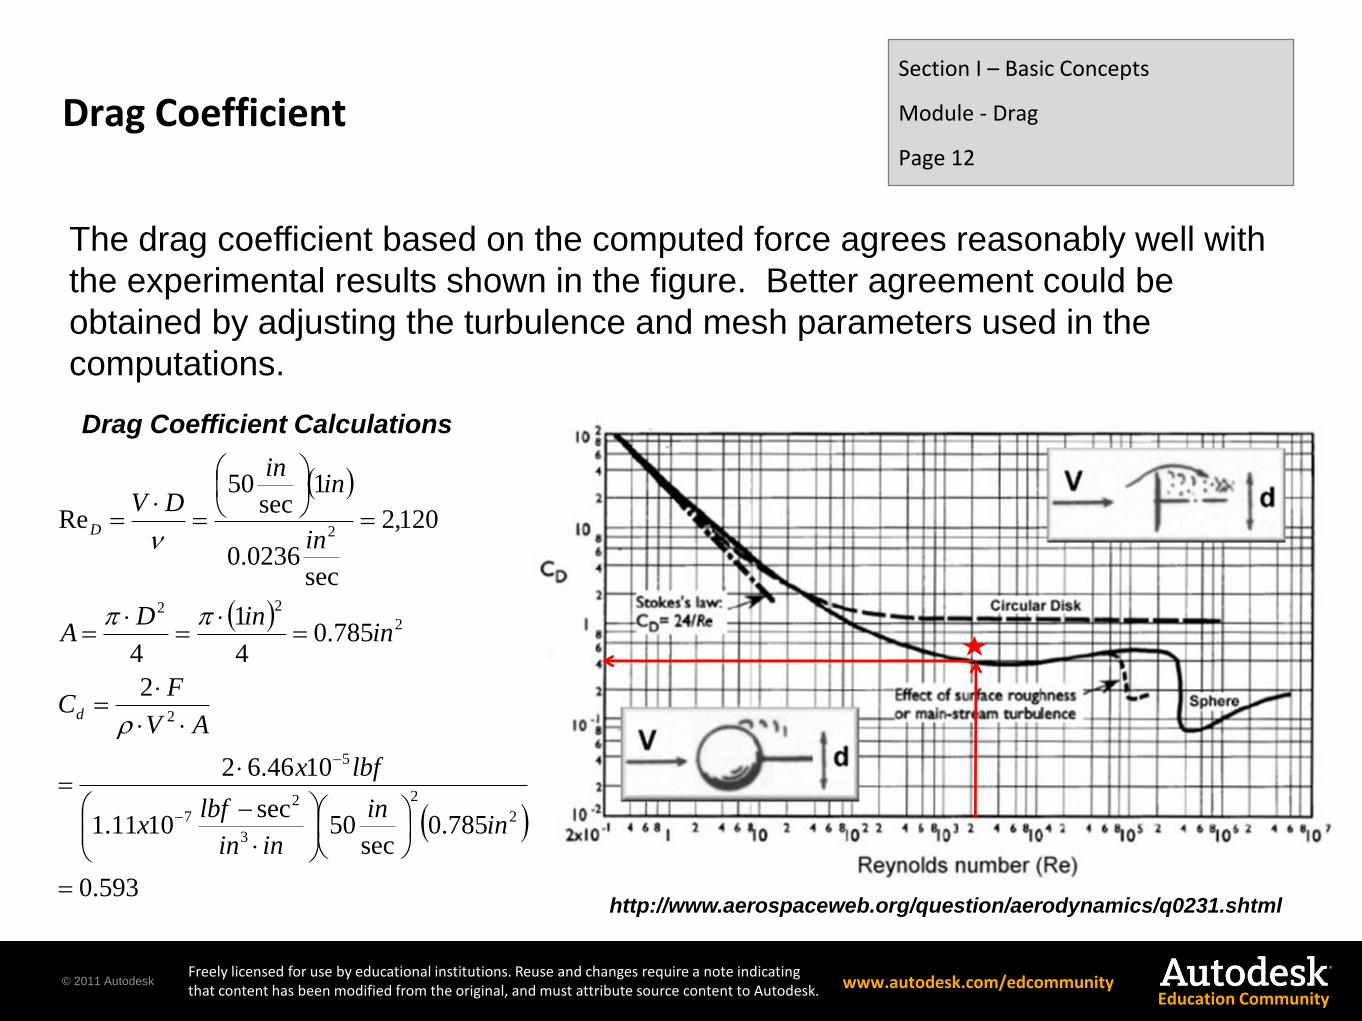
The drag coefficient based on the computed force agrees reasonably well with
the experimental results shown in the figure. Better agreement could be
obtained by adjusting the turbulence and mesh parameters used in the
computations.
http://www.aerospaceweb.org/question/aerodynamics/q0231.shtml
Drag Coefficient Calculations
© 2011 Autodesk Freely licensed for use by educational institutions. Reuse and changes require a note indicating that content has been modified from the original, and must attribute source content to Autodesk. www.autodesk.com/edcommunity
Education Community
Example - Streamlined Geometry Section I – Basic Concepts
Module - Drag
Page 13
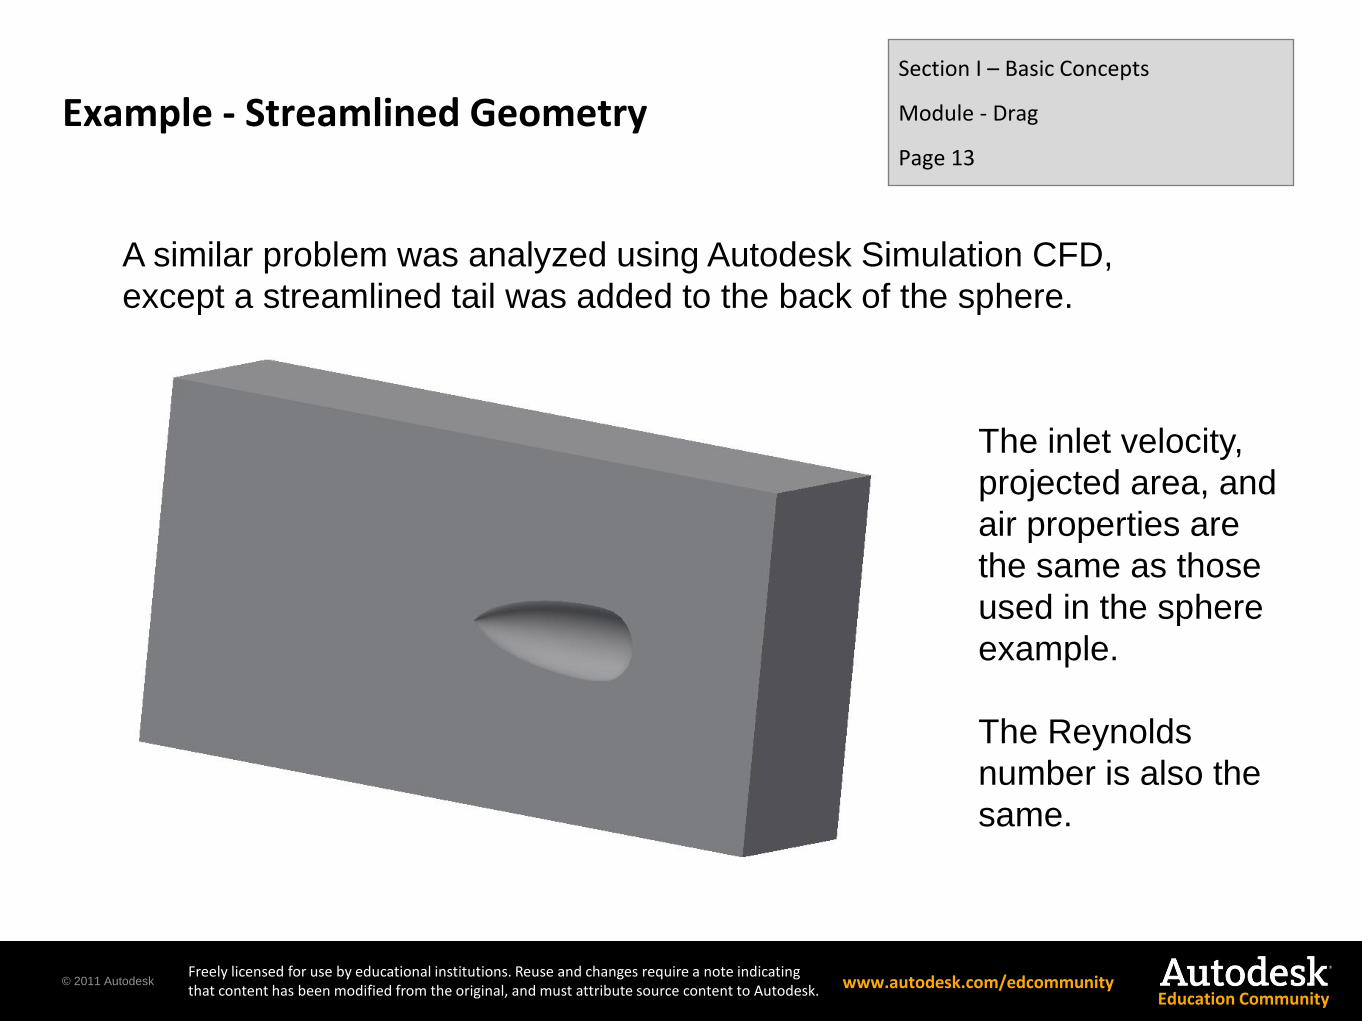
A similar problem was analyzed using Autodesk Simulation CFD,
except a streamlined tail was added to the back of the sphere.
The inlet velocity,
projected area, and
air properties are
the same as those
used in the sphere
example.
The Reynolds
number is also the
same.
© 2011 Autodesk Freely licensed for use by educational institutions. Reuse and changes require a note indicating that content has been modified from the original, and must attribute source content to Autodesk. www.autodesk.com/edcommunity
Education Community
Velocity Distribution Section I – Basic Concepts
Module - Drag
Page 14
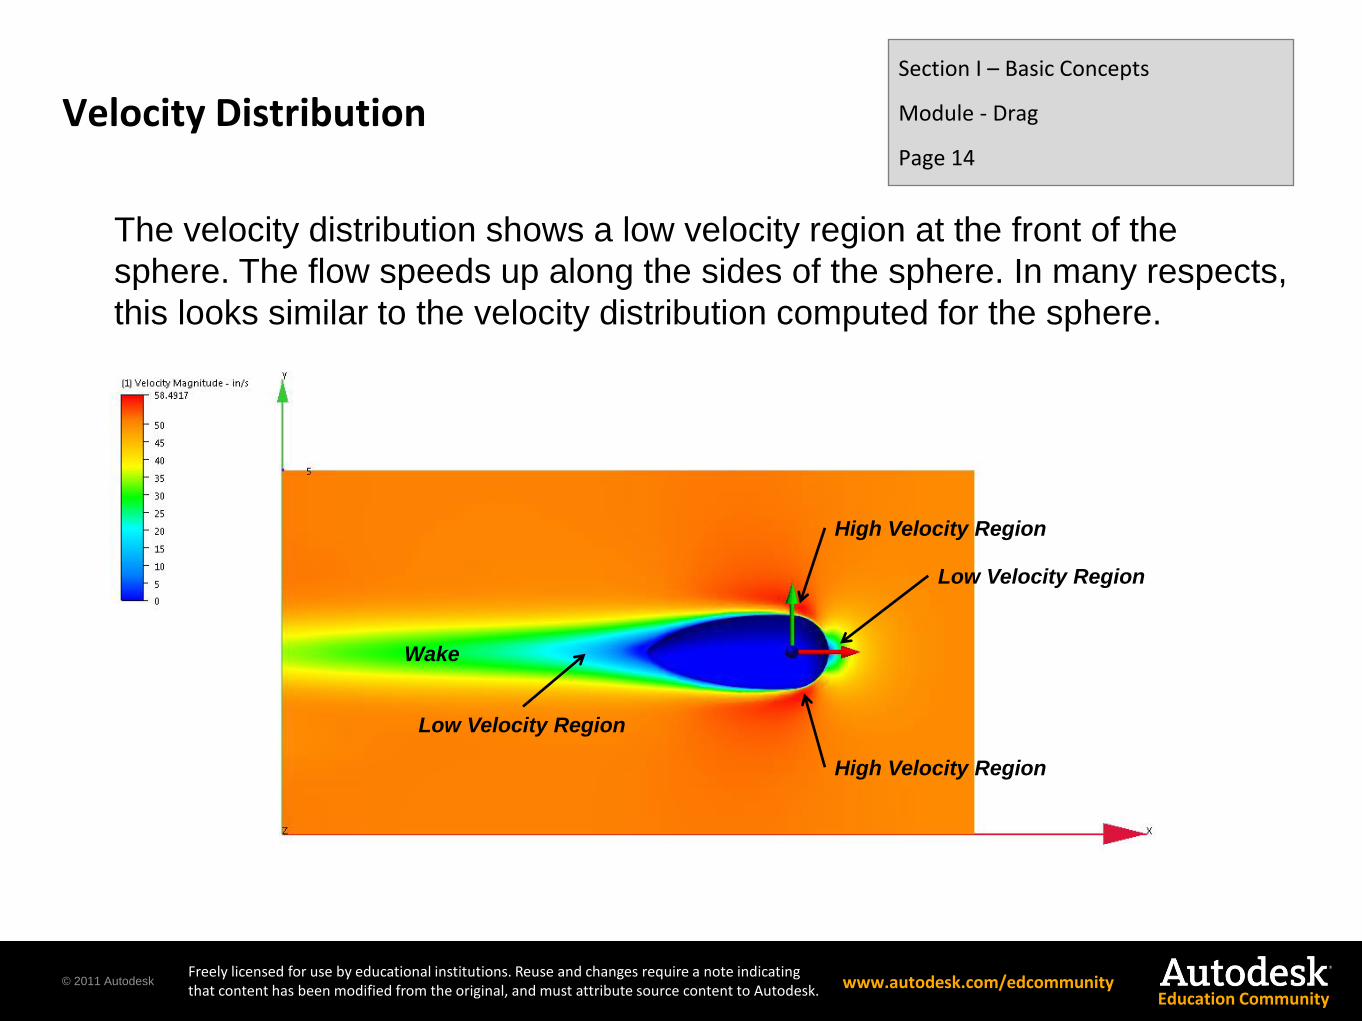
The velocity distribution shows a low velocity region at the front of the
sphere. The flow speeds up along the sides of the sphere. In many respects,
this looks similar to the velocity distribution computed for the sphere.
Low Velocity Region
High Velocity Region
High Velocity Region
Wake
Low Velocity Region
© 2011 Autodesk Freely licensed for use by educational institutions. Reuse and changes require a note indicating that content has been modified from the original, and must attribute source content to Autodesk. www.autodesk.com/edcommunity
Education Community
Recirculation Section I – Basic Concepts
Module - Drag
Page 15
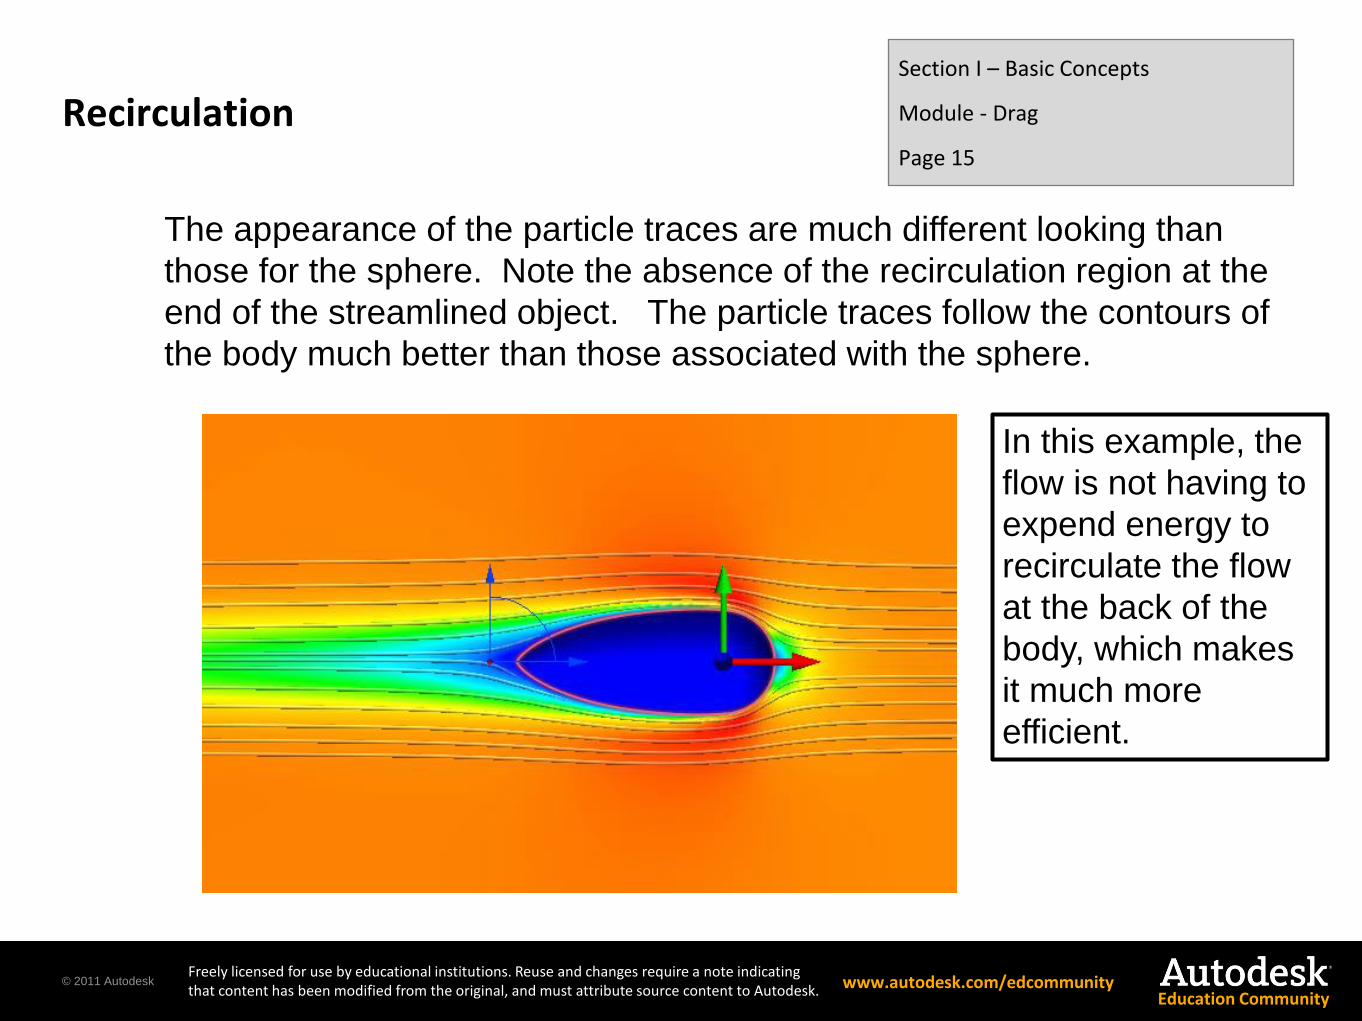
The appearance of the particle traces are much different looking than
those for the sphere. Note the absence of the recirculation region at the
end of the streamlined object. The particle traces follow the contours of
the body much better than those associated with the sphere.
In this example, the
flow is not having to
expend energy to
recirculate the flow
at the back of the
body, which makes
it much more
efficient.
© 2011 Autodesk Freely licensed for use by educational institutions. Reuse and changes require a note indicating that content has been modified from the original, and must attribute source content to Autodesk. www.autodesk.com/edcommunity
Education Community
Pressure Distribution Section I – Basic Concepts
Module - Drag
Page 16
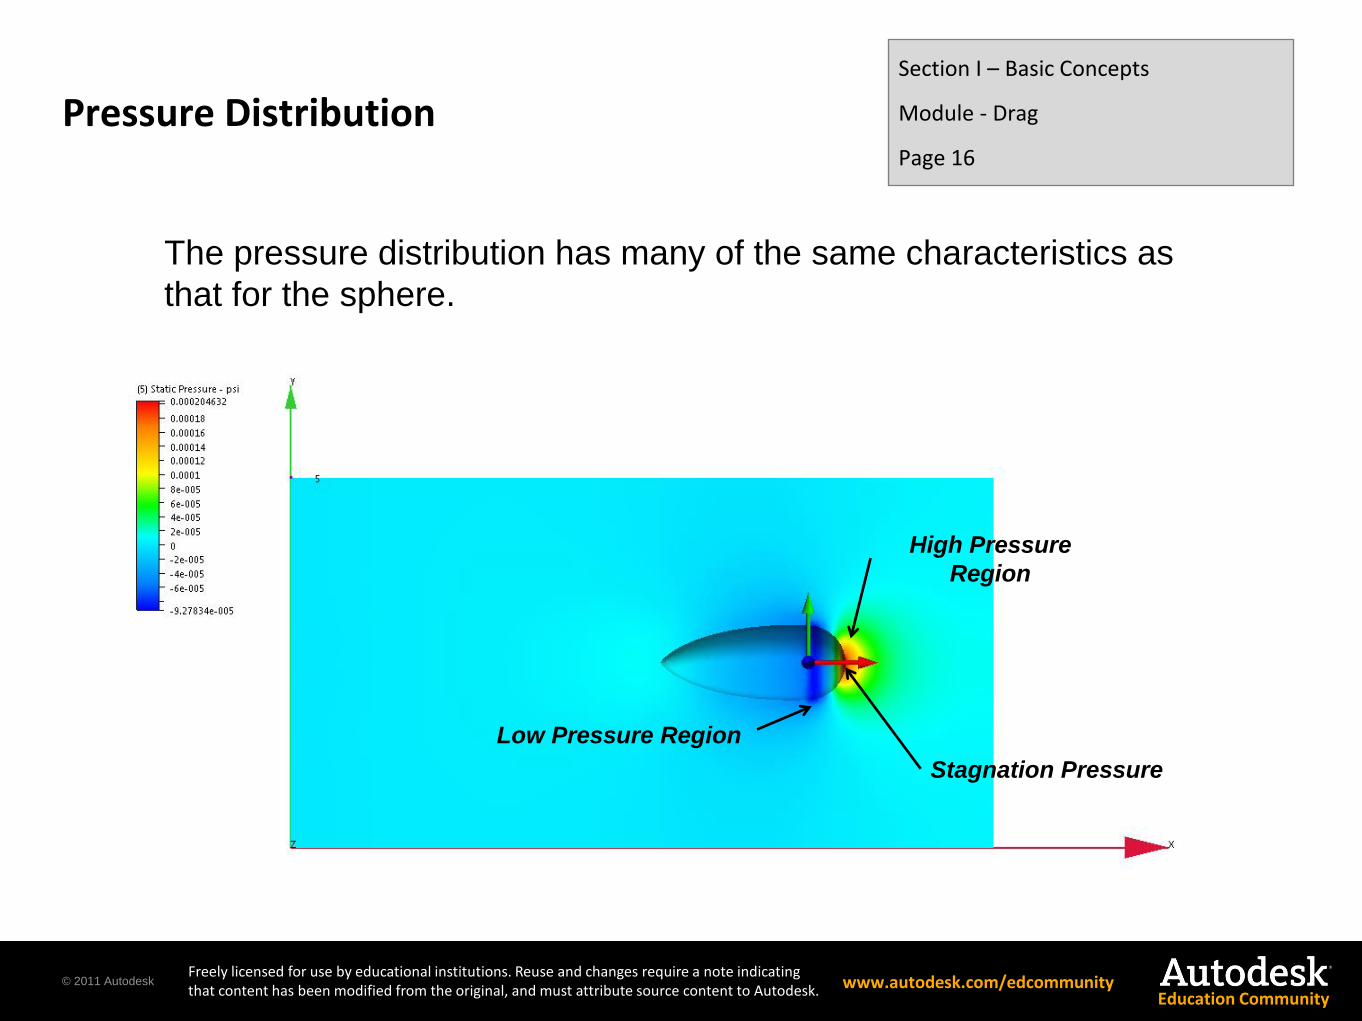
The pressure distribution has many of the same characteristics as
that for the sphere.
High Pressure
Region
Stagnation Pressure
Low Pressure Region
© 2011 Autodesk Freely licensed for use by educational institutions. Reuse and changes require a note indicating that content has been modified from the original, and must attribute source content to Autodesk. www.autodesk.com/edcommunity
Education Community
Drag Force Section I – Basic Concepts
Module - Drag
Page 17
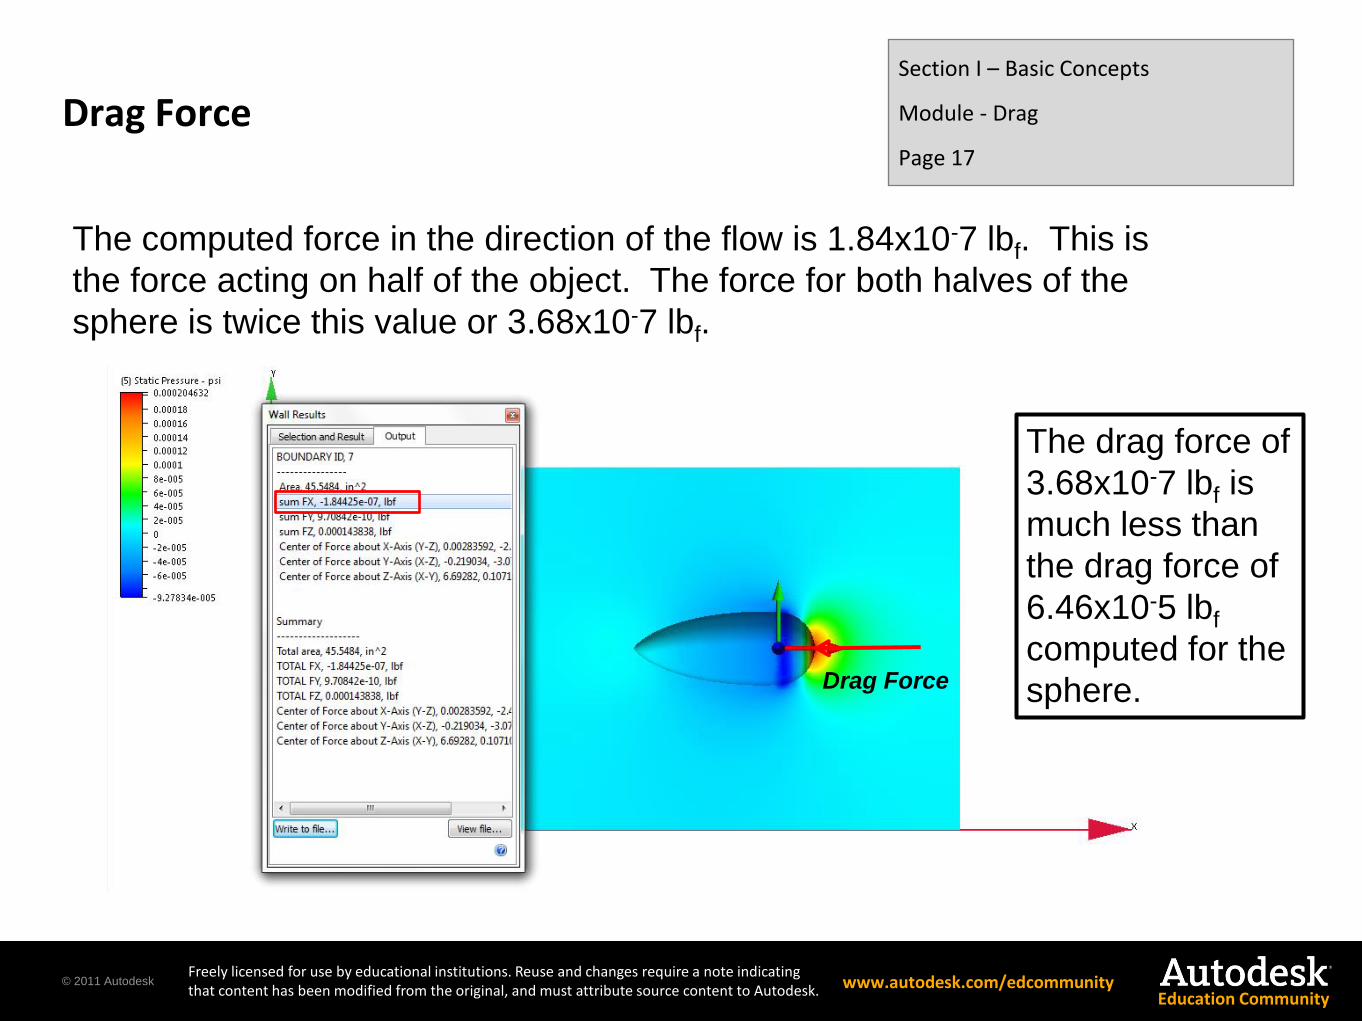
The computed force in the direction of the flow is 1.84x10⁻⁷ lbf. This is
the force acting on half of the object. The force for both halves of the
sphere is twice this value or 3.68x10⁻⁷ lbf.
The drag force of
3.68x10⁻⁷ lbf is
much less than
the drag force of
6.46x10⁻⁵ lbf
computed for the
sphere. Drag Force
© 2011 Autodesk Freely licensed for use by educational institutions. Reuse and changes require a note indicating that content has been modified from the original, and must attribute source content to Autodesk. www.autodesk.com/edcommunity
Education Community
Drag Coefficient Section I – Basic Concepts
Module - Drag
Page 13
593.0
785.0sec
50sec
1011.1
1046.62
2
785.04
1
4
120,2
sec0236.0
1sec
50
Re
2
2
3
27
5
2
2
22
2
inin
inin
lbfx
lbfx
AV
FC
ininD
A
in
inin
DV
d
D
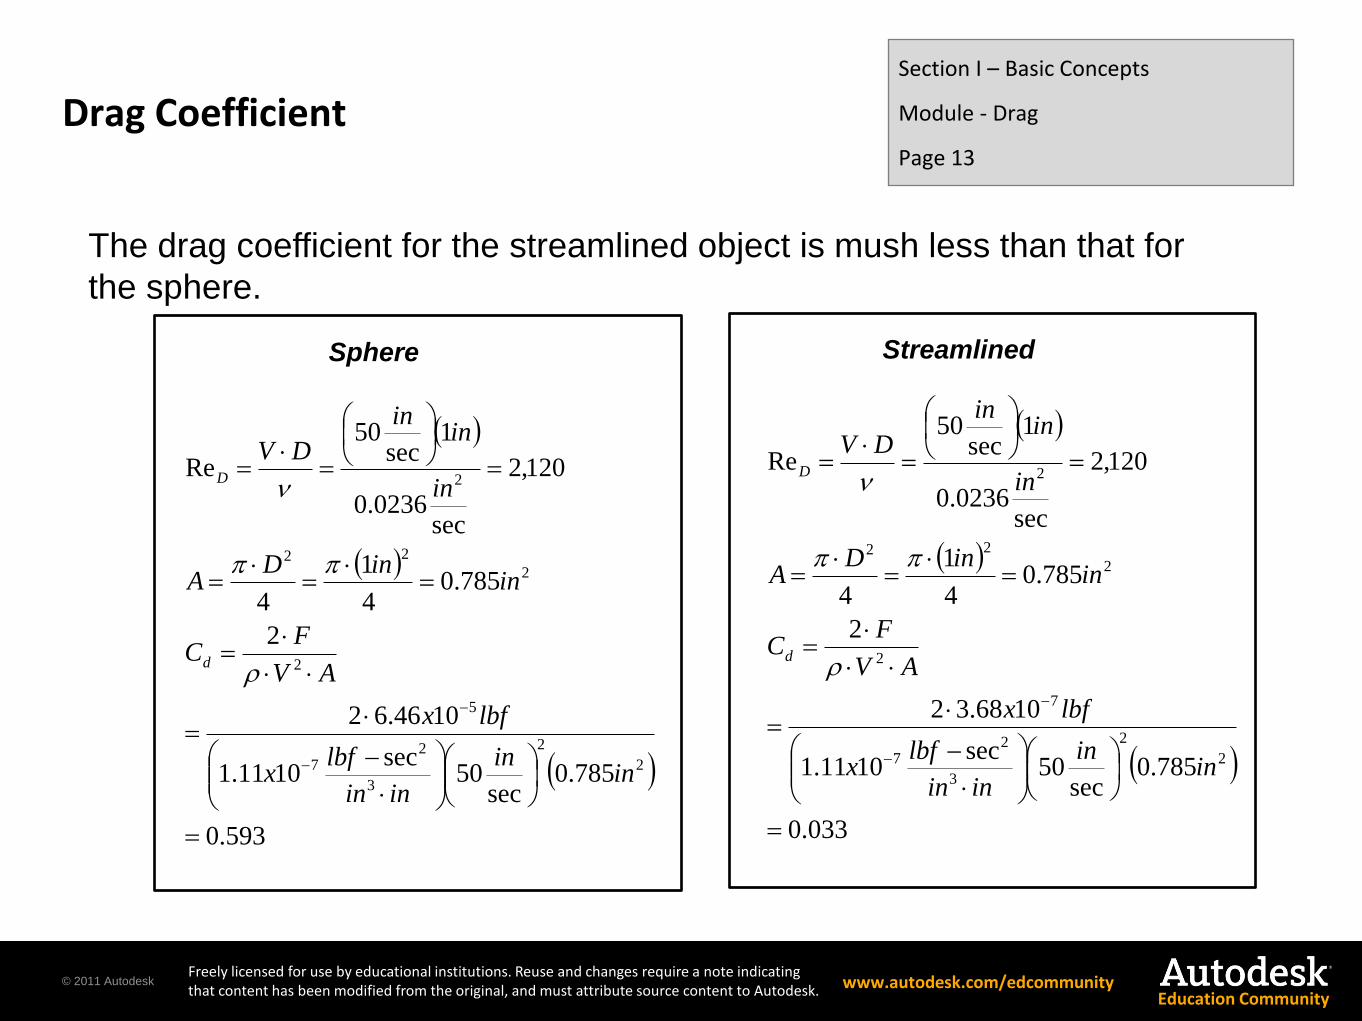
The drag coefficient for the streamlined object is mush less than that for
the sphere.
Sphere
033.0
785.0sec
50sec
1011.1
1068.32
2
785.04
1
4
120,2
sec0236.0
1sec
50
Re
2
2
3
27
7
2
2
22
2
inin
inin
lbfx
lbfx
AV
FC
ininD
A
in
inin
DV
d
D
Streamlined
© 2011 Autodesk Freely licensed for use by educational institutions. Reuse and changes require a note indicating that content has been modified from the original, and must attribute source content to Autodesk. www.autodesk.com/edcommunity
Education Community
Summary
This module has introduced concepts associated with the drag force that acts on a body that moves relative to a fluid.
Flow field phenomena associated with drag have been demonstrated using Autodesk Simulation CFD.
The recirculation region on the back side of bluff bodies was shown to have a big influence on the drag force.
The reduction in the Drag Coefficient achieved by streamlining the body was demonstrated.
Section I – Basic Concepts
Module - Drag
Page 18