Basic analysis of climate and urban bioclimate of Dar … analysis of climate and urban bioclimate...
14
ORIGINAL PAPER Basic analysis of climate and urban bioclimate of Dar es Salaam, Tanzania Emmanuel L. Ndetto & Andreas Matzarakis Received: 8 June 2012 / Accepted: 28 December 2012 / Published online: 18 January 2013 # Springer-Verlag Wien 2013 Abstract Better understanding of urban microclimate and bioclimate of any city is imperative today when the world is constrained by both urbanisation and global climate change. Urbanisation generally triggers changes in land cover and hence influencing the urban local climate. Dar es Salaam city in Tanzania is one of the fast growing cities. Assessment of its urban climate and the human biometeorological conditions was done using the easily available synoptic meteorological data covering the period 2001–2011. In particular, the physi- ologically equivalent temperature (PET) was calculated using the RayMan software and results reveal that the afternoon period from December to February (DJF season) is relatively the most thermal stressful period to human beings in Dar es Salaam where PET values of above 35 °C were found. Additionally, the diurnal cycle of the individual meteorologi- cal elements that influence the PET index were analysed and found that air temperature of 30–35 °C dominate the afternoon period from 12:00 to 15:00 hours local standard time at about 60 % of occurrence. The current results, though considered as preliminary to the ongoing urban climate study in the city, provide an insight on how urban climate research is of signif- icant importance in providing useful climatic information for ensuring quality of life and wellbeing of city dwellers. 1 Introduction Dar es Salaam is one of the current fastest growing cities in the world with an average annual growth for 2006 to 2020 at 4.4 %, ranking ninth in the world. At present, its population is estimated at three million inhabitants being the second most populated city in East Africa after Nairobi. But it is projected to have 5.1 million in 2020 hence becoming the most populous city in East Africa surpassing Nairobi (citymayors statistics 2011). Dar es Salaam comprises about one third of the urban population of Tanzania (Abebe 2011). Though, urbanisation can be mostly driven by economic growth, it calls for multidisciplinary action particularly re- search in order to ensure improvement on quality of life and minimization of environmental problems. Like other cities in developing countries in Africa, Dar es Salaam is vulnerable to many environmental problems including flash flooding, air pollution and urban bioclimate (Douglas et al. 2008). Climate change also may jeopardise the urban life in Dar es Salaam due to its projected impacts of coastal erosion, sea level rise and the possibility of thermal discomfort as the air temperature continue to rise. Multidisciplinary research makes available important information for town planers and policy makers for better management of towns and wellbeing of inhabitants (Chen and Ng 2011). It is therefore the goal of this study to examine the changes occurring on the land surface due to urbanisation of the Dar es Salaam city and how these changes affect the microclimate of the city in conjunction with the play of the ocean. The present paper then reports the first results about the current urban bioclimate while setting the avenue for the future work. Usually, cities will grow at the expense of continued land cover changes and the natural environment particularly veg- etation. Due to land use and land cover changes in cities attributed by urbanisation, tremendous changes occur in form of landscape. This produces changes in that particular area’ s air (Chen and Ng 2011). One particular characteristic feature of growing cities in developing countries is urban sprawl, a problem also revealed in Pauchard et al. (2006) who called for more research on the impacts of urban sprawl E. L. Ndetto (*) : A. Matzarakis Professur für Meteorologie und Klimatologie, Albert-Ludwigs University Freiburg, Werthmannstrasse 10, 79085 Freiburg im Breisgau, Germany e-mail: [email protected] A. Matzarakis e-mail: [email protected] Theor Appl Climatol (2013) 114:213–226 DOI 10.1007/s00704-012-0828-2
Transcript of Basic analysis of climate and urban bioclimate of Dar … analysis of climate and urban bioclimate...
ORIGINAL PAPER
Basic analysis of climate and urban bioclimate of Dar esSalaam, Tanzania
Emmanuel L. Ndetto & Andreas Matzarakis
Received: 8 June 2012 /Accepted: 28 December 2012 /Published online: 18 January 2013# Springer-Verlag Wien 2013
Abstract Better understanding of urban microclimate andbioclimate of any city is imperative today when the world isconstrained by both urbanisation and global climate change.Urbanisation generally triggers changes in land cover andhence influencing the urban local climate. Dar es Salaam cityin Tanzania is one of the fast growing cities. Assessment of itsurban climate and the human biometeorological conditionswas done using the easily available synoptic meteorologicaldata covering the period 2001–2011. In particular, the physi-ologically equivalent temperature (PET) was calculated usingthe RayMan software and results reveal that the afternoonperiod from December to February (DJF season) is relativelythe most thermal stressful period to human beings in Dar esSalaam where PET values of above 35 °C were found.Additionally, the diurnal cycle of the individual meteorologi-cal elements that influence the PET index were analysed andfound that air temperature of 30–35 °C dominate the afternoonperiod from 12:00 to 15:00 hours local standard time at about60 % of occurrence. The current results, though considered aspreliminary to the ongoing urban climate study in the city,provide an insight on how urban climate research is of signif-icant importance in providing useful climatic information forensuring quality of life and wellbeing of city dwellers.
1 Introduction
Dar es Salaam is one of the current fastest growing cities inthe world with an average annual growth for 2006 to 2020 at
4.4 %, ranking ninth in the world. At present, its populationis estimated at three million inhabitants being the secondmost populated city in East Africa after Nairobi. But it isprojected to have 5.1 million in 2020 hence becoming themost populous city in East Africa surpassing Nairobi(citymayors statistics 2011). Dar es Salaam comprises aboutone third of the urban population of Tanzania (Abebe 2011).Though, urbanisation can be mostly driven by economicgrowth, it calls for multidisciplinary action particularly re-search in order to ensure improvement on quality of life andminimization of environmental problems. Like other cities indeveloping countries in Africa, Dar es Salaam is vulnerable tomany environmental problems including flash flooding, airpollution and urban bioclimate (Douglas et al. 2008). Climatechange also may jeopardise the urban life in Dar es Salaamdue to its projected impacts of coastal erosion, sea level riseand the possibility of thermal discomfort as the air temperaturecontinue to rise. Multidisciplinary research makes availableimportant information for town planers and policy makers forbetter management of towns and wellbeing of inhabitants(Chen and Ng 2011). It is therefore the goal of this study toexamine the changes occurring on the land surface due tourbanisation of the Dar es Salaam city and how these changesaffect the microclimate of the city in conjunction with the playof the ocean. The present paper then reports the first resultsabout the current urban bioclimate while setting the avenue forthe future work.
Usually, cities will grow at the expense of continued landcover changes and the natural environment particularly veg-etation. Due to land use and land cover changes in citiesattributed by urbanisation, tremendous changes occur inform of landscape. This produces changes in that particulararea’s air (Chen and Ng 2011). One particular characteristicfeature of growing cities in developing countries is urbansprawl, a problem also revealed in Pauchard et al. (2006)who called for more research on the impacts of urban sprawl
E. L. Ndetto (*) :A. MatzarakisProfessur für Meteorologie und Klimatologie, Albert-LudwigsUniversity Freiburg, Werthmannstrasse 10,79085 Freiburg im Breisgau, Germanye-mail: [email protected]
A. Matzarakise-mail: [email protected]
Theor Appl Climatol (2013) 114:213–226DOI 10.1007/s00704-012-0828-2
on biodiversity in the developing world. Urban sprawl ismainly been caused by population and income growth andenvironmental negligence in connection to relaxed legalregulations. Urban sprawl is reported to alter a large landsurface area hence consequently the atmosphere surfaceenergy budget is being affected. The later is what bringschanges in urban microclimate. As urban microclimatechange, human bioclimatic conditions could also signifi-cantly be altered depending on the extent of land coverchanges (Barradas 1991). An early urban climate study doneusing remote sensing information for 1,000 km2 region ofCentre County, Pennsylvania, USA revealed that changes inthe surface microclimate is significantly related to fractionaldecrease in vegetation cover (Owen et al. 1998). And whilestudying the warm–humid city of Colombo, Sri Lanka,Emmanuel (2005) called for simulation studies to be donein order to prove the links between “hard” land coverchanges and bioclimatic changes in tropical regions.
It has already been established that buildings’ height doesnot significantly contribute to the regional climate, while itis the size of urban areas that plays an important role in thespatial extent of air temperature and precipitation disturban-ces (Trusilova 2006). Though, most dramatic changes canbe seen in terms of air temperature, effects of the expandedurban land cover on precipitation might also be amplifiedwith the further urban expansion and hence cannot be ig-nored in the future climate projections on local and regionalscales.
Apart from the nature and type of land cover changes,urban microclimate of a particular city can be greatly mod-ified by the presence of topographic features like mountain,forests and water bodies. Also urban microclimate is influ-enced by the geographic location and season of the year. Forinstance, temperate cities will display a different urban heatisland to that experienced in tropical cities but also it isdifferent to that experienced in summer or winter times(Arnfield 2003; Roth 2007). Due to changing seasons at-tributed to climate change, it is also anticipated that urbanmicroclimate can be greatly affected and this call for con-tinued urban climatology studies especially to cities in de-veloping countries where adaptation capacity is neverthelessthe least. Additionally, Dar es Salaam lies along the WesternIndian Ocean coast and influence of sea in form of seasurface temperature and sea/land breezes on urban microcli-mate and bioclimate could be high at times of the year. Theunderstanding of such relationship is also of utmost impor-tance especially in urban planning particularly to cities inthe hot–humid climates (Emmanuel and Johansson 2006;Lopes et al. 2011; Nieuwolt 1973).
While there have been many studies about urban clima-tology in Europe and North America, few studies are beingdone in the tropics (Jauregui 2005; Jansson 2006). In EastAfrica for instance, recent studies done in Nairobi reveal
that urban modification of minimum air temperature is highsuggesting a high warming and low cooling rates in urbancanyon (Makokha and Shisanya 2010a, 2010b). Moreover,urbanisation is a dynamic issue hence the effects of landcover changes studied today will be different when the studyis done in future time. It is therefore clear from individualcase studies that there are significant differences in urbani-sation processes among regions and countries, and evenwithin countries. Moreover, urbanisation as a physical phe-nomenon is not a homogeneous process (Seto et al. 2011).
Urban development therefore brings about changes in thephysical behaviour of the landscape, affecting its hydrolog-ical, thermal, radiative and aerodynamic properties, whichin turn affects the exchange of heat, mass and momentumbetween the surface and the atmosphere (Jansson 2006; Cui2005). Flash flooding effects can also be experienced indensely built-up environments if there is no proper mecha-nism to facilitate drainage system as the city continues toexpand (Douglas et al. 2008).
2 Bioclimatic indices for thermal comfort
Thermal comfort is the mental condition that expresses satis-faction with the thermal environment. Assessment of humanbioclimatological comfort sensations in different urban envi-ronments has been done using bioclimatic thermal indices. Inhuman bioclimatology, a large number of indices can befound, but it is advised to use the indices developed basingon the concept of human body energy balance. Such indicesespecially those incorporating the four main meteorologicalelements namely air temperature, air humidity, wind speedand radiation fluxes can be applied universally.
In this class of indices, it has been found that the phys-iologically equivalent temperature (PET) is the useful bio-climatic index to use. Additionally, PET uses a usual andwidely known unit of degree Celsius as an indicator ofthermal stress (Deb and Ramachandraiah 2010) and evalu-ates the thermal conditions in a human physiological man-ner (Mayer and Höppe 1987; Matzarakis et al. 1999; Höppe1999). The unit is commonly known to other people who donot necessarily be human biometeorology professionals.PET can also then be applied in different climates and allyear round (Matzarakis et al. 2007; Lin and Matzarakis2008; Zaninovic and Matzarakis 2009; Gulyás andMatzarakis 2009, Çalışkan et al. 2012). The index hasalready been used to assess human bioclimate in cities ofhot–humid climate in Southeast Asia (Johansson andEmmanuel 2006; Emmanuel et al. 2007; Lin et al. 2010).PET is therefore defined as the air temperature at which thehuman energy budget for the assumed indoor conditions isbalanced by the same skin temperature and sweat rate asunder the actual complex outdoor conditions to be assessed
214 E.L. Ndetto, A. Matzarakis
(Deb and Ramachandraiah 2010;Mayer and Höppe 1987;Matzarakis et al. 1999; Höppe 1999).
The emergence of universally applied bioclimatic indicescan be traced back to Fanger’s predicted mean vote model in1967. The model was developed basing on thermoregulationand heat balance theories (Fanger 1972). The theories assertthat the human body employs physiological processes so asto balance the metabolic heat energy produced by the bodyand the heat lost from the body (Orosa 2009). Together, withPET, other universal thermal indices include the recentlydeveloped Universal Thermal Climate Index (UTCI;Jendritzky et al. 2012), perceived temperature (Staiger etal. 2012), and the modified Standard Effective Temperature.The latter two indices together with PET have been com-pared with UTCI and they were found to performancecomparably (Blazejczyk et al. 2012). This is because all ofthese indices take a similar approach (Staiger et al. 2012). Inthe current thermal bioclimate analysis for Dar es Salaam,PET was preferred to the other, since it runs smoothly in theRayMan model and has been used for a quite a long timehence been critically examined in different environments ofthe world (Matzarakis et al. 2007, 2010; Lin 2009,Farajzadeh and Matzarakis 2012).
In Dar es Salaam, Nieuwolt (1973) used hourly datasetsof air temperature and humidity for 1968–1971 to assess thethermal comfort and found Temperature Humidity Index(THI) above 25 °C during afternoons from October toMay. At 24 °C, most people would start to experiencethermal stress according to THI thermal scale based onexperiments done in the USA. In a neighbour country ofKenya, spatial, seasonal and diurnal variation of theEffective Temperature (ET) index was determined by usingmeteorological data for the period of 1968–1988 for thepurpose of classifying the country into climatic comfortzones (Makokha 1998). Like THI, ET also is determinedby using air temperature and relative humidity and has beenwidely used especially in places where other parameters areunavailable (Makokha 1998; Jauregui 1991). It is then ap-parent that the two indices could not comprehensively ad-dress the human body heat balance due to lack of the othermeteorological elements of wind speed and radiation. Theuse of PET will then sufficiently give a detailed thermalcomfort assessment of the urban environment of Dar esSalaam city. Whereas in the tropical Africa area, PET hasalready been applied to study the effect of thermal environ-ment on the occurrence of measles in Ondo state, Nigeriawhere it was found that together with UTCI, PET correlateswell with the transmission of measles (Omonijo et al. 2011).Recently, Eludoyin and Aldelekan (2012) have employedthree indices of ET, THI and RSI (relative strain index) tostudy the physiologic climate of Nigeria and found that theindices can provide complementary information regardingthe thermal stress assessment.
The study of the urban climate and bioclimate of Dar esSalaam is very important not only because of the growingconcern for environmental quality and energy conservationamong policy makers, architects, engineers and planners butalso to the general public in ensuring a quality of life amongthe urban dwellers. Dar es Salaam at the moment constitutesof over 70 % of unplanned settlements and efforts forrestructuring and redeveloping such settlements are under-taken (UN HABITAT 2010). It is also equally important tocarry out adequate study of the climate of any specific site inorder to enhance cross-continental transfer of architecturaland engineering ideas from temperate areas to the tropics.The study of urban microclimate created a bridge that linksclimatology research and applied urban design. This pro-vides architects and urban planner imperative climatic infor-mation of how microclimatic conditions in the spacebetween buildings can be affected by the built environmentat all scales, and analyses the interaction between microcli-mate and each of the elements of the urban landscape.
Moreover, urban climate research seems to be inevitabletoday as the world is experiencing a tremendous demo-graphic transition from rural to urban (UN HABITAT2008). In 2007, half of the world’s population lived in citiesand it is projected that within the next two decades, 60 % ofthe world’s people will reside in urban areas than in othertypes of settlements, the trend is expected to continue for theforeseeable future (UN HABITAT 2008). While, the worldis still constrained by the effects of climate change of whichits impacts in developing countries are high due to pooradaptive capacity, less urban climate research is being con-ducted there. The use of best urban planning practices thatincorporate the knowledge of urban climate is importantespecially in enhancing urban poor to cope with climatechange.
The aim of the present paper was to assess the humanbiometeorological conditions of Dar es Salaam by applyingthe relatively universal thermal index of PET. The objectivesformulated in order to achieve this aim include the use ofeasily available synoptic meteorological data sets to evalu-ate the human thermal background conditions of the city.Secondly, to apply the concept of frequency of occurrence inassessing the human thermal stress conditions as well indetermining the local micrometeorological conditions ofthe city basing on the same background condition. Theproblem of meteorological data availability in many tropicalcities in developing countries is known (Jauregui 1991),thus, the current study has to rely on information from onesynoptic meteorological station in order to provide impor-tant insight of tropical urban climate of a coastal city insouthern hemisphere. However, the present results are trea-ted as the first results of the ongoing study, and they providea focus on the future study of understanding the climaticimpacts of land cover changes on microclimate and human
Basic analysis of climate and urban bioclimate of Dar es Salaam, Tanzania 215
thermal bioclimatic conditions of a coastal town in lowlatitude, just south of equator.
3 Research methodology
3.1 Study area
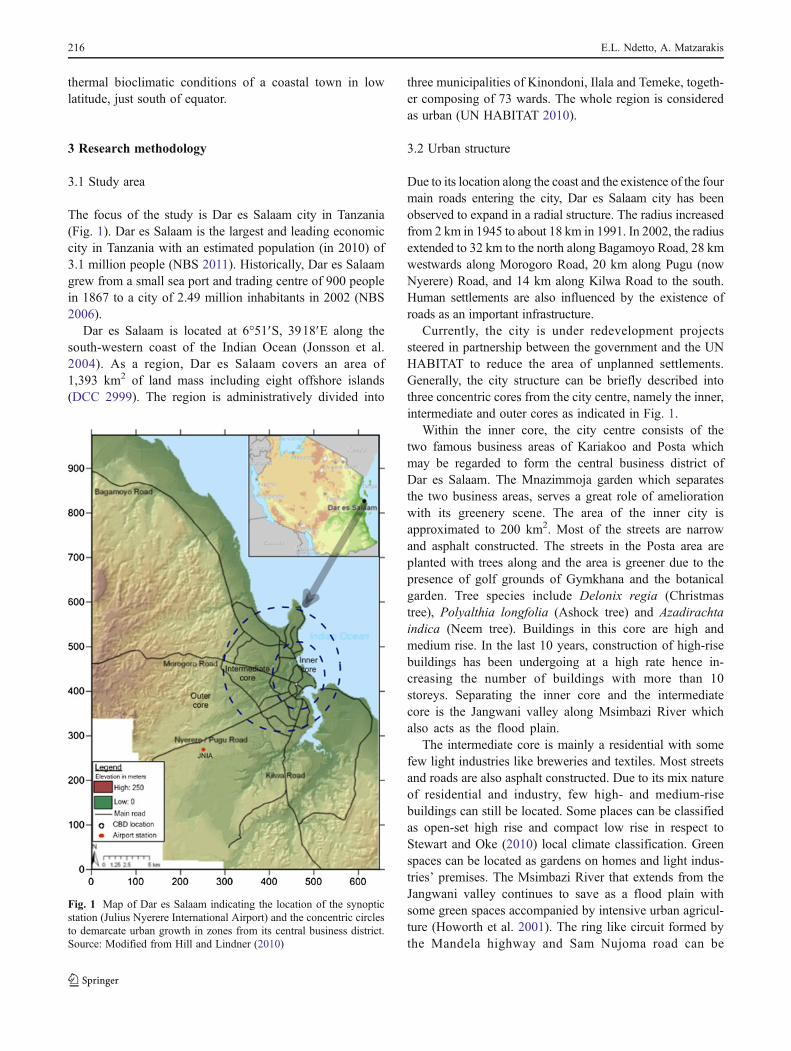
The focus of the study is Dar es Salaam city in Tanzania(Fig. 1). Dar es Salaam is the largest and leading economiccity in Tanzania with an estimated population (in 2010) of3.1 million people (NBS 2011). Historically, Dar es Salaamgrew from a small sea port and trading centre of 900 peoplein 1867 to a city of 2.49 million inhabitants in 2002 (NBS2006).
Dar es Salaam is located at 6°51′S, 3918′E along thesouth-western coast of the Indian Ocean (Jonsson et al.2004). As a region, Dar es Salaam covers an area of1,393 km2 of land mass including eight offshore islands(DCC 2999). The region is administratively divided into
three municipalities of Kinondoni, Ilala and Temeke, togeth-er composing of 73 wards. The whole region is consideredas urban (UN HABITAT 2010).
3.2 Urban structure
Due to its location along the coast and the existence of the fourmain roads entering the city, Dar es Salaam city has beenobserved to expand in a radial structure. The radius increasedfrom 2 km in 1945 to about 18 km in 1991. In 2002, the radiusextended to 32 km to the north along Bagamoyo Road, 28 kmwestwards along Morogoro Road, 20 km along Pugu (nowNyerere) Road, and 14 km along Kilwa Road to the south.Human settlements are also influenced by the existence ofroads as an important infrastructure.
Currently, the city is under redevelopment projectssteered in partnership between the government and the UNHABITAT to reduce the area of unplanned settlements.Generally, the city structure can be briefly described intothree concentric cores from the city centre, namely the inner,intermediate and outer cores as indicated in Fig. 1.
Within the inner core, the city centre consists of thetwo famous business areas of Kariakoo and Posta whichmay be regarded to form the central business district ofDar es Salaam. The Mnazimmoja garden which separatesthe two business areas, serves a great role of ameliorationwith its greenery scene. The area of the inner city isapproximated to 200 km2. Most of the streets are narrowand asphalt constructed. The streets in the Posta area areplanted with trees along and the area is greener due to thepresence of golf grounds of Gymkhana and the botanicalgarden. Tree species include Delonix regia (Christmastree), Polyalthia longfolia (Ashock tree) and Azadirachtaindica (Neem tree). Buildings in this core are high andmedium rise. In the last 10 years, construction of high-risebuildings has been undergoing at a high rate hence in-creasing the number of buildings with more than 10storeys. Separating the inner core and the intermediatecore is the Jangwani valley along Msimbazi River whichalso acts as the flood plain.
The intermediate core is mainly a residential with somefew light industries like breweries and textiles. Most streetsand roads are also asphalt constructed. Due to its mix natureof residential and industry, few high- and medium-risebuildings can still be located. Some places can be classifiedas open-set high rise and compact low rise in respect toStewart and Oke (2010) local climate classification. Greenspaces can be located as gardens on homes and light indus-tries’ premises. The Msimbazi River that extends from theJangwani valley continues to save as a flood plain withsome green spaces accompanied by intensive urban agricul-ture (Howorth et al. 2001). The ring like circuit formed bythe Mandela highway and Sam Nujoma road can be
Fig. 1 Map of Dar es Salaam indicating the location of the synopticstation (Julius Nyerere International Airport) and the concentric circlesto demarcate urban growth in zones from its central business district.Source: Modified from Hill and Lindner (2010)
216 E.L. Ndetto, A. Matzarakis
considered as a virtual boundary, separating the intermediatecore from the outer core.
In the outer core especially southwards in Kigamboni andTemeke, there is more palm trees and other plantations espe-cially in the sub-urban areas. More green and water spaces canbe realised due to the presence of the Pande forest reserve tothe northwest and the Kizinga and Mzinga valleys to thesouth. Though Pande is a small forest reserve, it serves asignificant portion of green space in the study area. Mainlylow rise buildings and industries including the Julius Nyerere(formerly Dar es Salaam) International Airport are within thiszone. A range of climate classes according to Stewart and Oke(2010) classification can be located. These include open-setmid-rise, extensive low-rise, high-energy industrial andsparsely built. However, a full classification of climate zonesin an urban area can best be achieved with the help of moreinformation like sky view factor, building surface fraction,mean building height, anthropogenic heat flux and naturalsurface fraction.
4 Climatic conditions over Dar es Salaam
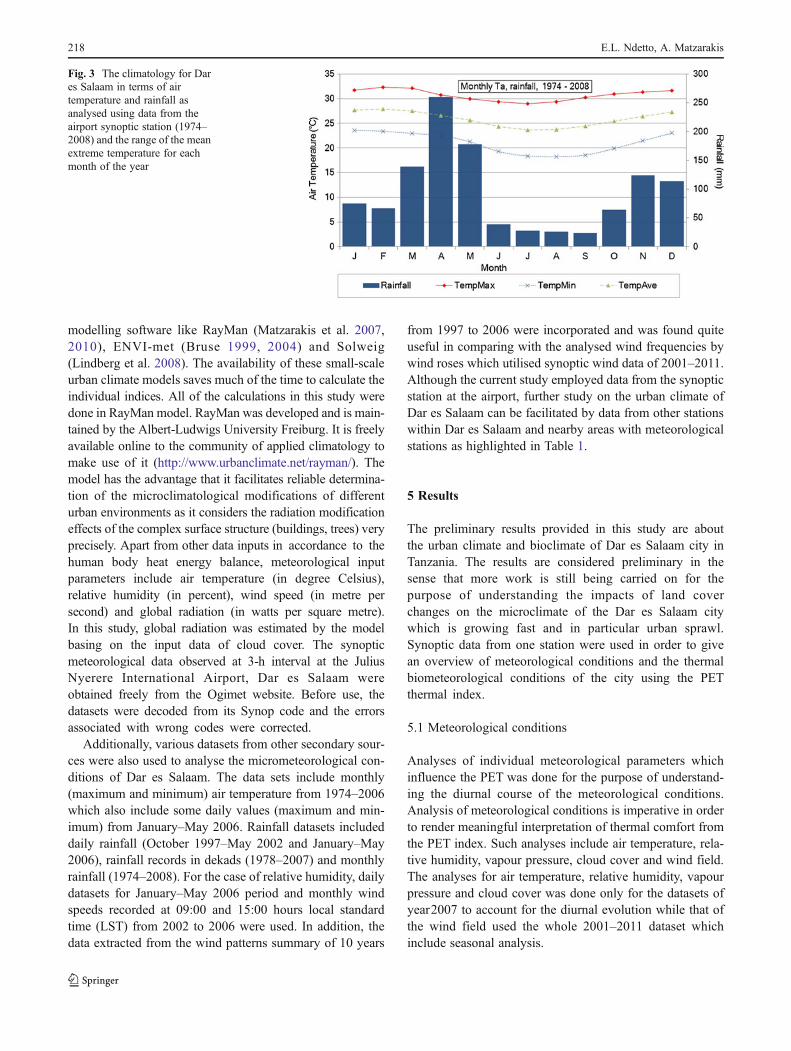
In general, Dar es Salaam is lowland with a typically hot–humid climate. The climate of the area is greatly influencedby the northeast monsoon which prevails from the monthsof March to October and the southeast monsoon betweenOctober and March (Jonsson et al. 2004). This is in responseto the passage of the Inter-tropical convergence zone. Indescribing the climatology of Dar es Salaam, together withexisting literature, monthly meteorological datasets from thesynoptic station at the Dar es Salaam airport for the period1974–2008 were also used for this purpose.
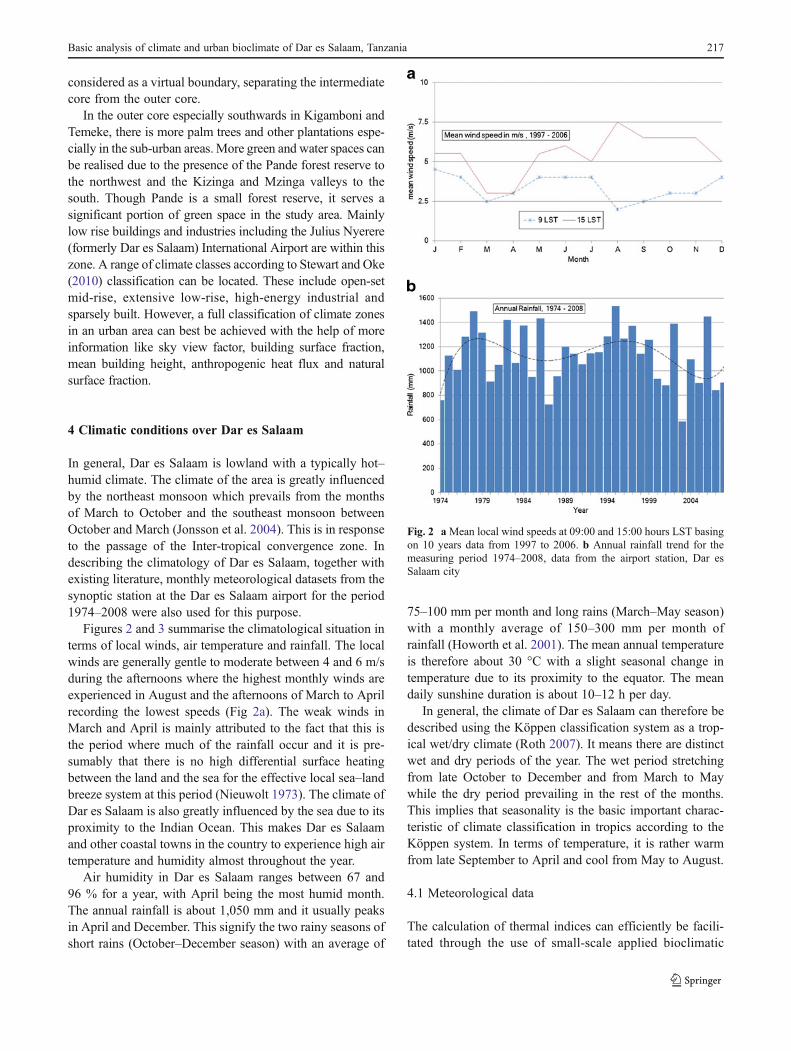
Figures 2 and 3 summarise the climatological situation interms of local winds, air temperature and rainfall. The localwinds are generally gentle to moderate between 4 and 6 m/sduring the afternoons where the highest monthly winds areexperienced in August and the afternoons of March to Aprilrecording the lowest speeds (Fig 2a). The weak winds inMarch and April is mainly attributed to the fact that this isthe period where much of the rainfall occur and it is pre-sumably that there is no high differential surface heatingbetween the land and the sea for the effective local sea–landbreeze system at this period (Nieuwolt 1973). The climate ofDar es Salaam is also greatly influenced by the sea due to itsproximity to the Indian Ocean. This makes Dar es Salaamand other coastal towns in the country to experience high airtemperature and humidity almost throughout the year.
Air humidity in Dar es Salaam ranges between 67 and96 % for a year, with April being the most humid month.The annual rainfall is about 1,050 mm and it usually peaksin April and December. This signify the two rainy seasons ofshort rains (October–December season) with an average of
75–100 mm per month and long rains (March–May season)with a monthly average of 150–300 mm per month ofrainfall (Howorth et al. 2001). The mean annual temperatureis therefore about 30 °C with a slight seasonal change intemperature due to its proximity to the equator. The meandaily sunshine duration is about 10–12 h per day.
In general, the climate of Dar es Salaam can therefore bedescribed using the Köppen classification system as a trop-ical wet/dry climate (Roth 2007). It means there are distinctwet and dry periods of the year. The wet period stretchingfrom late October to December and from March to Maywhile the dry period prevailing in the rest of the months.This implies that seasonality is the basic important charac-teristic of climate classification in tropics according to theKöppen system. In terms of temperature, it is rather warmfrom late September to April and cool from May to August.
4.1 Meteorological data
The calculation of thermal indices can efficiently be facili-tated through the use of small-scale applied bioclimatic
Fig. 2 aMean local wind speeds at 09:00 and 15:00 hours LST basingon 10 years data from 1997 to 2006. b Annual rainfall trend for themeasuring period 1974–2008, data from the airport station, Dar esSalaam city
Basic analysis of climate and urban bioclimate of Dar es Salaam, Tanzania 217
modelling software like RayMan (Matzarakis et al. 2007,2010), ENVI-met (Bruse 1999, 2004) and Solweig(Lindberg et al. 2008). The availability of these small-scaleurban climate models saves much of the time to calculate theindividual indices. All of the calculations in this study weredone in RayMan model. RayMan was developed and is main-tained by the Albert-Ludwigs University Freiburg. It is freelyavailable online to the community of applied climatology tomake use of it (http://www.urbanclimate.net/rayman/). Themodel has the advantage that it facilitates reliable determina-tion of the microclimatological modifications of differenturban environments as it considers the radiation modificationeffects of the complex surface structure (buildings, trees) veryprecisely. Apart from other data inputs in accordance to thehuman body heat energy balance, meteorological inputparameters include air temperature (in degree Celsius),relative humidity (in percent), wind speed (in metre persecond) and global radiation (in watts per square metre).In this study, global radiation was estimated by the modelbasing on the input data of cloud cover. The synopticmeteorological data observed at 3-h interval at the JuliusNyerere International Airport, Dar es Salaam wereobtained freely from the Ogimet website. Before use, thedatasets were decoded from its Synop code and the errorsassociated with wrong codes were corrected.
Additionally, various datasets from other secondary sour-ces were also used to analyse the micrometeorological con-ditions of Dar es Salaam. The data sets include monthly(maximum and minimum) air temperature from 1974–2006which also include some daily values (maximum and min-imum) from January–May 2006. Rainfall datasets includeddaily rainfall (October 1997–May 2002 and January–May2006), rainfall records in dekads (1978–2007) and monthlyrainfall (1974–2008). For the case of relative humidity, dailydatasets for January–May 2006 period and monthly windspeeds recorded at 09:00 and 15:00 hours local standardtime (LST) from 2002 to 2006 were used. In addition, thedata extracted from the wind patterns summary of 10 years
from 1997 to 2006 were incorporated and was found quiteuseful in comparing with the analysed wind frequencies bywind roses which utilised synoptic wind data of 2001–2011.Although the current study employed data from the synopticstation at the airport, further study on the urban climate ofDar es Salaam can be facilitated by data from other stationswithin Dar es Salaam and nearby areas with meteorologicalstations as highlighted in Table 1.
5 Results
The preliminary results provided in this study are aboutthe urban climate and bioclimate of Dar es Salaam city inTanzania. The results are considered preliminary in thesense that more work is still being carried on for thepurpose of understanding the impacts of land coverchanges on the microclimate of the Dar es Salaam citywhich is growing fast and in particular urban sprawl.Synoptic data from one station were used in order to givean overview of meteorological conditions and the thermalbiometeorological conditions of the city using the PETthermal index.
5.1 Meteorological conditions
Analyses of individual meteorological parameters whichinfluence the PET was done for the purpose of understand-ing the diurnal course of the meteorological conditions.Analysis of meteorological conditions is imperative in orderto render meaningful interpretation of thermal comfort fromthe PET index. Such analyses include air temperature, rela-tive humidity, vapour pressure, cloud cover and wind field.The analyses for air temperature, relative humidity, vapourpressure and cloud cover was done only for the datasets ofyear2007 to account for the diurnal evolution while that ofthe wind field used the whole 2001–2011 dataset whichinclude seasonal analysis.
Fig. 3 The climatology for Dares Salaam in terms of airtemperature and rainfall asanalysed using data from theairport synoptic station (1974–2008) and the range of the meanextreme temperature for eachmonth of the year
218 E.L. Ndetto, A. Matzarakis
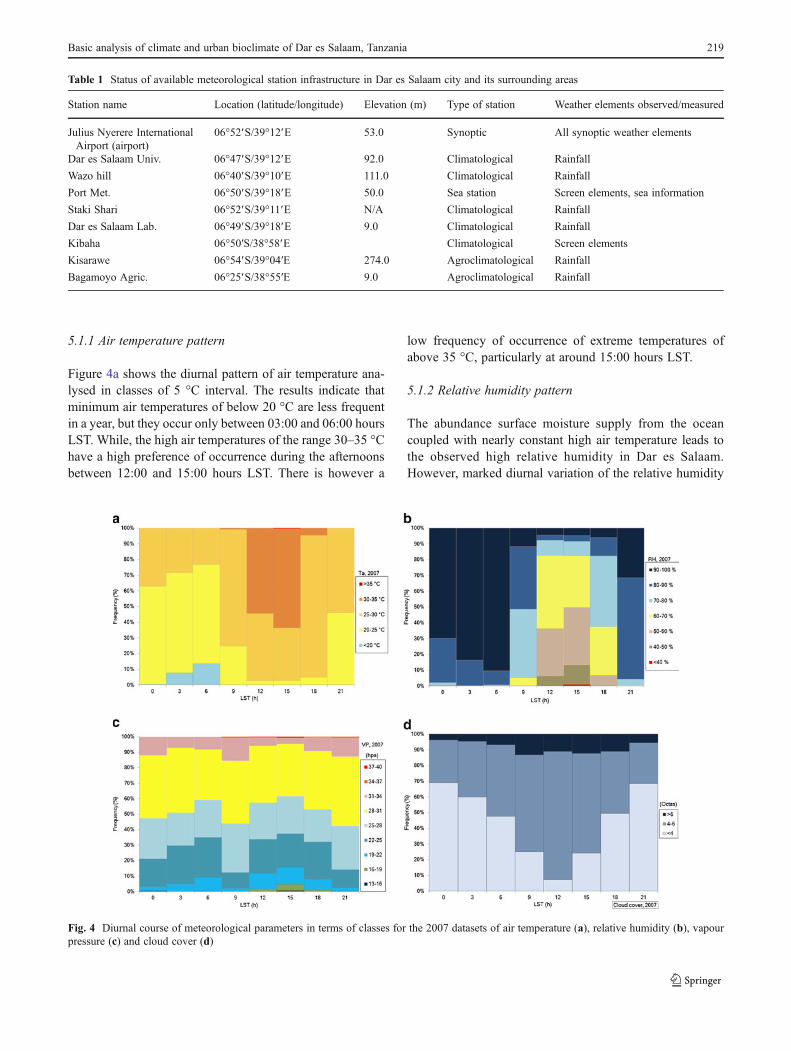
5.1.1 Air temperature pattern
Figure 4a shows the diurnal pattern of air temperature ana-lysed in classes of 5 °C interval. The results indicate thatminimum air temperatures of below 20 °C are less frequentin a year, but they occur only between 03:00 and 06:00 hoursLST. While, the high air temperatures of the range 30–35 °Chave a high preference of occurrence during the afternoonsbetween 12:00 and 15:00 hours LST. There is however a
low frequency of occurrence of extreme temperatures ofabove 35 °C, particularly at around 15:00 hours LST.
5.1.2 Relative humidity pattern
The abundance surface moisture supply from the oceancoupled with nearly constant high air temperature leads tothe observed high relative humidity in Dar es Salaam.However, marked diurnal variation of the relative humidity
Table 1 Status of available meteorological station infrastructure in Dar es Salaam city and its surrounding areas
Station name Location (latitude/longitude) Elevation (m) Type of station Weather elements observed/measured
Julius Nyerere InternationalAirport (airport)
06°52′S/39°12′E 53.0 Synoptic All synoptic weather elements
Dar es Salaam Univ. 06°47′S/39°12′E 92.0 Climatological Rainfall
Wazo hill 06°40′S/39°10′E 111.0 Climatological Rainfall
Port Met. 06°50′S/39°18′E 50.0 Sea station Screen elements, sea information
Staki Shari 06°52′S/39°11′E N/A Climatological Rainfall
Dar es Salaam Lab. 06°49′S/39°18′E 9.0 Climatological Rainfall
Kibaha 06°50′S/38°58′E Climatological Screen elements
Kisarawe 06°54′S/39°04′E 274.0 Agroclimatological Rainfall
Bagamoyo Agric. 06°25′S/38°55′E 9.0 Agroclimatological Rainfall
Fig. 4 Diurnal course of meteorological parameters in terms of classes for the 2007 datasets of air temperature (a), relative humidity (b), vapourpressure (c) and cloud cover (d)
Basic analysis of climate and urban bioclimate of Dar es Salaam, Tanzania 219

can still be observed as illustrated by classes of 10 % inter-val of relative humidity in Fig. 4b. It should also be notedthat normally the diurnal cycle of relative humidity fluctu-ates between maximum near the dawn and a minimumaround early afternoon. Now, in Dar es Salaam, the resultsindicate that frequency of moisture stress of RH below 40 %is very low and can mostly occur at around 15:00 hoursLST. However, the minimum relative humidity was ob-served to be mostly contained within the classes of 50–60and 60–70 % in the afternoon periods. On the other hand, anoticeable very high frequency of occurrence of RH above90 % was observed from 21:00 hours LST with a peak justbefore sunrise at 06:00 hours LST. Meaning, the maximumrelative humidity in Dar es Salaam is almost always above80 % throughout the year. The overall observed relativehumidity pattern seems to clearly signify the thermal effecton relative humidity.
5.1.3 Vapour pressure pattern
Relative humidity is usually referred to as a sensitive functionof temperature while vapour pressure is a direct measure ofmoisture content, albeit both indicate the presence of moisturein the atmosphere. Vapour pressure can hold less water vapourat the low temperatures than at high temperatures. The vapourpressure pattern in terms of the frequency of occurrence wasanalysed in classes of 3 hPa interval as shown in Fig. 4c. Thepattern clearly indicates that on daily basis, the extreme va-pour pressure of between 37 and 40 hPa occurs rarely between12:00 and 15:00 hours LST with only 0.1 % of occurrencewhile the lowest vapour pressure between 13 and 16 hPa canoccur only during the afternoon at 15:00 hours LST also at0.1 % of occurrence. The pattern indicates further thatthroughout the day, the vapour pressure in Dar es Salaam isfrequently within the three classes of vapour pressure group-ing of 22–25, 25–28 and 28–31 hPa, though the 28–31 hPaclass is relatively the most dominant with nearly more than30 % of occurrence throughout the day. Probably, the patternalso suggested a slight change on the daily course of vapourpressure pattern at 09:00 hours LST where a 0.1 % of occur-rence for the 34–37 hPa class reappears. The changes couldalso be interpreted that there is increasing of convection justafter 09:00 hours LST with its maximum at 15:00 hours LSTwhere the full range of vapour pressure classes are alsorealised.
5.1.4 Cloud cover pattern
The cloud cover pattern was classified into three classes ofless than four octas, four to six octas and above six octas,simply defined as clear, partly cloudy and cloudy conditionsrespectively. It is important to note here that the aboveclassification of cloudiness is employed to assist in the
analysis and interpretation of the present results only. Itshould not be regarded as a standard classification. Otherstudies have also used the idea of classifying cloudiness inorder to ease the analysis and interpretation of cloudiness(Emmanuel and Johansson 2006). For this case, using the2007 dataset, Dar es Salaam is generally observed to attain amaximum frequency of cloudiness occurrence around thenoon time and decreases as one approaches the midnight(Fig. 4d). This pattern displays a true characteristic of thetropical location near the equator.
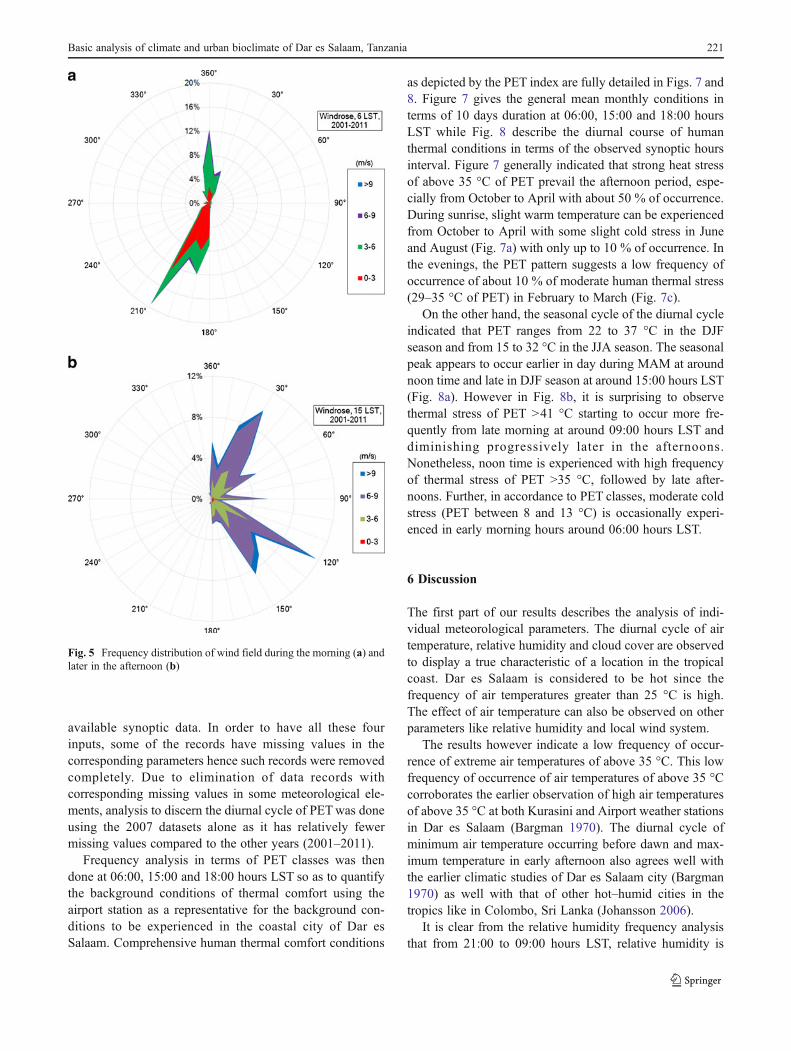
5.1.5 Wind pattern
The frequency distribution of the wind was done in order tounderstand the prevailing wind conditions in Dar es Salaam.The 11-year datasets from 2001 to 2011, collected at theairport station, were used. As the temporal analysis, theresults show that wind is northerly and partly south-westerly during the morning hours (around 06:00 hoursLST). The wind distribution was later observed to shift tomore of north-easterly and south-easterly during the after-noon (Fig. 5).
A further seasonal analysis of wind distribution was donein the respective individual four seasons of the year (Fig. 6).In this case, it is noted that wind is more northerly to north-easterly in the DJF season and shifting to southerly andsouth-easterly in the MAM season. During the cool seasonof JJA, winds are still mainly southerly and south easterlychanging to easterly in the SON season.
5.2 Bioclimatic conditions (thermal comfort)
Calculations of bioclimatic indices of PET were done in theRayMan software in order to give a situation of humanbioclimatic condition in the context of human thermal com-fort (Matzarakis et al. 2007, 2010). Then, the human bio-meteorological evaluation was done on the basis of thefrequency of occurrence of thermal stress in terms of PETclasses. The PET classes are fully described in Table 2.
5.2.1 PET pattern
For the purpose of better understanding, the human thermalbiometeorological condition of Dar es Salaam, the PETindex was used which requires air temperature, air humidity,wind speed and radiation fluxes as its meteorological inputparameters. It is especially important for the human biocli-mate assessment in such a coastal tropical city to consider auniversal thermal index like PET, whereby previous assess-ment have relied on air temperature and relative humiditythermal indices. The calculation of PET values had howeverto use the radiation flux estimated from cloud cover data dueto unavailable record of former meteorological data in the
220 E.L. Ndetto, A. Matzarakis
available synoptic data. In order to have all these fourinputs, some of the records have missing values in thecorresponding parameters hence such records were removedcompletely. Due to elimination of data records withcorresponding missing values in some meteorological ele-ments, analysis to discern the diurnal cycle of PETwas doneusing the 2007 datasets alone as it has relatively fewermissing values compared to the other years (2001–2011).
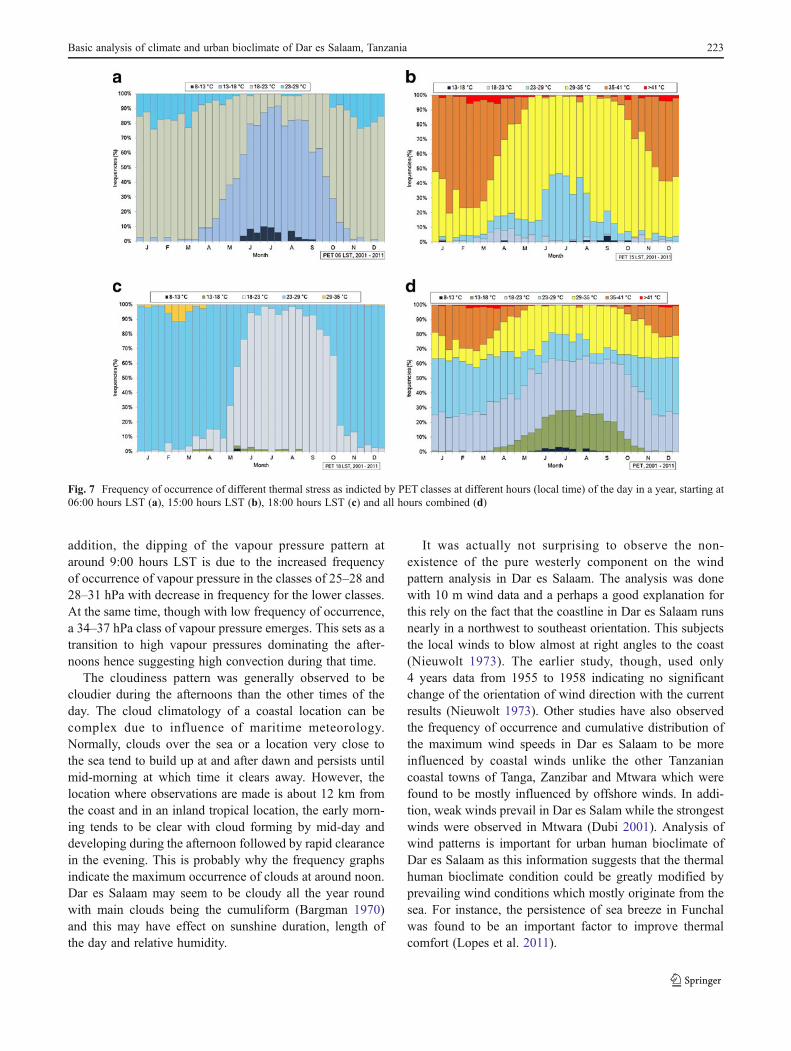
Frequency analysis in terms of PET classes was thendone at 06:00, 15:00 and 18:00 hours LST so as to quantifythe background conditions of thermal comfort using theairport station as a representative for the background con-ditions to be experienced in the coastal city of Dar esSalaam. Comprehensive human thermal comfort conditions
as depicted by the PET index are fully detailed in Figs. 7 and8. Figure 7 gives the general mean monthly conditions interms of 10 days duration at 06:00, 15:00 and 18:00 hoursLST while Fig. 8 describe the diurnal course of humanthermal conditions in terms of the observed synoptic hoursinterval. Figure 7 generally indicated that strong heat stressof above 35 °C of PET prevail the afternoon period, espe-cially from October to April with about 50 % of occurrence.During sunrise, slight warm temperature can be experiencedfrom October to April with some slight cold stress in Juneand August (Fig. 7a) with only up to 10 % of occurrence. Inthe evenings, the PET pattern suggests a low frequency ofoccurrence of about 10 % of moderate human thermal stress(29–35 °C of PET) in February to March (Fig. 7c).
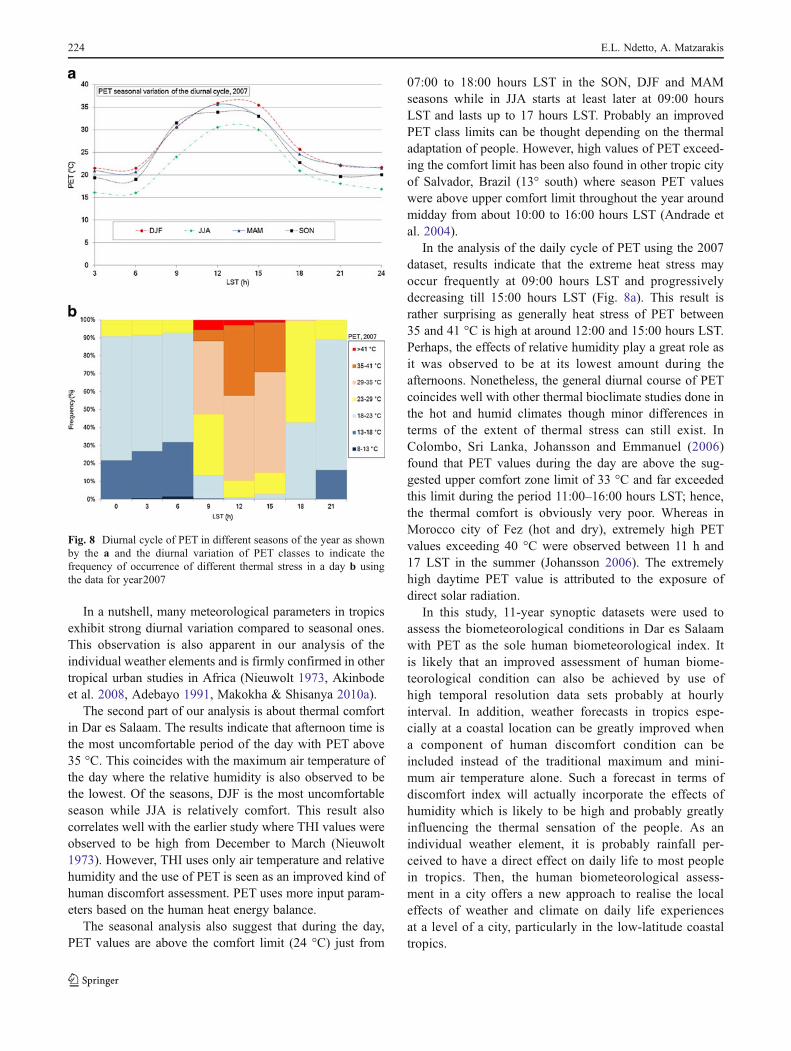
On the other hand, the seasonal cycle of the diurnal cycleindicated that PET ranges from 22 to 37 °C in the DJFseason and from 15 to 32 °C in the JJA season. The seasonalpeak appears to occur earlier in day during MAM at aroundnoon time and late in DJF season at around 15:00 hours LST(Fig. 8a). However in Fig. 8b, it is surprising to observethermal stress of PET >41 °C starting to occur more fre-quently from late morning at around 09:00 hours LST anddiminishing progressively later in the afternoons.Nonetheless, noon time is experienced with high frequencyof thermal stress of PET >35 °C, followed by late after-noons. Further, in accordance to PET classes, moderate coldstress (PET between 8 and 13 °C) is occasionally experi-enced in early morning hours around 06:00 hours LST.
6 Discussion
The first part of our results describes the analysis of indi-vidual meteorological parameters. The diurnal cycle of airtemperature, relative humidity and cloud cover are observedto display a true characteristic of a location in the tropicalcoast. Dar es Salaam is considered to be hot since thefrequency of air temperatures greater than 25 °C is high.The effect of air temperature can also be observed on otherparameters like relative humidity and local wind system.
The results however indicate a low frequency of occur-rence of extreme air temperatures of above 35 °C. This lowfrequency of occurrence of air temperatures of above 35 °Ccorroborates the earlier observation of high air temperaturesof above 35 °C at both Kurasini and Airport weather stationsin Dar es Salaam (Bargman 1970). The diurnal cycle ofminimum air temperature occurring before dawn and max-imum temperature in early afternoon also agrees well withthe earlier climatic studies of Dar es Salaam city (Bargman1970) as well with that of other hot–humid cities in thetropics like in Colombo, Sri Lanka (Johansson 2006).
It is clear from the relative humidity frequency analysisthat from 21:00 to 09:00 hours LST, relative humidity is
Fig. 5 Frequency distribution of wind field during the morning (a) andlater in the afternoon (b)
Basic analysis of climate and urban bioclimate of Dar es Salaam, Tanzania 221

above 60 %. Earlier studies also reported Dar es Salaam tobe a humid all year round (Bargman 1970; Jonsson et al.2006). The time of moisture stress of less that 40 % of RH inour results, also corresponds well with the reported
occurrence of minimum relative humidities at Kurasini andAirport station at 15:00 hours LST which is also the time ofmaximum air temperature occurrence (Bargman 1970).
The amount of moisture present in the air can be afunction of the moisture content, cloudiness, air tempera-ture, wind and vegetation. But, generally, tropical cities areobserved to be very humid (Adebayo 1991). Dar es Salaamis very humid since it is close to the sea. Normally, on-shorewinds act as moisture supply while the off-shore winds drivemoisture towards the sea. The wind analysis indicates thatday time is dominated by sea breezes. However, in theanalysis, it is clear that minimum humidities occur at thetime of maximum temperature, usually during the earlyafternoon and maximum humidity occurring around thedawn as temperatures also tend to be low. This pattern isalso revealed in other studies done in tropic cities. Adebayo(1991) found the annual mean of relative humidity forIbadan, Nigeria (200 km north of Atlantic Ocean) rangedbetween 79 and 83 % at 09:00 hours LST and between 57and 74 % at 15:00 hours LST, with a less seasonal trend. In
Fig. 6 Frequency distribution of wind field in different seasons of the year, DJF (a), MAM (b), JJA (c) and SON (d)
Table 2 Full description of the PET class with their correspondingthermal perception. For more detailed description, see Matzarakis et al.(1999)
PET class Thermal perception Physiological stress
<4 Very cold Extreme cold stress
4–8 Cold Strong cold stress
8–13 Cool Moderate cold stress
13–18 Slightly cool Slight cold stress
18–23 Comfortable No thermal stress
23–29 Slightly warm Slight heat stress
29–35 Warm Moderate heat stress
35–41 Hot Strong heat stress
>41 Very hot Extreme heat stress
222 E.L. Ndetto, A. Matzarakis
addition, the dipping of the vapour pressure pattern ataround 9:00 hours LST is due to the increased frequencyof occurrence of vapour pressure in the classes of 25–28 and28–31 hPa with decrease in frequency for the lower classes.At the same time, though with low frequency of occurrence,a 34–37 hPa class of vapour pressure emerges. This sets as atransition to high vapour pressures dominating the after-noons hence suggesting high convection during that time.
The cloudiness pattern was generally observed to becloudier during the afternoons than the other times of theday. The cloud climatology of a coastal location can becomplex due to influence of maritime meteorology.Normally, clouds over the sea or a location very close tothe sea tend to build up at and after dawn and persists untilmid-morning at which time it clears away. However, thelocation where observations are made is about 12 km fromthe coast and in an inland tropical location, the early morn-ing tends to be clear with cloud forming by mid-day anddeveloping during the afternoon followed by rapid clearancein the evening. This is probably why the frequency graphsindicate the maximum occurrence of clouds at around noon.Dar es Salaam may seem to be cloudy all the year roundwith main clouds being the cumuliform (Bargman 1970)and this may have effect on sunshine duration, length ofthe day and relative humidity.
It was actually not surprising to observe the non-existence of the pure westerly component on the windpattern analysis in Dar es Salaam. The analysis was donewith 10 m wind data and a perhaps a good explanation forthis rely on the fact that the coastline in Dar es Salaam runsnearly in a northwest to southeast orientation. This subjectsthe local winds to blow almost at right angles to the coast(Nieuwolt 1973). The earlier study, though, used only4 years data from 1955 to 1958 indicating no significantchange of the orientation of wind direction with the currentresults (Nieuwolt 1973). Other studies have also observedthe frequency of occurrence and cumulative distribution ofthe maximum wind speeds in Dar es Salaam to be moreinfluenced by coastal winds unlike the other Tanzaniancoastal towns of Tanga, Zanzibar and Mtwara which werefound to be mostly influenced by offshore winds. In addi-tion, weak winds prevail in Dar es Salam while the strongestwinds were observed in Mtwara (Dubi 2001). Analysis ofwind patterns is important for urban human bioclimate ofDar es Salaam as this information suggests that the thermalhuman bioclimate condition could be greatly modified byprevailing wind conditions which mostly originate from thesea. For instance, the persistence of sea breeze in Funchalwas found to be an important factor to improve thermalcomfort (Lopes et al. 2011).
Fig. 7 Frequency of occurrence of different thermal stress as indicted by PET classes at different hours (local time) of the day in a year, starting at06:00 hours LST (a), 15:00 hours LST (b), 18:00 hours LST (c) and all hours combined (d)
Basic analysis of climate and urban bioclimate of Dar es Salaam, Tanzania 223
In a nutshell, many meteorological parameters in tropicsexhibit strong diurnal variation compared to seasonal ones.This observation is also apparent in our analysis of theindividual weather elements and is firmly confirmed in othertropical urban studies in Africa (Nieuwolt 1973, Akinbodeet al. 2008, Adebayo 1991, Makokha & Shisanya 2010a).
The second part of our analysis is about thermal comfortin Dar es Salaam. The results indicate that afternoon time isthe most uncomfortable period of the day with PET above35 °C. This coincides with the maximum air temperature ofthe day where the relative humidity is also observed to bethe lowest. Of the seasons, DJF is the most uncomfortableseason while JJA is relatively comfort. This result alsocorrelates well with the earlier study where THI values wereobserved to be high from December to March (Nieuwolt1973). However, THI uses only air temperature and relativehumidity and the use of PET is seen as an improved kind ofhuman discomfort assessment. PET uses more input param-eters based on the human heat energy balance.
The seasonal analysis also suggest that during the day,PET values are above the comfort limit (24 °C) just from
07:00 to 18:00 hours LST in the SON, DJF and MAMseasons while in JJA starts at least later at 09:00 hoursLST and lasts up to 17 hours LST. Probably an improvedPET class limits can be thought depending on the thermaladaptation of people. However, high values of PET exceed-ing the comfort limit has been also found in other tropic cityof Salvador, Brazil (13° south) where season PET valueswere above upper comfort limit throughout the year aroundmidday from about 10:00 to 16:00 hours LST (Andrade etal. 2004).
In the analysis of the daily cycle of PET using the 2007dataset, results indicate that the extreme heat stress mayoccur frequently at 09:00 hours LST and progressivelydecreasing till 15:00 hours LST (Fig. 8a). This result israther surprising as generally heat stress of PET between35 and 41 °C is high at around 12:00 and 15:00 hours LST.Perhaps, the effects of relative humidity play a great role asit was observed to be at its lowest amount during theafternoons. Nonetheless, the general diurnal course of PETcoincides well with other thermal bioclimate studies done inthe hot and humid climates though minor differences interms of the extent of thermal stress can still exist. InColombo, Sri Lanka, Johansson and Emmanuel (2006)found that PET values during the day are above the sug-gested upper comfort zone limit of 33 °C and far exceededthis limit during the period 11:00–16:00 hours LST; hence,the thermal comfort is obviously very poor. Whereas inMorocco city of Fez (hot and dry), extremely high PETvalues exceeding 40 °C were observed between 11 h and17 LST in the summer (Johansson 2006). The extremelyhigh daytime PET value is attributed to the exposure ofdirect solar radiation.
In this study, 11-year synoptic datasets were used toassess the biometeorological conditions in Dar es Salaamwith PET as the sole human biometeorological index. Itis likely that an improved assessment of human biome-teorological condition can also be achieved by use ofhigh temporal resolution data sets probably at hourlyinterval. In addition, weather forecasts in tropics espe-cially at a coastal location can be greatly improved whena component of human discomfort condition can beincluded instead of the traditional maximum and mini-mum air temperature alone. Such a forecast in terms ofdiscomfort index will actually incorporate the effects ofhumidity which is likely to be high and probably greatlyinfluencing the thermal sensation of the people. As anindividual weather element, it is probably rainfall per-ceived to have a direct effect on daily life to most peoplein tropics. Then, the human biometeorological assess-ment in a city offers a new approach to realise the localeffects of weather and climate on daily life experiencesat a level of a city, particularly in the low-latitude coastaltropics.
Fig. 8 Diurnal cycle of PET in different seasons of the year as shownby the a and the diurnal variation of PET classes to indicate thefrequency of occurrence of different thermal stress in a day b usingthe data for year2007
224 E.L. Ndetto, A. Matzarakis
7 Conclusion
The preliminary analysis of the human biometeorologicalassessment of Dar es Salaam, a coastal tropic city, highlightsthe importance of thermal bioclimate research in differentcities. The results indicate that afternoon hours are accom-panied with relatively more discomfort conditions for hu-man being; whereas the DJF season was observed to be themost uncomfortable season in a year. The JJA season wason the other hand observed to be a relative comfort season.Though, it can be observed that, people in the tropics havebeen acclimatised or adapted to warm temperatures, theassessment of discomfort is important since most discomfortindices involve other weather elements. In this study, PETwas used compared to the earlier human thermal index ofTHI which is limited to the input parameters. It can thereforebe considered that an improved human bioclimate assess-ment can be attained with universal thermal human indexlike PET which utilises all of the four meteorological ele-ments that affects human thermal condition. Despite ofusing indices that base on the human thermal energy bal-ance, comprehensive human bioclimate assessment can sig-nificantly be realised when combined with the use of high-resolution datasets preferably at hourly interval and longerperiod in order to reveal the climatology of the city in termsof thermal bioclimatic condition.
As the global population becomes urbanised and hu-man activity concentrated in urban areas, settlement plan-ning is a key aspect of sustainability especially in thefast growing cities in developing countries. Dar esSalaam being one of them, with its inclusion of environ-mental objectives in urban plans at all scales, providesalso an opportunity for the incorporation of urban cli-mate knowledge into the planning process on a routinebasis. Bioclimatic information could also give a clearpicture about the vulnerability of urban poor communityto local climate change hence improving the means ofsecuring adaptation strategies. Due to the observed highair humidity especially in the coastal cities in low lat-itudes, it then suggested and planned that further studyon the bioclimate assessment particularly in Dar esSalaam should probably involve the thermal indices es-pecially those strongly account for air humidity variablesand the modification of thermal sensation through windspeed as provided by sea breezes. Modification of ther-mal indices’ scales in line with the local adaption tothermal stress could also be taken into consideration.
Acknowledgments We thank the owners of the Ogimet website formaking the synoptic meteorological information freely available on theinternet. We also thank the Tanzanian Ministry of Education andVocational Training (MOEVT) and the Germany Academic ExchangeService (DAAD; support to ELN) for financial support during his stayin Freiburg, Germany.
References
Abebe FK (2011) Modelling informal settlement growth in Dar esSalaam Tanzania. Dissertation, University of Twente
Adebayo YR (1991) Day-time effects of urbanization on relativehumidity and vapour pressure in a tropical city. Theor ApplClimatol 43:17–30
Akinbode OM, Eludoyin AO, Fashae OA (2008) Temperature andrelative humidity distributions in a medium-size administrativetown in southwest Nigeria. J Env Managt 87:95–105
Andrade T, Nery J, Freire T, Katzschner L, Fortuna D (2004) Thermalcomfort conditions for a tropical city, Salvador–Brazil. The 21stConference on Passive and Low Energy Architecture. Eindhoven,The Netherlands. 19–22 September 2004
Arnfield AJ (2003) Two decades of urban climate research: a review ofturbulence, exchanges of energy and water, and the urban heatisland. Int J Climatol 23:1–26
Bargman DJ (1970) The climate of Dar es Salaam. Tanzania Notes andRecords 71:55–64
Barradas VL (1991) Air temperature and humidity and human comfortindex of some city parks ofMexico city. Int J Biometeorol 35:24–28
Blazejczyk K, Epstein Y, Jendritzky G, Staiger H, Tinz B (2012)Comparison of UTCI to selected thermal indices. Int JBiometeorol 56:515–535, Special issue (UTCI)
Bruse M (1999) The influences of local environmental design onmicroclimate, PhD Thesis, University of Bochum, Bochum,Germany (in German)
Bruse M. 2004. ENVI-met 3.0: Updated model overview. http://www.envi-met.com. Accessed 30 January 2012
Çalışkan O, Çiçek Çİ, Matzarakis A (2012) The climate and bioclimateof Bursa (Turkey) from the perspective of tourism. Theor ApplClimatol 107:417–425. doi:10.1007/s00704-011-0489-6
Chen L, Ng E (2011) Quantitative urban climate mapping based on ageographical database: a simulation approach using Hong Kongas a case study. Intl J Appl Eart Observ Geoinf 13:586–594
Citymayors statistics (2011) The world’s fastest growing cities andurban areas from 2006 to 2020. http://www.citymayors.com/statistics/urban_growth1.html. Accessed 30 October 2011
Cui X (2005) Interactions between climate and land cover changes onthe Tibetan Plateau. Thesis, Max-Planck-Institut für Meteorologie
DCC (2004) City profile for Dar Es Salaam, United Republic ofTanzania
Deb C, Ramachandraiah A (2010) The significance of physiologicalequivalent temperature (PET) in outdoor thermal comfort studies.Intl J Eng Sc Techno 2(7):2825–2828
Douglas I, Alam K, Maghenda M, Mcdonnell Y, Mclean L, Campbell J(2008) Unjust waters: climate change, flooding and the urbanpoor in Africa. Environ Urbaniz 20:187–205
Dubi, AM (2001) Frequency and long-term distribution of coastalwinds of Tanzania. In: Richmond M. D. and J. Francis (eds).Marine science development in Tanzania and Eastern Africa.Proceedings of the 20th Anniversary Conference on Advancesin Marine Science in Tanzania, 28 June–1 July 1999, Zanzibar,Tanzania. IMS/WIOMSA. p. 131–144
Eludoyin OM, Adelekan IO (2012) The physiologic climate of Nigeria.Int J Biometeorol. doi:10.1007/s00484-012-0549-3
Emmanuel R (2005) Thermal comfort implications of urbanization in awarm-humid city: the Colombo Metropolitan Region (CMR), SriLanka. Build Environ 40:1591–1601
Emmanuel R, Johansson E (2006) Influence of urban morphology andsea breeze on hot humid microclimate: the case of Colombo. SriLanka Clim Res 30:189–200
Emmanuel R, Rosenlund H, Johansson E (2007) Urban shading—adesign option for the tropics? A study in Colombo, Sri Lanka. IntJ Climatol 27:1995–2004
Basic analysis of climate and urban bioclimate of Dar es Salaam, Tanzania 225

Fanger PO (1972) Thermal comfort. Mc Graw Hill, New YorkFarajzadeh H, Matzarakis A (2012) Evaluation of thermal comfort
conditions in Ourmieh Lake, Iran. Theor Appl Climatol107:451–459. doi:10.1007/s00704-011-0492-y
Gulyás Á, Matzarakis A (2009) Seasonal and spatial distribution ofphysiologically equivalent temperature (PET) index in Hungary.Quart J Hungarian Met Serv 113(3):221–231
Hill A, Lindner C (2010) Modelling informal urban growth under rapidurbanisation: A CA-based land-use simulation model for the cityof Dar es Salaam, Tanzania. Thesis, TU Dortmund University
Höppe PR (1999) The physiological equivalent temperature—a uni-versal index for the biometeorological assessment of the thermalenvironment. Int J Biometeorol 43:71–75
Howorth C, Covery I, O’keefe P (2001) Gardening to reduce hazard:urban agriculture in Tanzania. Land Degrad Develop 12:285–291
Jansson C (2006) Urban Microclimate and Surface HydrometeorologicalProcesses. Thesis, KTH Stockholm
Jauregui E (1991) The human climate of tropical cities: an overview.Int J Biometeorol 35(151):160
Jauregui E (2005) Possible impacts of urbanization on the thermalclimate of some large cities in Mexico. Atmosfera 18(4):247–248
Jendritzky G, De Dear R, Havenith G (2012) UTCI—why anotherthermal index? Int J Biometeorol 56(3):421–428. doi:10.1007/s00484-011-0513-7
Johansson E (2006) Influence of urban geometry on outdoor thermalcomfort in a hot dry climate: a study in Fez, Morocco. Buildingand Environ 41:1326–1338
Johansson E, Emmanuel R (2006) The influence of urban design onoutdoor thermal comfort in the hot, humid city of Colombo, SriLanka. Int J Biometeorol 51:119–133. doi:10.1007/s00484-006-0047-6
Jonsson P, Bennet C, Eliasson I, Lindgren ES (2004) Suspendedparticulate matter and its relations to the urban climate in Dar esSalaam. Tanz Atmos Environ 38:4175–4181
Jonsson P, Eliasson I, Holmer B, Grimmond CBS (2006) Longwaveincoming radiation in the tropics: results from field work in threeAfrican cities. Theor Appl Climatol 85:185–201
Lin TP (2009) Thermal perception, adaptation and attendance in apublic square in hot and humid regions. Building Environ44:2017–2026
Lin TP, Matzarakis A (2008) Tourism climate and thermal comfort insun moon lake, Taiwan. Int J Biometeorol 52:281–290
Lin TP, Matzarakis A, Hwang RL (2010) Shading effect on long-termoutdoor thermal comfort. Build Environ 45:213–221
Lindberg F, Holmer B, Thorsson S (2008) SOLWEIG 1.0—modellingspatial variations of 3D radiant fluxes and mean radiant temper-ature in complex urban settings. Int J Biometeorol 52:697–713.doi:10.1007/s00484-008-0162-7
Lopes A, Lopes S, Matzarakis A, Alcoforado MJ (2011) The influenceof the summer sea breeze on thermal comfort in Funchal(Madeira). A contribution to tourism and urban planning.Meteor Zeitsch 20(5):553–564
Makokha GL (1998) Variations of the effective temperature index (ET)in Kenya. Geo Journal 44(4):337–343
Makokha GL, Shisanya CA (2010a) Temperature cooling and warmingrates in three different built environments within Nairobi city,Kenya. Advances Met. doi:10.1155/2010/686214
Makokha GL, Shisanya CA (2010b) Trends in mean annual minimumand maximum near surface temperature in Nairobi city, Kenya.Advances Met. doi:10.1155/2010/676041
Matzarakis A, Rutz F, Mayer H (2010) Modeling radiation fluxes insimple and complex environments: basics of the RayMan model.Int J Biometeorol 54:131–139
Matzarakis A, Rutz F, Mayer H (2007) Modeling radiation fluxes insimple and complex environments—application of the RayManmodel. Int J Biometeorol 51:323–334
Matzarakis A, Mayer H, Iziomon MG (1999) Applications of a uni-versal thermal index: physiological equivalent temperature. Int JBiometeorol 43:76–84
Mayer H, Höppe PR (1987) Thermal comfort of man in different urbanenvironments. Theor Appl Climatol 38:43–49
NBS (2006) Analytical report. http://nbs.go.tz/pdf/2002popcensus.pdf.Accessed 30 December 2011
NBS (2011) Tanzania in Figures 2010. National Bureau of Statistics,Dar es Salaam. www.nbs.go.tz. Accessed 30 December 2011
Nieuwolt S (1973) Breezes along the Tanzanian coast. Arch MetGeoph Biokl Ser B 21:189–206
Omonijo AG, Matzarakis A, Oguntoke O, Adeofun CO (2011) Effectsof thermal environment on the temporal, spatial and seasonaloccurrence of measles in Ondo state, Nigeria. Int J Biometeorol.doi:10.1007/s00484-011-0492-8
Orosa JA (2009) Research on general thermal comfort models. Eur JSc Res 27(2):217–227
Owen TW, Carlson TN, Gillies RR (1998) An assessment of satelliteremotely-sensed land cover parameters in quantitatively describ-ing the climatic effect of urbanization. Intl J Rem Sens 19(9):1663–1681. doi:10.1080/014311698215171
Pauchard A, Aguayo M, Peña E, Urrutia R (2006) Multiple effects ofurbanization on the biodiversity of developing countries: the caseof a fast-growing metropolitan area (Concepción, Chile). BiolConserv 127:272–281
Roth M (2007) Review of urban climate research in (sub)tropicalregions. Int J Climatol 27:1859–1873
Seto KC, Fragkias M, Güneralp B, Reilly MK (2011) A meta-analysisof global urban land expansion. PLoS One 6(8):e23777.doi:10.1371/journal.pone.0023777
Staiger H, Laschewski G, Grätz A (2012) The perceived temperature—a versatile index for the assessment of the human thermal envi-ronment. Part A: scientific basics. Int J Biometeorol 56:165–176.doi:10.1007/s00484-011-0409-6
Stewart ID, Oke TR (2010) Thermal differentiation of local climatezones using temperature observations from urban and rural fieldsites. In: Preprints, 9th Symposium, on Urban Environment,August 2–6, Keystone, CO
Trusilova K (2006) Urbanization impacts on the climate in Europe.Thesis, Max-Planck-Institut für Meteorologie
UN-HABITAT (2008) State of the world’s cities 2008/2009.Harmonious cities. London: Sterling, VA: Earthscan
UN-HABITAT (2010) Citywide action plan for upgrading unplannedand unserviced settlements in Dar es Salaam. Nairobi: UN-HABITAT. http://www.unhabitat.org/. Accessed 26 January2012
Zaninovic K, Matzarakis A (2009) The biometeorological leaflet as ameans conveying climatological information to tourists and thetourism industry. Int J Biometeorol 53:369–374
226 E.L. Ndetto, A. Matzarakis