BASF Capital Market Story - BASF USA - Home Capital Market Story January 22015 150 years Cautionary...
61
BASF Capital Market Story January 2015 1 150 years We add value as one company Martin Brudermueller Vice Chairman of BASF SE Hong Kong January 2015 150 years
Transcript of BASF Capital Market Story - BASF USA - Home Capital Market Story January 22015 150 years Cautionary...
BASF Capital Market Story January 2015 1
150 years We add value as one company
Martin Brudermueller Vice Chairman of BASF SE Hong Kong January 2015
150 years
BASF Capital Market Story January 2015 2
150 years
Cautionary note regarding forward-looking statements
This presentation may contain forward-looking statements that are subject to risks and uncertainties, including those pertaining to the anticipated benefits to be realized from the proposals described herein. Forward-looking statements may include, in particular, statements about future events, future financial performance, plans, strategies, expectations, prospects, competitive environment, regulation and supply and demand. BASF has based these forward-looking statements on its views and assumptions with respect to future events and financial performance. Actual financial performance could differ materially from that projected in the forward-looking statements due to the inherent uncertainty of estimates, forecasts and projections, and financial performance may be better or worse than anticipated. Given these uncertainties, readers should not put undue reliance on any forward-looking statements. The information contained in this presentation is subject to change without notice and BASF does not undertake any duty to update the forward-looking statements, and the estimates and assumptions associated with them, except to the extent required by applicable laws and regulations.
BASF Capital Market Story January 2015 3
150 years
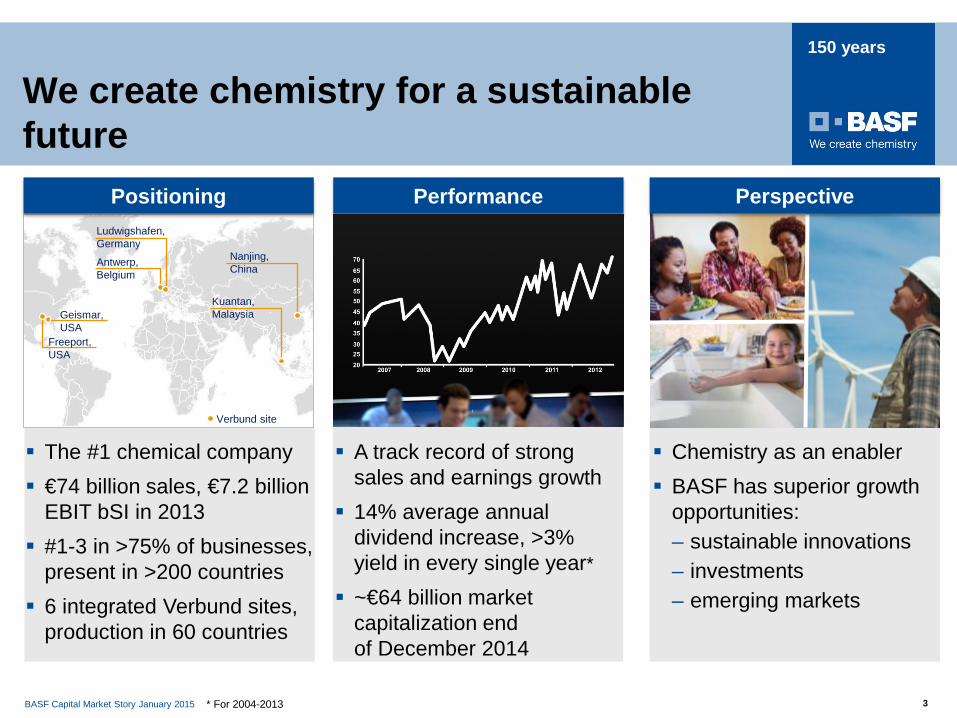
Chemistry as an enabler BASF has superior growth
opportunities: – sustainable innovations – investments – emerging markets
The #1 chemical company €74 billion sales, €7.2 billion
EBIT bSI in 2013 #1-3 in >75% of businesses,
present in >200 countries 6 integrated Verbund sites,
production in 60 countries
A track record of strong sales and earnings growth
14% average annual dividend increase, >3% yield in every single year*
~€64 billion market capitalization end of December 2014
Performance Perspective
* For 2004-2013
Ludwigshafen, Germany
Antwerp, Belgium
Nanjing, China
Kuantan, Malaysia Geismar,
USA Freeport, USA
Verbund site
Positioning
We create chemistry for a sustainable future
BASF Capital Market Story January 2015 4
150 years
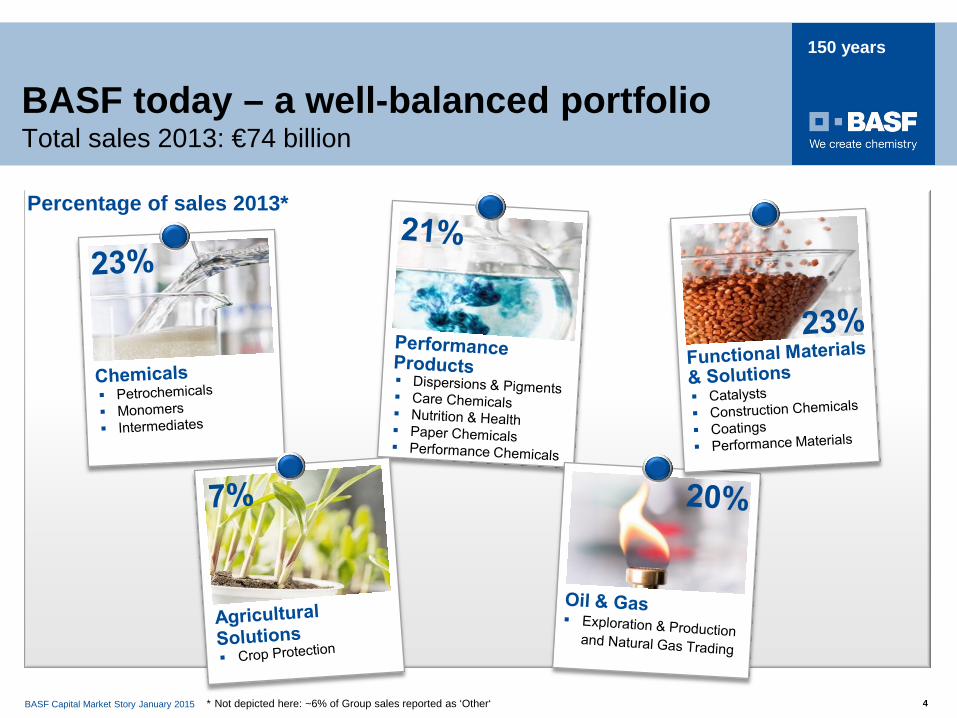
Percentage of sales 2013*
* Not depicted here: ~6% of Group sales reported as ‘Other‘
BASF today – a well-balanced portfolio Total sales 2013: €74 billion
BASF Capital Market Story January 2015 5
150 years
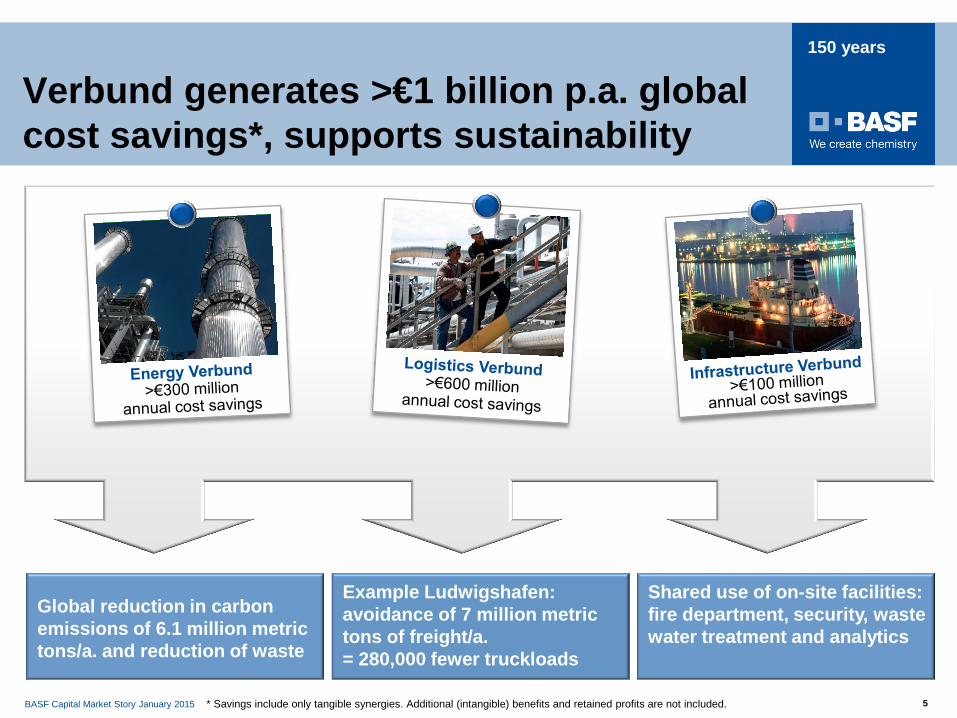
Global reduction in carbon emissions of 6.1 million metric tons/a. and reduction of waste
Example Ludwigshafen: avoidance of 7 million metric tons of freight/a. = 280,000 fewer truckloads
Shared use of on-site facilities: fire department, security, waste water treatment and analytics
Verbund generates >€1 billion p.a. global cost savings*, supports sustainability
* Savings include only tangible synergies. Additional (intangible) benefits and retained profits are not included.
BASF Capital Market Story January 2015 6
Business review
Growth Levers
BASF Capital Market Story January 2015 7
150 years
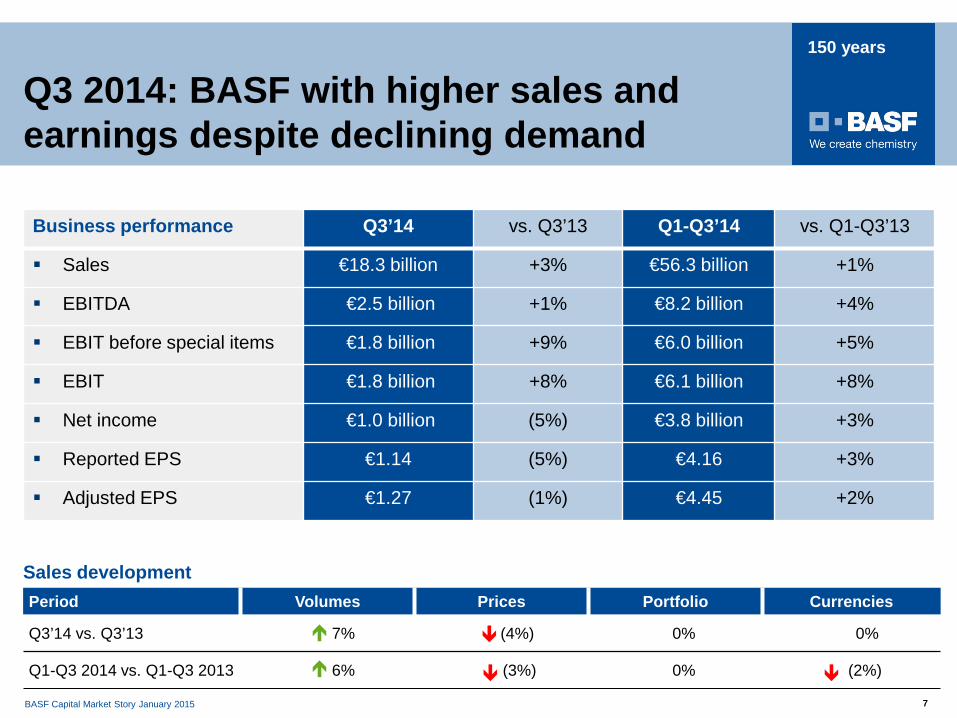
Q3 2014: BASF with higher sales and earnings despite declining demand
Sales development Period Volumes Prices Portfolio Currencies
Q3’14 vs. Q3’13 7% (4%) 0% 0%
Q1-Q3 2014 vs. Q1-Q3 2013 6% (3%) 0% (2%)
Business performance Q3’14 vs. Q3’13 Q1-Q3’14 vs. Q1-Q3’13
Sales €18.3 billion +3% €56.3 billion +1%
EBITDA €2.5 billion +1% €8.2 billion +4%
EBIT before special items €1.8 billion +9% €6.0 billion +5%
EBIT €1.8 billion +8% €6.1 billion +8%
Net income €1.0 billion (5%) €3.8 billion +3%
Reported EPS €1.14 (5%) €4.16 +3%
Adjusted EPS €1.27 (1%) €4.45 +2%

BASF Capital Market Story January 2015 8
150 years
Recent transaction with Statoil
Acquisition of participations in oil & gas fields in Norway
Purchase price amounts to US$1.25 billion
Increase of production to ~60,000 boepd in Norway
Additional reserves and resources of ~170 million boe
Transaction closed December 1st, 2014
Restructuring of Performance Products
Strengthening of R&D platforms
Important corporate developments
BASF to sell textile chemicals business to Archroma
Paper Chemicals division to be dissolved, product lines moved to other divisions
Strategic options for parts of kaolin business in evaluation
Total earnings improvement of ~€500 million by 2017
Future set up of global research platforms:
- Process Research & Chemical Engineering, led out of Europe
- Bioscience Research, led out of North America (from 2015)
- Advanced Materials & Systems Research, led out of Asia (from 2016)
BASF Capital Market Story January 2015 9
150 years
0
1
2
3
4
2004 2005 2006 2007 2008 2009** 2010 2011 2012 2013 Q1-Q32014
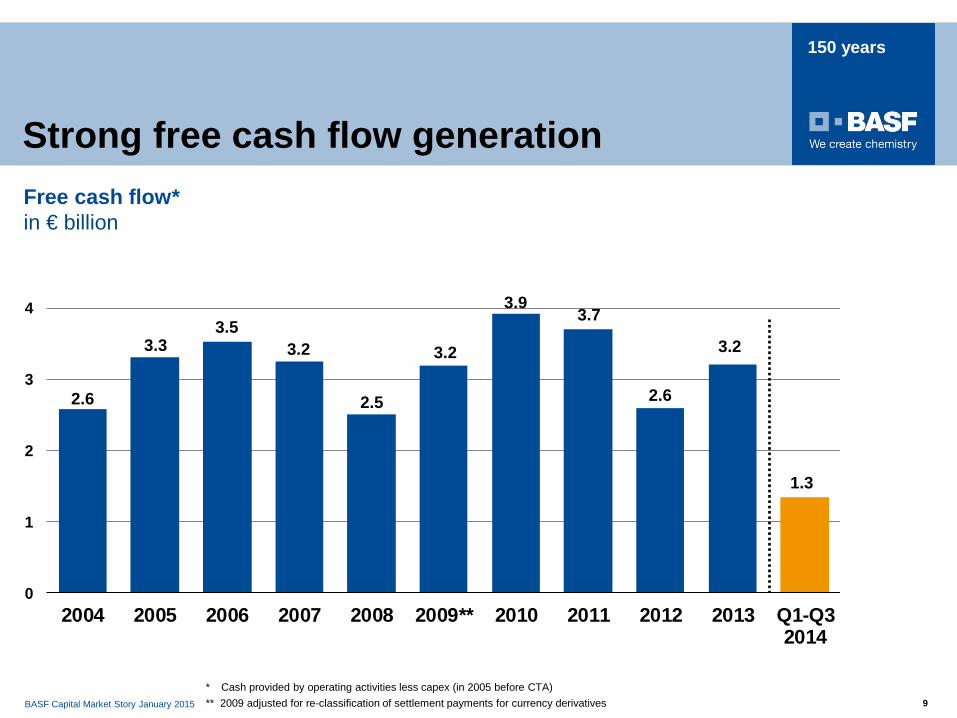
Strong free cash flow generation
* Cash provided by operating activities less capex (in 2005 before CTA) ** 2009 adjusted for re-classification of settlement payments for currency derivatives
Free cash flow* in € billion
2.6
3.3 3.5
3.2
2.5
3.2
3.9 3.7
2.6
3.2
1.3
BASF Capital Market Story January 2015 10
150 years
0.851.00
1.50
1.95 1.951.70
2.202.50
2004 2005 2006 2007 2008 2009 2010 2011 2012 2013
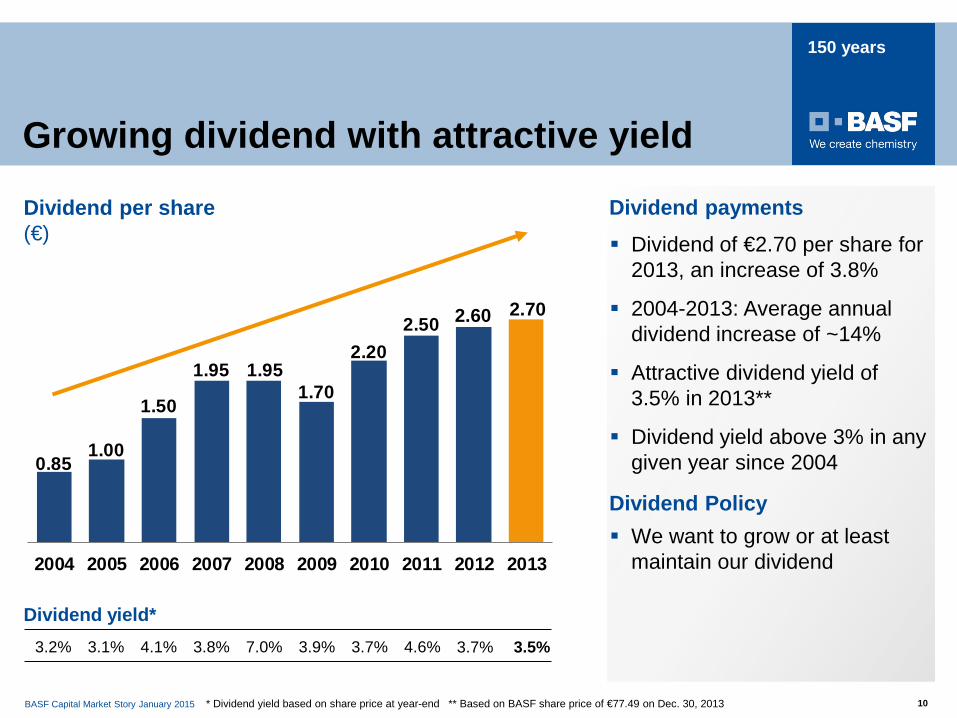
Growing dividend with attractive yield
* Dividend yield based on share price at year-end
Dividend payments
3.7% 3.2% 3.1% 4.1% 3.8% 7.0% 3.9%
Dividend yield* 4.6%
2.60 2.70
3.7%
** Based on BASF share price of €77.49 on Dec. 30, 2013
Dividend per share (€)
3.5%
Dividend Policy We want to grow or at least
maintain our dividend
Dividend of €2.70 per share for 2013, an increase of 3.8%
2004-2013: Average annual dividend increase of ~14%
Attractive dividend yield of 3.5% in 2013**
Dividend yield above 3% in any given year since 2004
BASF Capital Market Story January 2015 11
150 years
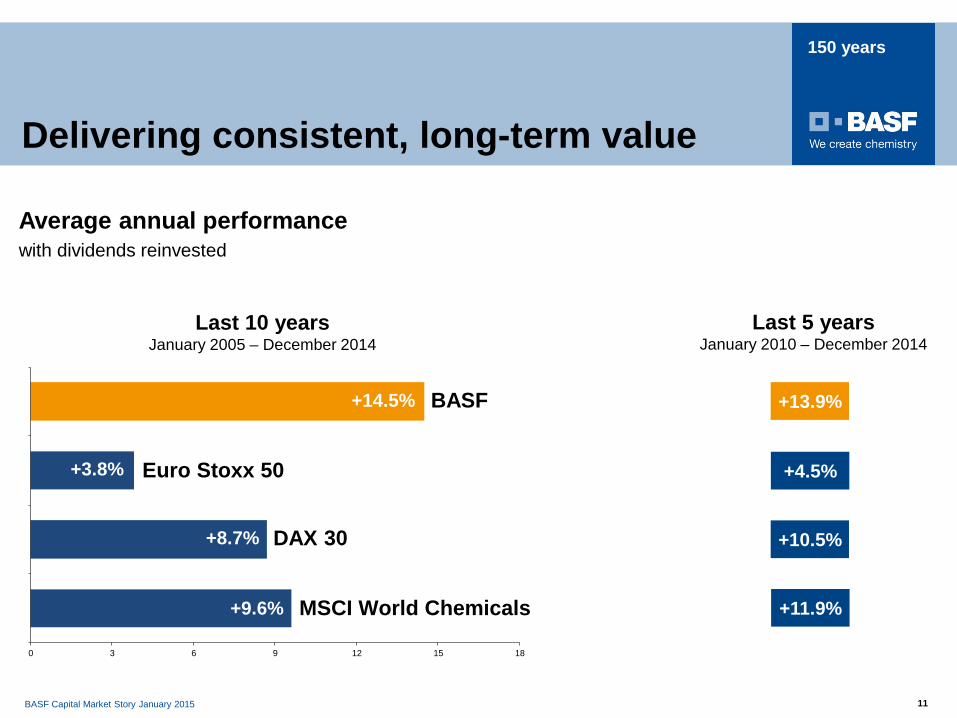
Delivering consistent, long-term value
Average annual performance with dividends reinvested
0 3 6 9 12 15 18
Euro Stoxx 50
DAX 30
MSCI World Chemicals
+8.7%
Last 5 years January 2010 – December 2014
+13.9%
+4.5%
+10.5%
+11.9%
Last 10 years January 2005 – December 2014
BASF
+9.6%
+3.8%
+14.5%
BASF Capital Market Story January 2015 12
150 years
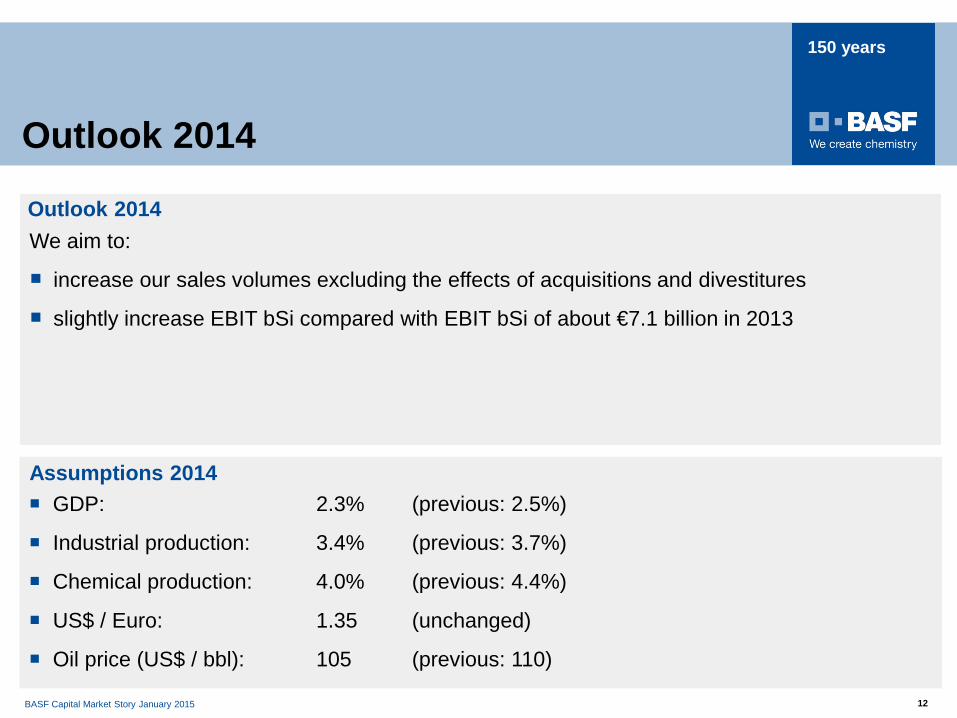
We aim to:
increase our sales volumes excluding the effects of acquisitions and divestitures
slightly increase EBIT bSi compared with EBIT bSi of about €7.1 billion in 2013
Outlook 2014
GDP: 2.3% (previous: 2.5%)
Industrial production: 3.4% (previous: 3.7%)
Chemical production: 4.0% (previous: 4.4%)
US$ / Euro: 1.35 (unchanged)
Oil price (US$ / bbl): 105 (previous: 110)
Assumptions 2014
Outlook 2014
BASF Capital Market Story January 2015 13
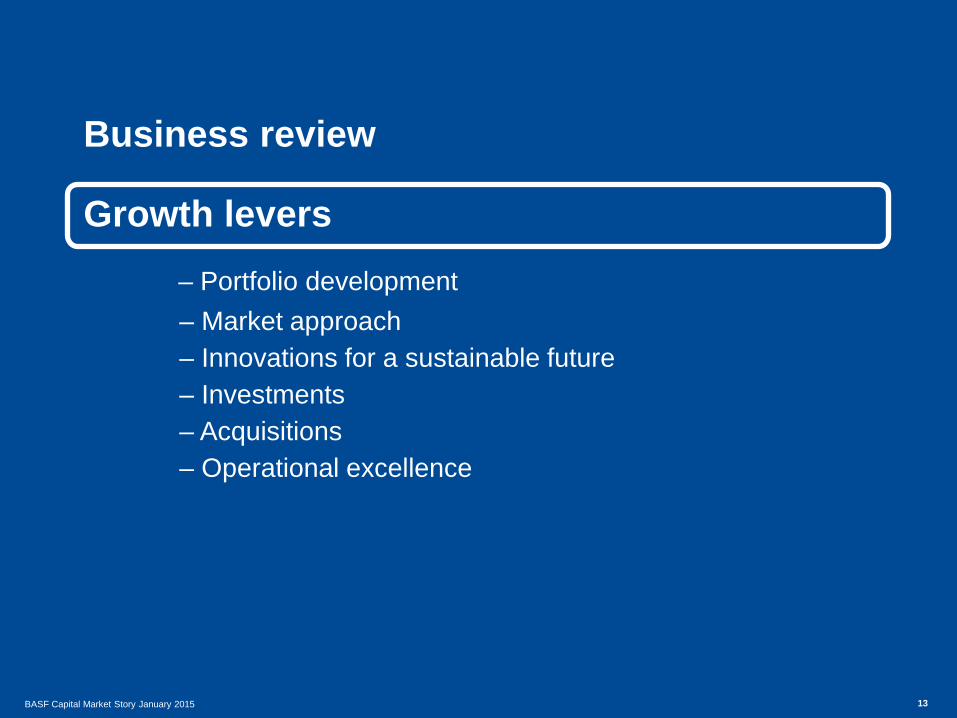
Business review
Growth levers – Portfolio development
– Market approach – Innovations for a sustainable future – Investments – Acquisitions – Operational excellence
BASF Capital Market Story January 2015 14
150 years
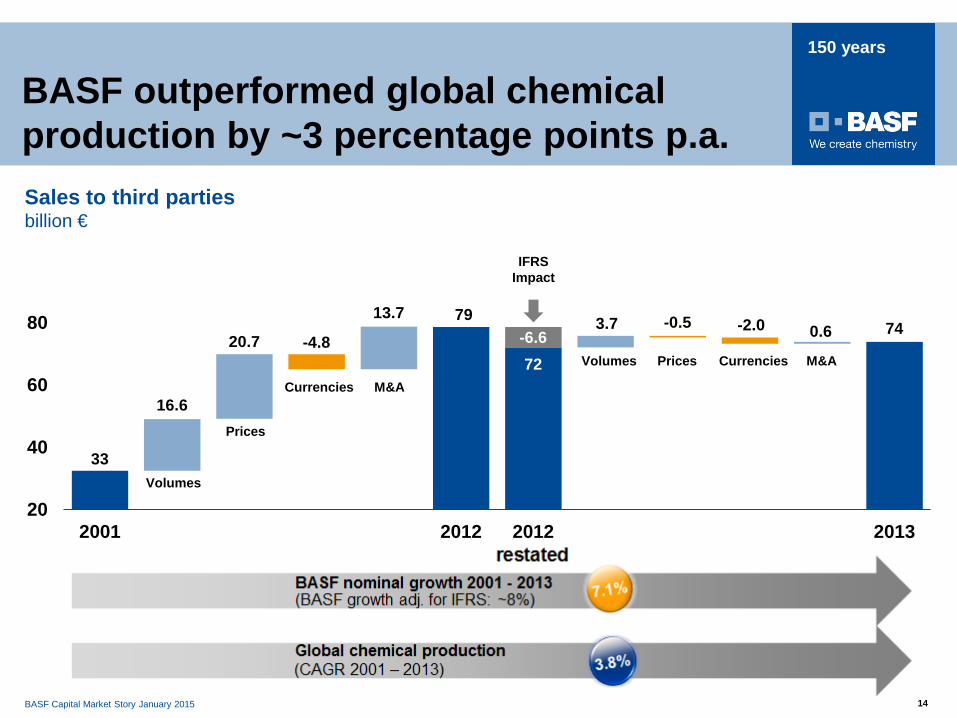
BASF outperformed global chemical production by ~3 percentage points p.a. Sales to third parties billion €
33
79
72
74
16.6
20.7 -4.8
13.7 -6.6
3.7 -0.5 -2.0 0.6
20
40
60
80
2001 2012 2012 restated
2013
Volumes
Prices
Currencies M&A
Volumes Prices Currencies M&A
IFRS Impact
BASF Capital Market Story January 2015 15
150 years
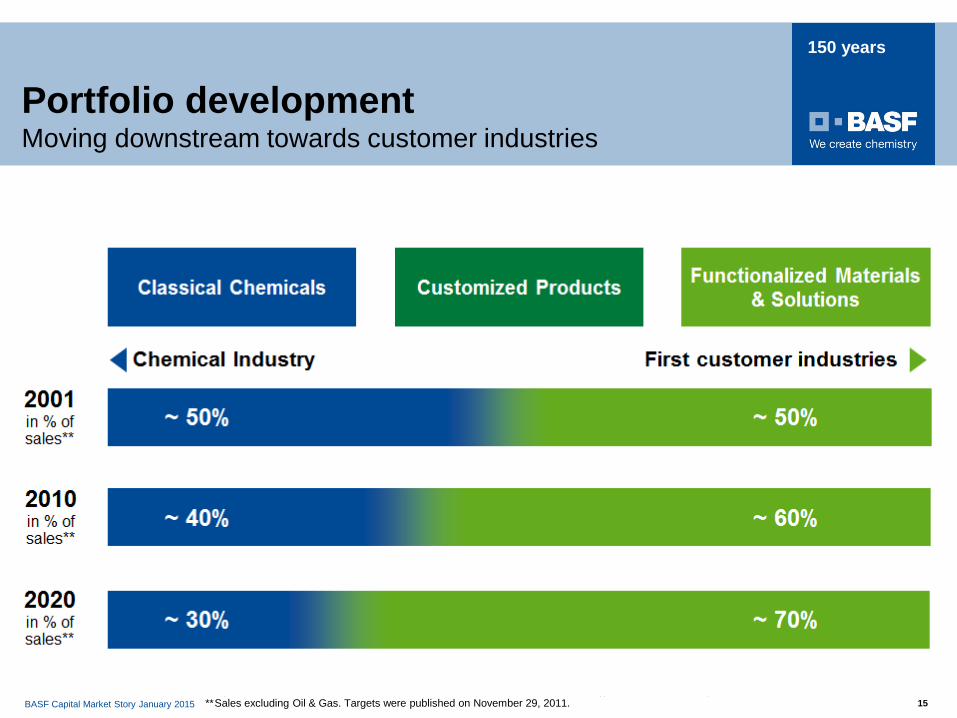
Portfolio development Moving downstream towards customer industries
* Agriculture, Construction, Consumer Goods, Health & Nutrition, Electronics, Energy & Resources, Transportation ** Sales excluding Oil & Gas. Targets were published on November 29, 2011.
BASF Capital Market Story January 2015 16
150 years
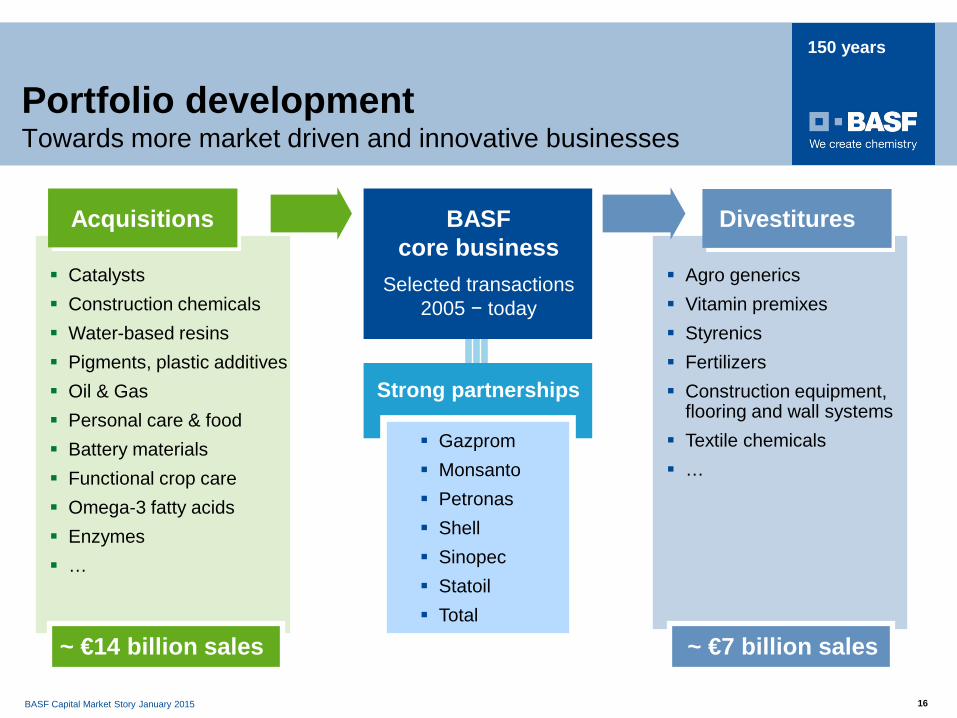
Catalysts Construction chemicals Water-based resins Pigments, plastic additives Oil & Gas Personal care & food Battery materials Functional crop care Omega-3 fatty acids Enzymes …
BASF core business
Strong partnerships
Gazprom Monsanto Petronas Shell Sinopec Statoil Total
Selected transactions 2005 − today
Acquisitions
~ €14 billion sales
Divestitures
Agro generics Vitamin premixes Styrenics Fertilizers Construction equipment,
flooring and wall systems Textile chemicals …
~ €7 billion sales
Portfolio development Towards more market driven and innovative businesses
BASF Capital Market Story January 2015 17
150 years
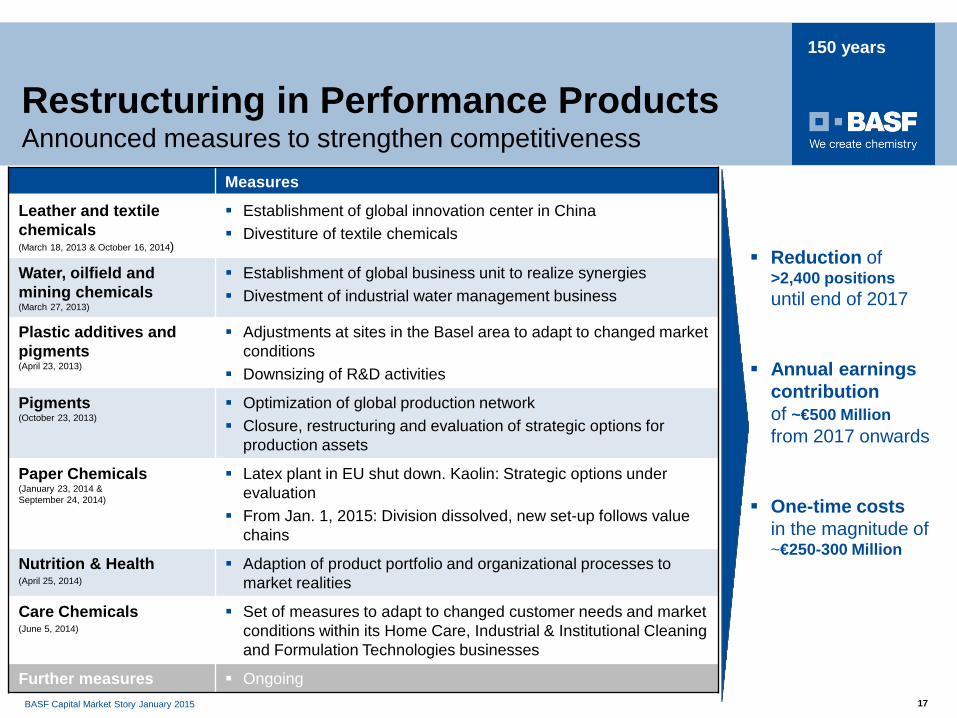
Restructuring in Performance Products Announced measures to strengthen competitiveness
Measures
Leather and textile chemicals (March 18, 2013 & October 16, 2014)
Establishment of global innovation center in China Divestiture of textile chemicals
Water, oilfield and mining chemicals (March 27, 2013)
Establishment of global business unit to realize synergies Divestment of industrial water management business
Plastic additives and pigments (April 23, 2013)
Adjustments at sites in the Basel area to adapt to changed market conditions
Downsizing of R&D activities
Pigments (October 23, 2013)
Optimization of global production network Closure, restructuring and evaluation of strategic options for
production assets
Paper Chemicals (January 23, 2014 & September 24, 2014)
Latex plant in EU shut down. Kaolin: Strategic options under evaluation
From Jan. 1, 2015: Division dissolved, new set-up follows value chains
Nutrition & Health (April 25, 2014)
Adaption of product portfolio and organizational processes to market realities
Care Chemicals (June 5, 2014)
Set of measures to adapt to changed customer needs and market conditions within its Home Care, Industrial & Institutional Cleaning and Formulation Technologies businesses
Further measures Ongoing
Reduction of >2,400 positions until end of 2017
Annual earnings contribution of ~€500 Million from 2017 onwards
One-time costs in the magnitude of ~€250-300 Million
BASF Capital Market Story January 2015 18
150 years
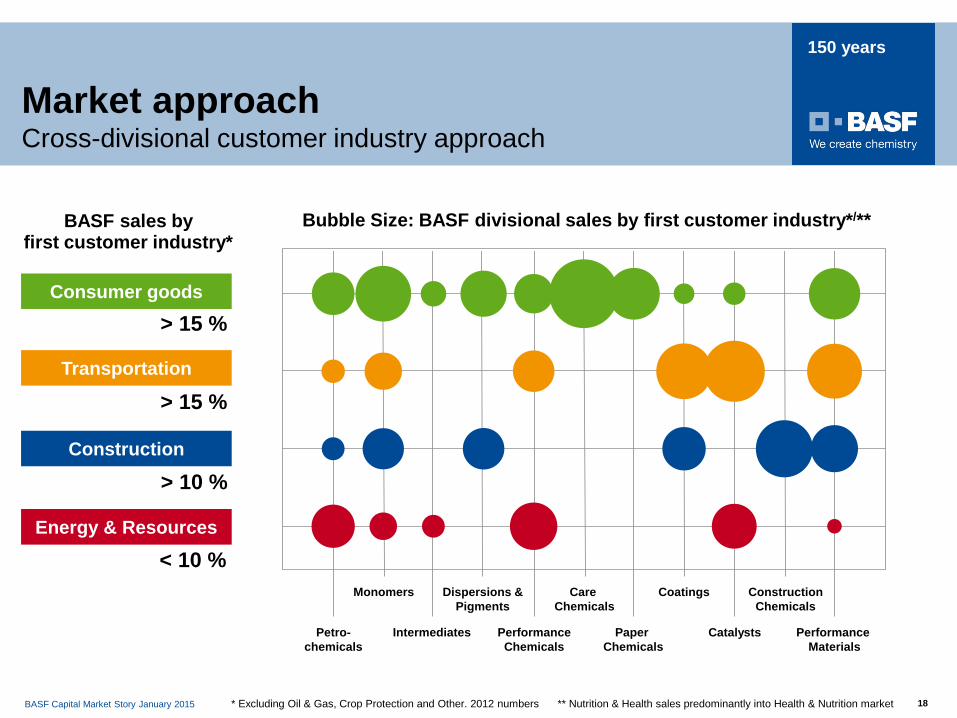
Monomers
Intermediates
Dispersions & Pigments
Performance Chemicals
Care Chemicals
Paper Chemicals
Coatings
Catalysts
Construction Chemicals
BASF sales by first customer industry*
> 15 %
> 10 %
< 10 %
> 15 %
Consumer goods
Transportation
Construction
Energy & Resources
Market approach Cross-divisional customer industry approach
* Excluding Oil & Gas, Crop Protection and Other. 2012 numbers
Petro- chemicals
Performance Materials
Bubble Size: BASF divisional sales by first customer industry*/**
** Nutrition & Health sales predominantly into Health & Nutrition market
BASF Capital Market Story January 2015 19
150 years
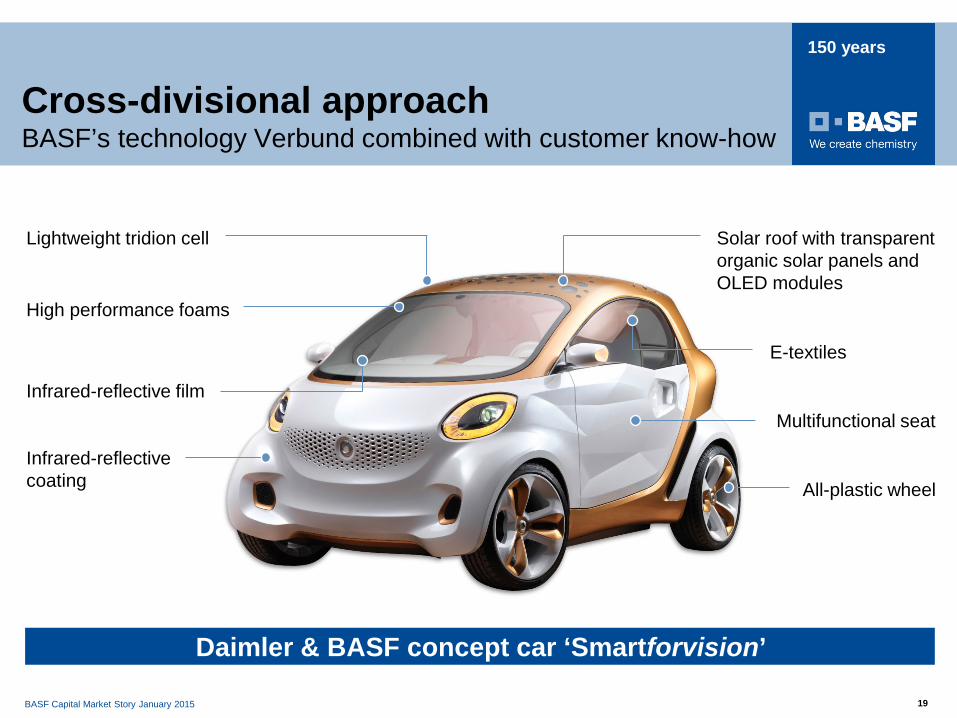
E-textiles
Solar roof with transparent organic solar panels and OLED modules
Multifunctional seat
Infrared-reflective coating
Infrared-reflective film
High performance foams
Lightweight tridion cell
All-plastic wheel
Cross-divisional approach BASF’s technology Verbund combined with customer know-how
Daimler & BASF concept car ‘Smartforvision’
BASF Capital Market Story January 2015 20
150 years
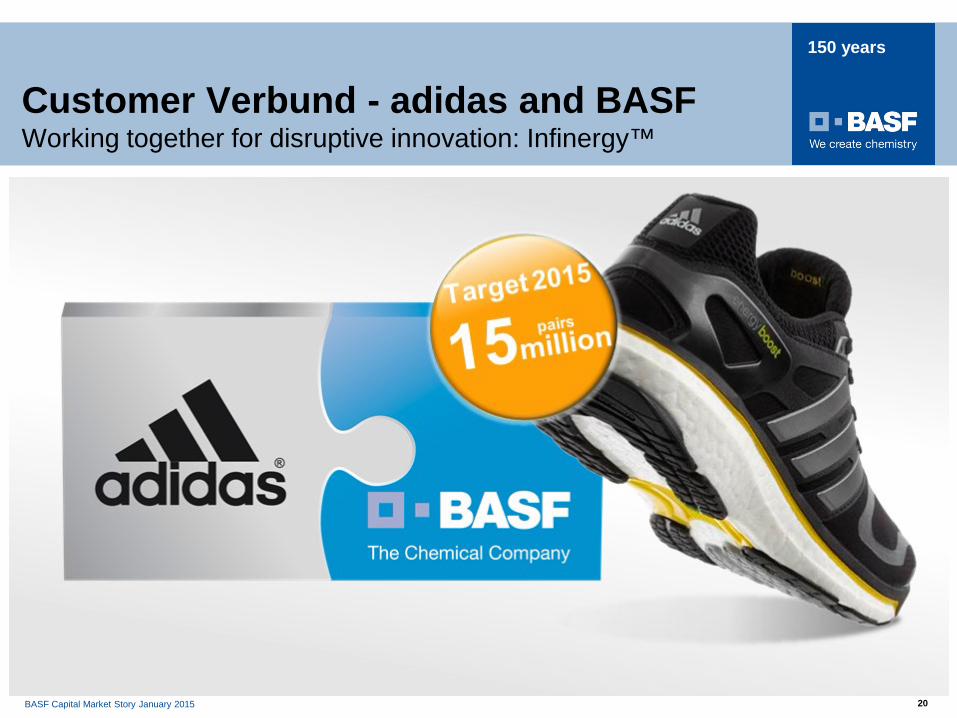
Customer Verbund - adidas and BASF Working together for disruptive innovation: Infinergy™
BASF Capital Market Story January 2015 21
150 years
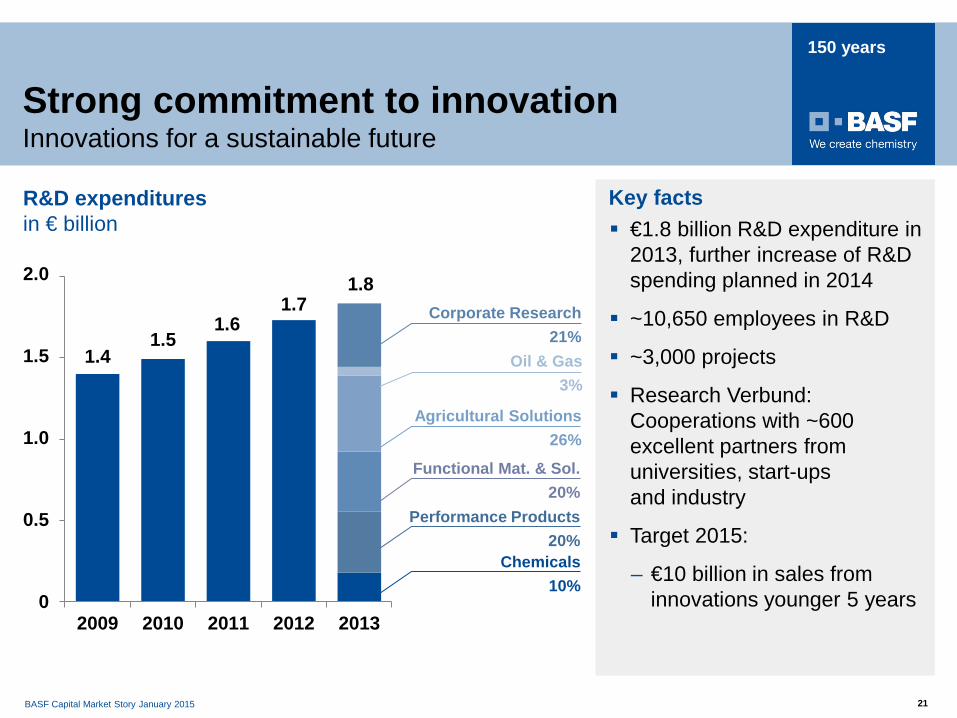
Strong commitment to innovation Innovations for a sustainable future
1.4 1.5
1.6 1.7
1.8
0,0
0,5
1,0
1,5
2,0
2009 2010 2011 2012 2013
€1.8 billion R&D expenditure in 2013, further increase of R&D spending planned in 2014
~10,650 employees in R&D
~3,000 projects
Research Verbund: Cooperations with ~600 excellent partners from universities, start-ups and industry
Target 2015:
– €10 billion in sales from innovations younger 5 years
R&D expenditures in € billion
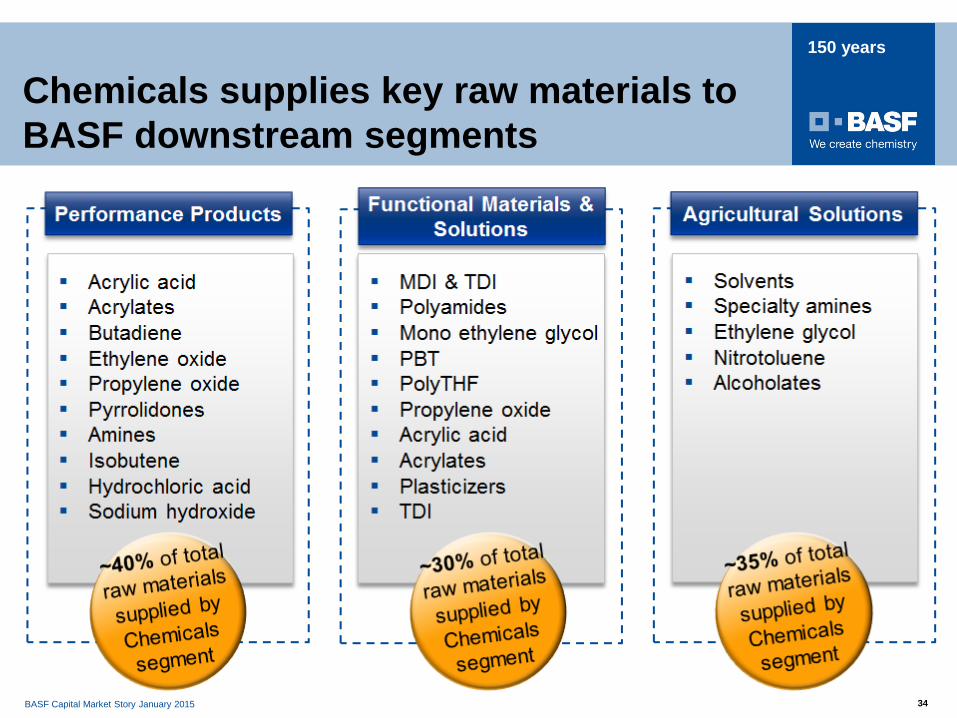
Chemicals 10%
Performance Products 20%
Functional Mat. & Sol. 20%
Agricultural Solutions 26%
Oil & Gas 3%
Corporate Research 21%
Key facts
2.0
1.5
1.0
0.5
0
BASF Capital Market Story January 2015 22
150 years
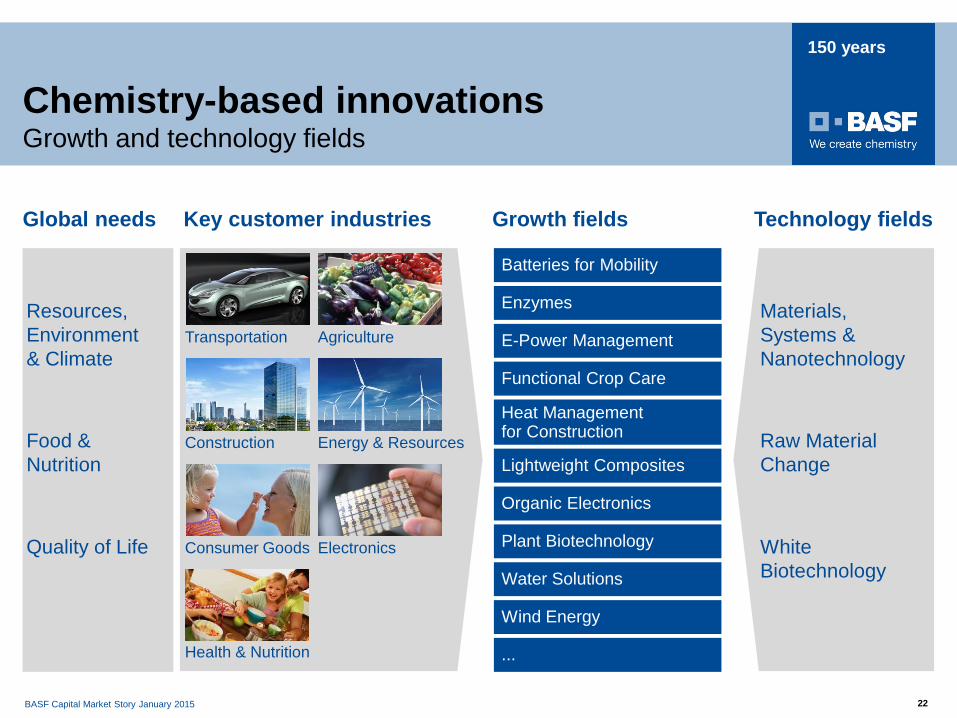
Chemistry-based innovations Growth and technology fields
Growth fields
Resources, Environment & Climate
Food & Nutrition
Quality of Life White Biotechnology
Materials, Systems & Nanotechnology
Raw Material Change
Key customer industries
Health & Nutrition
Consumer Goods
Transportation
Energy & Resources
Electronics
Agriculture
Construction
Technology fields Global needs
...
Batteries for Mobility
Enzymes
Heat Management for Construction
Organic Electronics
Functional Crop Care
Plant Biotechnology
E-Power Management
Wind Energy
Lightweight Composites
Water Solutions
BASF Capital Market Story January 2015 23
150 years
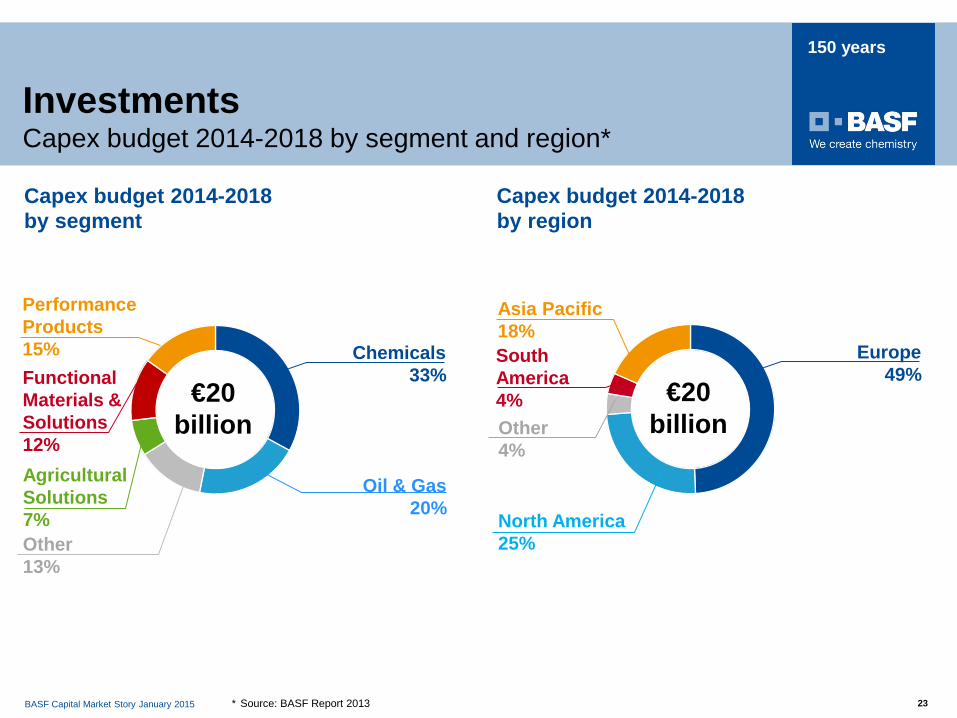
Performance Products 15%
Oil & Gas 20%
€20 billion
Functional Materials & Solutions 12%
Capex budget 2014-2018
Other 13%
Chemicals 33%
Capex budget 2014-2018
Asia Pacific 18%
€20 billion
South America 4%
North America 25%
Europe 49%
Agricultural Solutions 7%
Other 4%
by segment by region
Investments Capex budget 2014-2018 by segment and region*
* Source: BASF Report 2013
BASF Capital Market Story January 2015 24
150 years
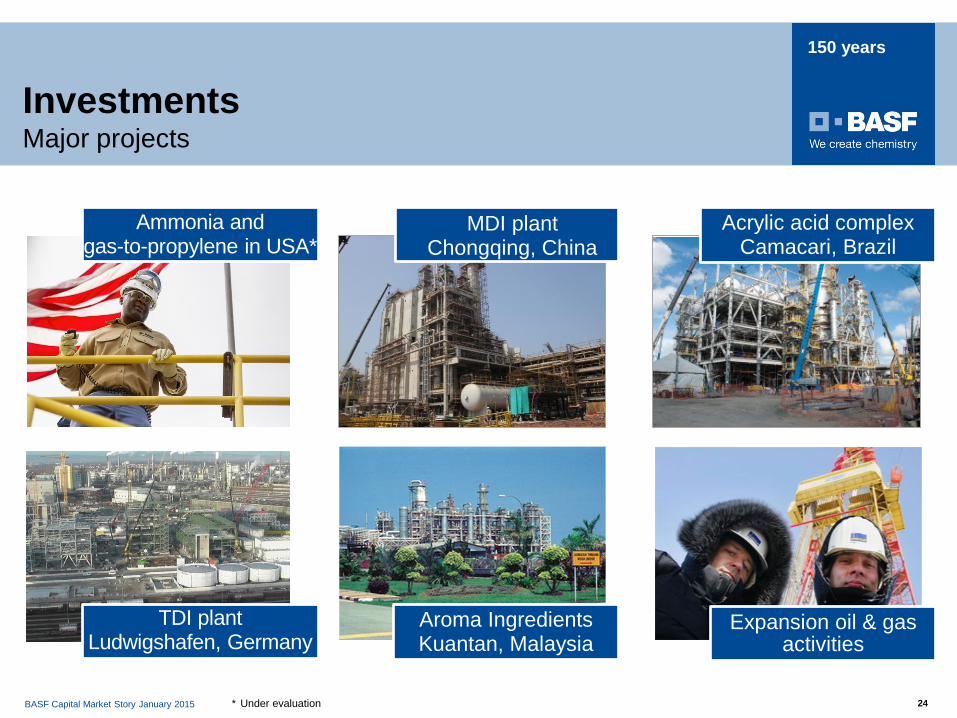
Expansion oil & gas activities
Aroma Ingredients Kuantan, Malaysia
Investments Major projects
Ammonia and gas-to-propylene in USA*
MDI plant Chongqing, China
Acrylic acid complex Camacari, Brazil
TDI plant Ludwigshafen, Germany
* Under evaluation
BASF Capital Market Story January 2015 25
150 years
Acquisitions … will contribute to profitable growth in the future
Provide a minimum return on investment of 8% p.a. after tax
Are EPS accretive by year three at the latest
Financial acquisition criteria
Generate profitable growth above the industry average
Are innovation-driven
Offer a special value proposition to customers
Reduce earnings cyclicality
Strategic acquisition criteria
We want to acquire businesses which …
BASF Capital Market Story January 2015 26
150 years
0
1,000
2,000
3,000
4,000
2013 2015
Former cost saving programs NEXT STEP
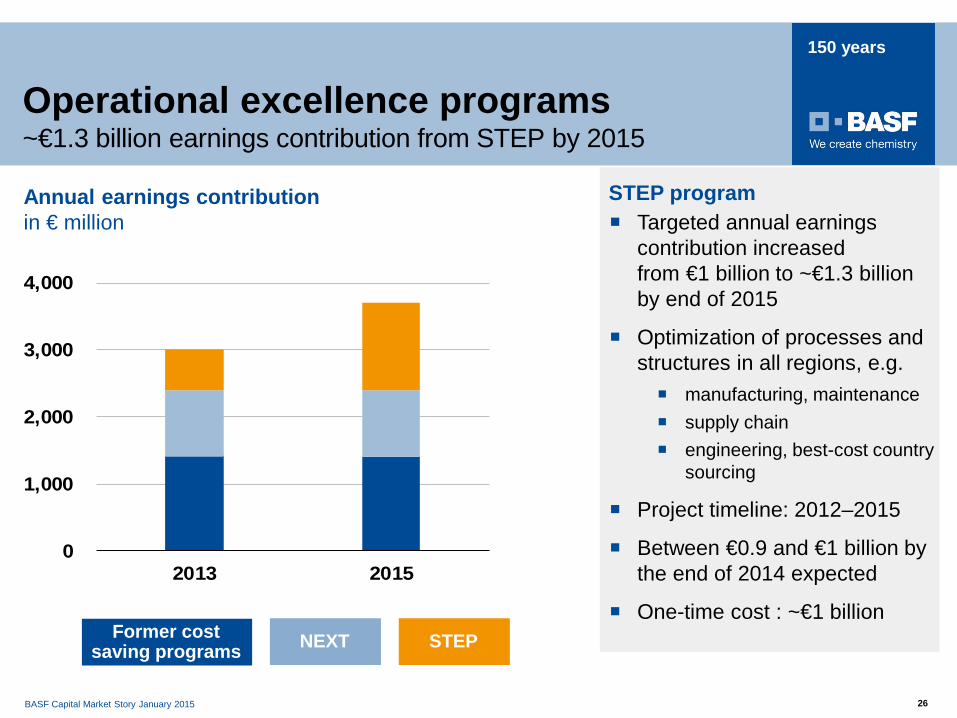
Operational excellence programs ~€1.3 billion earnings contribution from STEP by 2015
Annual earnings contribution in € million Targeted annual earnings
contribution increased from €1 billion to ~€1.3 billion by end of 2015
Optimization of processes and structures in all regions, e.g. manufacturing, maintenance supply chain engineering, best-cost country
sourcing
Project timeline: 2012–2015
Between €0.9 and €1 billion by the end of 2014 expected
One-time cost : ~€1 billion
STEP program
BASF Capital Market Story January 2015 27
150 years
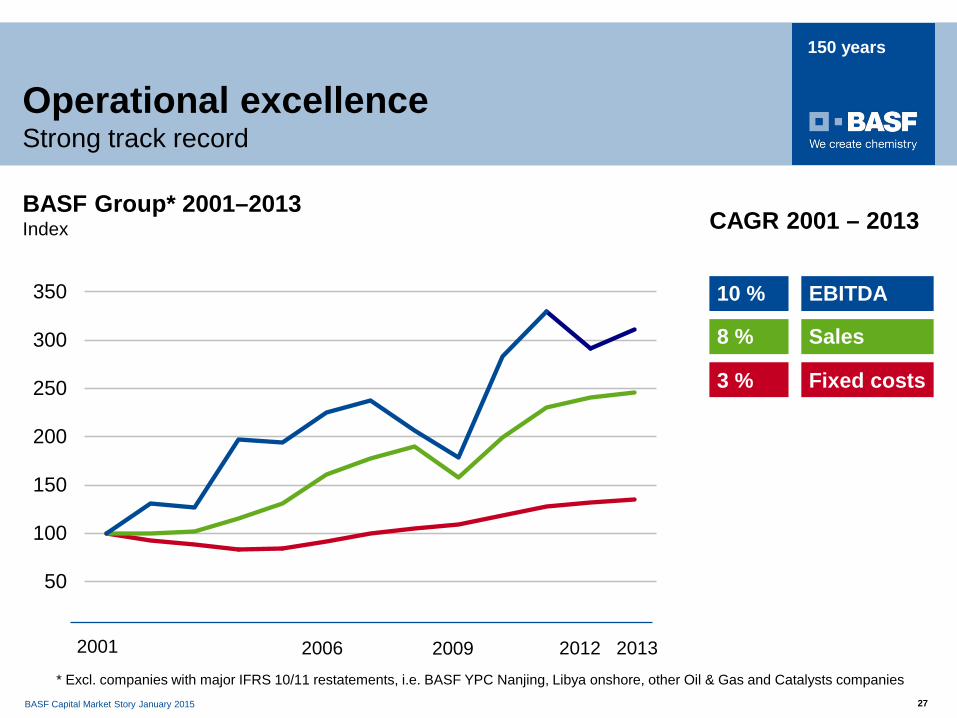
Operational excellence Strong track record
BASF Group* 2001–2013 Index
50
100
150
200
250
300
350
2001 2006 2009 2012
CAGR 2001 – 2013
10 %
8 %
3 %
EBITDA
Sales
Fixed costs
* Excl. companies with major IFRS 10/11 restatements, i.e. BASF YPC Nanjing, Libya onshore, other Oil & Gas and Catalysts companies
2013
BASF Capital Market Story January 2015 28
Appendix I:
Chemicals Day
BASF Capital Market Story January 2015 29
150 years
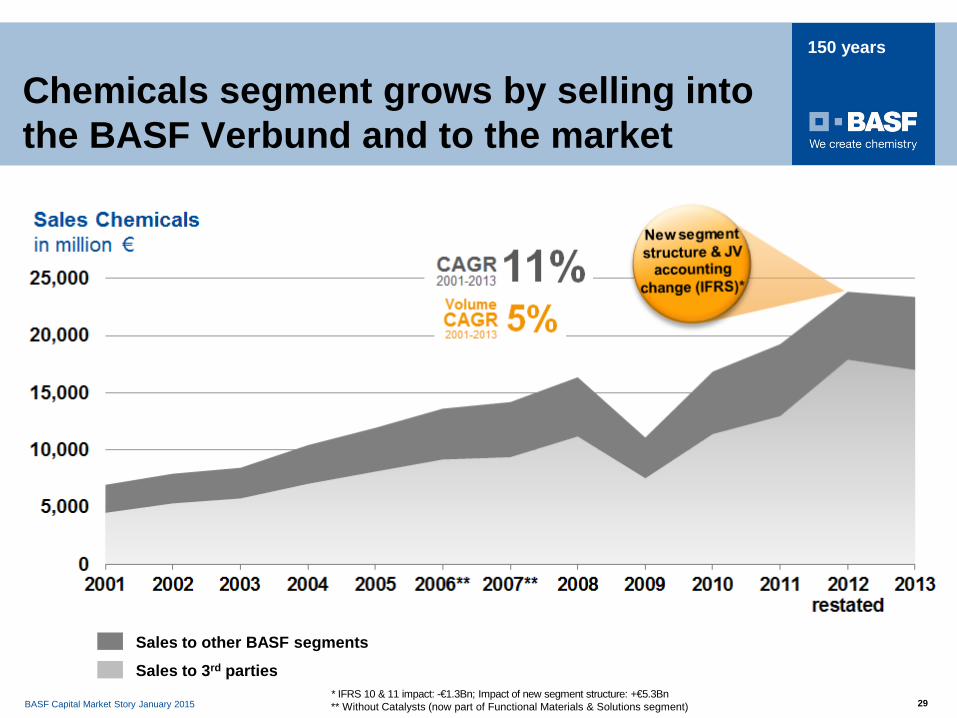
Sales to other BASF segments
Sales to 3rd parties
Chemicals segment grows by selling into the BASF Verbund and to the market
* IFRS 10 & 11 impact: -€1.3Bn; Impact of new segment structure: +€5.3Bn ** Without Catalysts (now part of Functional Materials & Solutions segment)
BASF Capital Market Story January 2015 30
150 years
0
100
200
300
400
500
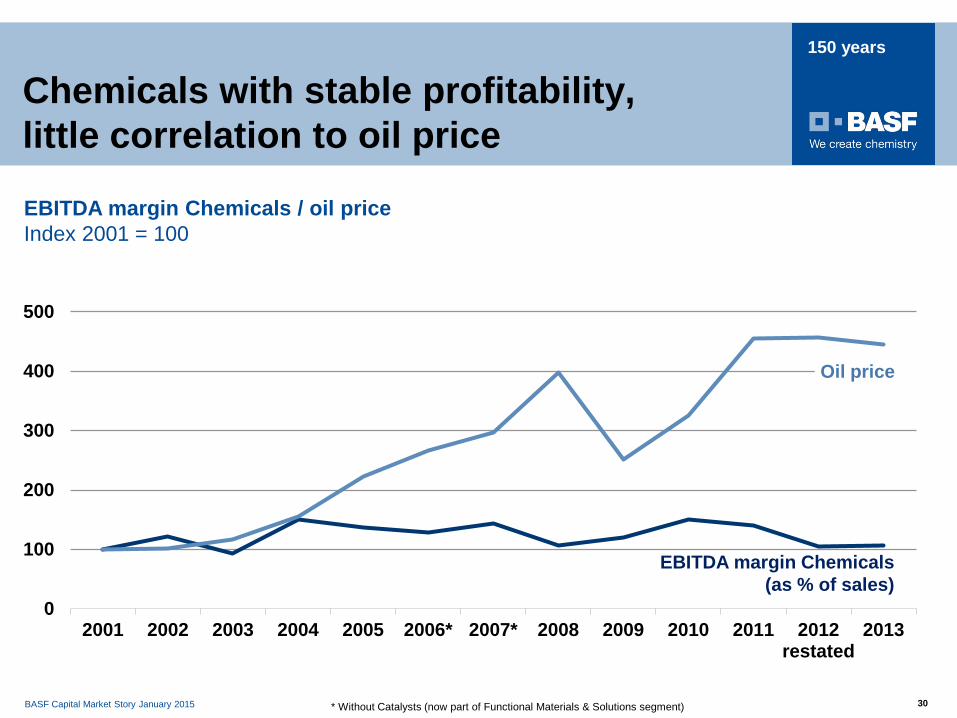
2001 2002 2003 2004 2005 2006* 2007* 2008 2009 2010 2011 2012restated
2013
EBITDA margin Chemicals / oil price Index 2001 = 100
Chemicals with stable profitability, little correlation to oil price
EBITDA margin Chemicals (as % of sales)
Oil price
* Without Catalysts (now part of Functional Materials & Solutions segment)
BASF Capital Market Story January 2015 31
150 years
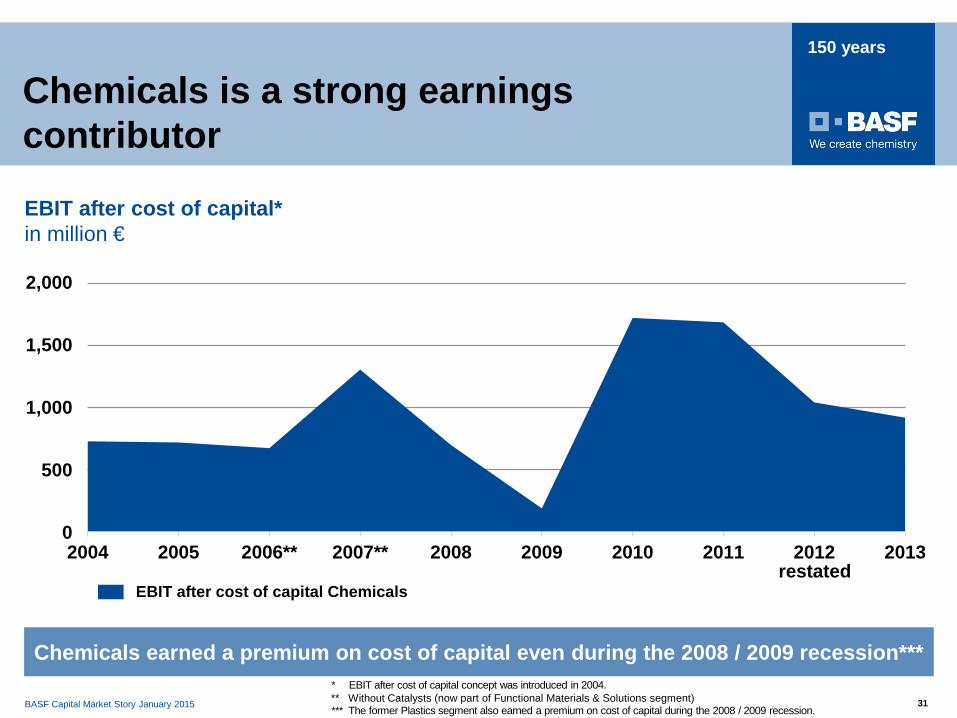
EBIT after cost of capital Chemicals
EBIT after cost of capital* in million €
restated
Chemicals earned a premium on cost of capital even during the 2008 / 2009 recession*** * EBIT after cost of capital concept was introduced in 2004.
*** The former Plastics segment also earned a premium on cost of capital during the 2008 / 2009 recession.
Chemicals is a strong earnings contributor
0
500
1.000
1.500
2.000
2004 2005 2006** 2007** 2008 2009 2010 2011 2012 2013
2,000
1,500
1,000
500
0
** Without Catalysts (now part of Functional Materials & Solutions segment)
BASF Capital Market Story January 2015 32
150 years
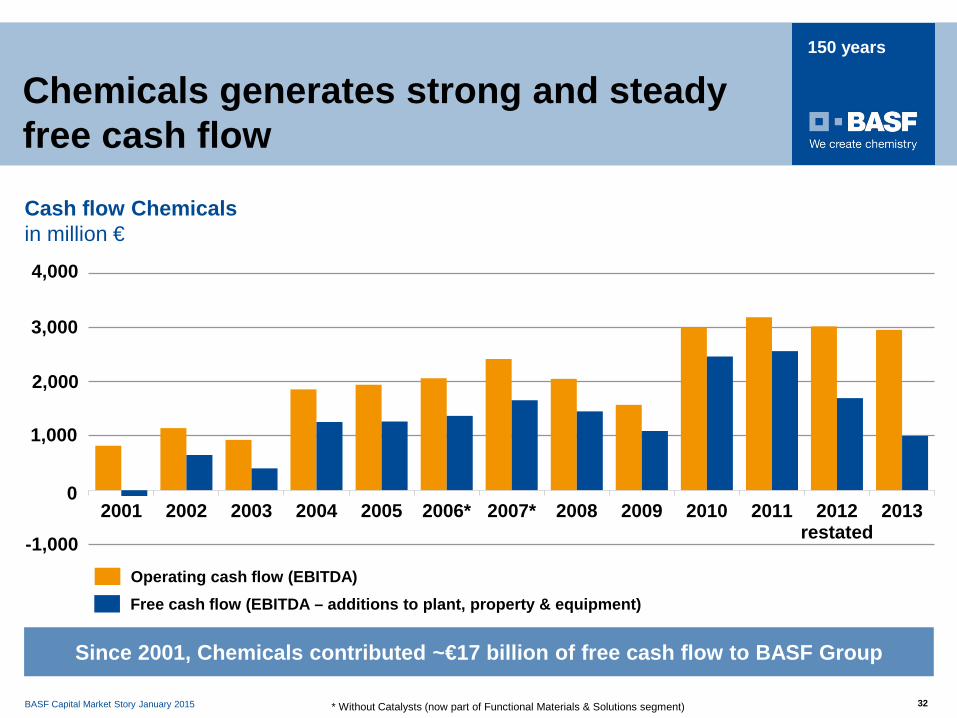
2001 2002 2003 2004 2005 2006* 2007* 2008 2009 2010 2011 2012restated
2013
Chemicals generates strong and steady free cash flow
Cash flow Chemicals in million €
* Without Catalysts (now part of Functional Materials & Solutions segment)
Free cash flow (EBITDA – additions to plant, property & equipment)
Since 2001, Chemicals contributed ~€17 billion of free cash flow to BASF Group
Operating cash flow (EBITDA)
2,000
3,000
4,000
1,000
-1,000
0
BASF Capital Market Story January 2015 33
150 years
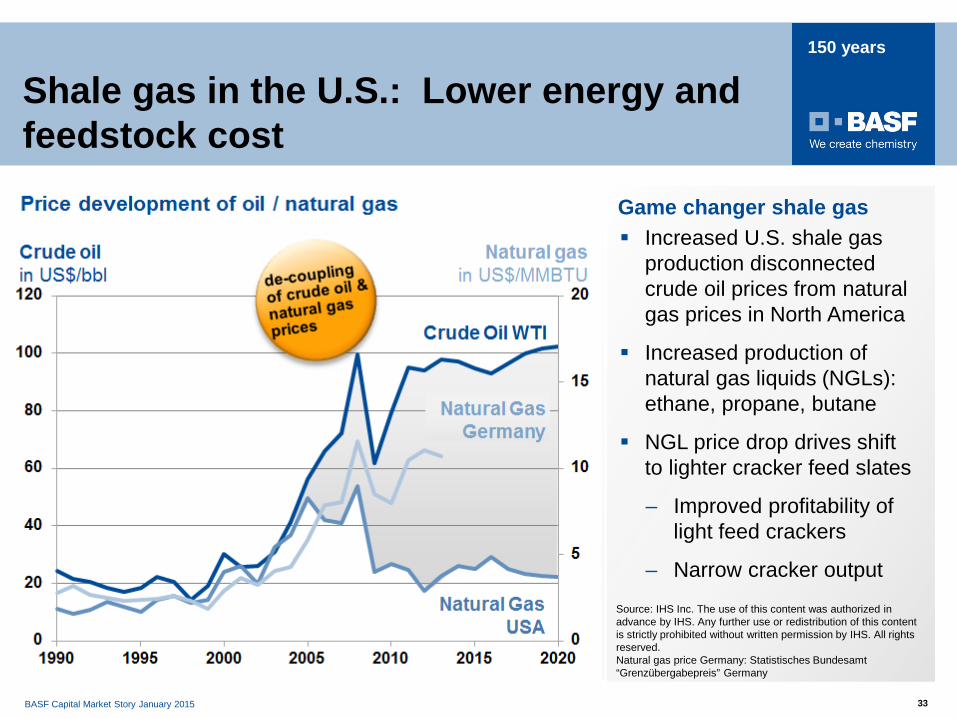
Shale gas in the U.S.: Lower energy and feedstock cost
Increased U.S. shale gas production disconnected crude oil prices from natural gas prices in North America
Increased production of natural gas liquids (NGLs): ethane, propane, butane
NGL price drop drives shift to lighter cracker feed slates
– Improved profitability of light feed crackers
– Narrow cracker output
Game changer shale gas
Source: IHS Inc. The use of this content was authorized in advance by IHS. Any further use or redistribution of this content is strictly prohibited without written permission by IHS. All rights reserved. Natural gas price Germany: Statistisches Bundesamt “Grenzübergabepreis” Germany
BASF Capital Market Story January 2015 34
150 years
Chemicals supplies key raw materials to BASF downstream segments
BASF Capital Market Story January 2015 35
150 years
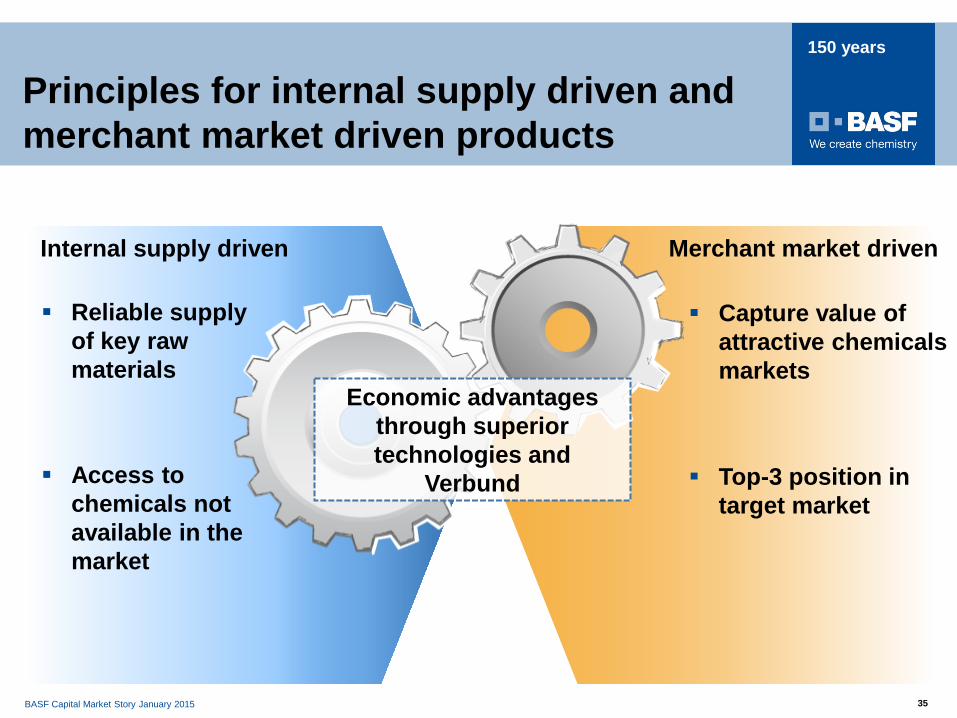
Principles for internal supply driven and merchant market driven products
Reliable supply of key raw materials
Access to chemicals not available in the market
Internal supply driven
Capture value of attractive chemicals markets
Top-3 position in target market
Merchant market driven
Economic advantages through superior technologies and
Verbund
BASF Capital Market Story January 2015 36
150 years
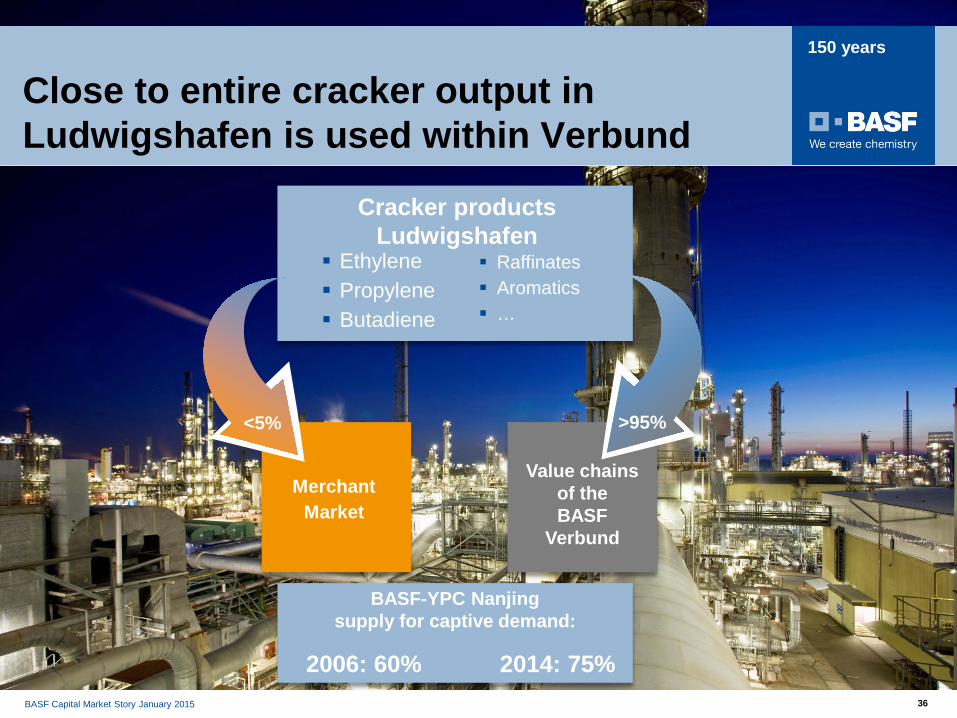
Merchant Market
Value chains of the BASF
Verbund
Ethylene Propylene Butadiene
Close to entire cracker output in Ludwigshafen is used within Verbund
<5%
Raffinates Aromatics …
Cracker products Ludwigshafen
>95%
BASF-YPC Nanjing supply for captive demand:
2006: 60% 2014: 75% BASF SE, Ludwigshafen, Germany
BASF Capital Market Story January 2015 37
150 years
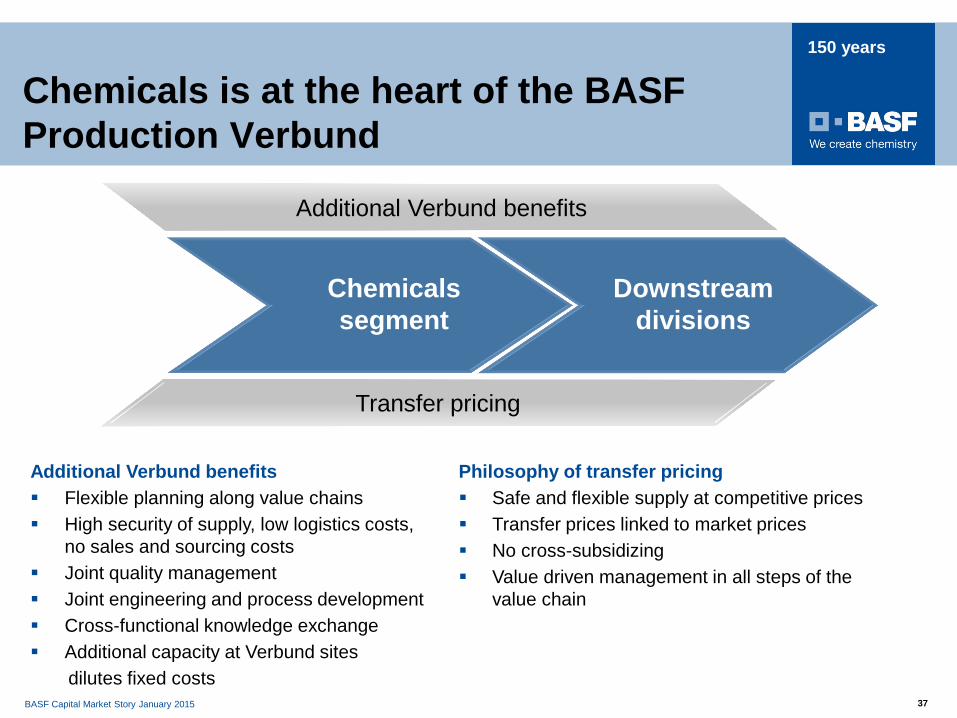
Philosophy of transfer pricing Safe and flexible supply at competitive prices Transfer prices linked to market prices No cross-subsidizing Value driven management in all steps of the
value chain
Additional Verbund benefits Flexible planning along value chains High security of supply, low logistics costs,
no sales and sourcing costs Joint quality management Joint engineering and process development Cross-functional knowledge exchange Additional capacity at Verbund sites dilutes fixed costs
Chemicals is at the heart of the BASF Production Verbund
Additional Verbund benefits
Transfer pricing
Downstream divisions
Chemicals segment
BASF Capital Market Story January 2015 38
150 years
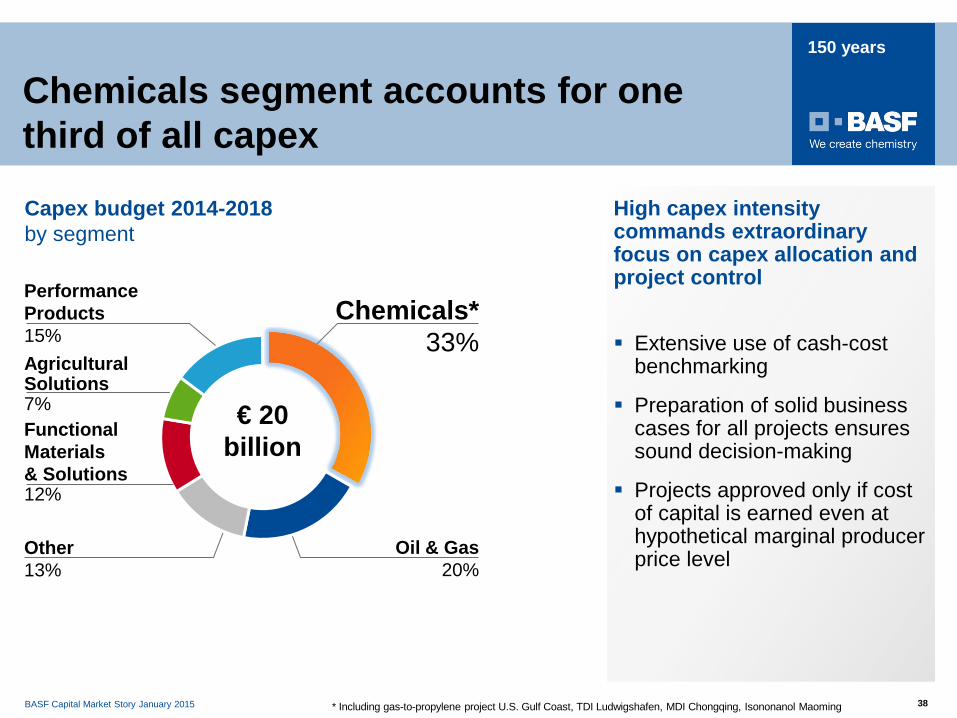
High capex intensity commands extraordinary focus on capex allocation and project control
Extensive use of cash-cost benchmarking
Preparation of solid business cases for all projects ensures sound decision-making
Projects approved only if cost of capital is earned even at hypothetical marginal producer price level
Chemicals segment accounts for one third of all capex
Capex budget 2014-2018 by segment
Other 13%
Chemicals* 33%
Performance Products 15%
€ 20 billion
Agricultural Solutions 7%
Oil & Gas 20%
Functional Materials & Solutions 12%
* Including gas-to-propylene project U.S. Gulf Coast, TDI Ludwigshafen, MDI Chongqing, Isononanol Maoming
BASF Capital Market Story January 2015 39
150 years
0%
2%
4%
6%
8%
10%
12%
14%
16%
0
50
100
150
200
250
300
350
400
2000 2001 2002 2003 2004 2005 2006* 2007* 2008 2009 2010 2011 2012 2013 2014 2015 2016restated
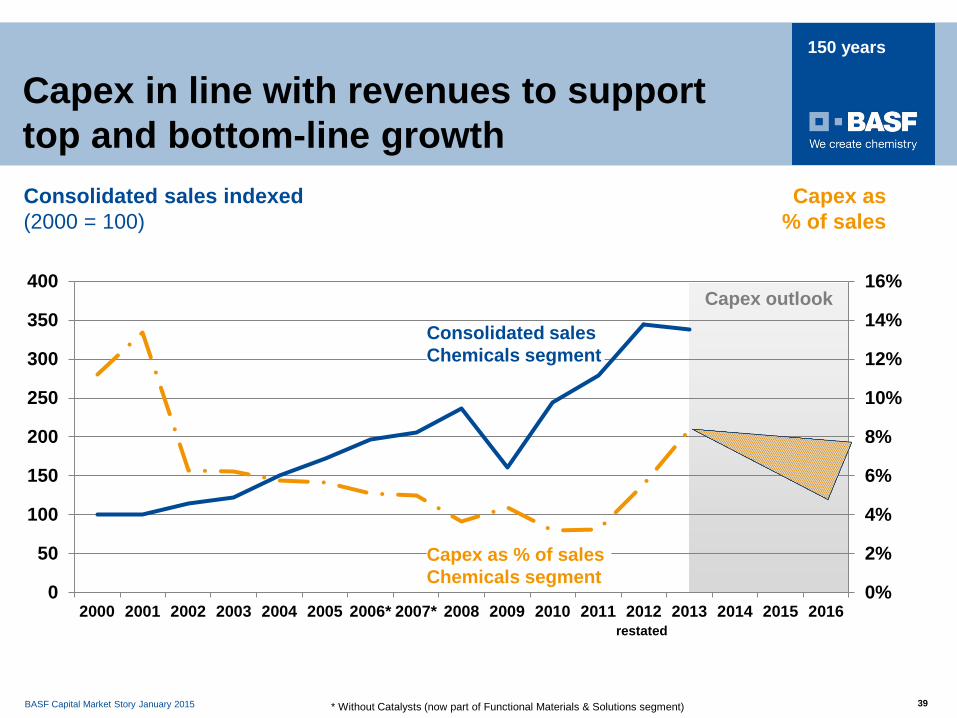
Consolidated sales indexed (2000 = 100)
Capex as % of sales
Capex in line with revenues to support top and bottom-line growth
Capex as % of sales Chemicals segment
Consolidated sales Chemicals segment
Capex outlook
* Without Catalysts (now part of Functional Materials & Solutions segment)
BASF Capital Market Story January 2015 40
150 years
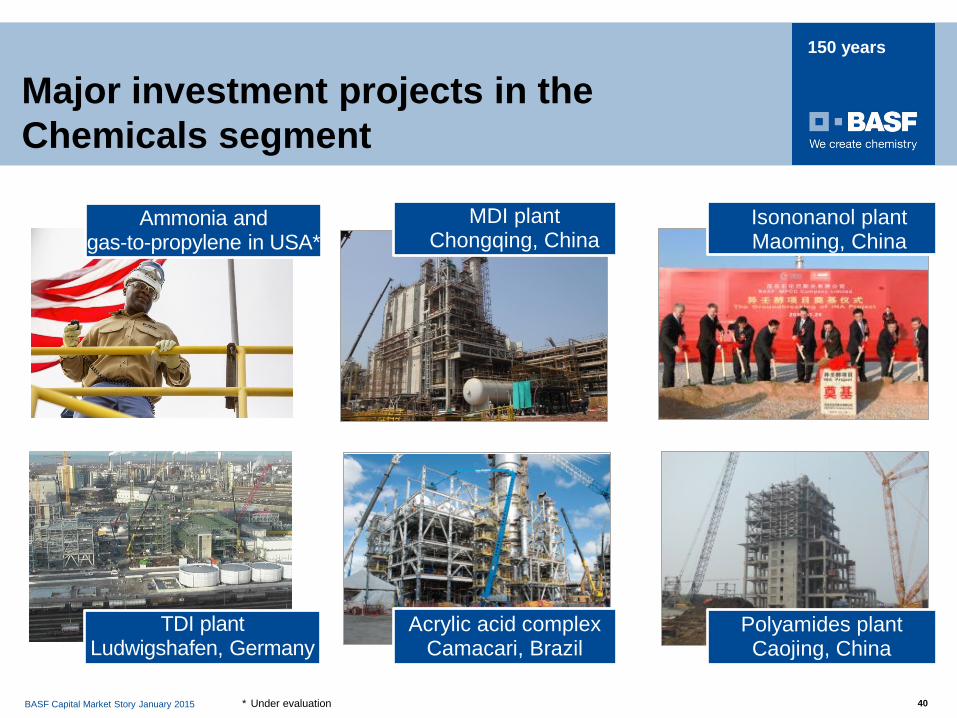
Major investment projects in the Chemicals segment
Ammonia and gas-to-propylene in USA*
MDI plant Chongqing, China
Acrylic acid complex Camacari, Brazil
TDI plant Ludwigshafen, Germany
* Under evaluation
Isononanol plant Maoming, China
Polyamides plant Caojing, China
BASF Capital Market Story January 2015 41
150 years
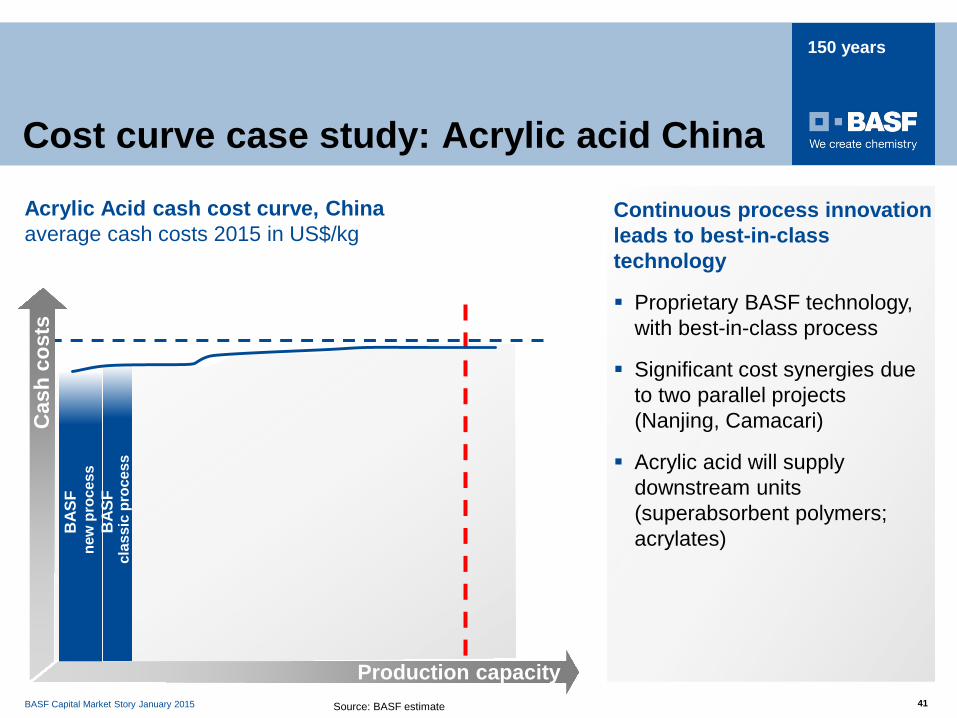
Continuous process innovation leads to best-in-class technology
Proprietary BASF technology, with best-in-class process
Significant cost synergies due to two parallel projects (Nanjing, Camacari)
Acrylic acid will supply downstream units (superabsorbent polymers; acrylates)
Cost curve case study: Acrylic acid China
Acrylic Acid cash cost curve, China average cash costs 2015 in US$/kg
Cas
h co
sts
BAS
F
clas
sic
proc
ess
BAS
F
new
pro
cess
Source: BASF estimate
Production capacity
BASF Capital Market Story January 2015 42
150 years
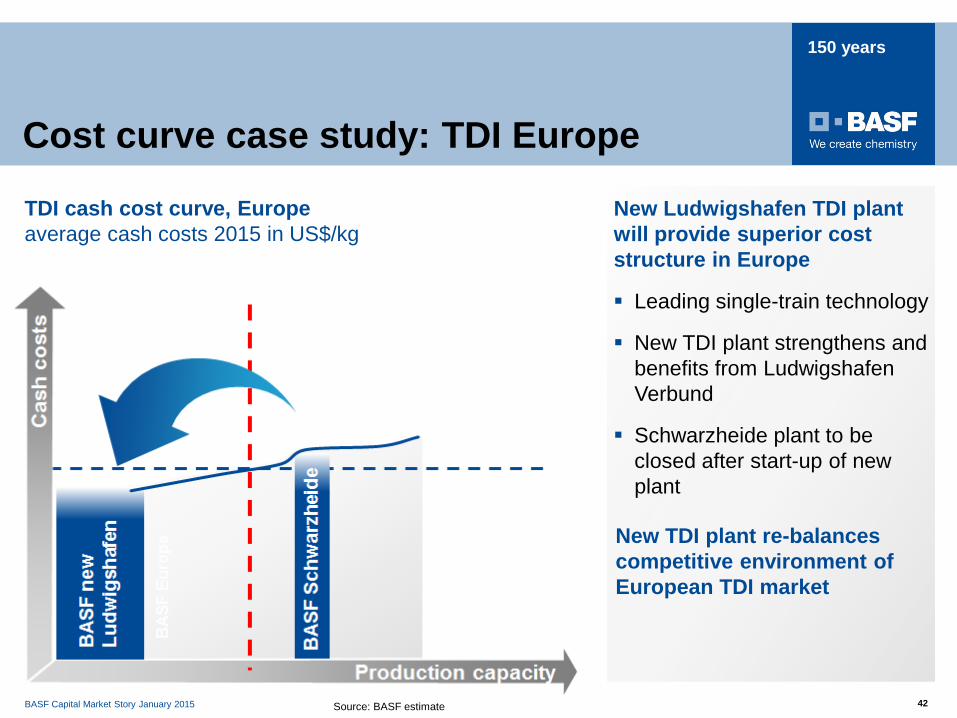
Leading single-train technology
New TDI plant strengthens and benefits from Ludwigshafen Verbund
Schwarzheide plant to be closed after start-up of new plant
New TDI plant re-balances competitive environment of European TDI market
Source: BASF estimate
TDI cash cost curve, Europe average cash costs 2015 in US$/kg
New Ludwigshafen TDI plant will provide superior cost structure in Europe
Cost curve case study: TDI Europe
BASF Capital Market Story January 2015 43
150 years
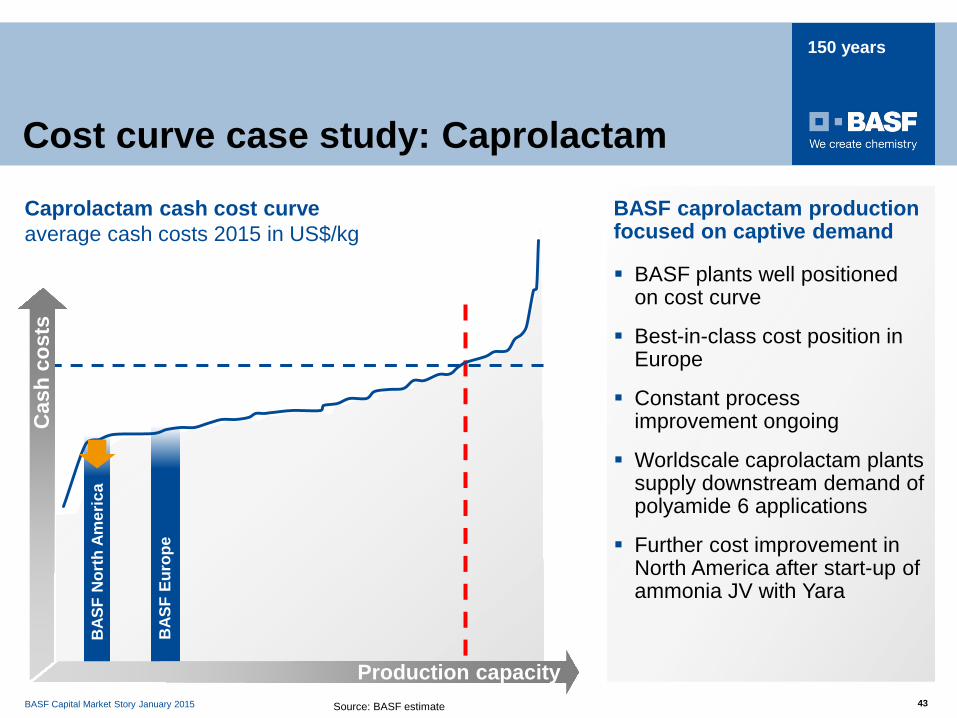
BASF caprolactam production focused on captive demand
BASF plants well positioned on cost curve
Best-in-class cost position in Europe
Constant process improvement ongoing
Worldscale caprolactam plants supply downstream demand of polyamide 6 applications
Further cost improvement in North America after start-up of ammonia JV with Yara
Caprolactam cash cost curve average cash costs 2015 in US$/kg
BAS
F N
orth
Am
eric
a
BAS
F Eu
rope
Production capacity
Cas
h co
sts
Cost curve case study: Caprolactam
Source: BASF estimate
BASF Capital Market Story January 2015 44
150 years
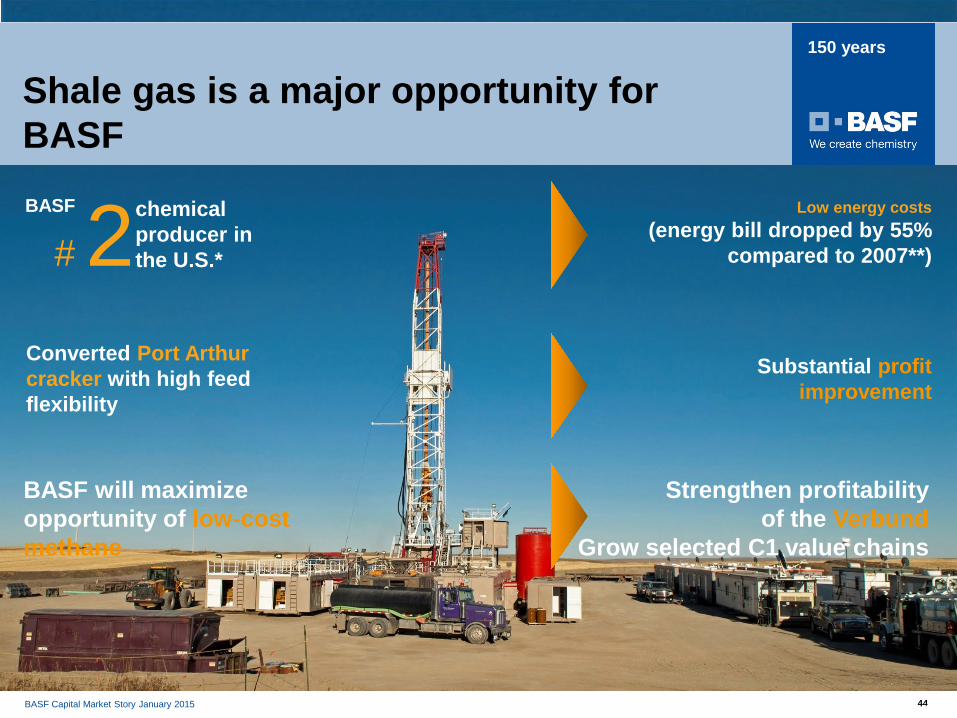
Converted Port Arthur cracker with high feed flexibility
# 2 chemical producer in the U.S.*
BASF
Shale gas is a major opportunity for BASF
Low energy costs (energy bill dropped by 55%
compared to 2007**)
Substantial profit improvement
BASF will maximize opportunity of low-cost methane
Strengthen profitability of the Verbund
Grow selected C1 value chains
* Based on sales to local customers ** U.S. data only, normalized costs for natural gas for energy production 44
BASF Capital Market Story January 2015 45
150 years
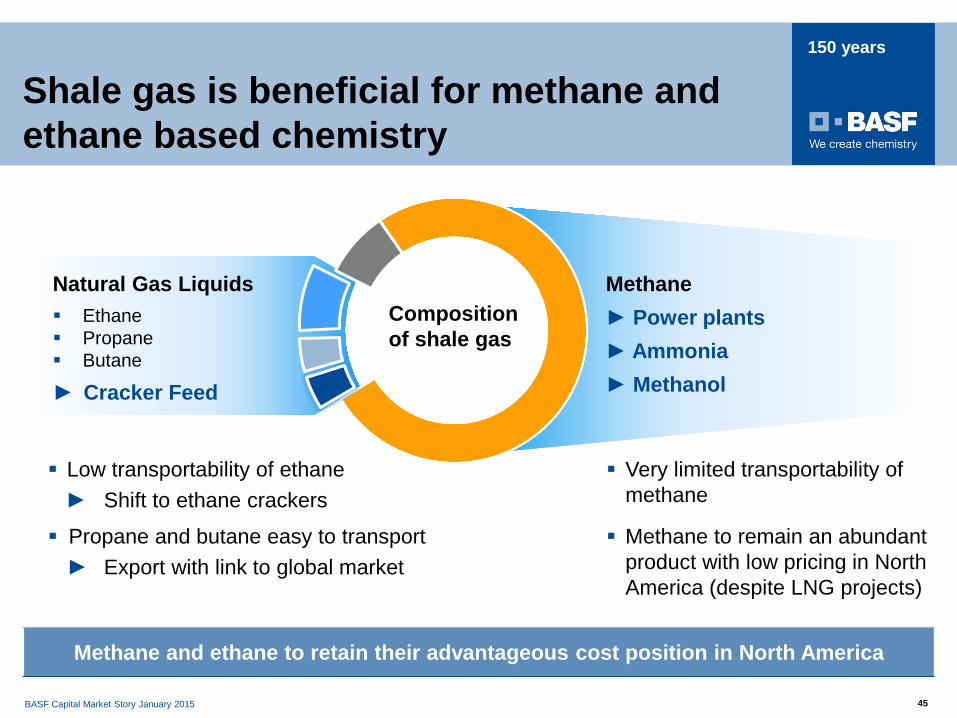
Natural Gas Liquids Ethane Propane Butane
► Cracker Feed
Shale gas is beneficial for methane and ethane based chemistry
Methane and ethane to retain their advantageous cost position in North America
Low transportability of ethane ► Shift to ethane crackers
Propane and butane easy to transport ► Export with link to global market
Very limited transportability of methane
Methane to remain an abundant product with low pricing in North America (despite LNG projects)
Methane ► Power plants ► Ammonia ► Methanol
Composition of shale gas
BASF Capital Market Story January 2015 46
150 years
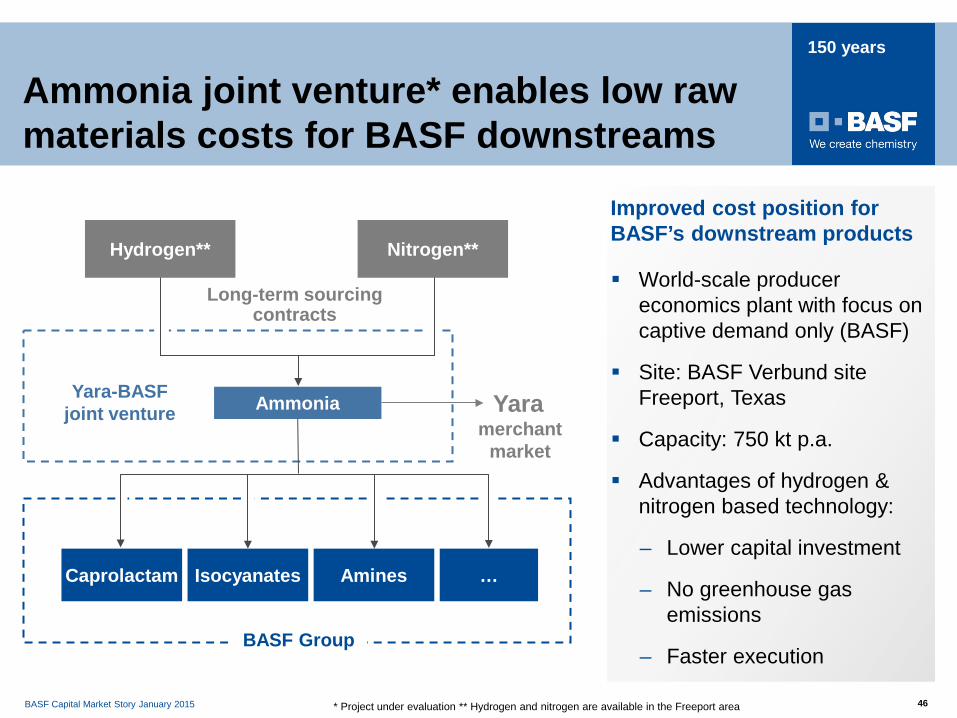
Ammonia joint venture* enables low raw materials costs for BASF downstreams
World-scale producer economics plant with focus on captive demand only (BASF)
Site: BASF Verbund site Freeport, Texas
Capacity: 750 kt p.a.
Advantages of hydrogen & nitrogen based technology:
– Lower capital investment
– No greenhouse gas emissions
– Faster execution
Improved cost position for BASF’s downstream products
Caprolactam Isocyanates Amines
Yara
…
Long-term sourcing contracts
Yara-BASF joint venture
BASF Group
Ammonia
Nitrogen** Hydrogen**
merchant market
* Project under evaluation ** Hydrogen and nitrogen are available in the Freeport area
BASF Capital Market Story January 2015 47
150 years
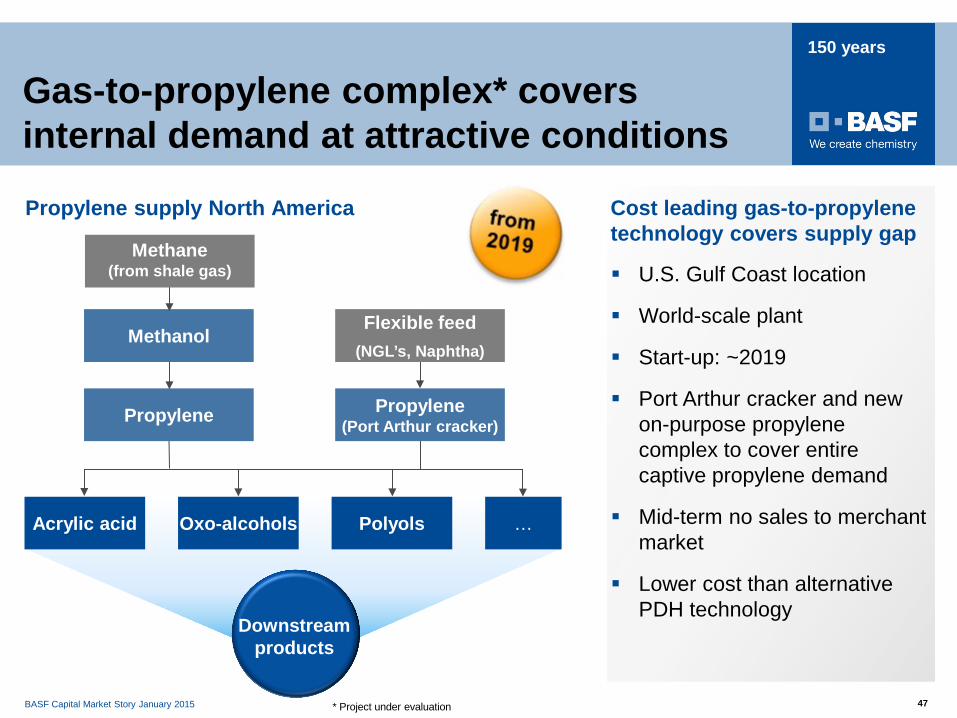
Gas-to-propylene complex* covers internal demand at attractive conditions
U.S. Gulf Coast location
World-scale plant
Start-up: ~2019
Port Arthur cracker and new on-purpose propylene complex to cover entire captive propylene demand
Mid-term no sales to merchant market
Lower cost than alternative PDH technology
Cost leading gas-to-propylene technology covers supply gap
Propylene supply North America
Acrylic acid Oxo-alcohols Polyols …
Propylene Propylene (Port Arthur cracker)
Downstream products
Methanol
Methane (from shale gas)
Flexible feed (NGL’s, Naphtha)
* Project under evaluation
BASF Capital Market Story January 2015 48
Appendix II:
Oil & Gas
BASF Capital Market Story January 2015 49
150 years
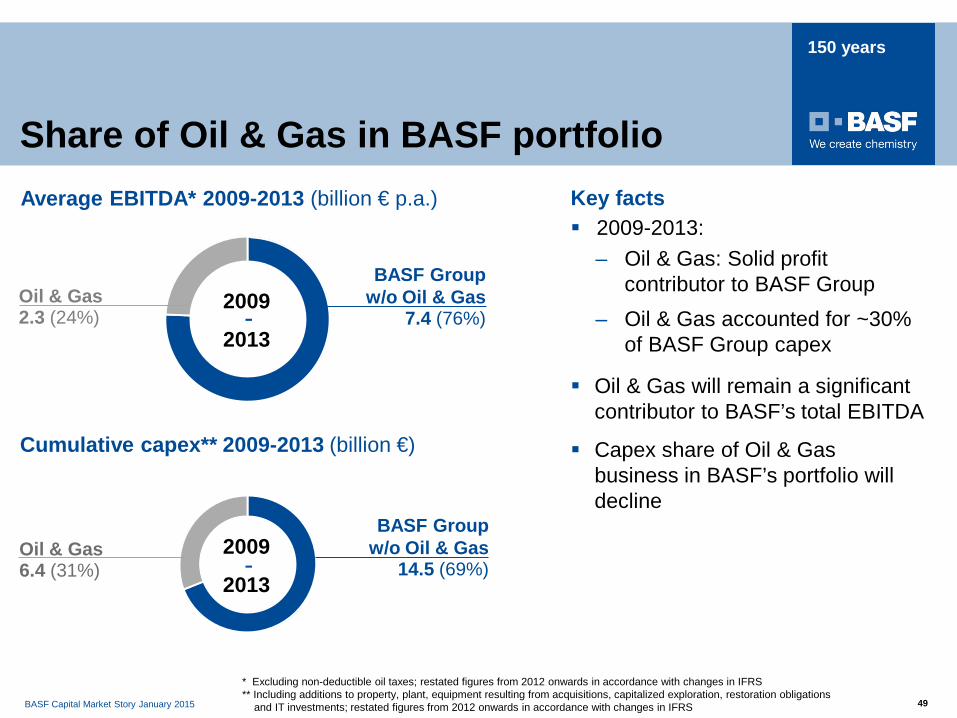
2009
2013
Cumulative capex** 2009-2013 (billion €)
BASF Group w/o Oil & Gas
7.4 (76%)
BASF Group w/o Oil & Gas
14.5 (69%)
Oil & Gas 2.3 (24%)
Oil & Gas 6.4 (31%)
2009
2013 -
-
Average EBITDA* 2009-2013 (billion € p.a.)
* Excluding non-deductible oil taxes; restated figures from 2012 onwards in accordance with changes in IFRS ** Including additions to property, plant, equipment resulting from acquisitions, capitalized exploration, restoration obligations and IT investments; restated figures from 2012 onwards in accordance with changes in IFRS
2009-2013: – Oil & Gas: Solid profit
contributor to BASF Group – Oil & Gas accounted for ~30%
of BASF Group capex
Oil & Gas will remain a significant contributor to BASF’s total EBITDA
Capex share of Oil & Gas business in BASF’s portfolio will decline
Key facts
Share of Oil & Gas in BASF portfolio
BASF Capital Market Story January 2015 50
150 years
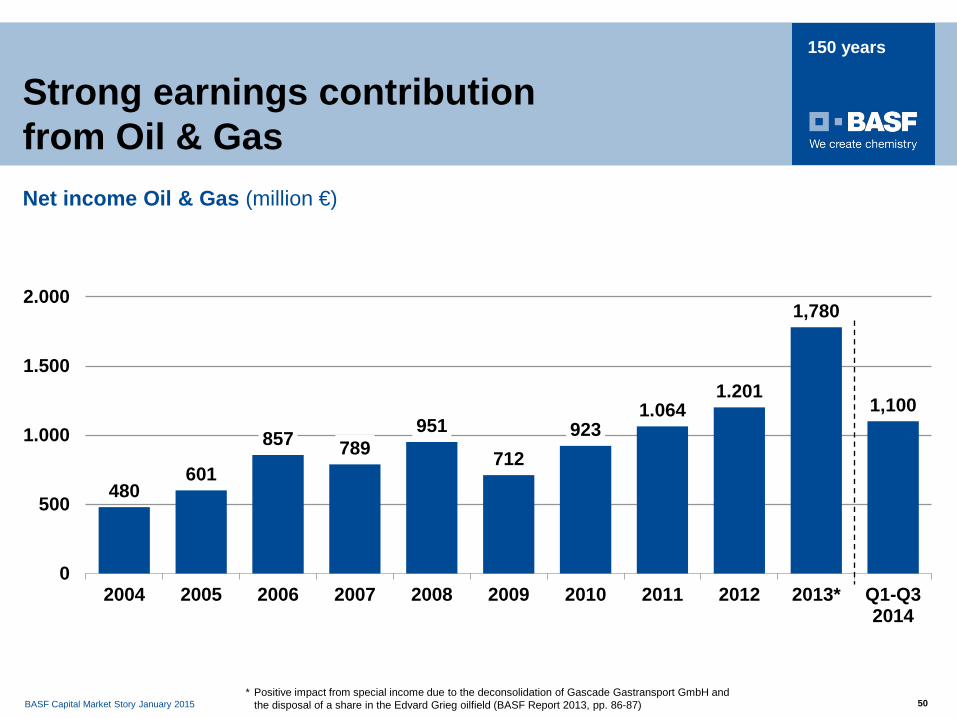
Strong earnings contribution from Oil & Gas
* Positive impact from special income due to the deconsolidation of Gascade Gastransport GmbH and the disposal of a share in the Edvard Grieg oilfield (BASF Report 2013, pp. 86-87)
480 601
857 789 951
712 923
1.064 1.201
1,780
1,100
0
500
1.000
1.500
2.000
2004 2005 2006 2007 2008 2009 2010 2011 2012 2013* Q1-Q32014
Net income Oil & Gas (million €)
BASF Capital Market Story January 2015 51
150 years
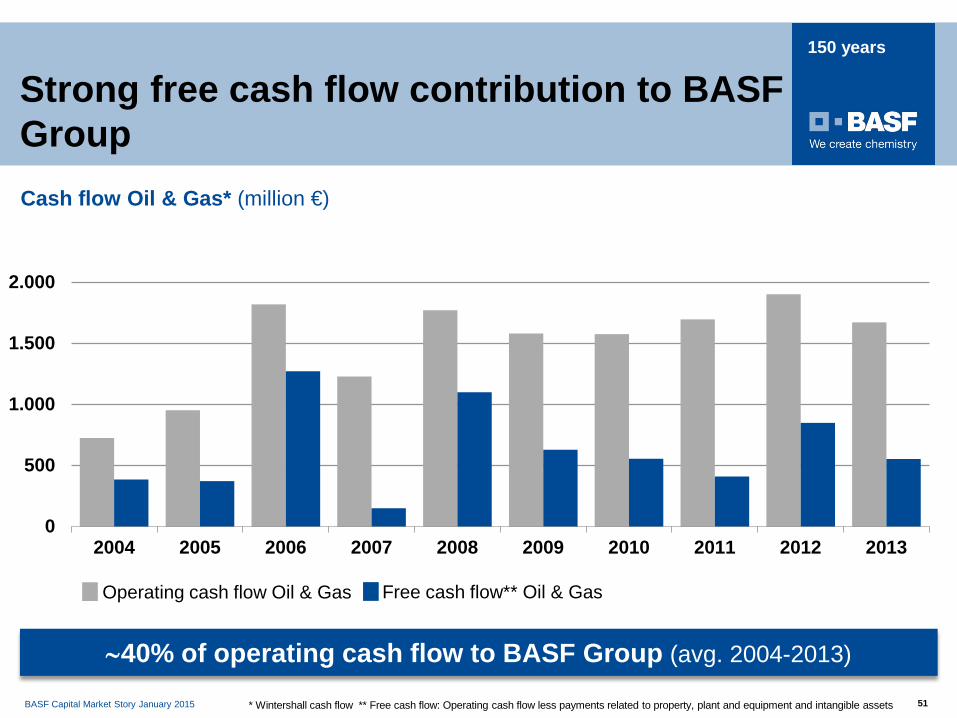
Strong free cash flow contribution to BASF Group
Cash flow Oil & Gas* (million €)
0
500
1.000
1.500
2.000
2004 2005 2006 2007 2008 2009 2010 2011 2012 2013
Operating cash flow Oil & Gas
* Wintershall cash flow ** Free cash flow: Operating cash flow less payments related to property, plant and equipment and intangible assets
Free cash flow** Oil & Gas
∼40% of operating cash flow to BASF Group (avg. 2004-2013)

BASF Capital Market Story January 2015 52
150 years
Oil & Gas value chain
Upstream Downstream
Exploration / Development / Production Transport Storage / Trading
Midstream Upstream
Oil & Gas – Focus on upstream activities
BASF Capital Market Story January 2015 53
150 years
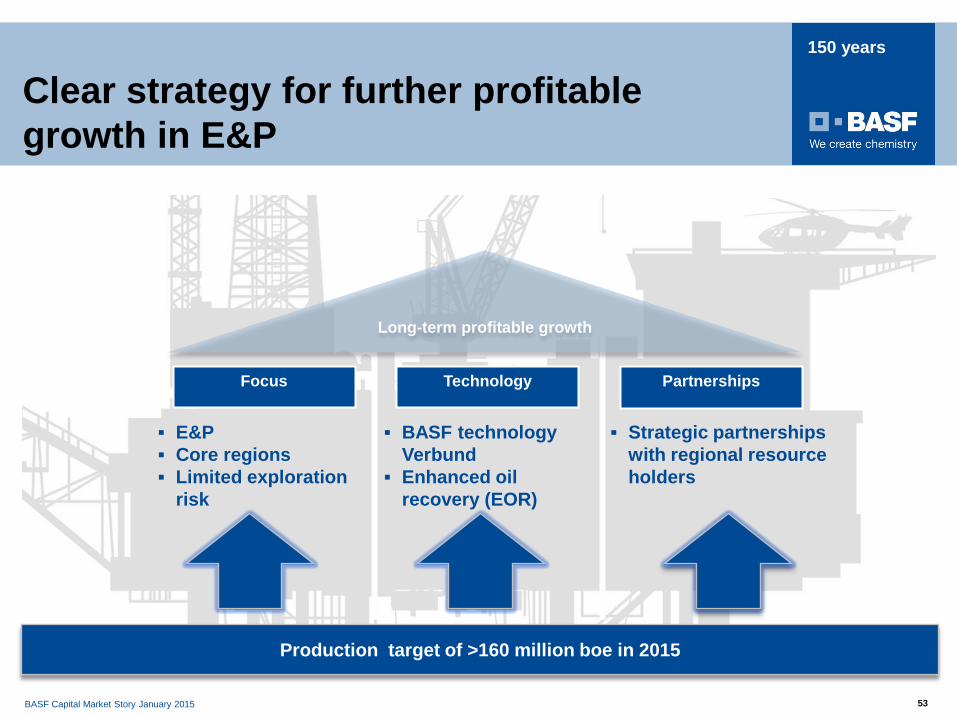
Clear strategy for further profitable growth in E&P
Production target of >160 million boe in 2015
Focus Technology Partnerships
BASF technology Verbund
Enhanced oil recovery (EOR)
Strategic partnerships with regional resource holders
Long-term profitable growth
E&P Core regions Limited exploration
risk
BASF Capital Market Story January 2015 54
150 years
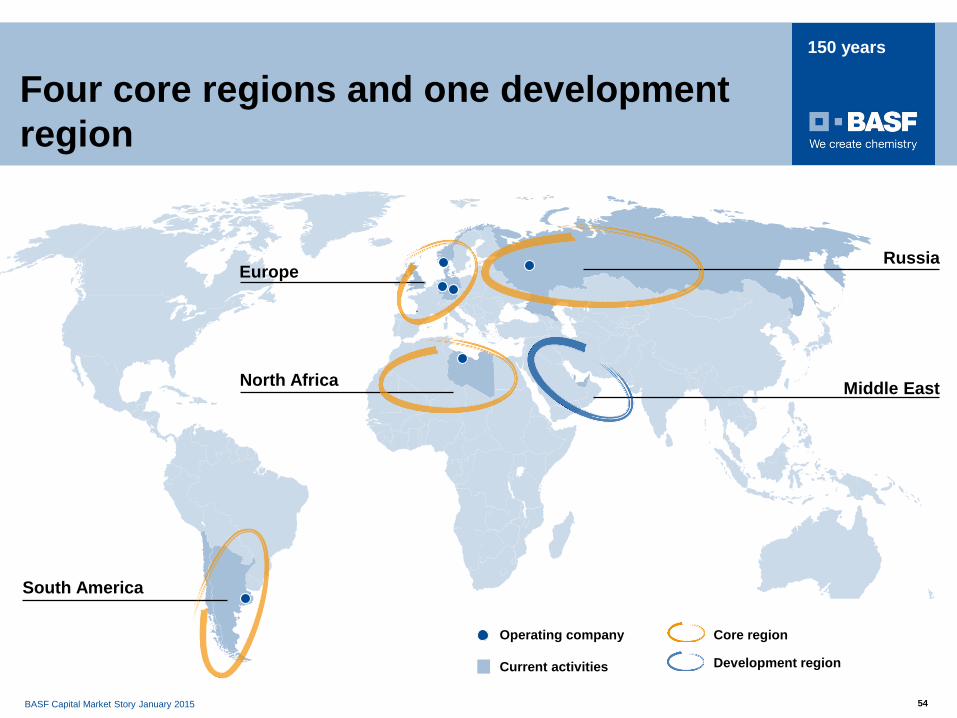
Four core regions and one development region
North Africa
Europe Russia
Middle East
South America
Core region
Development region
Operating company
Current activities
.
BASF Capital Market Story January 2015 55
150 years
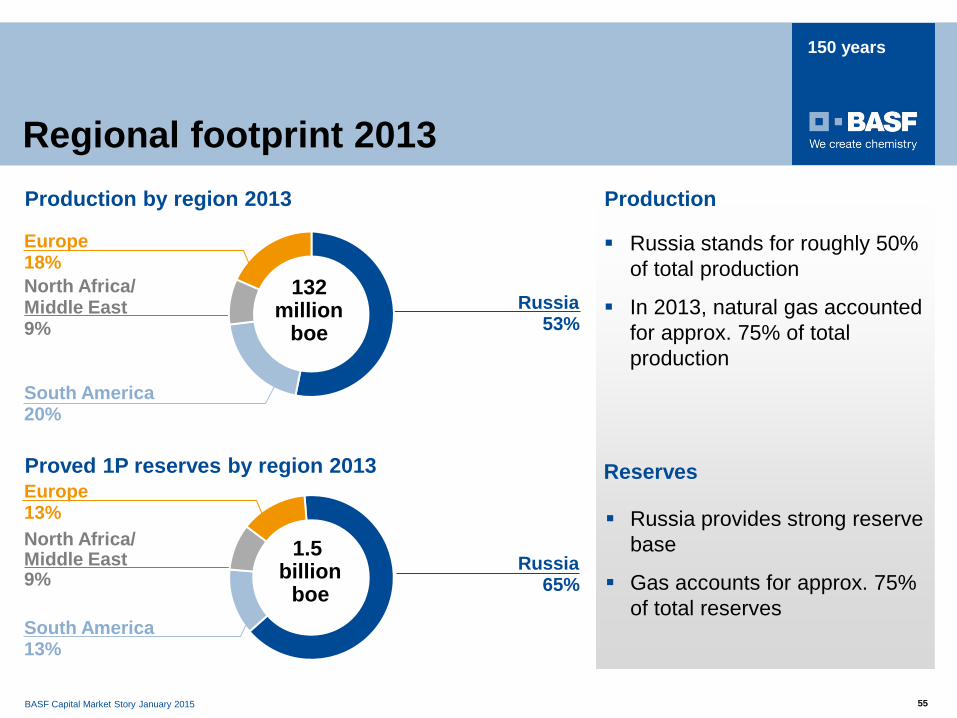
Regional footprint 2013
Russia stands for roughly 50% of total production
In 2013, natural gas accounted for approx. 75% of total production
Production
Russia provides strong reserve base
Gas accounts for approx. 75% of total reserves
Reserves
Russia 53%
North Africa/ Middle East 9%
Europe 18%
South America 20%
132 million
boe
North Africa/ Middle East 9%
Europe 13%
South America 13%
Proved 1P reserves by region 2013
1.5 billion
boe Russia
65%
Production by region 2013
BASF Capital Market Story January 2015 56
150 years
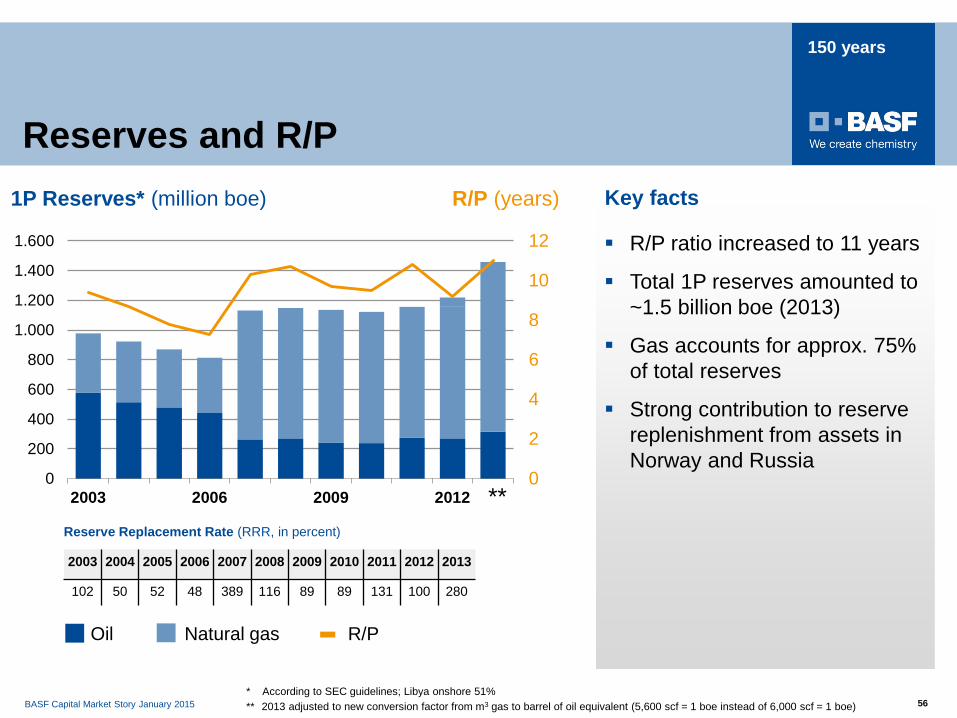
R/P ratio increased to 11 years
Total 1P reserves amounted to ~1.5 billion boe (2013)
Gas accounts for approx. 75% of total reserves
Strong contribution to reserve replenishment from assets in Norway and Russia
Key facts 1P Reserves* (million boe) R/P (years)
Oil Natural gas R/P
* According to SEC guidelines; Libya onshore 51%
Reserve Replacement Rate (RRR, in percent)
2003 2004 2005 2006 2007 2008 2009 2010 2011 2012 2013
102 50 52 48 389 116 89 89 131 100 280
** 2013 adjusted to new conversion factor from m3 gas to barrel of oil equivalent (5,600 scf = 1 boe instead of 6,000 scf = 1 boe)
0
2
4
6
8
10
12
0
200
400
600
800
1.000
1.200
1.400
1.600
2003 2006 2009 2012 **
Reserves and R/P
BASF Capital Market Story January 2015 57
150 years
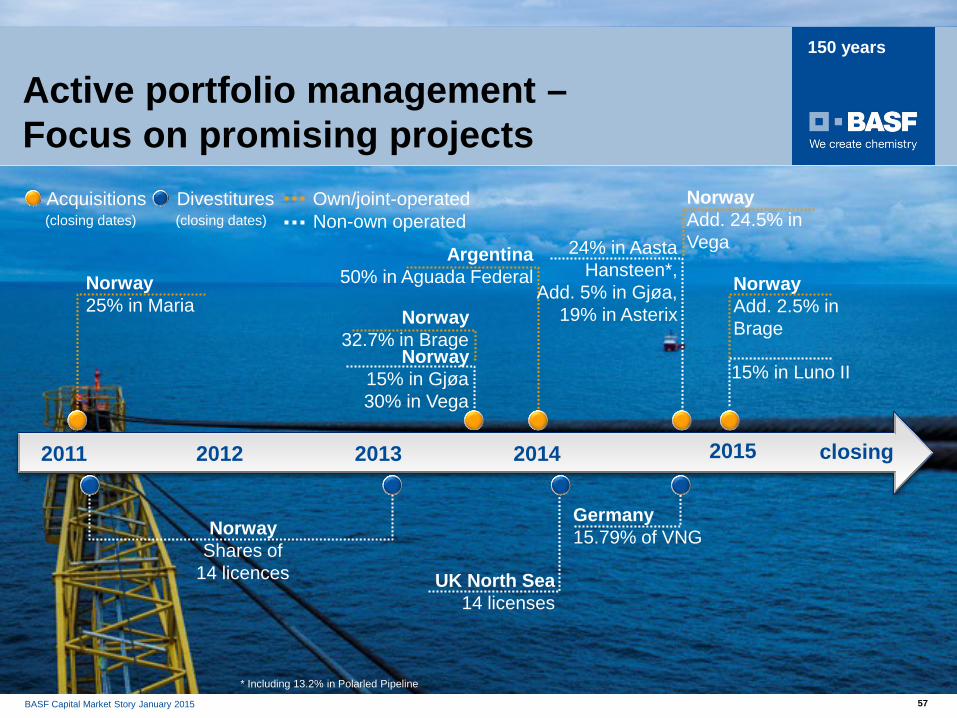
Norway 25% in Maria Norway
32.7% in Brage
Active portfolio management – Focus on promising projects
UK North Sea 14 licenses
15% in Luno II
Norway Add. 2.5% in Brage
Argentina 50% in Aguada Federal
Germany 15.79% of VNG
Acquisitions
57
Norway 15% in Gjøa 30% in Vega
(closing dates) Own/joint-operated Divestitures
(closing dates) Norway Add. 24.5% in Vega 24% in Aasta
Hansteen*, Add. 5% in Gjøa,
19% in Asterix
Non-own operated
Norway Shares of
14 licences
* Including 13.2% in Polarled Pipeline
2011 2013 2012 2014 2015 closing
BASF Capital Market Story January 2015 58
150 years
Recent transaction with Statoil Strategic rationale of the transaction
* Pipeline project will provide route for produced gas from Aasta Hansteen field to onshore processing facilities
To strengthen Wintershall’s position in Norway by increasing participation in producing oil and gas fields
To participate jointly with Statoil in promising development project “Aasta Hansteen”
To get access to additional reserves and resources (2P/2C) of ~170 million boe and assets with material exploration perspectivity
To increase production of Wintershall Norge from currently around 40,000 boe/day to about 60,000 boe/day
To expand position as field operator in Norway and to gain experience with subsea operations by taking over operatorship in the Vega field*
To significantly increase Wintershall’s EBIT and future operating cash flow
BASF Capital Market Story January 2015 59
150 years
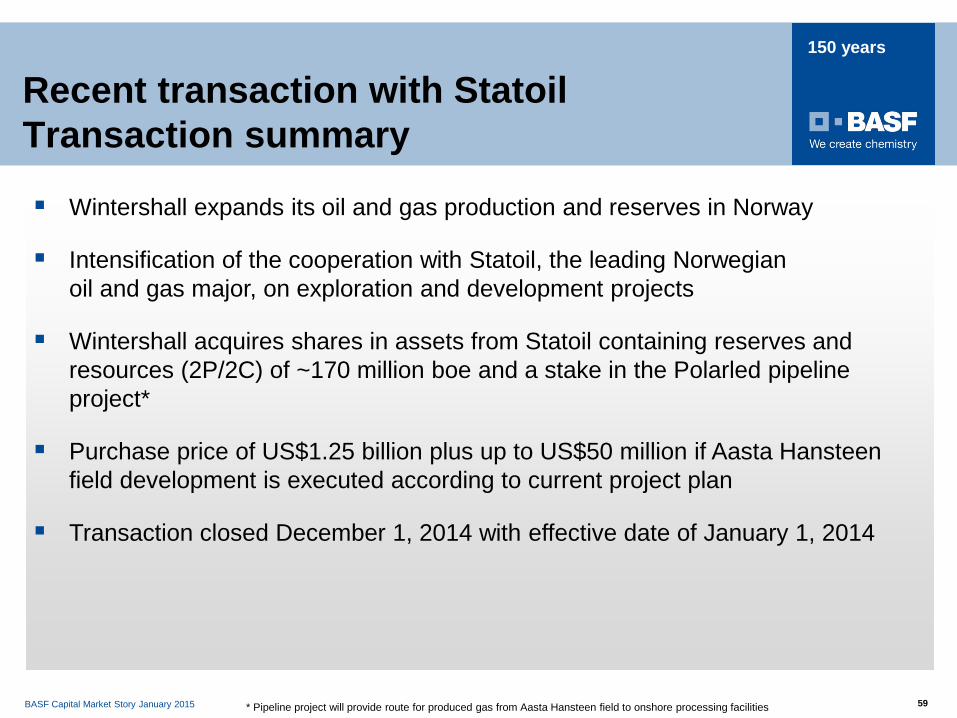
Wintershall expands its oil and gas production and reserves in Norway
Intensification of the cooperation with Statoil, the leading Norwegian oil and gas major, on exploration and development projects
Wintershall acquires shares in assets from Statoil containing reserves and resources (2P/2C) of ~170 million boe and a stake in the Polarled pipeline project*
Purchase price of US$1.25 billion plus up to US$50 million if Aasta Hansteen field development is executed according to current project plan
Transaction closed December 1, 2014 with effective date of January 1, 2014
Recent transaction with Statoil Transaction summary
* Pipeline project will provide route for produced gas from Aasta Hansteen field to onshore processing facilities
BASF Capital Market Story January 2015 60
150 years
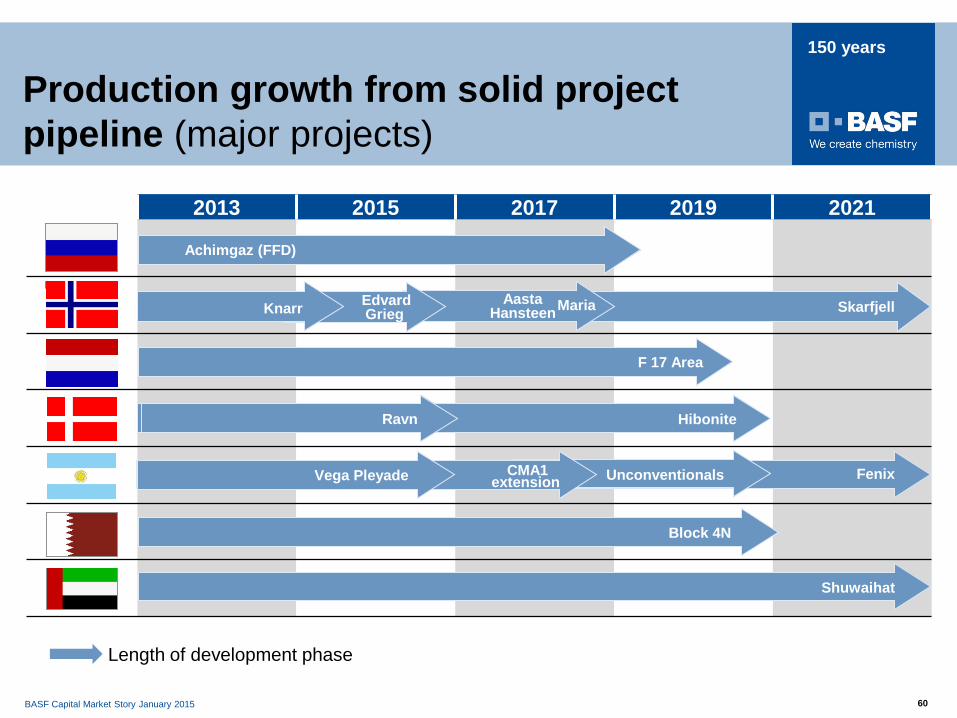
Production growth from solid project pipeline (major projects)
2013 2015 2017 2019 2021
Norway
Length of development phase
Skarfjell
Achimgaz (FFD)
Block 4N
Shuwaihat
F 17 Area
Hibonite Ravn
Fenix Unconventionals CMA1 extension Vega Pleyade
Maria Aasta Hansteen
Edvard Grieg Knarr
BASF Capital Market Story January 2015 61
150 years
150 years