BASF capital market story 10/2012
48
BASF Capital Market Story__October 2012 We add value as one company October 2012
-
Upload
basf -
Category
Investor Relations
-
view
1.047 -
download
2
Transcript of BASF capital market story 10/2012
BASF Capital Market Story__October 2012
We add value as one company
October 2012

BASF Capital Market Story__October 2012
This presentation includes forward-looking statements that are subject to risks and uncertainties, including those pertaining to the anticipated benefits to be realized from the proposals described herein. This presentation contains a number of forward-looking statements including, in particular, statements about future events, future financial performance, plans, strategies, expectations, prospects, competitive environment, regulation and supply and demand. BASF has based these forward-looking statements on its views with respect to future events and financial performance. Actual financial performance of the entities described herein could differ materially from that projected in the forward-looking statements due to the inherent uncertainty of estimates, forecasts and projections, and financial performance may be better or worse than anticipated. Given these uncertainties, readers should not put undue reliance on any forward-looking statements.
Forward-looking statements represent estimates and assumptions only as of the date that they were made. The information contained in this presentation is subject to change without notice and BASF does not undertake any duty to update the forward-looking statements, and the estimates and assumptions associated with them, except to the extent required by applicable laws and regulations.
Forward-looking statements
2

BASF Capital Market Story__October 2012
The leading chemical company worldwide
- Sales 2011: €73.5 billion
- EBIT before special items 2011: €8.4 billion
- ~111,000 employees
Customers in >200 countries and in virtually all industries
# 1-3 market position in over 75% of businesses
Unique Verbund concept for integrated production
- Six Verbund sites in all major regions
- Production sites in 41 countries
International, interdisciplinary R&D network - More than 10,000 employees in R&D
Highly experienced management team
- Senior executives from 36 countries
BASF today – The Chemical Company Facts & figures
3

BASF Capital Market Story__October 2012
Dispersions & Pigments Performance Chemicals Care Chemicals Nutrition & Health Paper Chemicals
Crop Protection
Inorganics Petrochemicals Intermediates
Catalysts Construction Chemicals Coatings
Chemicals
Functional Solutions Performance Products
Agricultural Solutions Oil & Gas Exploration & Production and
Natural Gas Trading
Percentage of sales 2011*
BASF today – a well-balanced portfolio Total sales 2011: €73.5 billion
Performance Polymers Polyurethanes
Plastics
* not depicted here: 9% of Group sales reported as ‘Other‘ 4

BASF Capital Market Story__October 2012
Business review BASF Today Trends Purpose and strategic principles Targets Strategic levers BASF Tomorrow – Board priorities
BASF Strategy: We create chemistry__November 2011
Business review
BASF strategy & growth targets
Strategic levers
Fit for 2020

BASF Capital Market Story__October 2012
Sales €19.0 billion +8% EBITDA €2.8 billion +4% EBIT before special items €2.1 billion +5% EBIT €2.0 billion +6%
Net income €0.9 billion (21%) EPS €1.03 (21%) Adjusted EPS €1.19 (22%)
Business performance Q3’12 vs. Q3’11
BASF maintains good business performance in Q3 2012
Favorable business development in Agricultural Solutions and Oil & Gas Earnings in chemical activities did not match the previous year’s level
Sales development Period Volumes Prices Portfolio Currencies
Q3’12 vs. Q3’11 7% (4%) (1)% 6%
6

BASF Capital Market Story__October 2012
Strong free cash flow generation
* Cash provided by operating activities less capex (in 2005 before CTA) ** 2009 adjusted for re-classification of settlement payments for currency derivatives
2.8 2.6
3.3 3.5 3.2
2.53.2
2.4
2002 2003 2004 2005 2006 2007 2008 2009** 2010 2011 Q1-Q32012
Free cash flow* in billion €
3.9 3.7
-0.1
7

BASF Capital Market Story__October 2012
Delivering attractive shareholder returns
€2.50 dividend per share for 2011, dividend yield 4.6%*
15% average annual dividend increase for 2002-2011 period
Dividend yield above 3% in any given year since 2002, total payout €14.5 billion
Dividend per share in €
* Dividend yield based on share price at year-end
Dividend payments
3.7% 3.2% 3.1% 4.1% 3.8% 7.0% 3.9%
Dividend yield* 4.6% 3.9% 3.1%
2.50
Between 1999 & 2008, BASF bought back 28.65% of shares outstanding, spent €9.9 billion
AGM 2012 approved new share buy-back program; up to 10% of shares, 5 years
Share buy-backs 0.70 0.70
0.851.00
1.50
1.95 1.951.70
2.20
2002 2003 2004 2005 2006 2007 2008 2009 2010 2011
8

BASF Capital Market Story__October 2012
Delivering consistent, long-term value
Average annual performance with dividends reinvested
0 5 10 15 20
Euro Stoxx 50
DAX 30
MSCI World Chemicals
+10.0%
Last 5 years October 2007 – September 2012
+ 11.0%
-7.8%
-1.7%
+1.4%
Last 10 years October 2002 – September 2012
BASF
+10.6%
+4.1%
+18.3%
9

BASF Capital Market Story__October 2012
Outlook 2012 confirmed
For the FY 2012, BASF aims to exceed the record levels of sales and EBIT before special items achieved in 2011
BASF will strive again to earn a high premium on cost of capital
Chemical activities - We do not expect demand to pick up in the fourth quarter 2012 - Therefore, 2012 EBIT before special items of chemical activities will come in below the level of the
previous year.
Outlook 2012
GDP: +2.2% (before: 2.3%)
Industrial production: +2.8% (before: 3.4%)
Chemical production: +2.9% (before: 3.5%)
US$/Euro: 1.30 (unchanged)
Oil price (US$/bbl): 110 (unchanged)
Assumptions 2012
10

BASF Capital Market Story__October 2012
Business review BASF Today Trends Purpose and strategic principles Targets Strategic levers BASF Tomorrow – Board priorities
BASF Strategy: We create chemistry__November 2011
Business review
BASF strategy & growth targets
Strategic levers
Fit for 2020

BASF Capital Market Story__October 2012
Demographic challenges … set the stage for the future of the chemical industry
Nine billion people in 2050 but only one earth
Resources, Environment & Climate Food & Nutrition Quality of Life
Chemistry as enabler
12

BASF Capital Market Story__October 2012
Key trends for the chemical industry
Integrated chemical companies remain cornerstone
Emerging markets players grow quickly
Raw material players invest further downstream
Competitive landscape will change
Use opportunities from sustainability
Increase resource efficiency
Renewables as raw materials
Stakeholder dialog
Sustainability as strategic driver
Chemistry as enabler
Chemical products replace traditional materials
Create innovative sustainable solutions
Innovation gains in importance
Growth will accelerate
Industrial production > GDP
Chemical production > GDP
Emerging markets will outgrow developed markets
Chemical industry remains an attractive growth industry
13

BASF Capital Market Story__October 2012
Striving for strong profitable growth Medium- and long-term sales target*
Sales** in billion €
64
2010 Target 2020
Target 2015
Investments
Acquisitions Innovations
Investments
Acquisitions Innovations
~85
~115
We aim to grow 6 percent p.a.; 2 percentage points above chemical production outperform chemical production by * Published on November 29, 2011
** Potential impact of IFRS changes not included 14

BASF Capital Market Story__October 2012
Striving for strong profitable growth All regions will deliver profitable growth
Regional sales targets 2020* (by location of customers) in billion €
North America
2010 2020
13
~5.5% p.a. ~22
South America, Africa, Middle East
~8% p.a.
5 ~11
Europe
~4.5% p.a.
33
~53
Asia Pacific
~8% p.a.
13 ~29
2010 2020
2010 2020 2010 2020
19%** 20%** 46%** 52%**
25%** 20%** 10%** 8%**
* Published on November 29, 2011 ** Percentage of total sales 15

BASF Capital Market Story__October 2012
Sales BASF Group excluding Oil & Gas in billion € by location of customer
Developed markets*
Emerging markets
* BASF definition: Developed markets include EU15, Norway, Switzerland, North America, Japan, Australia, New Zealand
Target 2020: ~45% sales share of Emerging Markets
28 22%
34%
61
45%
Striving for strong profitable growth Sales share of emerging markets to keep growing
16

BASF Capital Market Story__October 2012
Striving for strong profitable growth Doubling EBITDA by 2020*
EBITDA** in billion €
2010 Target 2020
Target 2015
11.1
~23
~15 Op. Excellence
Growth
Acquisitions
Op. Excellence
Growth
Acquisitions
* Published on November 29, 2011 ** Assumptions 2010-2020: Exchange rate $/€ Ø 1.40, Oil price Ø $110/bbl 17

BASF Capital Market Story__October 2012
Business review BASF Today Trends Purpose and strategic principles Targets Strategic levers BASF Tomorrow – Board priorities
BASF Strategy: We create chemistry__November 2011
Business review
BASF strategy & growth targets
Strategic levers – Portfolio development
– Market approach – Innovations for a sustainable future – Investments – Acquisitions – Operational excellence
Fit for 2020

BASF Capital Market Story__October 2012
Chemistry as key enabler for functionalized materials & solutions
Deep understanding of customer value chains required
New molecules
Improved applications
Functionalized materials & solutions
1960 1970 1980 1990 2000 2010 2020
Batteries, membranes ...
Portfolio development We expand from chemicals to chemistry
19

BASF Capital Market Story__October 2012
Crop protection Engineering plastics Electronic chemicals Custom synthesis Catalysts Construction chemicals Water-based resins Pigments Plastic additives Oil & Gas Personal care & food Battery materials
BASF core business
Strong partnerships
Gazprom Monsanto Petronas Shell Sinopec Total
Selected transactions 2001 − today
Acquisitions
~ €15bn sales ~ €10bn sales*
Divestitures
Pharma Fibers Printing systems Polyolefins Polystyrene Americas Agro generics Vitamins premix Fertilizers Styrenics (transferred into
Styrolution JV on Oct. 1, 2011)
* without Styrenics
Portfolio development Towards more market driven and innovative businesses
20

BASF Capital Market Story__October 2012
Portfolio development Moving downstream towards customer industries
* Agriculture, Construction, Consumer Goods, Health & Nutrition, Electronics, Energy & Resources, Transportation ** Sales excluding Oil & Gas
Functionalized Materials & Solutions Customized Products Classical Chemicals
2020 in % of sales**
Chemical Industry First customer industries*
2010 in % of sales**
~ 40%
~ 30% ~ 70%
2001 in % of sales**
~ 50%
~ 60%
~ 50%
21

BASF Capital Market Story__October 2012
BASF sales by first customer industry*
Bubble Size: BASF divisional sales by first customer industry (2010)**
> 15 %
< 10 %
< 10 %
> 15 %
Inorganics Petro- chemicals
Construction Chemicals
Dispersions & Pigments
Catalysts Intermediates Coatings Care Chemicals
Performance Polymers
Poly- urethanes
Performance Chemicals
Paper Chemicals
Consumer goods
Transportation
Construction
Energy & Resources
Market approach Cross-divisional customer industry approach
22
* Excluding Oil & Gas and Other ** Excluding Agricultural Solutions, Health & Nutrition, Oil & Gas and Other
BASF Capital Market Story__October 2012
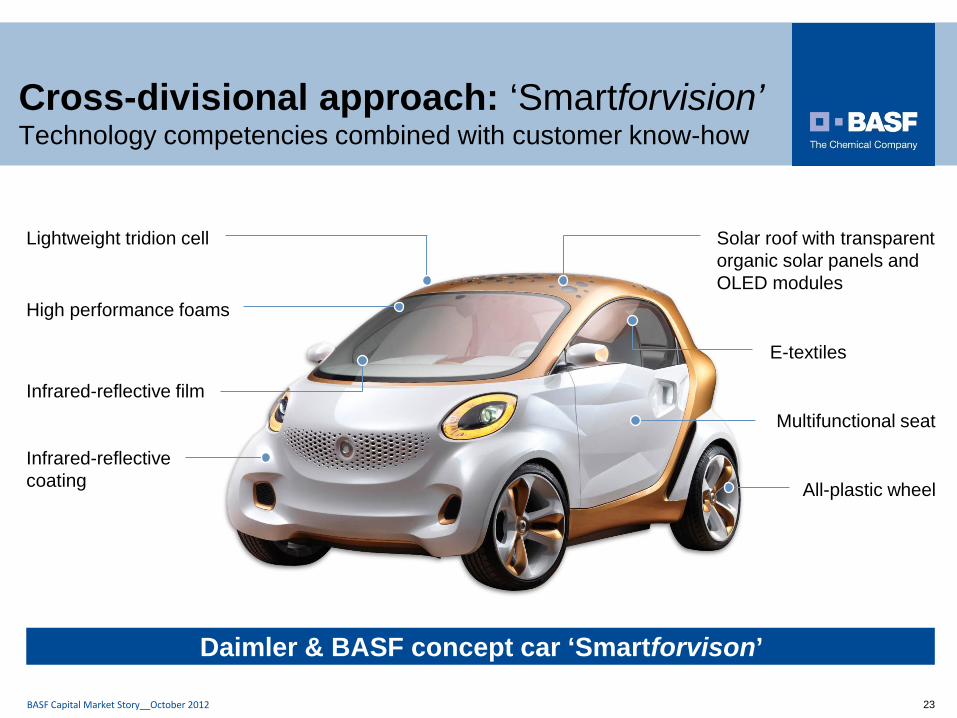
E-textiles
Solar roof with transparent organic solar panels and OLED modules
Multifunctional seat
Infrared-reflective coating
Infrared-reflective film
High performance foams
Lightweight tridion cell
All-plastic wheel
Cross-divisional approach: ‘Smartforvision’ Technology competencies combined with customer know-how
Daimler & BASF concept car ‘Smartforvison’
23

BASF Capital Market Story__October 2012
Potential Increased incremental oil recovery of up to 10% on
waterflooding. Sales potential to be defined after completion of trials
Approach Leverage BASF’s Verbund knowhow in white
biotechnology for Oil & Gas production Proprietary biopolymer from Schizophyllum fungus allows
for enhanced oil recovery due to its high viscosifying efficiency
Biopolymer is stable in high temperature and high salinity reservoirs
Current activities Schizophyllan biopolymer to be produced at BASF
Ludwigshafen via fermentation. First trial in mature Wintershall oil field starting in 2012 (Bockstedt, Germany)
Cross-divisional approach Biopolymer for enhanced oil recovery
Schizophyllan biopolymer
Schizophyllum commune
24

BASF Capital Market Story__October 2012
Cross-divisional approach ecovio biodegradable plastic in paper applications
Business potential 2020 Market size: opportunity to substitute > 200 kt of
various products Sales potential for BASF: ~€40 million
(ecovio FS Paper for extrusion coating) Additional business opportunities in wet-end
applications under evaluation
Concept Leverage BASF know-how on biodegradable plastics
and paper chemicals to offer sustainable solutions for packaging and foodservice ware
Current activities ecovio FS Paper launched in various markets since 2010 Business Model for sustainable „Closed System“
throughout whole value chain (incl. waste management) R&D-projects for additional applications and solutions
25

BASF Capital Market Story__October 2012
Innovations for a sustainable future Commitment to R&D
€1.6 billion R&D expenditures in 2011 (2010: €1.5 billion)
~10,100 employees in R&D
~2,800 projects
Research Verbund: About 1,950 partnerships with universities, start-ups and industry partners
Increase of R&D spending to €1.7 billion planned for 2012
24%
1%
Corporate Research 23%
Agricultural Solutions
26%
Functional Solutions 12%
Performance Products 21%
Chemicals 8%
Plastics 9%
€1.6 billion
Oil & Gas 1%
Target: €30 billion in sales from innovations younger than 10 years
Total R&D expenditures 2011 in billion €
Strong commitment to R&D
26

BASF Capital Market Story__October 2012
Sustainability in customer industries will drive our innovative growth fields
Health & Nutrition
Consumer Goods Construction Transportation Electronics Energy &
Resources Agriculture
Customer industries
Energy management
Water solutions
Wind energy
Rare earth metals
recycling
Heat management
Enzymes Plant biotechnology
Batteries for mobility
Lightweight composites
Heat management
Functional crop care
Medical Organic electronics
Growth Fields*
* Including growth fields still under evaluation
Ongoing inflow of new growth fields
Innovations for a sustainable future Chemistry as an enabler for many customer industries
27

BASF Capital Market Story__October 2012
Growth Field examples
Business potential 2020*
Market size: >€20 billion
BASF sales potential: >€500 million
Market size: ~€20 billion
BASF sales potential: >€800 million
Market size: ~€11 billion gross trait value
BASF sales potential: €1.8 billion gross trait sales before partner share
Existing Activities
New global business unit for battery chemicals & materials
Electrode material plant being built in Ohio. Acquired Novolyte, Merck’s electrolytes, Ovonik, equity position in Sion Power
R&D network with academia Sites in US, China, Europe
BASF expertise and portfolio (high-performance flocculants, desalination and antifouling chemicals….)
Acquired inge water-technologies; membrane module systems
Invested into NanoH2O
BASF as Trait Technology Partner of leading trait and seed companies
Yield & Stress collaboration with Monsanto (corn, soy, cotton, canola and wheat)
Targets Become the leading supplier of battery materials
Target customers: Battery producers
Leading supplier of innovative water solutions
Forward integration into membrane technologies
Contribute to more efficient agriculture, healthier nutrition
Make Plant Biotechnology an operating division within the Agricultural Solutions segment
Batteries for mobility Plant biotechnology Water solutions
Innovations for a sustainable future BASF growth field examples
* Published on November 29, 2011 28

BASF Capital Market Story__October 2012
Future investments in € billlion
Thereof investments in emerging markets
Total investments
35-45%
15-20
30-40%
~15
2006 – 2010 2011 – 2015 2016 – 2020
10.9
~20%
Investments … will boost future organic growth
29

BASF Capital Market Story__October 2012
Expansion joint venture activities in Malaysia
Expansion Verbund site Nanjing, China*
MDI plant Chongqing, China
Acrylic acid complex, Brazil
Expansion oil & gas activities
* Memorandum of Understanding signed
TDI plant Ludwigshafen, Germany
Investments Major projects
30

BASF Capital Market Story__October 2012
Acquisitions … will contribute to profitable growth in the future
Provide a minimum return on investment of 8% after tax
Are EPS accretive by year three at the latest
Financial acquisition criteria
Generate profitable growth above the industry average
Are innovation-driven
Offer a special value proposition to customers
Reduce earnings cyclicality
Strategic acquisition criteria
We want to acquire businesses which …
31

BASF Capital Market Story__October 2012
BASF Group 2002–2011 Index
50
100
150
200
250
300
2002 2005 2008 2011
CAGR 2002 – 2011
10 %
10 %
4 %
EBITDA
Sales
Fixed costs
Operational excellence Strong track record
32
BASF Capital Market Story__October 2012
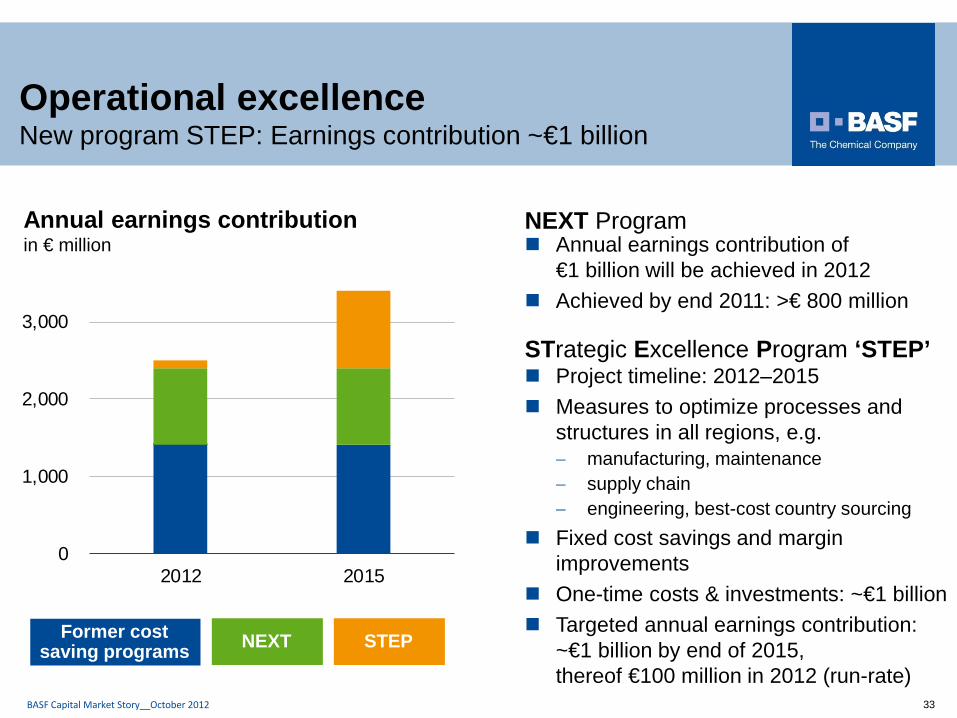
Operational excellence New program STEP: Earnings contribution ~€1 billion
Annual earnings contribution in € million
0
1,000
2,000
3,000
2012 2015
Former cost saving programs NEXT STEP
Project timeline: 2012–2015 Measures to optimize processes and
structures in all regions, e.g. − manufacturing, maintenance − supply chain − engineering, best-cost country sourcing
Fixed cost savings and margin improvements
One-time costs & investments: ~€1 billion Targeted annual earnings contribution:
~€1 billion by end of 2015, thereof €100 million in 2012 (run-rate)
NEXT Program
STrategic Excellence Program ‘STEP’
Annual earnings contribution of €1 billion will be achieved in 2012
Achieved by end 2011: >€ 800 million
33

BASF Capital Market Story__October 2012
Business review BASF Today Trends Purpose and strategic principles Targets Strategic levers BASF Tomorrow – Board priorities
BASF Strategy: We create chemistry__November 2011
Business review
BASF strategy & growth targets
Strategic levers
Fit for 2020

BASF Capital Market Story__October 2012
Key financial targets 2015 / 2020
Grow at least 2 percentage points above chemical production
Earn a premium on cost of capital of at least €2.5 billion on average p.a.
Profitability targets Growth targets
2015
2020
Sales ~€85 billion
Sales ~€115 billion
EBITDA ~€15 billion EPS ~€7.50
Double EBITDA to ~€23 billion (compared with 2010)
35

BASF Capital Market Story__October 2012
Appendix Business development Q3 2012

BASF Capital Market Story__October 2012 37
Chemicals Declining margins and plant shutdowns
Intermediates 767 +14%
Inorganics 485 +36%
Petrochemicals 2,304 +8%
€3,556 +12%
621
381467 436 459
0
200
400
600
800
Q3 Q4 Q1 Q2 Q3
EBIT before special items (million €)
2012 2011
Q3’12 segment sales (million €) vs. Q3’11
Sales development Period Volumes Prices Portfolio Currencies
Q3’12 vs. Q3’11 4% (9%) 10% 7%

BASF Capital Market Story__October 2012 38
Plastics Significantly weaker margins for polyamide precursors
Polyurethanes 1,655 +12%
Performance Polymers
1,314 (1%)
€2,969+6%
Sales development Period Volumes Prices Portfolio Currencies
Q3’12 vs. Q3’11 0% (1%) 1% 6%
Q3’12 segment sales (million €) vs. Q3’11
317
110
219256
218
0
200
400
Q3 Q4 Q1 Q2 Q3
EBIT before special items (million €)
2012 2011

BASF Capital Market Story__October 2012 39
Performance Products Competitive market environment and higher fixed costs
Performance Chemicals
933 +3%
Care Chemicals 1,233 (3%)
€4,015 +1%
Paper Chemicals 410 (3%)
Q3’12 segment sales (million €) vs. Q3’11
Nutrition & Health 492 +4% Dispersions
& Pigments 947
+2%
440
220
452 446
347
0
200
400
600
Q3 Q4 Q1 Q2 Q3
EBIT before special items (million €)
Sales development Period Volumes Prices Portfolio Currencies
Q3’12 vs. Q3’11 (2%) (2%) 0% 5%
2012 2011
BASF Capital Market Story__October 2012 40
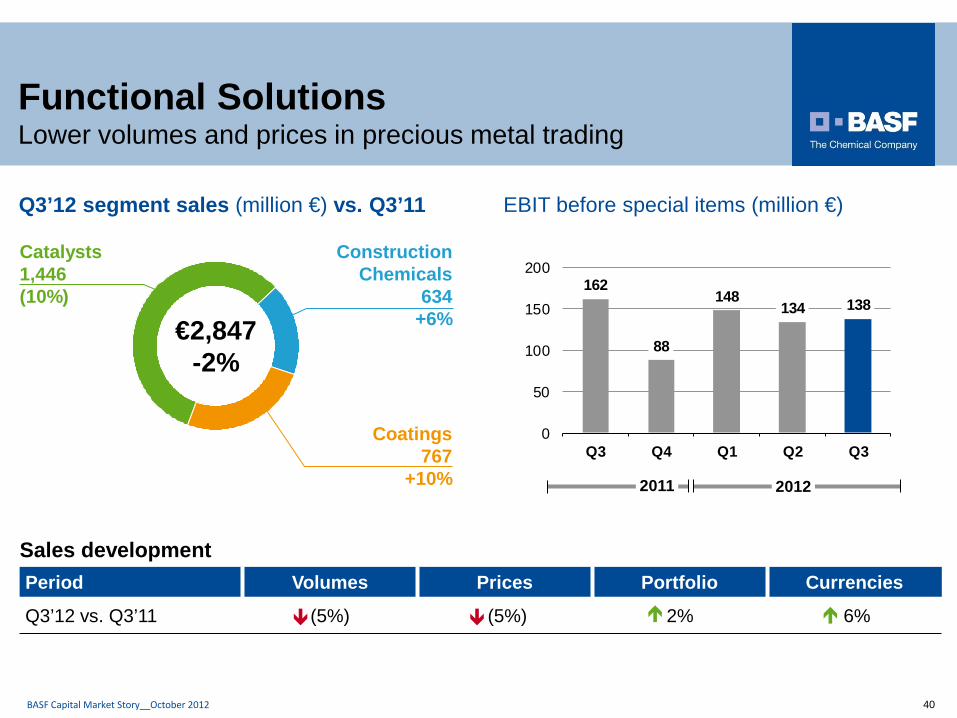
Functional Solutions Lower volumes and prices in precious metal trading
Catalysts 1,446 (10%)
Construction Chemicals
634 +6%
Coatings 767
+10%
€2,847 -2%
Q3’12 segment sales (million €) vs. Q3’11
162
88
148134 138
0
50
100
150
200
Q3 Q4 Q1 Q2 Q3
EBIT before special items (million €)
Sales development Period Volumes Prices Portfolio Currencies
Q3’12 vs. Q3’11 (5%) (5%) 2% 6%
2012 2011
BASF Capital Market Story__October 2012 41
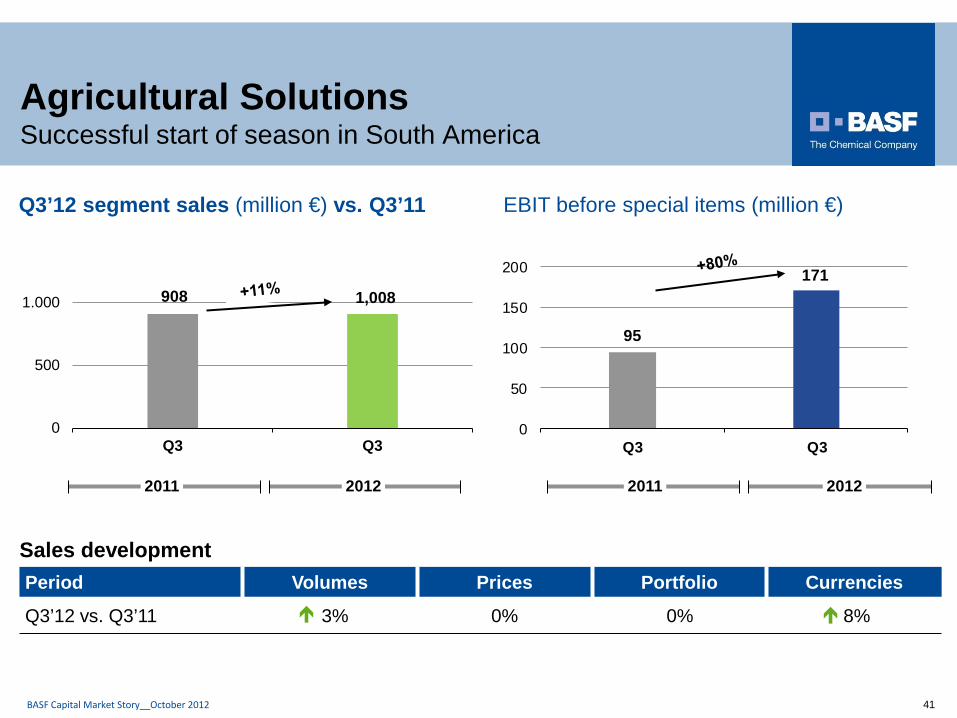
Agricultural Solutions Successful start of season in South America
Q3’12 segment sales (million €) vs. Q3’11 EBIT before special items (million €)
2012 2011
0
50
100
150
200
Q3 Q3
2012 2011
0
500
1.000
Q3 Q3
1,008
Sales development Period Volumes Prices Portfolio Currencies
Q3’12 vs. Q3’11 3% 0% 0% 8%
171
95
908

BASF Capital Market Story__October 2012 42
Exploration & Production 1,360 +155%
Natural Gas Trading
2,012 +21%
€3,372 +54%
Q3’12 segment sales (million €) vs. Q3’11 EBIT bSI/Net income (million €)
123 225 97322
0
200
400
600
800
1,000
Q3/2011 Q3/2012
1,068
Natural Gas Trading
Exploration & Production
Net income
Non compensable oil taxes (Q3 2011: €0 million; Q3 2012: €492 million)
350 971
Sales development Period Volumes Prices/Currencies Portfolio
Q3’12 vs. Q3’11 60% (5%) (1%)
227
Oil & Gas Increased oil production in Libya
BASF Capital Market Story__October 2012 43
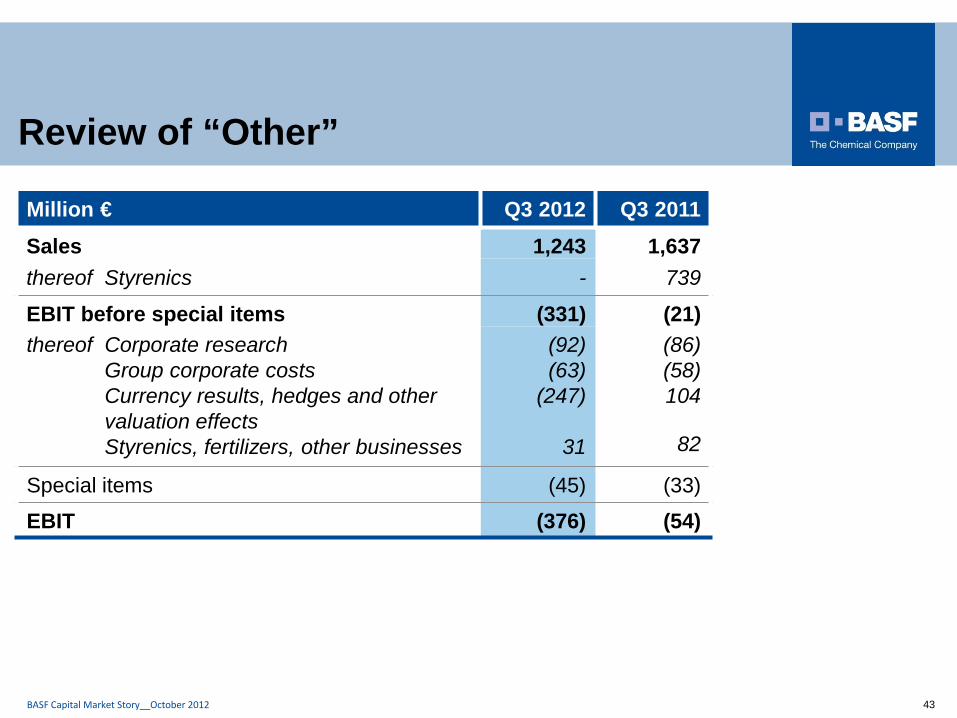
Review of “Other”
Million € Q3 2012 Q3 2011 Sales 1,243 1,637 thereof Styrenics - 739
EBIT before special items (331) (21) thereof Corporate research Group corporate costs Currency results, hedges and other valuation effects Styrenics, fertilizers, other businesses
(92) (63)
(247)
31
(86) (58) 104
82
Special items (45) (33)
EBIT (376) (54)

BASF Capital Market Story__October 2012 44
Strong operating cash flow of €5.2 billion
Million € Jan - Sep 2012
Jan - Sep 2011
Cash provided by operating activities 5,156 5,028 thereof Changes in net working capital (667) (1,337)
Cash used in investing activities (2,081) (957) thereof Payments related to tangible / intangible assets (2,780) (2,101)
thereof Acquisitions / divestitures 411 (22)
Cash used in financing activities (3,395) (4,105) thereof Changes in financial liabilities Dividends
(797) (2,593)
(1,727) (2,378)
Free cash flow 2,376 2,927
Operating cash flow: €1.7 billion Free cash flow: €0.6 billion Capex: €1.1 billion Net debt decreased by €0.6 billion to €11.0 billion in comparison to YTD 2011
Third quarter 2012

BASF Capital Market Story__October 2012
Appendix

BASF Capital Market Story__October 2012
Our purpose
We create chemistry for a sustainable future.
46

BASF Capital Market Story__October 2012
Our strategic principles
We add value as one company.
We innovate to make our customers more successful.
We drive sustainable solutions.
We form the best team.
47

BASF Capital Market Story__October 2012 48