Baseline Testing of the Ultracapacitor Enhanced ... · BASELINE TESTING OF THE ULTRACAPACITOR...
28
NASA/TM-2001-211316 2 00/2201 0 3 5S 4150 Baseli ne Testing of the Ultracapacitor Enhanced Photovoltaic Power Station Dennis J. John S. Kolacz, and Paul F. Tavernelli Glenn Research Center, Cleveland, Ohio November 2001 I I I J 1 https://ntrs.nasa.gov/search.jsp?R=20020007093 2019-12-27T19:37:41+00:00Z
Transcript of Baseline Testing of the Ultracapacitor Enhanced ... · BASELINE TESTING OF THE ULTRACAPACITOR...
NASA/TM-2001-211316
2 00/220103 5S 4150
L~~(
Baseline Testing of the Ultracapacitor Enhanced Photovoltaic Power Station
Dennis J. Eichenbe~g, John S. Kolacz, and Paul F. Tavernelli Glenn Research Center, Cleveland, Ohio
November 2001
I
I
I
J
1
https://ntrs.nasa.gov/search.jsp?R=20020007093 2019-12-27T19:37:41+00:00Z

The NASA STI Program Office ... in Profile
Since its founding, NASA has been dedicated to the advancement of aeronautics and space science. The NASA Scientific and Technical Information (STI) Program Office plays a key part in helping NASA maintain this important role.
The NASA STI Program Office is operated by Langley Research Center, the Lead Center for NASA's scientific and technical information. The NASA STI Program Office provides access to the NASA STI Database, the largest collection of aeronautical and space science STI in the world. The Program Office is also NASA's institutional mechanism for disseminating the results of its research and development activities. These results are published b y NASA in the NASA STI Report Series, which includes the following report types:
• TECHNICAL PUBLICATION. Reports of completed research or a major significant phase of research that present the results of NASA programs and include extensive data or theoretical analysis. Includes compilations of significant scientific and technical data and infom1.ation deemed to be of continuing reference value. NASA's counterpart of peerreviewed formal professional papers but has less stringent limitations on manuscript length and extent of graphic presentations.
• TECHNICAL MEMORANDUM. Scientific and technical findings that are preliminary or of specialized interest, e.g., quick release reports, working papers, and bibliographies that contain minimal annotation. Does not contain extensive analysis.
• CONTRACTOR REPORT. Scientific and technical findings by NASA-sponsored contractors and grantees.
• CONFERENCE PUBLICATION. Collected papers from scientific and technical conferences, symposia, seminars, or other meetings sponsored or cosponsored by NASA.
• SPECIAL PUBLICATION. Scientific, technical, or historical information from NASA programs, projects, and missions, often concerned with subjects having substantial public interest.
• TECHNICAL TRANSLATION. Englishlanguage translations of foreign scientific and technical material pertinent to NASA's mISSIOn.
Specialized services that complement the STI Program Office's diverse offerings include creating custom thesauri, building customized data bases, organizing and publishing research results ... even providing videos.
For more information about the NASA STI Program Office, see the following:
• Access the NASA STI Program Home Page at http://www.sti.nasa.gov
• E-mail your question via the Internet to [email protected]
• Fax your question to the NASA Access Help Desk at 301-621-0134
• Telephone the NASA Access Help Desk at 301-621-0390
• Write to: NASA Access Help Desk NASA Center for AeroSpace Information 7121 Standard Drive Hanover, MD 21076
NASA/TM- 2001-211316
Baseline Testing of the Ultracapacitor Enhanced Photovoltaic Power Station
Dennis J. Eichenberg, Jolul. S. Kolacz, and Paul F. Tavernelli Glerul Research Center, Cleveland, Ohio
Nation al Aeronautics and Space Adm inistration
Glenn Research Center
November 2001
Trade names or manufacturers' names are used in this report for identification only. This usage does not constitute an official endorsement, either expressed or implied, by the National
Aeronautics and Space Administration .
Available from
NASA Center for Aerospace Information 7121 Standard Drive
National Technical Information Service 5285 Port Royal Road Springfield, VA 22100 Hanover, MD 21076
Available electronically at http://gltrs. grc.nasa.gov I GLTRS
BASELINE TESTING OF THE
ULTRACAPACITOR ENHANCED PHOTOVOLTAIC POWER STATION
Dennis J. Eichenberg , John S. Kolacz, and Paul F. Tavernelli National Aeronautics and Space Administration
John H. Glenn Research Center Cleveland, Ohio 44135
SUMMARY
The NASA John H. Glenn Research Center is developing an advanced ultracapacitor enhanced photovoltaic power station . Goals of this effort include maximizing photovoltaic power generation efficiency and extending the life of photovoltaic energy storage systems. Unique aspects of the power station include the use of a solar tracker, and ultracapacitors for energy storage. The photovoltaic power station is seen as a way to provide electric power in remote locations that would otherwise not have electric power, provide independence from utility systems, reduce pollution , reduce fossil fuel consumption, and reduce operating costs. The work was done under the Hybrid Power Management (HPM) Program , which includes the Hybrid Electric Transit Bus (HETB), and the E-Bike. The power station complements the E-Bike extremely well in that it permits the charging of the vehicle batteries in remote locations. Other applications include scientific research and medical power sources in isolated regions. The power station is a'n inexpensive approach to advance the state of the art in power technology in a practical application . The project transfers space technology to terrestrial use via non-traditional partners, and provides power system data valuable for future space applications. A description of the ultracapacitor enhanced power station , the results of performance testing and future power station development plans is the subject of this report. The report concludes that the ultracapacitor enhanced power station provide~ excellent performance, and that the implementation of ultracapacitors in the power system can provide significant performance improvements.
INTRODUCTION
The NASA Glenn Research Center initiated baseline testing of the ultracapacitor enhanced power station as an excellent opportunity to transfer technology from the aerospace and military industries to a commercial venture. The project is seen as a way to provide electric power generation in remote locations that would otherwise not have electric power, provide independence from utility systems, reduce pollution , reduce fossil fuel consumption , and reduce operating costs for power generations systems.
The NASA Glenn Research Center provides overall project coordination and is responsible for testing the power station . This includes instrumenting the power station and developing instrumentation and control programs. Wherever practical , off-the-shelf components have been integrated into the test configuration .
NASAfTM- 2001-2 1 13 16 1
TEST OBJECTIVES
Testing of the ultracapacitor enhanced power station was performed at the NASA Glenn Research Center. Of particular interest are power generation capacity, and energy storage capacity. The performance of the various power station components, especially the photovoltaic panels, solar tracker, energy storage system, and inverter are also of interest.
POWER STATION DESCRIPTION
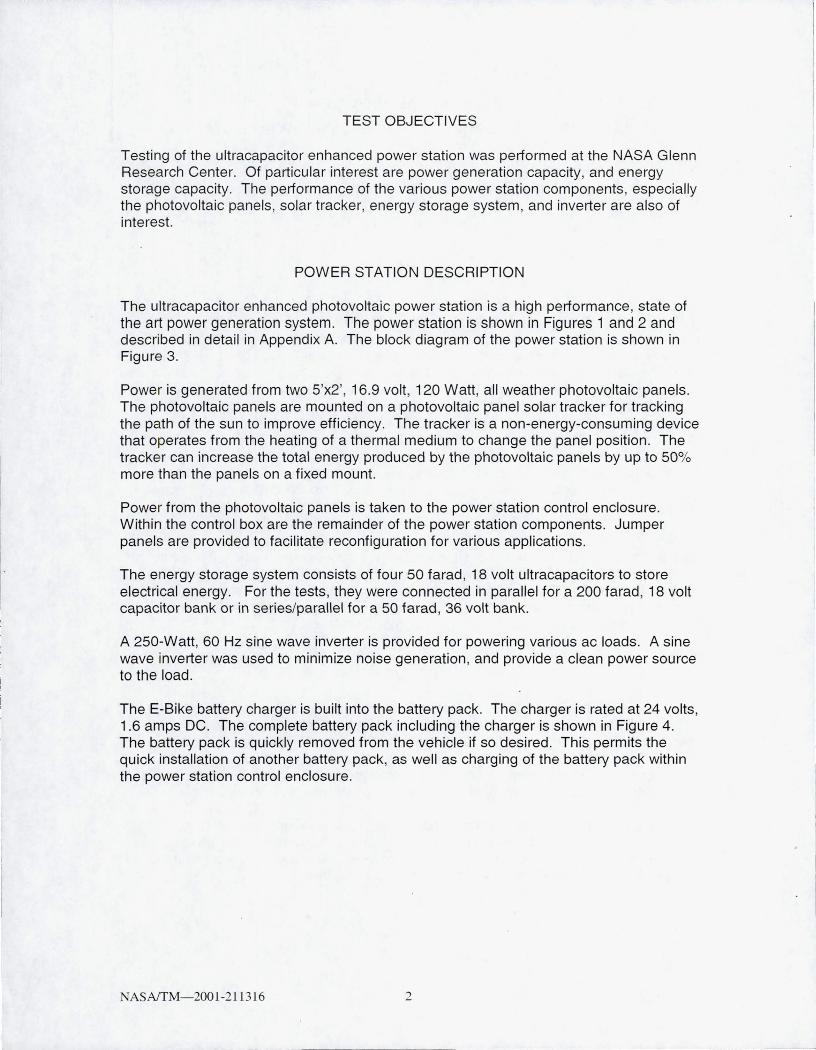
The ultracapacitor enhanced photovoltaic power station is a high performance, state of the art power generation system. The power station is shown in Figures 1 and 2 and described in detail in Appendix A. The block diagram of the power station is shown in Figure 3.
Power is generated from two 5'x2', 16.9 volt, 120 Watt, all weather photovoltaic panels. The photovoltaic panels are mounted on a photovoltaic panel solar tracker for tracking the path of the sun to improve efficiency. The tracker is a non-energy-consuming device that operates from the heating of a thermal medium to change the panel position . The tracker can increase the total energy produced by the photovoltaic panels by up to 50% more than the panels on a fixed mount.
Power from the photovoltaic panels is taken to the power station control enclosure. Within the control box are the remainder of the power station components. Jumper panels are provided to facilitate reconfiguration for various applications.
The energy storage system consists of four 50 farad , 18 volt ultracapacitors to store electrical energy. For the tests , they were connected in parallel for a 200 farad , 18 volt capacitor bank or in series/parallel for a 50 farad , 36 volt bank.
A 250-Watt, 60 Hz sine wave inverter is provided for powering various ac loads. A sine wave inverter was used to minimize noise generation, and provide a clean power source to the load.
The E-Bike battery charger is built into the battery pack. The charger is rated at 24 volts, 1.6 amps DC. The complete battery pack including the charger is shown in Figure 4. The battery pack is quickly removed from the vehicle if so desired. This permits the quick installation of another battery pack, as well as charging of the battery pack within the power station control enclosure.
NASAffM-200 1-2113 16 2
----------
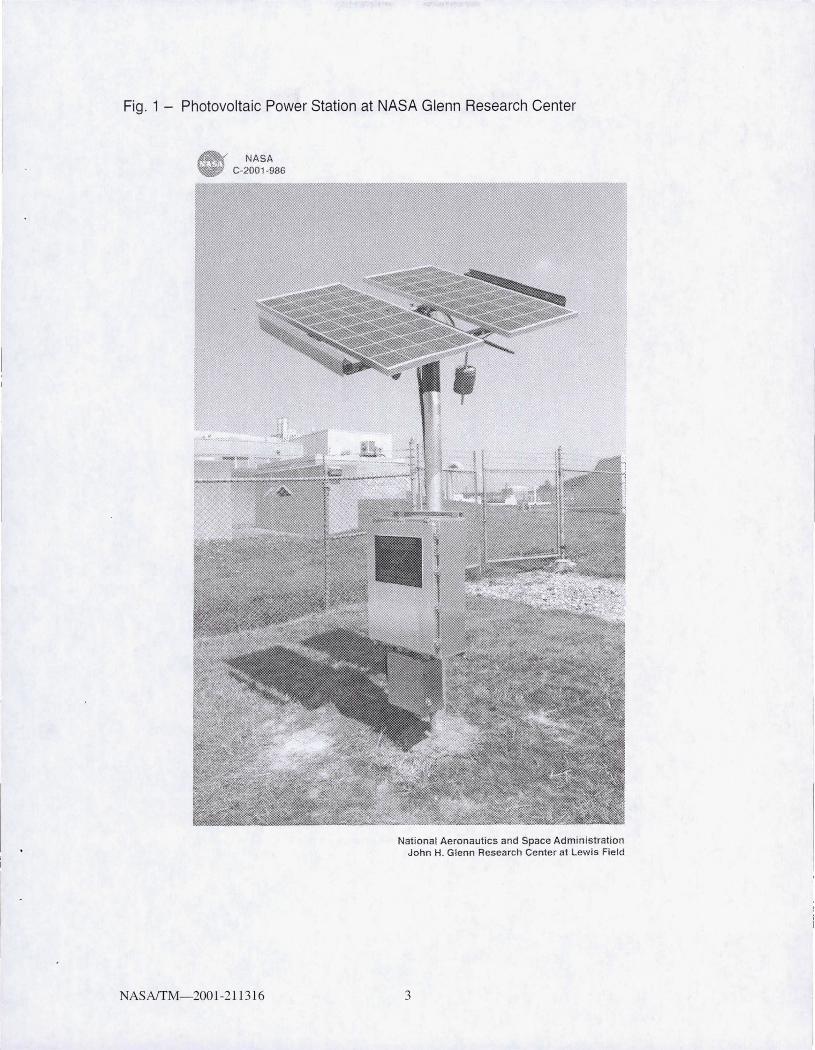
Fig . 1 - Photovoltaic Power Station at NASA Glenn Research Center
NASAffM- 2001-211316
National Aeronautics and Space Administration John H. Glenn Research Center at Lewis Field
3
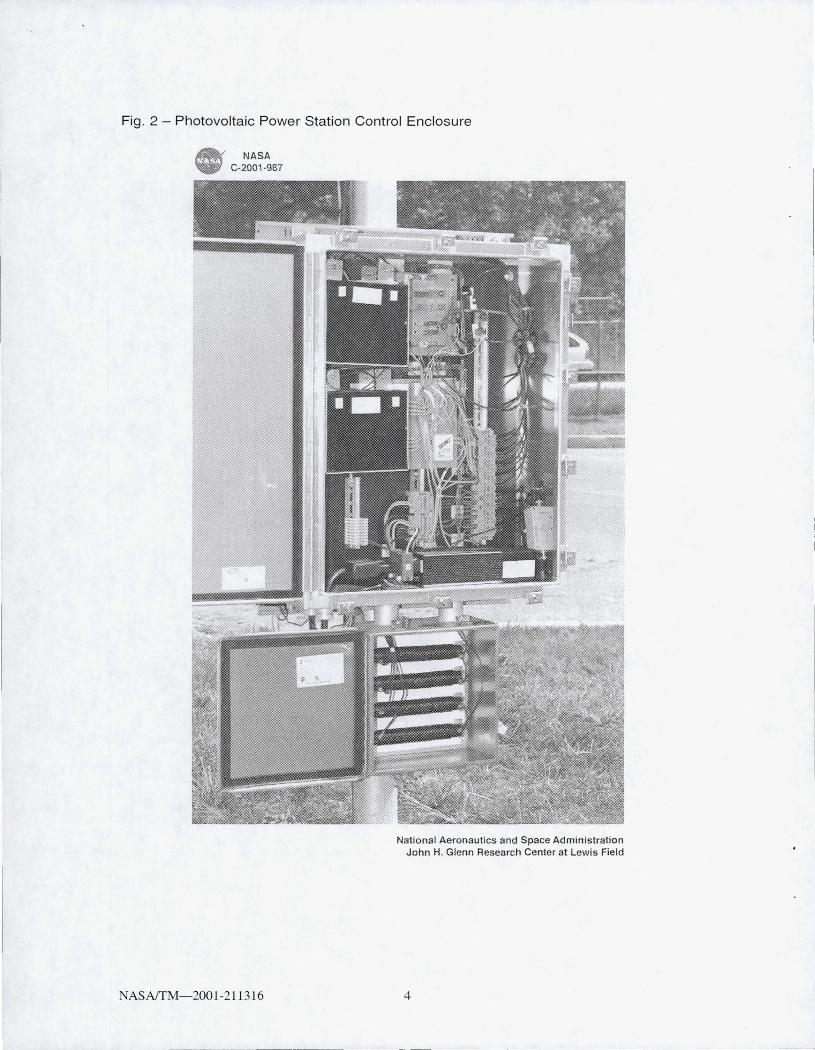
Fig . 2 - Photovoltaic Power Station Control Enclosure
NASAffM-2001 -2113 16
National Aeronautics and Space Adm inistratio n John H. Glenn Research Center at Lewis Field
4
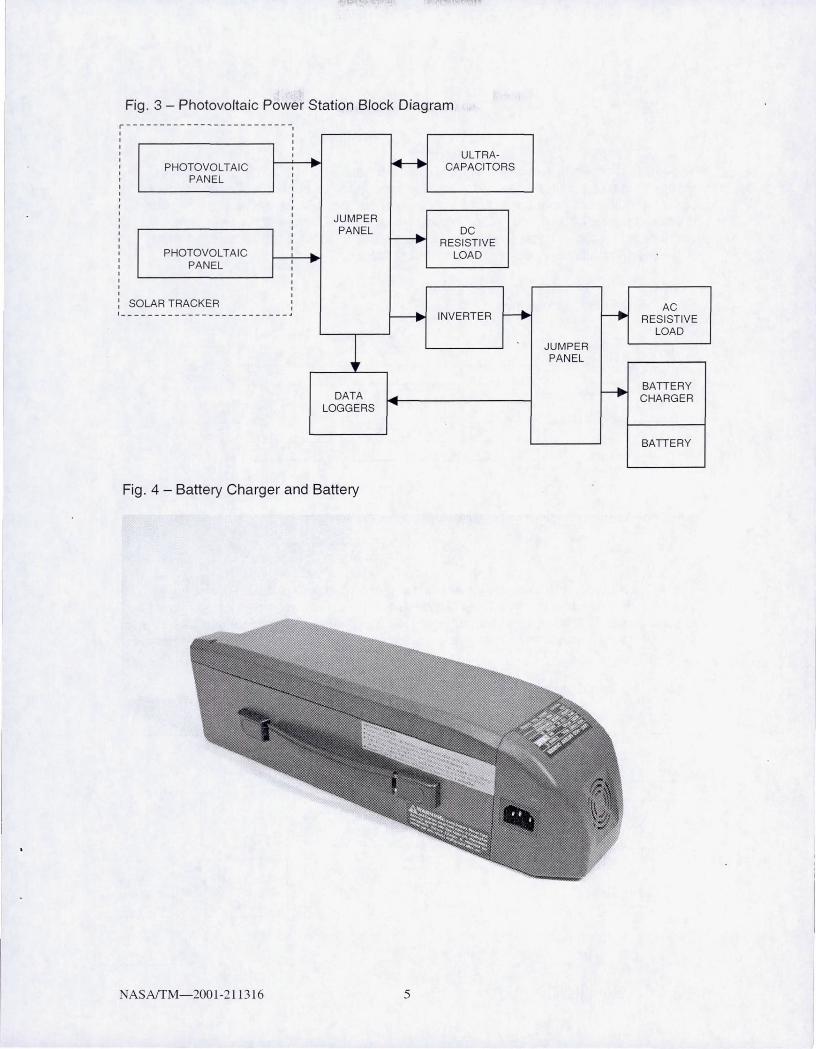
Fig. 3 - Photovoltaic Power Station Block Diagram r------------------------
~ ULTRA-
PHOTOVOL TAlC .. CAPACITORS PANEL
JUMPER PANEL ---. DC
RESISTIVE PHOTOVOL TAlC .. LOAD
PANEL ~
S OLAR TRACKER AC ----------------------- ~ INVERTER ~ ~ RESISTIVE
LOAD
J JUMPER PANEL
-. BATIERY DATA .... CHARGER
LOGGERS .....
BATIERY
Fig. 4 - Battery Charger and Battery
NASAfTM-2001-211316 5
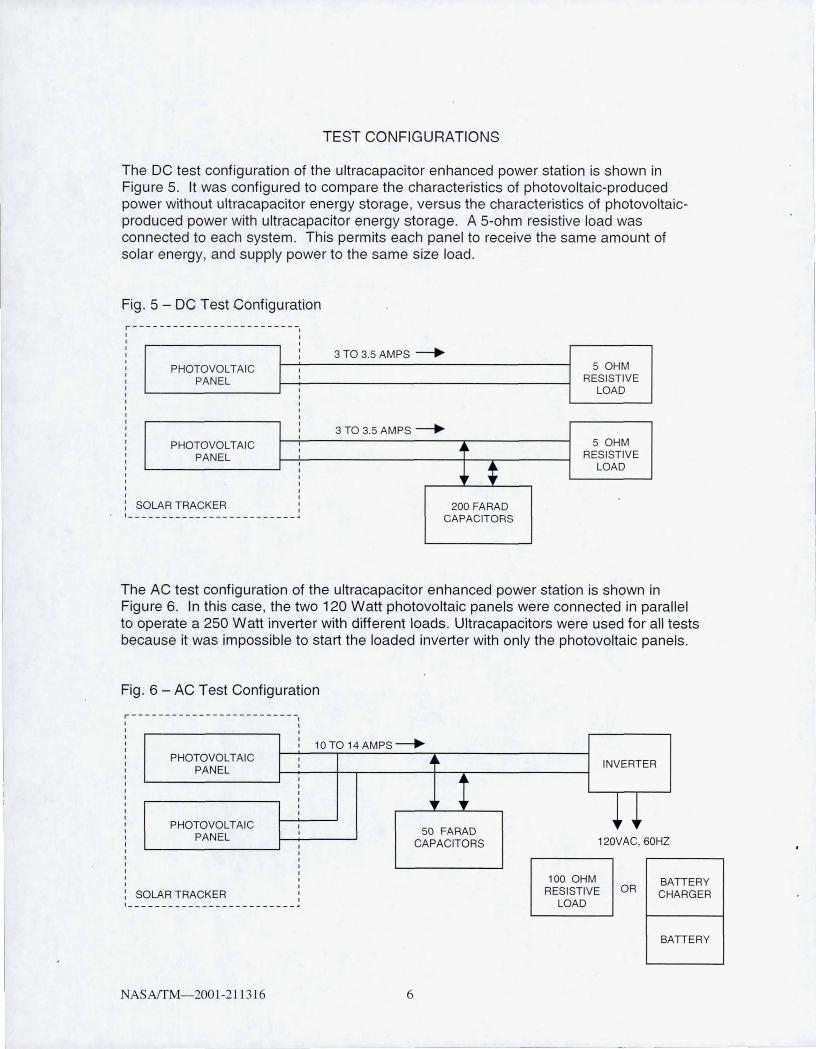
TEST CONFIGURATIONS
The DC test configuration of the ultracapacitor enhanced power station is shown in Figure 5. It was configured to compare the characteristics of photovoltaic-produced power without ultracapacitor energy storage , versus the characteristics of photoYoltaicproduced power with ultracapacitor energy storage. A 5-ohm resistive load was connected to each system. This permits each panel to receive the same amount of solar energy, and supply power to the same size load.
Fig. 5 - DC Test Configuration
r------ --- ---------------~ , , , 3 TO 3.5 AMPS ---+-,
PHOTOVOL TAlC , 5 OHM PANEL RESISTIVE
LOAD
3 TO 3.5 AMPS ---+-PHOTOVOL TAlC ~~
5 OHM PANEL RESISTIVE
; LOAD
" s OLAR TRACKER 200 FARAD ----------------------- CAPACITORS
The AC test configuration of the ultracapacitor enhanced power station is shown in Figure 6. In this case, the two 120 Watt photoYoltaic panels were connected in parallel to operate a 250 Watt inverter with different loads. Ultracapacitors were used for all tests because it was impossible to start the loaded inverter with only the photovoltaic panels.
Fig. 6 - AC Test Configuration
r--------------- ------- --~
I I I
10 TO 14 AMPS---+-I
PHOTOVOL TAlC I ~~ PANEL I
I .41" I I ,
" ~,
I I
PHOTOVOL TAlC I 50 FARAD PANEL I
I CAPACITORS I I I
I SOLAR TRACKER I
I ______ -------------------~
AS AffM-200 1-21 1316 6
INVERTER
~~ 120VAC, 60HZ
100 OHM RESISTIVE OR
LOAD
BATTERY CHARGER
BATTERY
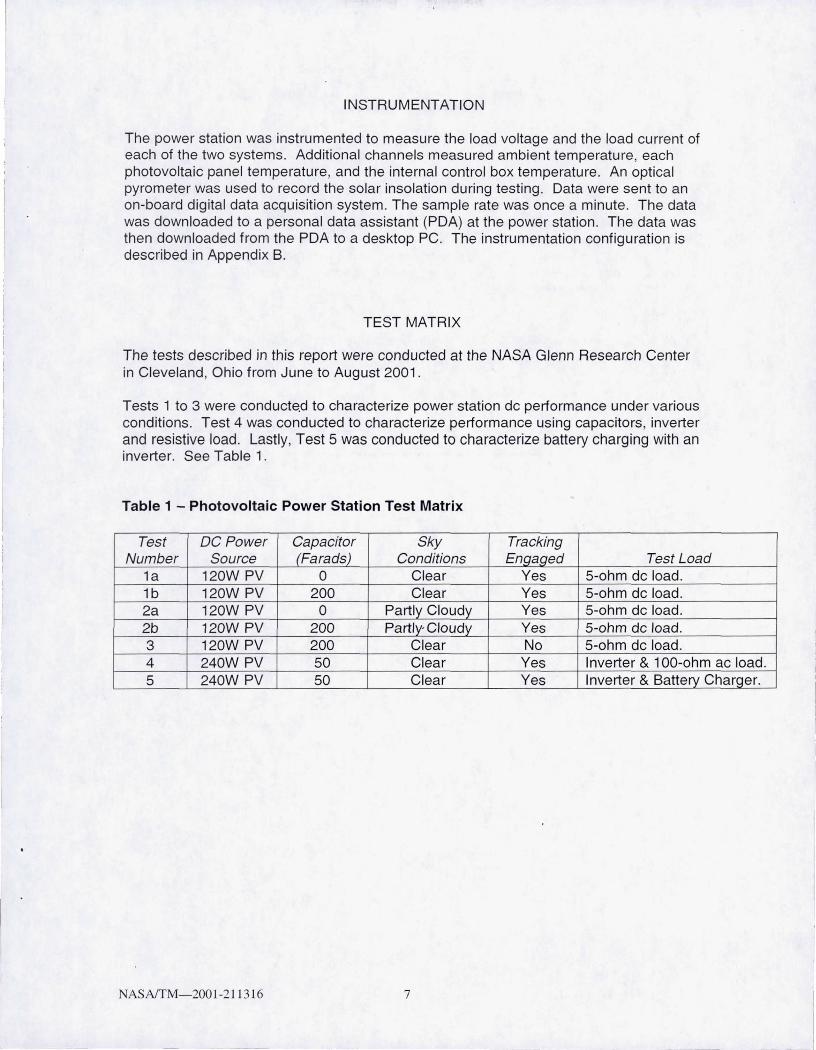
INSTRUMENTATION
The power station was instrumented to measure the load voltage and the load current of each of the two systems. Additional channels measured ambient temperatu re, each photovoltaic panel temperature, and the internal control box temperature . An optical pyrometer was used to record the solar insolation during testing . Data were sent to an on-board digital data acquisition system. The sample rate was once a minute. The data was downloaded to a personal data assistant (PDA) at the power station . The data was then downloaded from the PDA to a desktop PC. The instrumentation configuration is described in Appendix B.
TEST MATRIX
The tests described in this report were conducted at the NASA Glenn Research Center in Cleveland , Ohio from June to August 2001.
Tests 1 to 3 were conduct~d to characterize power station dc performance under various conditions . Test 4 was conducted to characterize performance using capacitors , inverter and resistive load. Lastly, Test 5 was conducted to characterize battery charging with an inverter. See Table 1.
Table 1 - Photovoltaic Power Station Test Matrix
Test DC Power Capacitor Sky Tracking Number Source (Farads) Conditions Engaged Test Load
1a 120W PV 0 Clear Yes 5-ohm dc load. 1b 120W PV 200 Clear Yes 5-ohm dc load. 2a 120W PV 0 Partly Cloudy Yes 5-ohm dc load. 2b 120W PV 200 Partly-Cloudy Yes 5-ohm dc load. 3 120W PV 200 Clear No 5-ohm dc load. 4 240W PV 50 Clear Yes Inverter & 100-ohm ac load . 5 240W PV 50 Clear Yes Inverter & Battery Charger.
NASAfTM- 2001 -211316 7
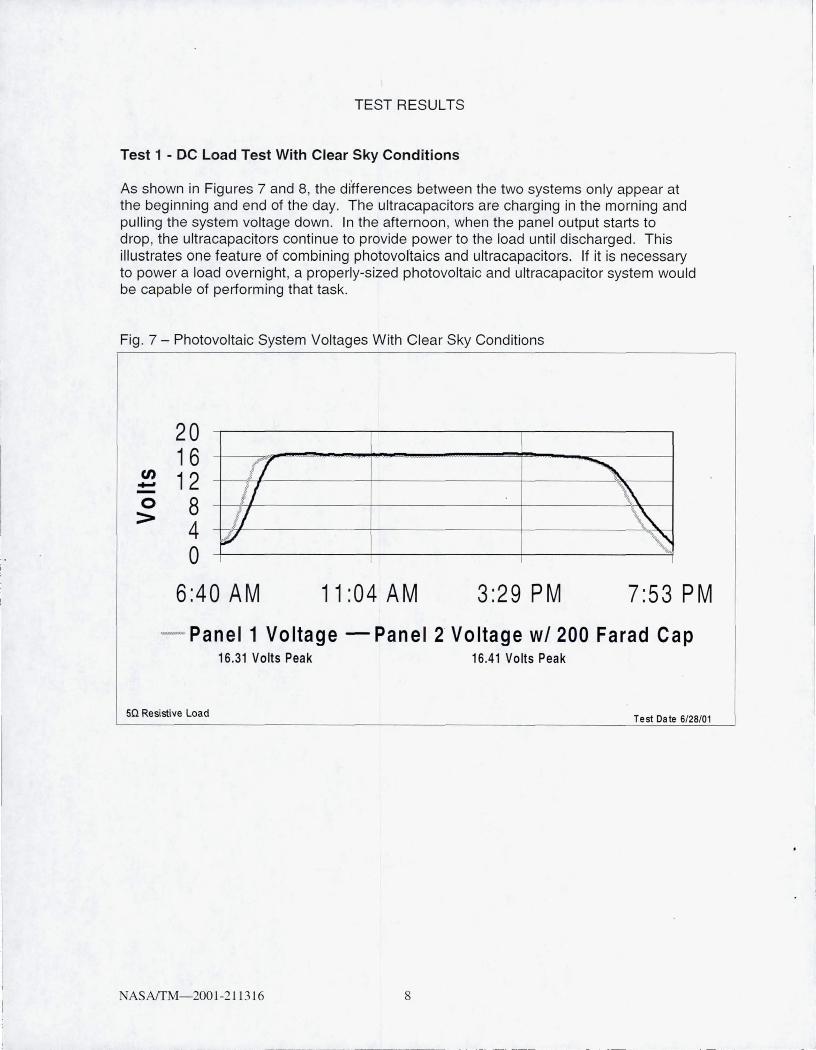
TEST RESULTS
Test 1 - DC Load Test With Clear Sky Conditions
As shown in Figures 7 and 8, the differences between the two systems only appear at the beginning and end of the day. The ultracapacitors are charging in the morning and pulling the system voltage down . In the afternoon, when the panel output starts to drop, the ultracapacitors continue to provide power to the load until discharged. This illustrates one feature of combining photovoltaics and ultracapacitors. If it is necessary to power a load overnight, a properly-sized photovoltaic and ultracapacitor system would be capable of performing that task.
Fig. 7 - Photovoltaic System Voltages With Clear Sky Conditions
(J) -o >
20 16 12 8 4 o
6:40 AM 11 :04 AM 3:29 PM 7:53 PM
-- Panel 1 Voltage - Panel 2 Voltage wI 200 Farad Cap 16.31 Volts Peak 16.41 Volts Peak
50 Resistive Load Test Dale 6/28/01
NASAffM- 2001 -2113 16 8
I -'
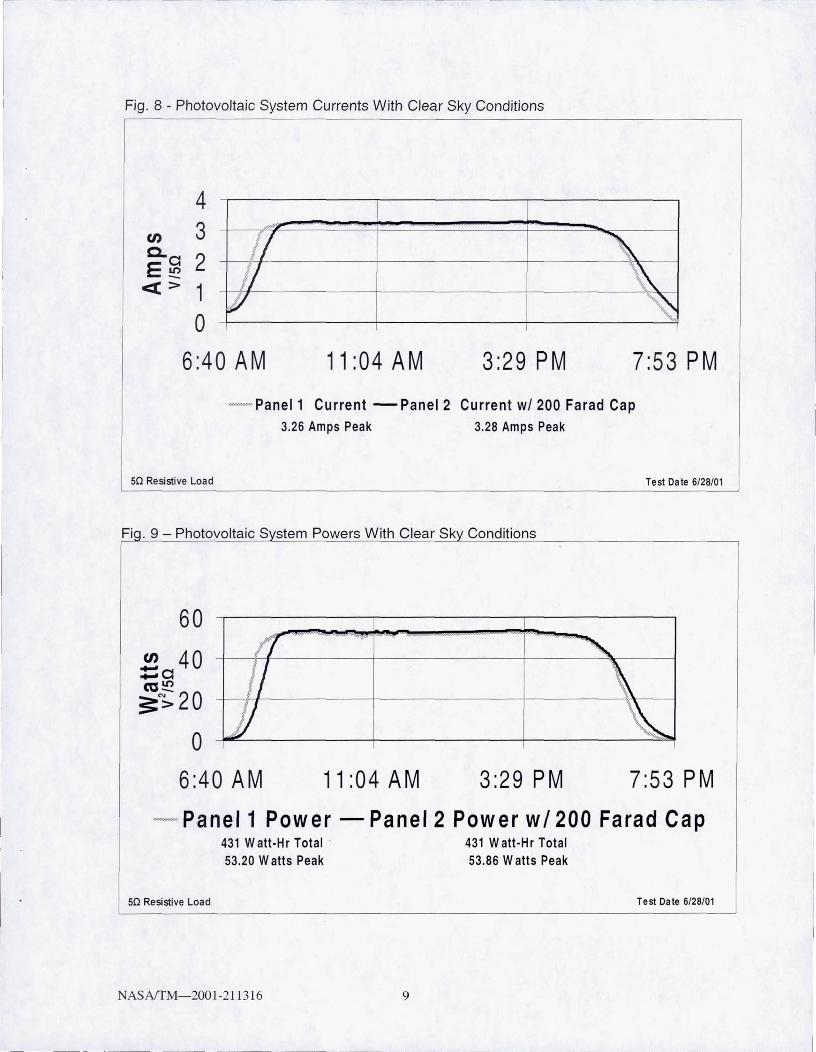
Fig. 8 - Photovoltaic System Currents With Clear Sky Conditions
4 U) 3 Q.a 2 E~ «>1
o 6:40 AM 11 :04 AM 3:29 PM 7:53 PM
- Panel 1 Current - Panel 2 Current wI 200 Farad Cap 3.26 Amps Peak 3.28 Amps Peak
SO Resistive Load
Fi . 9 - Photovoltaic S stem Powers With Clear Sk Conditions
60
C/) 40 =a ~t20
o 6:40 AM 11 :04 AM 3:29 PM
Test Date 6/28/01
7:53 PM
- Panel1 Power - Panel2 Power wI 200 Farad Cap
so Resistive Load
431 Watt-Hr Total · 53.20 Watts Peak
NASAffM- 2001-211316 9
431 W att-Hr Total 53.86 Watts Peak
Test Date 6/28/01
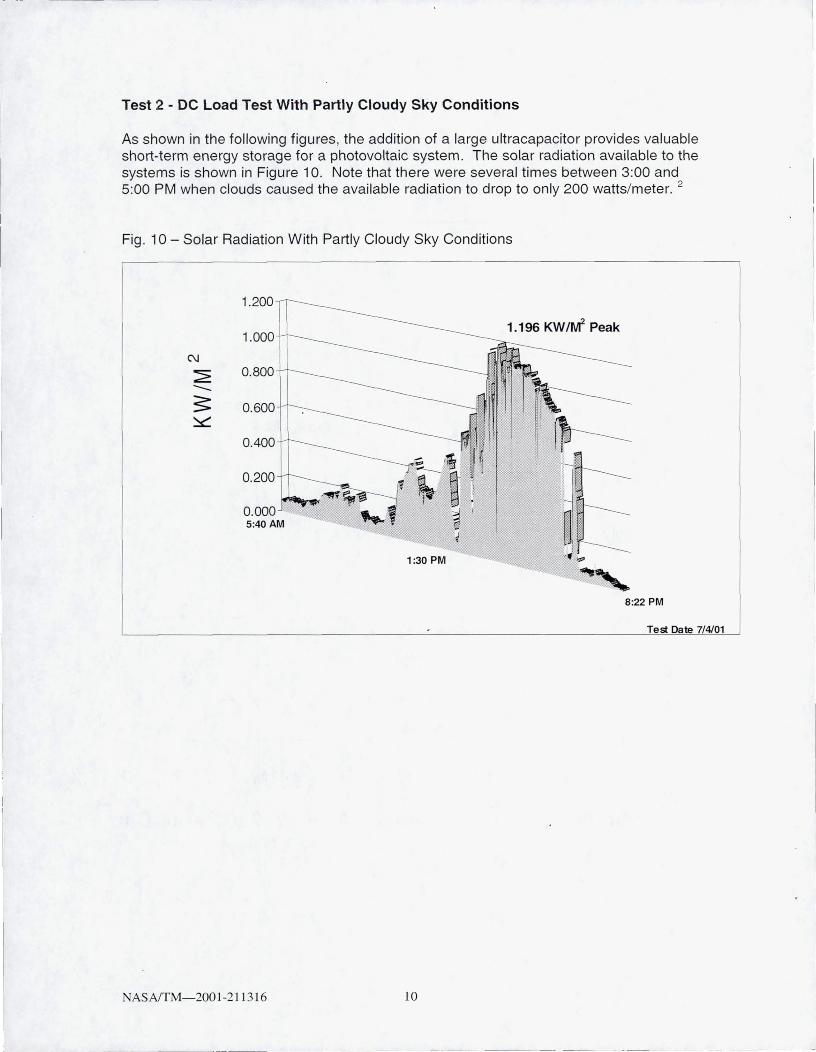
Test 2 - DC load Test With Partly Cloudy Sky Conditions
As shown in the following figures , the addition of a large ultracapacitor provides valuable short-term energy storage for a photovoltaic system. The solar radiation available to the systems is shown in Figure 10. Note that there were several times between 3:00 and 5 :00 PM when clouds caused the available radiation to drop to only 200 watts/meter. 2
Fig . 10- Solar Radiation With Partly Cloudy Sky Conditions
1.200
1.196 KW IrJf Peak 1.000
C\J
:2: 0.800
---S o. ~
0.400
0.200
0.000
1:30 PM
8:22 PM
Test Date 714101
ASAffM-2001 -211 316 10
- -----
~--
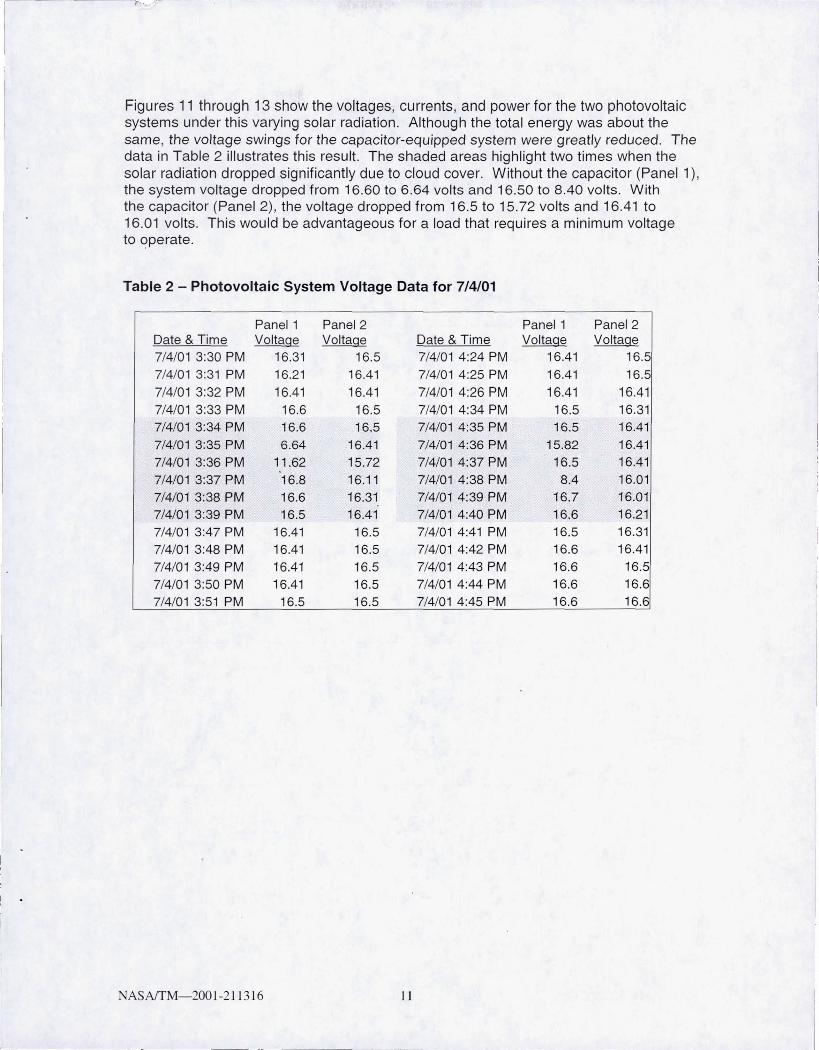
Figures 11 through 13 show the voltages, currents , and power for the two photovoltaic systems under this varying solar radiation . Although the total energy was about the same, the voltage swings for the capacitor-equipped system were greatly reduced. The data in Table 2 illustrates this result. The shaded areas highlight two times when the solar radiation dropped significantly due to cloud cover. Without the capacitor (Panel 1), the system voltage dropped from 16.60 to 6 .64 volts and 16.50 to 8.40 volts. With the capacitor (Panel 2), the voltage dropped from 16.5 to 15.72 volts and 16.41 to 16.01 volts . This would be advantageous for a load that requires a minimum voltage to <?perate.
Table 2 - Photovoltaic System Voltage Data for 7/4/01
Panel 1 Panel 2 Panel 1 Panel 2 Date & Time Voltage Voltage Date & Time Voltage Voltage 7/4/01 3:30 PM 16.31 16.5 7/4/01 4:24 PM 16.41 16.5 7/4/01 3:31 PM 16.21 16.41 7/4/01 4:25 PM 16.41 16.5 7/4/01 3:32 PM 16.41 16.41 7/4/01 4:26 PM 16.41 16.41 7/4/01 3:33 PM 16.6 16.5 7/4/01 4:34 PM 16.5 16.31 7/4/01 3:34 PM 16.6 16.5 7/4/01 4:35 PM 16.5 16.41 7/4/01 3:35 PM 6.64 16.41 7/4/01 4:36 PM 15.82 16.41 7/4/01 3:36 PM 11 .62 15.72 7/4/01 4:37 PM 16.5 16.41
7/4/01 3:37 PM 16.8 16.11 7/4/01 4:38 PM 8.4 16.01 7/4/01 3:38 PM 16.6 16.31 7/4/01 4:39 PM 16.7 16.01 7/4/01 3:39 PM 16.5 16.41 7/4/01 4:40 PM 16.6 16.21 7/4/01 3:47 PM 16.41 16.5 7/4/01 4:41 PM 16.5 16.31 7/4/01 3:48 PM 16.41 16.5 7/4/01 4:42 PM 16.6 16.41 7/4/01 3:49 PM 16.41 16.5 7/4/01 4:43 PM 16.6 16.5 7/4/01 3:50 PM 16.41 16.5 7/4/01 4:44 PM 16.6 16.6 7/4/01 3:51 PM 16.5 16.5 7/4/01 4:45 PM 16.6 16.6
NASAfTM- 2001-211316 11
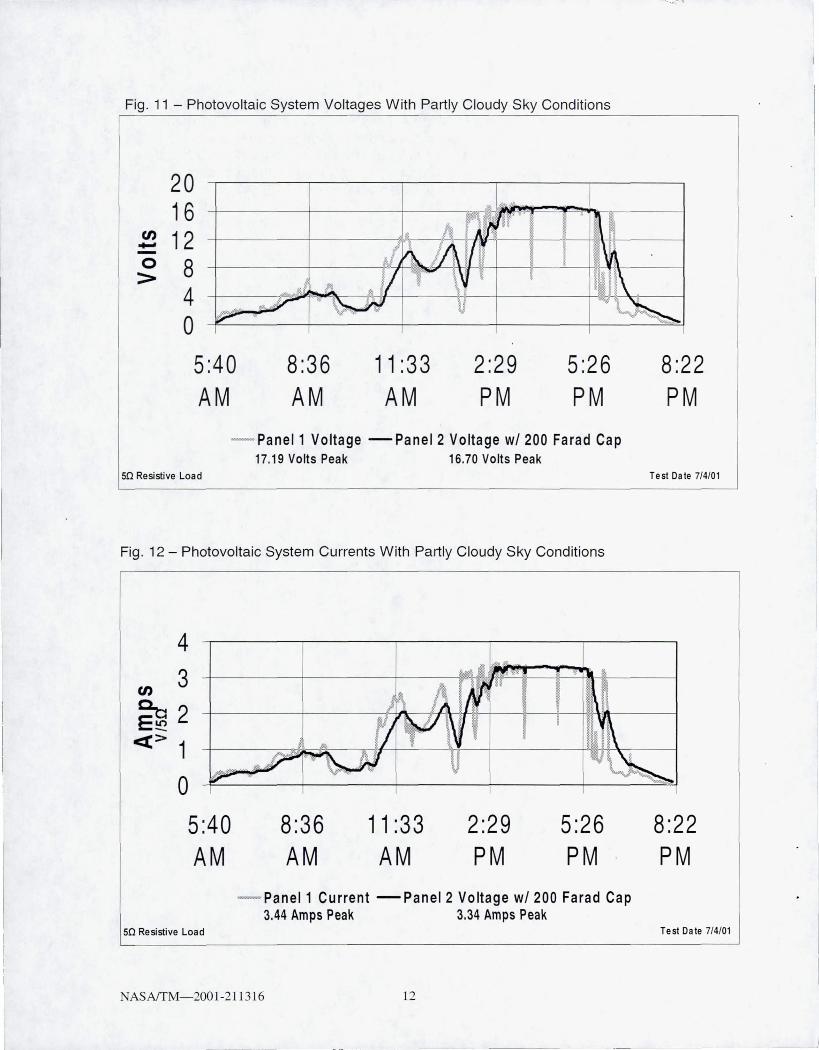
Fig. 11 - Photovoltaic System Voltages With Partly Cloudy Sky Conditions
20 16
~ 12 o > 8
4 o 5:40 AM
8:36 AM
11 :33 AM
2:29 PM
5:26 PM
- Panel1 Voltage -Panel2 Voltage w/200 Farad Cap 17.19 Volts Peak 16.70 Volts Peak
50 Resistive Load
Fig . 12 - Photovoltaic System Currents W ith Partly Cloudy Sky Conditions
4
en 3 ~2 «>1
o 5:40 AM
8:36 AM
11 :33 AM
2:29 PM
5:26 PM
- Panel 1 Current -Panel2 Voltage w/200 Farad Cap 3.44 Amps Peak 3.34 Amps Peak
50 Resistive Load
NASAffM-2001-211316 12
8:22 PM
Test Da te 7/4/01
8:22 PM
Test Date 7/4/01
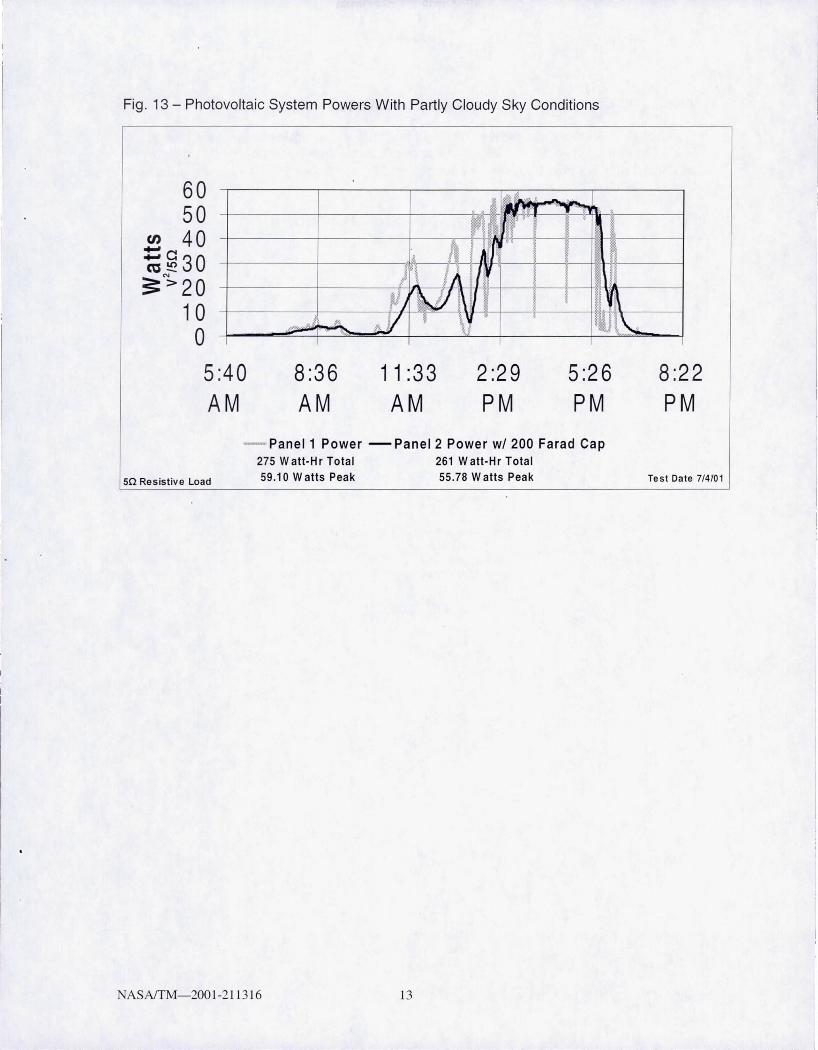
Fig . 13 - Photovoltaic System Powers With Partly Cloudy Sky Conditions
60 50
CJ) 40 ... -; g30 3="'>20
1 0 o 5:40 AM
8:36 AM
11 :33 AM
2:29 PM
5:26 PM
- Panel1 Power -Panel2 Power wI 200 Farad Cap
SQ Resistive Load
275 W att-H r Total
59.10 Watts Peak
NASAffM-2001-211316 13
261 W att-Hr Total
55.78 Watts Peak
8:22 PM
Test Date 7/4101
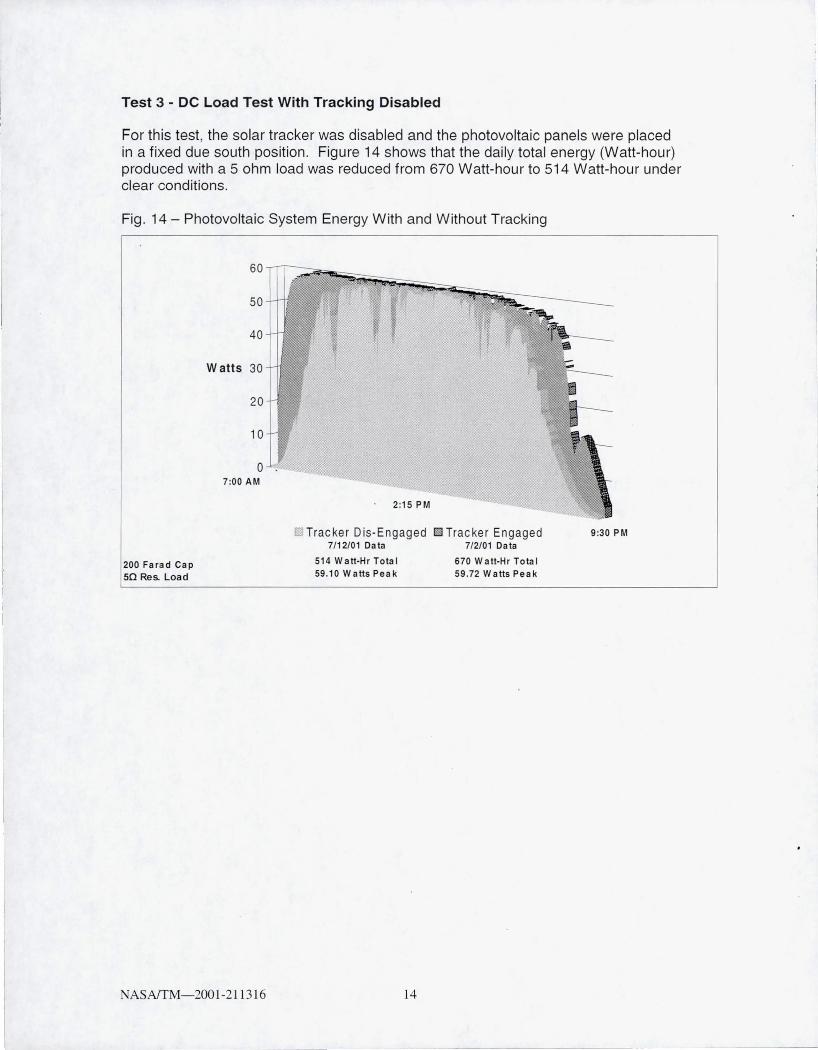
Test 3 - DC Load Test With Tracking Disabled
For this test, the solar tracker was disabled and the photovoltaic panels were placed in a fixed due south position. Figure 14 shows that the daily total energy (Watt-hour) produced with a 5 ohm load was reduced from 670 Watt-hour to 514 Watt-hour under clear conditions.
Fig . 14 - Photovoltaic System Energy With and Without Tracking
200 Farad Cap 50 Res. Load
60
50
40
Watts 30
20
10
0 7:00 AM
NASAffM-2001-21 1316
fB Tracker Dis-Engaged DTracker Engaged 7/12/01 Data 7/2101 Data
514 Watt-Hr Total 59 .10 Watts Peak
14
670 Watt-Hr Tota I 59 .72 Watts Peak
9:30 PM
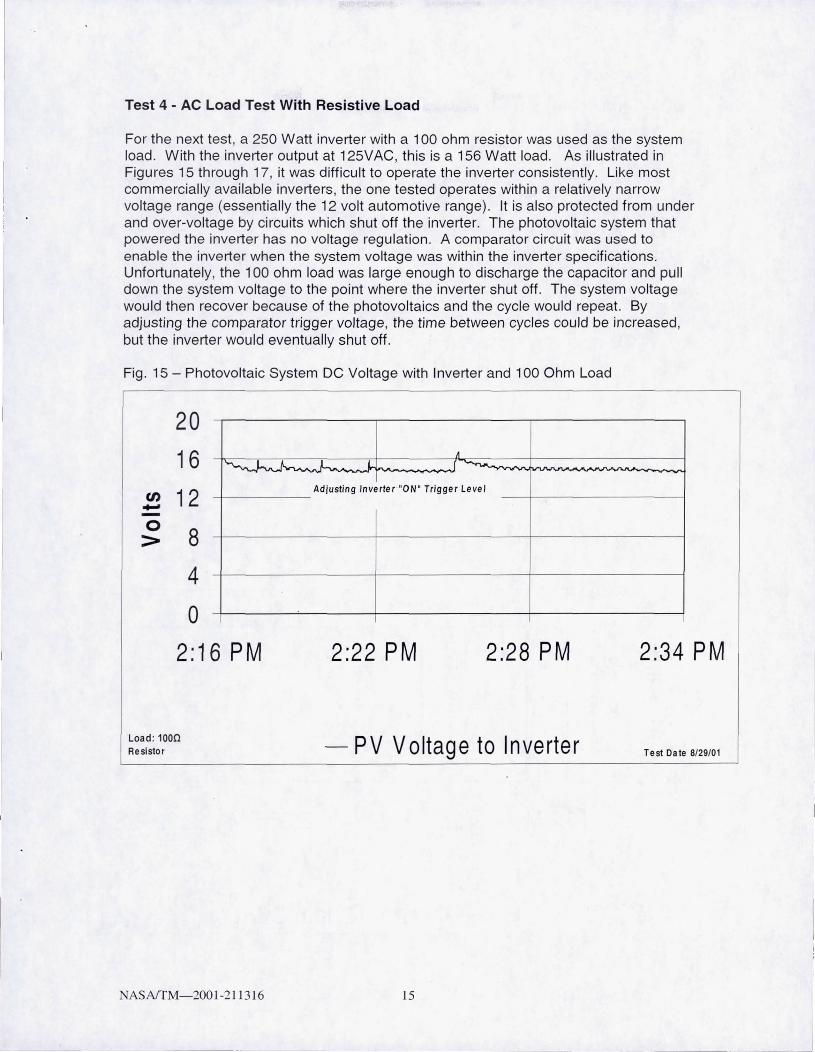
Test 4 - AC Load Test With Resistive Load
For the next test, a 250 Watt inverter with a 100 ohm resistor was used as the system load. With the inverter output at 125VAC, this is a 156 Watt load. As illustrated in Figures 15 through 17, it was difficult to operate the inverter consistently. Like most commercially available inverters, the one tested operates within a relatively narrow voltage range (essentially the 12 volt automotive range). It is also protected from under and over-voltage by circuits which shut off the inverter. The photovoltaic system that powered the inverter has no voltage regulation. A comparator circuit was used to enable the inverter when the system voltage was within the inverter specifications. Unfortunately, the 100 ohm load was large enough to discharge the capacitor and pull down the system voltage to the point where the inverter shut off . The system voltage would then recover because of the photovoltaics and the cycle would repeat. By adjusting the comparator trigger voltage, the time between cycles could be increased, but the inverter would eventually shut off.
Fig. 15 - Photovoltaic System DC Voltage with Inverter and 100 Ohm Load
A
20
16 I""'-.~ L .f .~
U) 12 .... g, 8
4
o 2:16 PM
Load : 1000 Resistor
NASAffM-2001-2113 16
Ad;usting Inverter ·"ON " Trigger Level
2:22 PM 2:28 PM
- PV Voltage to Inverter
15
2:34 PM
Test Date 8/29/01
J
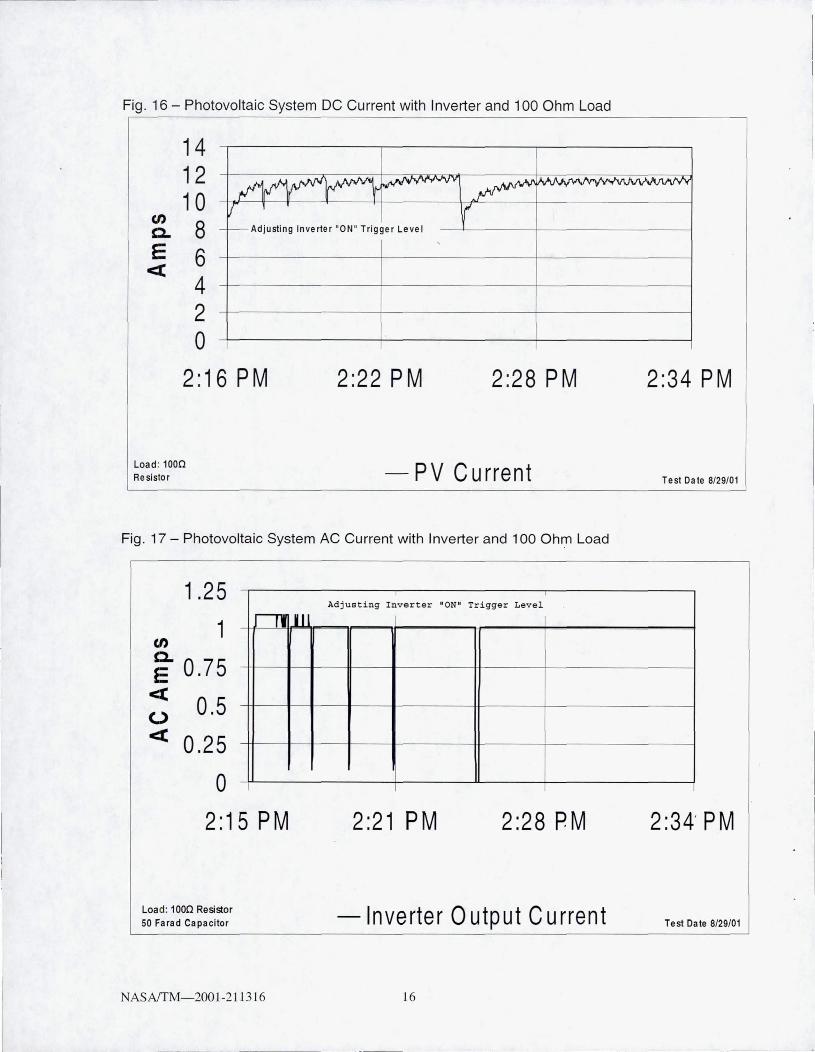
Fig . 16 - Photovoltaic System DC Current with Inverter and 100 Ohm Load
14 12 1 0 ~~
~ .. -, v ~.I'- [),M-hN\., v' • ..AA ./'VV\I'Iv
V 1
en a. 8
6 4
-I-- Adjusting Inve rter "ON " Tr igge r Level r E
<C
2 o
2:16 PM
Load: 1000 Resistor
2:22 PM 2:28 PM
- PV Current
Fig. 17 - Photovoltaic System AC Current with Inverter and 100 Ohm Load
1.25
1 en a. E 0.75
<C 0.5 o <C 0.25
o
Jl1 Mil
2:15 PM
Load: 1000 Resistor 50 Farad Capacitor
NASAffM-200 1-211 316
Adjusting Inverter "ON" Trigger Lev el
I
2:21 PM 2:28 PM
-Inverter 0 utp ut Current
16
2:34 PM
Test Date 8/29/01
I
2:34' PM
Test Date 8/29/01
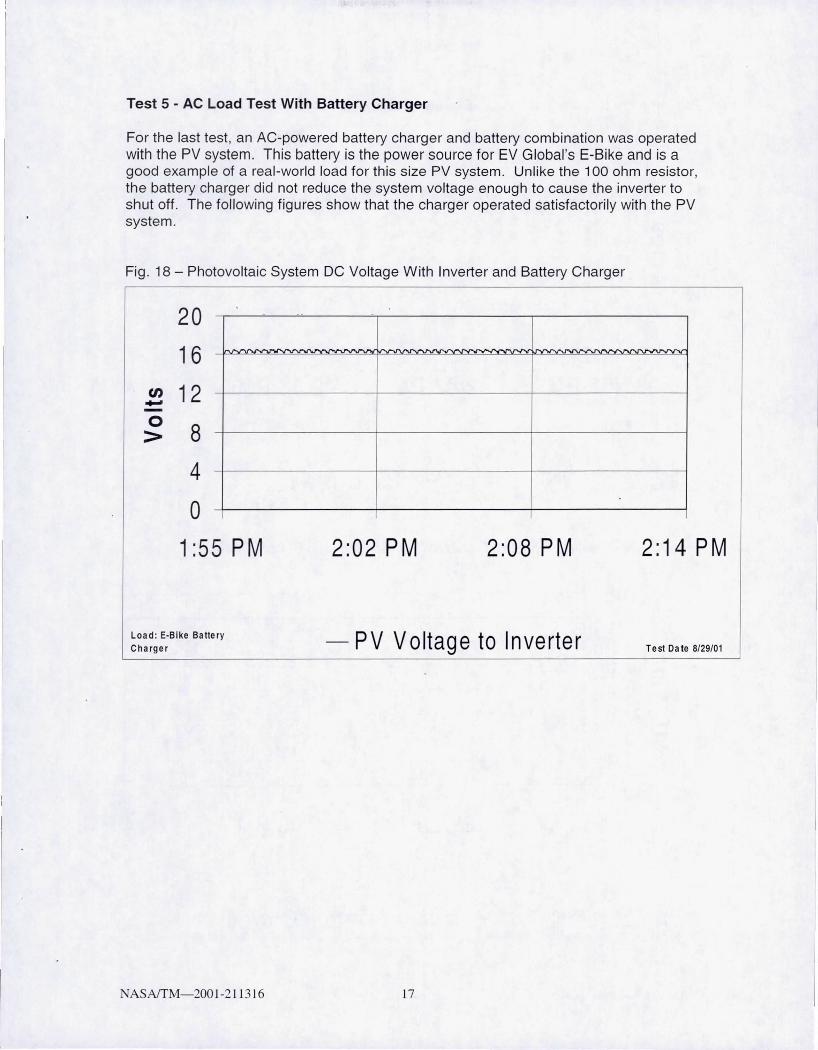
Test 5 - AC Load Test With Battery Charger
For the last test, an AC-powered battery charger and battery combination was operated with the PV system . This battery is the power source for EV Global's E-Bike and is a good example of a real-world load for this size PV system. Unlike the 100 ohm resistor, the battery charger did not reduce the system voltage enough to cause the inverter to shut off. The following figures show that the charger operated satisfactorily with the PV system.
Fig . 18 - Photovoltaic System DC Voltage With Inverter and Battery Charger
20
16
U) 12 -o > 8
4
o 1 :55 PM
Load : E·Bike Battery Charger
NASAfTM- 2001-2 11316
2:02 PM 2:08 PM
- PV Voltage to Inverter
17
2:14 PM
Test Date 8/29/01
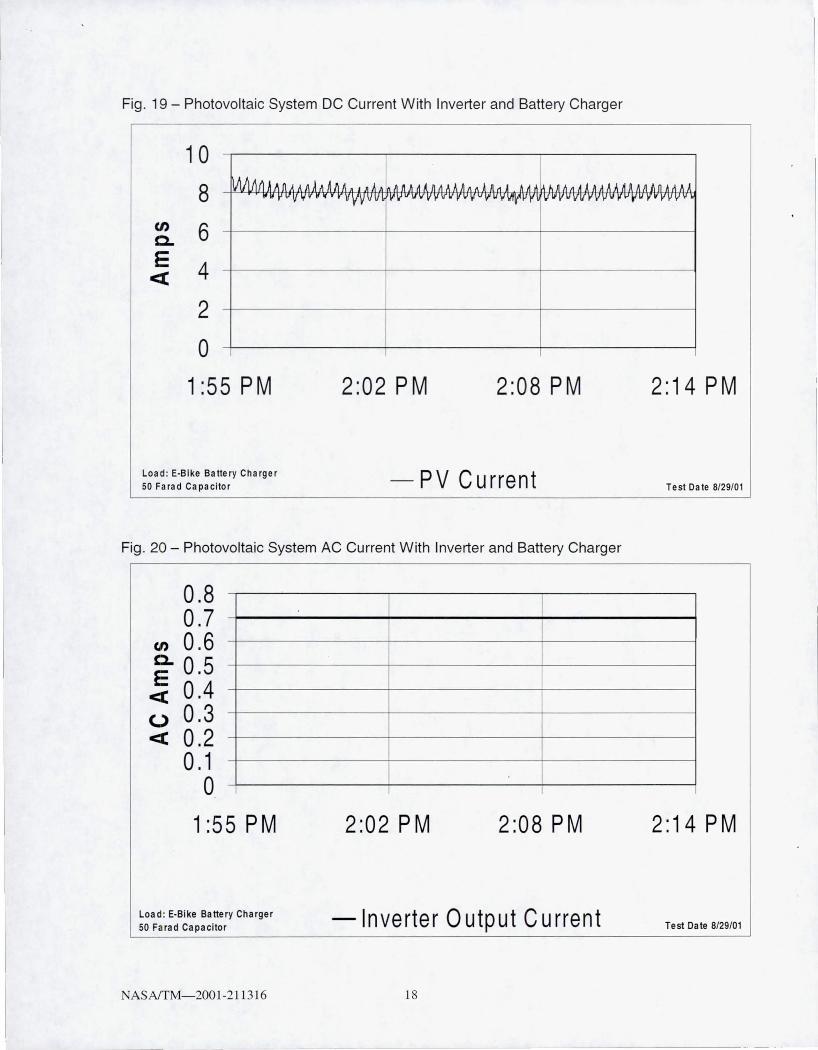
Fig . 19 - Photovoltaic System DC Current W ith Inverter and Battery Charger
en c.. E «
10
8
6
4
2
o 1 :55 PM
Load : E-Bike Battery Charger
50 Farad Capacitor
2:02 PM 2:08 PM
-PV Current
Fig . 20 - Photovoltaic System AC Current With Inverter and Battery Charger
0.8 0.7
en 0.6 E 0.5 « 0.4 (,) 0.3 « 0.2
0.1 o
1 :55 PM
Load : E-Bike Battery Charger
50 Farad Capacitor
NASAfTM-2001-21 1316
I
2:02 PM 2:08 PM
-Inverter Output Current
18
2:14 PM
Test Date 8/29/01
2:14 PM
Test Date 8/29/01
CONCLUDING REMARKS
The ultracapacitor enhanced photovoltaic power station as tested and described in this report is comprised of commercially available components . Testing performed with and without ultracapacitors show the change in photovoltaic system characteristics caused by the addition of ultracapacitors. In particular, the comparison tests reveal improvements in photovoltaic system performance which are created by the ultracapacitors' short-term energy storage characteristics. Testing with an inverter and large resistive load illustrates the difficulties presented by a device that operates within a narrow voltage range. Operating the inverter with a smaller load, the battery charger, shows that the photovoltaic and ultracapacitor system can function well in a real-world situation .
NASAfTM-2001 -21 1316 19

Page intentionally left blank
1-
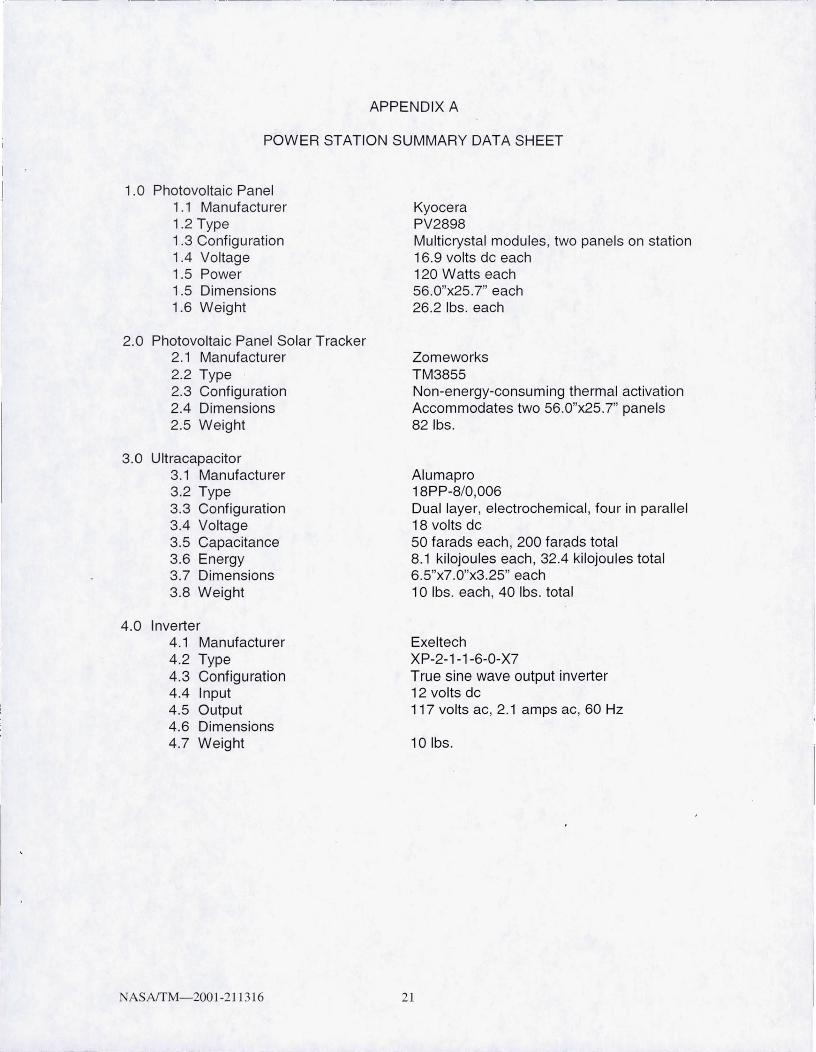
APPENDIX A
POWER STATION SUMMARY DATA SHEET
1.0 Photovoltaic Panel 1.1 Manufacturer 1.2 Type 1.3 Configuration 1.4 Voltage 1.5 Power 1.5 Dimensions 1.6 Weight
2.0 Photovoltaic Panel Solar Tracker 2.1 Manufacturer 2.2 Type 2.3 Configuration 2.4 Dimensions 2.5 Weight
3.0 Ultracapacitor 3.1 Manufacturer 3.2 Type 3.3 Configuration 3.4 Voltage 3.5 Capacitance 3.6 Energy 3.7 Dimensions 3.8 Weight
4.0 Inverter 4.1 Manufacturer 4.2 Type 4.3 Configuration 4.4 Input 4.5 Output 4.6 Dimensions 4.7 Weight
NASAfTM- 2001-2 11316
Kyocera PV2898 Multicrystal modules, two panels on station 16.9 volts dc each 120 Watts each 56.0"x25.7" each 26.2 Ibs. each
Zomeworks TM3855 Non-energy-consuming thermal activation Accommodates two 56.0"x25.7" panels 821bs.
Alumapro 18PP-8/0,006 Dual layer, electrochemical , four in parallel 18 volts dc 50 farads each , 200 farads total 8.1 kilojoules each , 32.4 kilojoules total 6.5"x7.0"x3.25" each 1 0 Ibs. each, 40 Ibs. total
Exeltech XP-2-1-1-6-0-X7 True sine wave output inverter 12 volts dc 117 volts ac, 2.1 amps ac, 60 Hz
101bs.
21

Page intentionally left blank
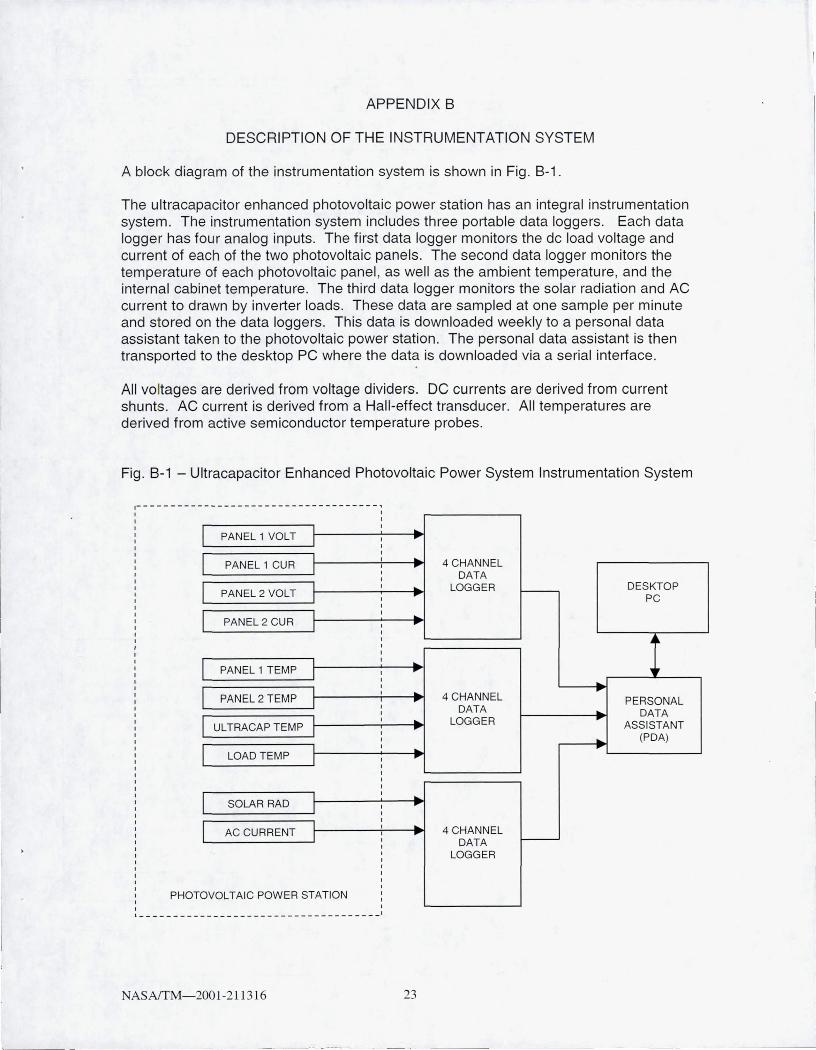
APPENDIX B
DESCRI PTION OF THE INSTRUMENTATION SYSTEM
A block diag ram of the instrumentation system is shown in Fig . B-1 .
The ultracapacitor enhanced photovoltaic power station has an integral instrumentation system. The instrumentation system includes three portable data loggers. Each data logger has fou r analog inputs. The first data logger monitors the dc load voltage and current of each of the two photovoltaic panels. The second data logger monitors the temperature of each photovoltaic panel , as well as the ambient temperatu re, and the internal cabinet temperatu re. The third data logger monitors the solar radiation and AC current to drawn by inverter loads. These data are sampled at one sample per minute and stored on the data loggers. This data is downloaded weekly to a personal data assistant taken to the photovoltaic power station . The personal data assistant is then transported to the desktop PC where the data is downloaded via a serial interface.
All voltages are derived from voltage dividers. DC currents are derived from current shunts. AC current is derived from a Hall-effect transducer. All temperatures are derived from active semiconductor temperature probes.
Fig. B-1 - Ultracapacitor Enhanced Photovoltaic Power System Instrumentation System
I I
I I
PANEL 1 VOLT I I ... I I
I PANEL 1 CUR I _ ... 4 CHANN EL I I ... I DATA I
I I LOGGER DESKTOP PANEL 2 VOLT I I PC
I
I I
PANEL 2 CUR I I ... I I
~ I I
l I
PANEL 1 TEMP I I ... I .. I
I PANEL 2 TEMP I .. 4 CHANNEL
... I .... PERSONAL
I DATA I DATA
I UL TRACAP TEMP I I ---.. LOGGER ASSISTANT I
... (PDA) I ---..
I I .. ...
LOAD TEMP J I ....
I I I I
I I ..
SOLAR RAD I I I I
I AC CURRENT I .. 4 CHANNEL
J I I DATA I I LOGG ER I I I I I
VOLTAIC POWER STATION I I PHOTO I
: _ ____ _______ __ _____ _ _ __ ____ _ _ ____ ___ 1
ASAffM- 2001-211316 23
REPORT DOCUMENTATION PAGE Form Approved
OMB No. 0704-0188
Public reporting burden for this collection of information is estimated to average 1 hour per response, including the time for reviewing instructions, searching existing data sources, gathering and maintaining the data needed, and completing and reviewing the collection of information. Send comments regarding this burden estimate or any other aspect of this collection of information, including suggestions for reducing this burden, to Washington Headquaners Services, Directorate for Information Operations and Reports, 1215 Jefferson Davis Highway, Suite 1204, Arlington, VA 22202-4302, and to the Office of Management and Budget, Paperwork Reduction Project (0704-0188), Washington, DC 20503.
1. AGENCY USE ONLY (Leave blank) 1
2.
REPORT DATE 1
3.
REPORT TYPE AND DATES COVERED
Novem ber 200 1 Technica l Memorandum 4. TITLE AND SUBTITLE 5. FUNDING NUMBERS
Baseline Testing of the Ultracapacitor Enhanced Photovoltaic Power Station
6. AUTHOR(S) ~-25 1-30-O7-00
Dennis J . Eichenberg, John S. Kolacz, and Paul F. Tavem el[j
7. PERFORMING ORGANIZATION NAME(S) AND ADDRESS(ES) 8. PERFORMING ORGANIZATION REPORT NUMBER
National Aeronautics and Space Adrnini su'ation John H. Glenn Research Center at Lewis Fie ld E-13 127 Cleveland, Ohio 44135 - 3 19 1
9. SPONSORING/MONITORING AGENCY NAME(S) AND ADDRESS(ES) 10. SPONSORING/MONITORING AGENCY REPORT NUMBER
National Aeronautics and Space Adrninisu'ation Washington, DC 20546-0001 NASA TM- 2001-2 11316
11. SUPPLEMENTARY NOTES
Responsible person, Denni s J . Eichenberg, organization code 7720 , 2 16--433- 8360.
12a. DISTRIBUTION/AVAILABILITY STATEMENT 12b. DISTRIBUTION CODE
Unclassified - U nlimited Subject CategOIies: 32, 33, and 44 Distributio n: Nonstandard
Avai lable electl'Onically at htrp:llg It rs.grc .na~a.aov/GLTRS
This publication is avai lable from the NASA Center for AeroSpace InfoIll1ation. 301 -62 1-0390. 13. ABSTRACT (Maximum 200 words)
The NASA John H. Glenn Research Center is developing an advanced u!tracapacitor enhanced photovolraic power station. Goals of th is effort include maximizing photovoltaic power generation effic ie~cy and extending the life of photovoltaic energy storage systems. Unique a pects of the power station include the use of a solar tracker. and ulu'acapacitors for energy storage. The photovoltaic power station is seen as a way to provide elecnic power in remote location that would otherwise not have elecnic power, provide indepen-dence foml utili ty systems, reduce pollution, reduce foss il fuel consumption, and reduce operating costs. The work was done under the Hyblid Power Management (HPM) Program, which includes the Hybrid Elecnic Transit Bus (HETB), and the E-Bike. The power station complements the E-Bike extremely well in that it permits the charging of the vehicle batteries in remote locations. Other applications include scientific research and medical power sources in isolated regions. The power station is an inexpensive approach to advance the state of the an in power technology in a practical application. The project u'ansfers space technology to terresnial u e via nontraditional partners, and provides power system data valuable for future space applications. A description of the ultracapacitor enhanced power station , the resul ts of performance testing and future power station development plans i the subject of this report. The report concludes that the u1tracapac itor en.hanced power station provides excellent performance, and dlat the implementation of ultracapacitors in the power system can provide significant performance improvements.
14. SUBJECT TERMS 15. NUMBER OF PAGES
27 Photovoltaic conversion 16. PRICE CO DE
17. SECURITY CLASSIFICATION 18. SECURITY CLASSIFICATION 19. SECURITY CLASSIFICATION 20. LIMITATION OF ABSTRACT OF REPORT OFTHIS PAGE
U nclassified Unclassified
NSN 7540-01-280-5500
OF ABSTRACT
Unci assifi ed
S tanda rd Form 298 (Rev. 2 -89) Prescribed by ANSI Std. Z 39- 18 298-102