Baseline survey of families Research Report July 2015 · Baseline survey of families . Research...
104
Study of Early Education and Development Baseline survey of families Research Report July 2015 Svetlana Speight, Ruth Maisey, Jenny Chanfreau, Sarah Haywood, Chris Lord and David Hussey – NatCen Social Research
Transcript of Baseline survey of families Research Report July 2015 · Baseline survey of families . Research...

Study of Early Education and Development Baseline survey of families
Research Report
July 2015
Svetlana Speight, Ruth Maisey, Jenny Chanfreau, Sarah Haywood, Chris Lord and David Hussey – NatCen Social Research

Contents List of figures 5
List of tables 6
Acknowledgements 9
Executive summary 10
1 Introduction 18
1.1 Background to the evaluation 18
1.2 Aims and scope of the report 19
1.3 Methodology 20
1.4 Report conventions 21
2 Baseline profile of the study sample by disadvantage group 22
2.1 Age of mothers and children 23
2.2 Family type 23
2.3 Housing tenure 25
2.4 Mothers’ academic qualifications 25
2.5 Mothers’ economic status 26
2.6 Household economic status 27
3 Childcare and early education use from birth to age two 29
3.1 Childcare use from birth to age two 30
3.1.1 Use of childcare and child’s age 30
3.1.2 Types of formal childcare used 31
3.1.3 Time spent in formal childcare 34
3.1.4 Age when child started receiving childcare 35
3.2 Childcare use at age two 37
3.2.1 Type of childcare used in school term time and in school holidays 37
2

3.2.2 Maternal employment and childcare use at age two 38
3.2.3 Take-up of the two-year-old entitlement 38
3.3 Families not using formal early years provision 41
3.3.1 Characteristics of families not using formal childcare 41
3.3.2 Reasons for not using formal childcare 42
4 Links between home environment, child outcome measures and childcare take-up 45
4.1 Home environment by disadvantage group and formal childcare use 46
4.1.1 Home learning environment 46
4.1.2 CHAOS: the Confusion, Hubbub And Order Scale 47
4.2 Baseline child measures by disadvantage group and formal childcare use 48
4.2.1 Sure Start Language Measure 48
4.2.2 The Adaptive Social Behaviour Inventory 49
5 Conclusions 53
5.1 Childcare during the first two years 53
5.2 Take-up of funded provision for two-year-olds from lower income families 54
5.3 Home environment, child outcomes and childcare take-up 54
5.4 Next steps for this strand of the SEED evaluation 55
References 56
A. Appendix - Methodology 58
Design overview 58
Sampling 59
Clustering 60
Disadvantage groups 60
Questionnaire 61
Data collection 63
3

Response rates 64
Weighting 66
B. Appendix - Socio-demographic characteristics of participants 68
C. Appendix - Additional tables 77
D. Appendix – Survey materials 97
4

List of figures Figure 2.1 Family type by disadvantage level 23
Figure 2.2 Mothers’ highest academic qualification by disadvantage level 26
Figure 2.3 Household economic status by disadvantage level 28
Figure 3.1 Use of formal childcare by disadvantage level 31
Figure 3.2 Time spent in formal childcare by age point 35
Figure 3.3 Age (in months) child started using formal childcare by disadvantage level 36
Figure 3.4 Type of childcare used in term time by funded childcare place users 40
Figure 3.5 Per cent of families not using formal childcare, by family type, mother’s qualification level and by disadvantage group 42
Figure 3.6 Reason for not using formal childcare 43
Figure 4.1 Home learning environment score by disadvantage group and formal childcare use 47
Figure 4.2 CHAOS score by formal childcare use and disadvantage group 48
Figure 4.3 SSLM score by formal childcare use and disadvantage group 49
Figure 4.4 ASBI Conformity and Compliance score by formal childcare use and disadvantage group 51
Figure 4.5 ASBI Anti-Social score by formal childcare use and disadvantage group 52
Figure A.1: Longitudinal survey design 59
5

List of tables Table 2.1 Age of child’s biological mother by disadvantage level 23
Table 2.2 Housing tenure by disadvantage level 25
Table 2.3 Economic status of the child’s mother by disadvantage level 27
Table 3.1 Childcare use from birth to age two by disadvantage level 32
Table 3.2 Take-up of two year old entitlement by disadvantage level 39
Table 4.1 ASBI scores by disadvantage group 50
Table A.1 Questionnaire topics 61
Table A.2 Fieldwork response figures (N) 65
Table A.3 Standard fieldwork response rates 65
Table A.4 Characteristics of responding and non-responding samples 66
Table B.1 Sex of respondent by disadvantage level 68
Table B.2: Family type by disadvantage level 68
Table B.3: Respondent’s legal marital status by disadvantage level 68
Table B.4: Number of children in the household by disadvantage level 69
Table B.5: Child’s ethnicity by disadvantage level 70
Table B.6: Language spoken at home by disadvantage level 71
Table B.7: Housing tenure by disadvantage level 72
Table B.8: Sources of income by disadvantage level 73
Table B.9: Level of household income by disadvantage level 74
Table B.10: Household economic status by disadvantage level 74
Table B.11: Highest parental NSSEC by disadvantage level 75
Table B.12: Mother’s highest academic qualification by disadvantage level 75
Table B.13: Mother’s highest vocational qualification by disadvantage level 76
Table C3.1 Childcare use from birth to age two by disadvantage level 77
6

Table C3.2 Time spent in formal childcare (hours per week) 78
Table C3.3 Time spent with childminder (hours per week) 79
Table C3.4 Time spent at day nursery (hours per week) 80
Table C3.5 Time spent at nursery school (hours per week) 81
Table C3.6 Age in months when started using childcare 82
Table C3.7 Age in months when started using individual formal childcare 83
Table C3.8 Age in months when started using group-based formal childcare 84
Table C3.9 Childcare use in term time and school holidays at age two by disadvantage level 85
Table C3.10 Childcare use at age two by mother’s work status 86
Table C3.11 Formal childcare type used at age two by mother’s work status 86
Table C3.12 Type of formal childcare used by children receiving funded places 86
Table C3.13 Age of child (in months) when started receiving the funded provision 87
Table C3.14 Take-up of two-year-old entitlement by disadvantage level and family type 88
Table C3.15 Take-up of two-year-old entitlement by disadvantage level and mother’s level of qualification 89
Table C3.16 Reason for not using formal childcare 90
Table C4.1 Sure Start Language measure 91
Table C4.2 Sure Start Language measure (including similar word in English) 91
Table C4.3 Sure Start Language measure (including word in another language) 92
Table C4.4 Sure Start Language measure (including word in another language or similar word in English) 92
Table C4.5 ASBI: Conformity & compliance 93
Table C4.6 ASBI: Pro-social 93
Table C4.7 ASBI: Confidence 94
Table C4.8 ASBI: Anti-social 94
7
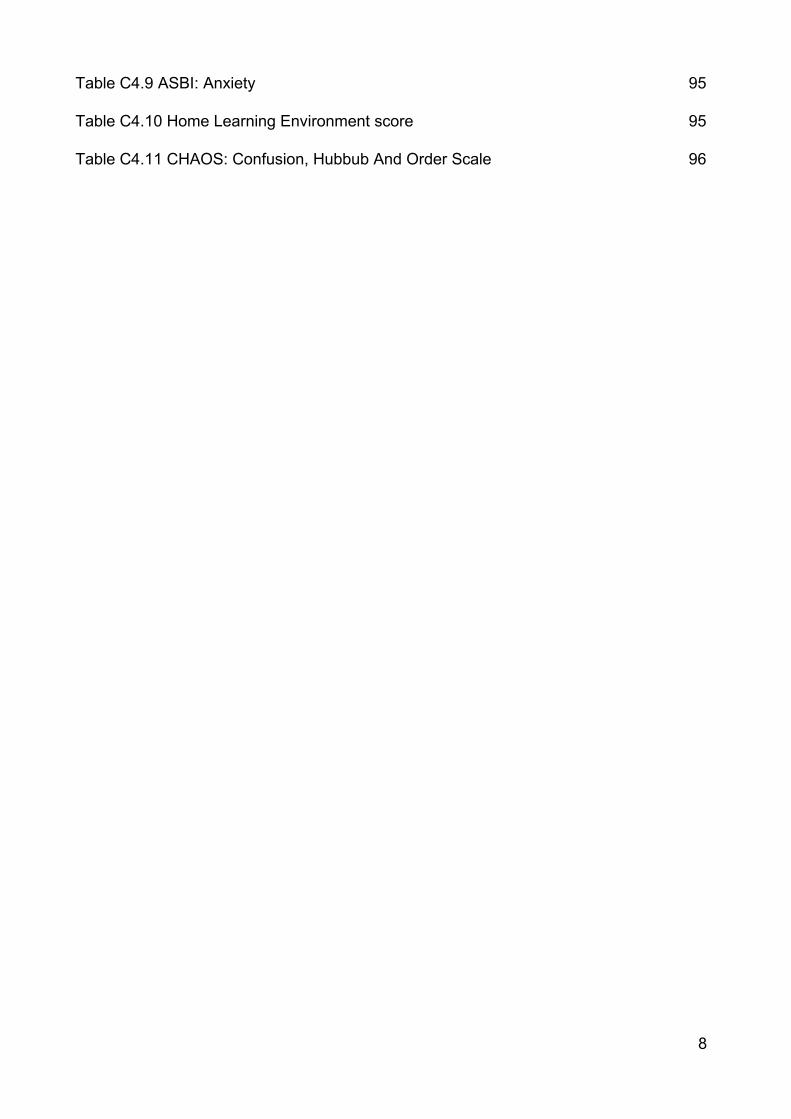
Table C4.9 ASBI: Anxiety 95
Table C4.10 Home Learning Environment score 95
Table C4.11 CHAOS: Confusion, Hubbub And Order Scale 96
8

Acknowledgements We would like to thank all the parents who took part in the baseline survey for the Study of Early Education and Development (SEED) for their time and sincere answers.
Many colleagues at NatCen Social Research were involved in designing and implementing the survey of parents. We are grateful to Dr Jane O’Brien, Steve Morris, Charlotte Clarke, Dr Emily Tanner, Eloise Poole, Emma Fenn, Kevin Palmer, Richard Akers, Lesley Birse and NatCen interviewers who interviewed parents around the country. We are also grateful to Sue Nicholson for her help in preparing the report for publication.
This evaluation is carried out by NatCen Social Research in partnership with the University of Oxford, 4Children and Frontier Economics. We would like to thank our partners there Professor Ted Melhuish, Sue Robb and Dr Gillian Paull for their support for the survey and insightful comments on the report.
We are also grateful to Maura Lantrua, Rosalyn Harper and Steve Hamilton at the Department for Education (DfE) for their support throughout this project and their valuable feedback on the report. We are grateful to members of the SEED Advisory Board for their input into the design of this evaluation and helpful comments on earlier drafts of this report.
9

Executive summary Background to the evaluation
Research has shown that good quality early years education can have a positive effect on the educational, cognitive, behavioural and social outcomes of children, both in the short and long term. Successive policies have introduced universal provision, increased the number of children entitled to funded early years education, increased the number of hours of funded entitlement and progressively reduced the age at which children become entitled to funded early years provision.
At present, all three- and four-year-olds in England are entitled to funded early education, for 570 hours per year (commonly taken as 15 hours per week, for 38 weeks of the year). More recently the Government has expanded this entitlement to benefit two-year-old children living in the most disadvantaged households in England. From September 2013, two-year-old children living in the 20% lower income households became eligible for 15 hours of funded early education per week. This was extended in September 2014, so that two-year-old children in the 40% lower income households in England became eligible for 15 hours of funded provision.
The Study of Early Education and Development (SEED) is a major study that will help the Department for Education (DfE) provide evidence on the effectiveness of early years education and short- and longer-term benefits from this investment. It is being undertaken by NatCen Social Research, the University of Oxford, 4Children and Frontier Economics, and it follows thousands of children across England from the age of two, through to their early years at school.
This report provides descriptive findings from the first wave of the longitudinal survey of parents. Over 5,600 families (six cohorts of children) took part in the baseline survey over the period from October 2013 to November 2014. Most children in the study were two years old at the time of the baseline interview.
The aim of this report is to set the scene for the impact reports which will be available later in the evaluation. The aims of this report are to:
• Describe the profile of families who are taking part in the longitudinal survey and how families’ background characteristics vary by their level of disadvantage.
• Map families’ childcare use from birth to two and provide estimates of take-up of funded places for two-year-olds from lower income families.
• Explore the extent to which the home learning environment and child outcome measures vary with families’ childcare use and their level of disadvantage.
10

Disadvantage groups
To maximise our ability to make comparisons in child outcomes across the spectrum of eligibility for funded early education for two-year-olds, each cohort of children within SEED was designed to have three subgroups:
(1) the most disadvantaged (20%)
(2) the moderately disadvantaged (20-40%)
(3) the not disadvantaged (>40%).
Families were put into groups by DWP prior to sampling using the following criteria. (For full details of eligibility criteria, see Appendix A.)
• The 20% most disadvantaged families had a parent in receipt of one of the following benefits or tax credits:
• Income-based Jobseeker’s Allowance (JSA-IB)
• Income-related Employment Support Allowance (ESA-IR)
• Income Support (IS)
• Guaranteed element of the State Pension Credit (PC with Guarantee Credit)
• Child Tax Credit only (not in receipt of an accompanying Working Tax Credit award) with household gross earnings of less than £16,190.
• The moderately disadvantaged group (20-40%) had a parent in receipt of Working Tax Credits with household gross earnings of less than £16,190.
• The not disadvantaged group (>40%) had parents not in receipt of any of the qualifying benefits or tax credits.
The sample of families in the SEED study is representative of the population of families with children aged two in England.
Baseline profile of the study sample by disadvantage group
There were consistent differences between families in the baseline survey by household disadvantage level. These were with regard to family type (lone versus two parent families), housing tenure, mothers’ academic qualifications and the economic status of both the mother and the household as a whole.
11

• The most disadvantaged families had more lone parents (72%) than both the moderately disadvantaged (21%) and the households which were not disadvantaged (3%).
• The highest level of academic qualification achieved by the child’s mother differed significantly by level of disadvantage, with many more mothers achieving degree level or higher qualifications within the households which were not disadvantaged (50% compared with 5% in the most disadvantaged families).
• Household economic status also differed considerably by level of disadvantage. The households which were not disadvantaged were mainly couples where at least one parent was in work (95%) whereas the most disadvantaged households in the sample were mainly households in which neither parent was in work (82%).
Childcare use from birth to age two
Children from the 20% most disadvantaged families were least likely to receive formal childcare before age two. Only 7% of these children received formal childcare before the age of 12 months and only 15% between one and two years old, compared with 20% and 36% respectively for all children in the study. However, after turning two, over half of children in all three groups were receiving formal childcare (58% of children in the most disadvantaged families, and 60% of all children).
Figure i. Use of formal childcare by disadvantage level
In all groups, and at all ages, group-based formal provision, such as a day nursery or a pre-school, was more common than individual provision, such as a childminder.
12

However, as take-up of formal childcare increased with the child’s age, so did the breadth of different types of childcare used by the families. In the first 12 months, day nurseries and childminders were the most commonly used providers (10% of children attended a day nursery and 5% attended a childminder). At age two, the most common types of formal childcare were:
• Day nursery (25% of all children at this age)
• Nursery school (13%)
• Pre-school (13%)
• Childminder (8%).
Age when child started receiving formal childcare
Children from the most disadvantaged families started receiving formal childcare at a later age on average (22.5 months), compared with children from moderately disadvantaged families (16.6 months) and children from the not disadvantaged families (15.3 months). This suggests that many of the most disadvantaged children started receiving formal childcare when they qualified for the funded provision.
Take-up of funded provision for two-year-olds from lower income families
Almost half of children (48%) from the most disadvantaged families were receiving the Government funded two-year-old entitlement. About a tenth of children (10%) in these families were receiving formal childcare but not the funded hours, and about two fifths (42%) were not receiving any formal childcare at age two.
The largest proportion of those who were receiving the two-year-old entitlement reported using a day nursery. Forty-six per cent of children in the most disadvantaged families that were taking up the two-year-old entitlement were attending a day nursery at age two, compared with 23% attending a nursery school and 23% attending a pre-school.
Reasons for not using formal childcare
The proportion of families not using any early years formal provision when their child was aged two varied by socio-demographic characteristics of the family. In particular, there was a strong association between mothers’ level of educational attainment and how likely families were to use formal childcare. In all three groups, mothers who had no or low
13

formal qualifications were least likely to use formal childcare, and mothers who had degrees were most likely to use formal childcare when their child was two.
The most common reason for not using formal childcare as reported by parents was personal preference (about half of the families mentioned this as their main reason, and that proportion did not vary much by level of disadvantage, at around 45-51%). However, another substantial minority of families mentioned cost of childcare as their main reason. This was mentioned by 17% of those in the most disadvantaged families, 34% of those in moderately disadvantaged families, and 26% of those in the not disadvantaged families. Furthermore, limited availability and being on a waiting list were mentioned by 12% of those in the most disadvantaged families, 5% of those in moderately disadvantaged families and 3% of those in the not disadvantaged families.
Figure ii. Main reason for not using formal childcare
Taken together, these figures suggest that availability of the two-year-old entitlement and of affordable childcare more generally is still a substantial barrier to take-up of early years provision by families with two-year-olds. It is also worth noting that parents in the moderately disadvantaged families were most likely to report the cost of childcare as their main reason for not using it (34%). Given the gradual roll-out of the two-year-old entitlement to families in these circumstances over the course of SEED fieldwork period (see Appendix A), most children in these families were not eligible for the funded provision at the time of the baseline survey. This may explain why the percentage of families in this group reporting cost as their main reason for not using formal childcare was double that of the most disadvantaged families (34% compared with 17%).
14

Home environment, disadvantage and childcare use
Families’ economic circumstances were strongly associated with their home environment. Parents in disadvantaged families were significantly less likely to engage in home learning activities than those whose economic circumstances were better. There were pronounced differences by level of disadvantage in how chaotic (on the CHAOS score) family homes were as well.
Within the groups of families who were not disadvantaged or were moderately disadvantaged, there were further differences by use of childcare. Families where children were receiving formal childcare before age two were more likely to engage in home learning and less likely to be chaotic than those families whose children had never received any formal childcare. However, there were no statistically significant differences by childcare use on those measures within the group of the most disadvantaged families.
Figure iii. Home learning environment score by disadvantage group and formal childcare use
Child outcomes, disadvantage and childcare use
The survey collected a number of child outcome measures as part of the interview with the parent:
• the Sure Start Language Measure (SSLM), which is a measure of vocabulary based on a list of 100 words
15

• the Adaptive Social Behaviour Inventory (ASBI), which is a measure of children’s social and behavioural development across five factors: (1) Conformity and Compliance; (2) Pro-social; (3) Confidence and Independence; (4) Anti-social; and (5) Anxiety.
On the SSLM measure, there were pronounced differences between the three groups of families, with children from the most disadvantaged families showing substantially less developed language skills (SSLM score of 69.8) compared with children from moderately disadvantaged families (77.5) and children from families that were not disadvantaged (80.3).
There were clear patterns of association between children’s language skills and receipt of formal childcare at different age points, but only with regard to families that were not disadvantaged or were only moderately disadvantaged. For these two groups, children’s receipt of formal childcare before age two was associated with higher SSLM scores compared with no formal childcare. However, within the group of the most disadvantaged families, there was no association between receipt of formal childcare and language skills.
On social behaviour measures (ASBI), children from the 20% most disadvantaged families were reported by parents to be showing less positive behaviour (on the scales: Conformity and Compliance, Pro-social, and Confidence and Independence) and more negative behaviour (on the scales: Anti-social and Anxiety) compared with children from families that were not disadvantaged (>40%).
Analysis showed some associations between behaviour measures and children’s receipt of formal childcare. For example, on the Conformity and Compliance measure, children who received formal childcare before age two were showing more positive behaviour than children who had not attended any formal childcare, and this significant association held within each of the three disadvantage groups. Similar patterns were found for the Pro-Social and Confidence measures. However, there were no consistent patterns of association between childcare use and children’s scores on the Anti-social and the Anxiety measure when analysed within the three disadvantage groups.
Conclusions
The SEED evaluation aims to explore to what extent early years provision, and high quality early years provision in particular, can improve outcomes for children and especially outcomes for children from disadvantaged backgrounds. With this in mind, this report provides detailed descriptive analysis of childcare use by families in the three disadvantage groups. It also tentatively examines relationships between childcare use, family environment and child outcomes.
16

There were clear differences between the three groups of families in the study: the 20% most disadvantaged, the moderately disadvantaged (20-40%) and the not disadvantaged (<40%). Their socio-demographic profile was very different in terms of maternal qualifications, maternal employment, household working status, family type, housing tenure and other key socio-demographic parameters. The environment in these family homes with regard to home learning and how organised or chaotic their home was varied greatly by level of disadvantage as well. Finally, child outcomes at age two were clearly different in the three groups, with children in the most disadvantaged group showing the worst outcomes compared with the other two groups.
Analysis of childcare use by families in the three disadvantage groups at different points in a child’s life (before 12 months old, between one and two years old, and age two) shows clear differences in rates of take-up and in types of provision used. To what extent early years provision matters for child outcomes will be explored later in the evaluation as part of the impact analysis.
17

1 Introduction
1.1 Background to the evaluation Research has shown that good quality early years education can have a positive effect on the educational, cognitive, behavioural and social outcomes of children, both in the short and long term (e.g. Lloyd and Potter, 2014; Maisey et al., 2013; Melhuish, 2004; Smith et al., 2009; Sylva et al., 2004; Sylva et al., 2010). It has also been shown to have greatest impact on children from the most disadvantaged backgrounds, and potentially is able to make a key contribution to narrowing the gap in development between groups of children. Attending high quality early years education helps prepare young children to be ‘school ready’ and more able to learn when they start school (Becker, 2011), an important foundation for a successful educational experience improving their long-term life outcomes. However, children from disadvantaged families are less likely to attend early years settings (Speight et al., 2010a), even for provision which is funded by the Government (Speight et al., 2010b).
Successive policies have introduced universal provision, increased the number of children entitled to funded early years education, increased the number of hours of funded entitlement and progressively reduced the age at which children become entitled to funded early years provision. At present, all three- and four-year-olds in England are entitled to funded early education, for 570 hours per year (commonly taken as 15 hours per week, for 38 weeks of the year). More recently the Government has expanded this entitlement to benefit two-year-old children living in the most disadvantaged households in England.
From September 2013, two-year-old children living in the 20% lower income households became eligible for 15 hours of funded early education per week. This was extended in September 2014, so that two-year-old children in the 40% lower income households in England were eligible for 15 hours of funded provision. Two-year-old funded places are available in formal childcare and early education settings such as day nurseries, childminders, nursery schools and nursery classes (HM Government, 2013).
Early education represents a considerable cost to the Government, and in 2012 the National Audit Office put an onus on the Department for Education to provide more robust evidence regarding the longer-term benefits of this investment.
18

"The Department for Education needs to do more to put itself in the position to assess whether the forecast long-term benefits of free education for three- and four-year olds are being achieved. It also needs to understand how the arrangements for funding providers of that early education drive its availability, take-up and quality. Both of these are necessary if it is to get the best return for children from the £1.9 billion spent each year."
Amyas Morse, Head of the National Audit Office (National Audit Office, 2012)
The Study of Early Education and Development (SEED) is a major study that will help the Department for Education (DfE) provide this evidence. It is being undertaken by NatCen Social Research, the University of Oxford, 4Children and Frontier Economics, and it follows thousands of children across England from the age of two, through to their early years at school.
1.2 Aims and scope of the report The aims of SEED are to:
• Provide evidence of the impact of current early years provision on children’s outcomes
• Provide a basis for longitudinal assessment of the impact of early years provision on later attainment
• Inform policy development to improve children’s readiness for school
• Assess the role and influence of the quality of early education provision on children’s outcomes
• Assess the overall value for money of early education in England and the relative value for money associated with different types (e.g. private, voluntary, maintained) and quality of provision
• Explore how parenting and the home learning environment interacts with early years education in affecting children’s outcomes.
To address these aims, SEED has several inter-related research elements:
• A longitudinal survey of families with pre-school children
• Studies of early years settings and of childminder provision (quality, characteristics and process) including an assessment of the Early Years Pupil Premium
• Case studies of good practice in early years settings
• A value for money study
• Qualitative studies of childminders and of early education provision for children with special educational needs and/or disabilities.
19

This report provides descriptive findings from the first wave of the longitudinal survey of parents. The aim is to set the scene for the impact reports which will be available later in the evaluation. The aims of this report are to:
• Describe the profile of families who are taking part in the longitudinal survey and how families’ background characteristics vary by their level of disadvantage
• Map families’ childcare use from birth to two and provide estimates of take-up of funded places for two-year-olds from lower income families
• Explore the extent to which the home learning environment and child outcome measures vary with families’ childcare use and their level of disadvantage.
1.3 Methodology This section summarises the methodology of the SEED survey. Full details are provided in Appendix A.
The longitudinal survey of families collects information at three time points:
• when the families’ child is about two years old (Wave 1)
• when the child is about three years old (Wave 2)
• when the child is about four years old (Wave 3).
This report presents data from Wave 1 of the SEED survey.
To maximise our ability to make comparisons in child outcomes across the spectrum of eligibility for funded early education for two-year-olds, SEED sample was designed to have three subgroups:
(1) the 20% most disadvantaged families
(2) the moderately disadvantaged (20-40%)
(3) the not disadvantaged (>40%).
Families were put into groups by DWP prior to sampling using the following criteria. (For full details of eligibility criteria, see Appendix A.)
• The 20% most disadvantaged families had a parent in receipt of one of the following benefits or tax credits:
• Income-based Jobseeker’s Allowance (JSA-IB)
• Income-related Employment Support Allowance (ESA-IR)
• Income Support (IS)
20

• Guaranteed element of the State Pension Credit (PC with Guarantee Credit)
• Child Tax Credit only (not in receipt of an accompanying Working Tax Credit award) with household gross earnings of less than £16,190.
• The moderately disadvantaged group (20-40%) had a parent in receipt of Working Tax Credits with household gross earnings of less than £16,190.
• The not disadvantaged group (>40%) had parents not in receipt of any of the qualifying benefits or tax credits.
The interview was face-to-face in respondents’ homes. The fieldwork for the baseline survey was undertaken over the period from October 2013 to November 2014 (as families with children in different cohorts were surveyed at different points in time).
In total, 5,643 parents took part in the baseline survey (5,641 fully productive and two partially productive interviews) and the overall response rate was 63%. Response was lower for the most disadvantaged group (58%) than for the not disadvantaged group (66%).
Once the data had been collated and cleaned, a weighting scheme was designed for the study to account for different selection probabilities and non-response bias. Once weighted, the baseline sample of families taking part in SEED is representative of all families with two-year-olds in England.
Full details of the SEED survey methodology are provided in Appendix A.
1.4 Report conventions • All percentages and means are weighted. Both the weighted and unweighted base
sizes are shown in each table.
• Estimates based on unweighted base sizes of less than 50 cases are indicated in tables by [ ] and should be interpreted with caution. Estimates based on unweighted base sizes of less than 30 cases have been replaced with ‘*’ as these estimate may not be reliable.
• Percentages are rounded up or down to whole numbers and therefore may not always sum to 100.
• Percentages less than 0.5 (but greater than 0) are shown in tables as ‘+’.
• Throughout the report, whenever the text comments on differences between subgroups of the sample, these differences have been tested for statistical significance and found to be significant at the 95% confidence interval or above.
21

2 Baseline profile of the study sample by disadvantage group
Key findings
• The most disadvantaged families had more lone parents (72%) than both moderately disadvantaged (21%) and households which were not disadvantaged (3%).
• The highest level of academic qualification achieved by the child’s mother differed significantly by level of disadvantage. Many more mothers achieved degree level or higher qualifications within households which were not disadvantaged (50%) than in the most disadvantaged families (5%).
• Household economic status also differed considerably by level of disadvantage. Households which were not disadvantaged were mainly couples where at least one parent was in work (95%). The most disadvantaged households in the sample were mainly households in which neither parent was in work (82%).
• The socio-demographic profile of the SEED sample was broadly similar to that of families in the Childcare and Early Years Survey of Parents 2012-13.
This chapter presents a brief profile of the baseline sample, focusing on selected socio-demographic characteristics such as family type, housing tenure, mothers’ academic qualifications and the economic status of the household. Tables of all socio demographics collected, split by level of disadvantage, can be found in Appendix B.
Throughout this chapter, where appropriate, the socio-demographic profile of families in the SEED survey is compared with those from the Childcare and Early Years Survey of Parents (2012-2013) (Huskinson et al., 2014). This was a survey of a similar population – families with children under 15 in England - which collected information on use of and attidues towards childcare and early years education. The chapter also draws comparisons with the Families and Children Study (FACS) 2008 (which was the latest survey in that series; Maplethorpe et al., 2010), as this survey allows comparisons between the most disadvantaged families in SEED and in FACS.
At the SEED baseline interview, 91% of respondents were the child’s biological mother. Seven per cent were the child’s biological father and the remaining sample were step-parents, adoptive parents, foster parents, grandparents and other carers with parental responsibility for the child (table not shown).
22

2.1 Age of mothers and children The age of biological mothers who responded at baseline can be seen in Table 2.1, split by level of disadvantage:
Table 2.1 Age of child’s biological mother by disadvantage level
Age of child’s biological mother
Most disadvantaged
(20%)
Moderately disadvantaged
(20-40%)
Not disadvantaged
(>40%)
All
Under 24 33 15 4 14
25 – 29 29 29 15 23
30 – 35 24 34 43 36
36 – 39 8 14 24 17
40+ 6 8 14 10
Unweighted bases 1,530 1,779 1,836 5,145
Weighted bases 1,164 1,715 2,222 5,101
Base: Biological mothers of selected child. Table shows column %. Source: SEED Baseline
The mean age of biological mothers who took part in the baseline survey was 31 years old.
As explained in Chapter 1, the majority of children were aged two at the time of the interview (92%), however a small proportion (8%) of children were aged three. As the interviews took place in the term of their third birthday (before they were eligible to receive the funded hours of early education for three-year-olds) these children were still eligible for inclusion in the study.
2.2 Family type A quarter of all families in the study (25%) were lone parents and a large proportion (72%) of the most disadvantaged households were lone parents. Within ich just 3% were lone parents).
Figure 2.1 this is compared with the moderately disadvantaged households (21% of which were lone parent families) and households which were not disadvantaged (within which just 3% were lone parents).
23

Figure 2.1 Family type by disadvantage level
Base: All respondents Source: SEED baseline
These findings are consistent with those from the Childcare and Early Years Survey of Parents 2012-13, where about 25% of families were lone parent families (Huskinson et al., 2014), and with official statistics for the UK for 2014, which reported that 25% of all families with dependent children were lone parent families (Office for National Statistics, 2015).
For the most disadvantaged families in the SEED study findings are consistent with those from the Families and Children Study 2008. Of the FACS families in the lowest income quintile, 70% were lone parent families (Maplethorpe et al., 2010).
Forty-one per cent of the SEED sample had one child, 37% had two children, 15% had three children and 8% had four or more children at the time of their baseline interview. The percentage of large families (families with four or more children) differed significantly by level of disadvantage. Fourteen per cent of the most disadvantaged households had four or more children, whereas in households which were not disadvantaged, this figure was 5% (see Table B.4 in Appendix B).
In the Childcare and Early Years Survey of Parents 2012-13, large families were defined as those with three or more children. The percentage of large families defined in this way was slightly higher in SEED (23%) compared with the Childcare and Early Years Survey of Parents (13%, Huskinson et al. 2014).
24

2.3 Housing tenure In total, 40% of all families in the sample were buying their home with the help of a loan or mortgage, 28% were renting from a private landlord and 23% were renting their home from a local authority or housing association. Table 2.2 shows that whilst 65% of households which were not disadvantaged were buying their home with the help of a loan or mortgage, within the most disadvantaged households this figure was just 4%. Just over half (51%) of the most disadvantaged households were renting their home from a local authority or housing association whilst 38% were renting their home from a private landlord.
Table 2.2 Housing tenure by disadvantage level
Housing tenure Most
disadvantaged (20%)
Moderately disadvantaged (20-
40%)
Not disadvantaged
(>40%)
All
Own their home outright 1 3 7 4
Buying their home with the help of a mortgage or loan 4 32 65 40
Pay part rent and part mortgage (shared ownership)
1 2 1 1
Rent their home from a local authority or housing association
51 26 7 23
Rent their home from a private landlord 38 33 19 28
Live in their home rent-free 6 4 3 4
Unweighted bases 1,647 1,972 2,013 5,632
Weighted bases 1,261 1,916 2,455 5,632
Base: All families. Table shows column %. Source: SEED Baseline
When comparing these percentages with those in the Childcare and Early Years survey of Parents 2012-13, there were more home owners in the Childcare survey (9% of families owned their home outright and 49% were buying their home with the help of a mortgage; Huskinson et al. 2014).
2.4 Mothers’ academic qualifications Respondents were asked about the highest academic qualifications which they and their partner had obtained.
25

In total, 23% of mothers had no, or low academic qualifications, 48% reported that GCSEs/A levels were the highest qualification they had obtained and 29% of mothers had an honours degree or higher.
The percentage of mothers who had an honours degree or higher varied significantly by level of disadvantage. Of mothers in the most disadvantaged households, 5% had an honours degree or higher compared with 50% of mothers in households which were not disadvantaged.
Figure 2.2 also shows that 48% of mothers in the most disadvantaged households had no, or low qualifications compared with 23% in the moderately disadvantaged households and 10% of mothers in households which were not disadvantaged.
Tables of both mothers’ highest academic and vocational qualifications can be found in Appendix B.
Figure 2.2 Mothers’ highest academic qualification by disadvantage level
Base: All mothers Source: SEED baseline
2.5 Mothers’ economic status Fifty-four per cent of mothers in the study were working, 35% were looking after the home or family, and 6% were unemployed. The differences in mothers’ economic status by level of disadvantage can be seen in Table 2.3. It shows that, as expected, the highest rate of unemployment was among mothers from the most disadvantaged households
26

(18% compared with just 2% in both moderately disadvantaged households and households which were not disadvantaged).
In terms of the patterns of employment among mothers, 22% were working full time, 26% were working part time (16-29 hours per week) and 6% were working 1-15 hours per week. However, of mothers in the most disadvantaged households, just 2% were working full time, 5% were working part time (16-29 hours) and 3% were working 1-15 hours per week.
Table 2.3 Economic status of the child’s mother by disadvantage level
Economic status of mother Most
disadvantaged (20%)
Moderately disadvantaged
(20-40%)
Not disadvantaged
(>40%)
All
Working full time (30 or more hours per week)
2 25 30 22
Working part time (16-29 hours per week)
5 34 31 26
Working part time (1-15 hours per week)
3 6 8 6
Unemployed 18 2 2 6
Looking after the home or family
61 29 27 35
Student or training 8 2 1 3
Other 3 1 1 2
Unweighted bases 1,617 1,967 2,014 5,598
Weighted bases 1,237 1,910 2,455 5,602
Base: All mothers. Table shows column %. Source: SEED Baseline
2.6 Household economic status Turning to the economic status of households as a whole, as expected, the households which were not disadvantaged were mainly couples who were both working (65%) and couples where one parent was working (31%).
The most disadvantaged households in the sample were mainly households in which neither parent was in work (82%). This consisted of lone parents who were not working (67%) and couple households where neither parent was working (15%).
In the moderately disadvantaged households, just 4% were households in which neither parent was in work. Two fifths (40%) of households were couples who were both working, 37% were couples where one parent was working and 19% were working lone parents.
27

Figure 2.3 Household economic status by disadvantage level
Base: All respondents Source: SEED baseline
Looking at the sample as a whole, the household economic status of families in SEED and in the Childcare and Early Years survey of Parents 2012-13 was similar. In SEED, 46% of couple households were in work, compared with 43% of couple households in the Childcare survey, and the percentage of lone parents not in work was 16% in this study and 11% in the Childcare Survey (Huskinson et al., 2014).
28

3 Childcare and early education use from birth to age two
Key findings
• Children from the 20% most disadvantaged families were the least likely to receive formal childcare before age two. Only 7% of these children received formal childcare before the age of 12 months and only 15% between one and two years old, compared with 20% and 36% respectively for all children in the study. However, after turning two, over half of children in all three groups were receiving formal childcare (58% of children in the most disadvantaged families, and 60% of all children).
• Children from the most disadvantaged families started receiving formal childcare at a later age on average (22.5 months), compared with children from moderately disadvantaged families (16.6 months) and children from the not disadvantaged families (15.3 months).
• Almost half of children (48%) from the most disadvantaged families were receiving the Government funded two-year-old entitlement. About a tenth of children (10%) in these families were receiving formal childcare but not the funded hours, and about two fifths (42%) were not receiving any formal childcare at age two. The largest proportion of those who were receiving the funded hours of early education reported using a day nursery.
• The most common reason for not using formal childcare as reported by parents was personal preference. However, a substantial minority of families mentioned cost of childcare as their main reason. This was mentioned by 17% of those in the most disadvantaged families, 34% of those in moderately disadvantaged families, and 26% of those in the not disadvantaged families. Furthermore, limited availability and being on a waiting list were mentioned by 12% of those in the most disadvantaged families, 5% of those in moderately disadvantaged families and 3% of those in the not disadvantaged families.
This chapter maps out the use of childcare and early education in the first years of life, with a particular focus on formal provision. It also estimates the take-up of the two-year-old entitlement. The key policy questions that SEED will address through the later impact analysis relate to the effects of Government-funded pre-school education aimed at disadvantaged families. For this reason it is important to understand the use of childcare in the early years among families facing different levels of economic disadvantage.
29

3.1 Childcare use from birth to age two
3.1.1 Use of childcare and child’s age
At each wave, SEED collects information from parents about any childcare and early education received by children in the study. The types of formal childcare asked about include childminders and nannies and a range of different types of group-based childcare: • Nursery school
• Nursery class attached to a primary or infant school
• Day nursery
• Maintained nursery
• Pre-school1
• Special day school or nursery unit for children with special educational needs.2
In addition, SEED also collects information on informal childcare provided by relatives, friends or neighbours. Informal childcare does not include babysitting or care provided by the child’s non-resident parent but means that the child is looked after by a relative, friend or neighbour on a regular basis without their parent present. This chapter focuses mainly on the use of formal childcare as reported by the parents. The use of informal childcare is covered in less detail. Information on both formal and informal childcare is presented in Appendix C.
At the time of the baseline interview, most children in the study were two years old.3 Information on childcare use was collected for three time points in the child’s life:
• in the first 12 months
• when they were between one and two years old
• from the age of two years old onwards.
This section examines how patterns of childcare use changed as the children in the study were getting older.
1 The term ‘pre-school’ includes settings offering sessional care, which are sometimes referred to as ‘playgroups’. 2 Type of childcare received by children is based on parents’ self-reporting and may include some misclassification. 3 Ninety-two per cent of children were two years old and 8% were three years old. The three-year-olds had turned three in the school term in which the interview took place, so they were not yet eligible to receive the universal early years provision for three and four year olds.
30
Use of formal childcare increased among all families in the first three years of the child’s life. However, the pattern of increase differed by level of disadvantage. Among the 20% most disadvantaged children use of formal childcare remained relatively low in the first two years, at 7% of families in the first 12 months and 15% after the first birthday, but increased markedly from age two to 58%. By contrast, moderately disadvantaged (20-40%) and not disadvantaged (>40%) families reported a more steady increase in take-up of formal childcare year-on-year (Figure 3.1; Appendix Table C3.1).
Figure 3.1 Use of formal childcare by disadvantage level
Use of informal childcare, provided by a relative, friend or neighbour, was lowest among the most disadvantaged families at all of the age points. For example, 11% of the most disadvantaged children received informal childcare at age two, compared with 28% of moderately disadvantaged and 33% of not disadvantaged children. Among all families, and in all three disadvantage groups, the use of informal childcare was most common when the child was aged between one and two years old (Appendix Table C3.1).
3.1.2 Types of formal childcare used
In all groups, and at all ages, group-based formal childcare, such as nursery school or day nursery, was more commonly used than individual provision, such as a childminder, nanny or au pair. In fact, day nurseries were the most commonly used type of formal childcare at each age point, regardless of level of disadvantage (Table 3.1).
31

Table 3.1 Childcare use from birth to age two by disadvantage level
Most disadvantaged (20%) Moderately disadvantaged (20-40%) Not disadvantaged (>40%) All
First 12 months 1-2 years 2 years First 12
months 1-2 years 2 years First 12 months 1-2 years 2 years First 12
months 1-2 years 2 years
Childminder 2 2 2 6 10 9 7 11 11 5 9 8
Nanny or au pair + + + + + + 1 3 4 1 2 2
Nursery school 1 3 13 3 7 13 4 9 13 3 7 13
Nursery at primary/ infant school 0 + 3 0 + 2 + + 2 + + 2
Day nursery 3 8 26 11 17 22 12 24 28 10 18 25
Maintained nursery + + + + + + + + + + + +
Pre-school 1 2 14 1 2 12 1 2 13 1 2 13
SEN day school, nursery or unit 0 + + + + + 0 + + + + +
None 93 85 42 79 65 45 75 54 36 81 65 41
Unweighted base 1,647 1,649 1,649 1,975 1,975 1,975 2,018 2,018 2,018 5,640 5,642 5,642
Weighted bases 1,262 1,263 1,263 1,918 1,918 1,918 2,461 2,461 2,461 5,640 5,642 5,642 Base: All Families. Table shows column %. Columns add up to more than 100% as more than one category may apply. Source: SEED Baseline
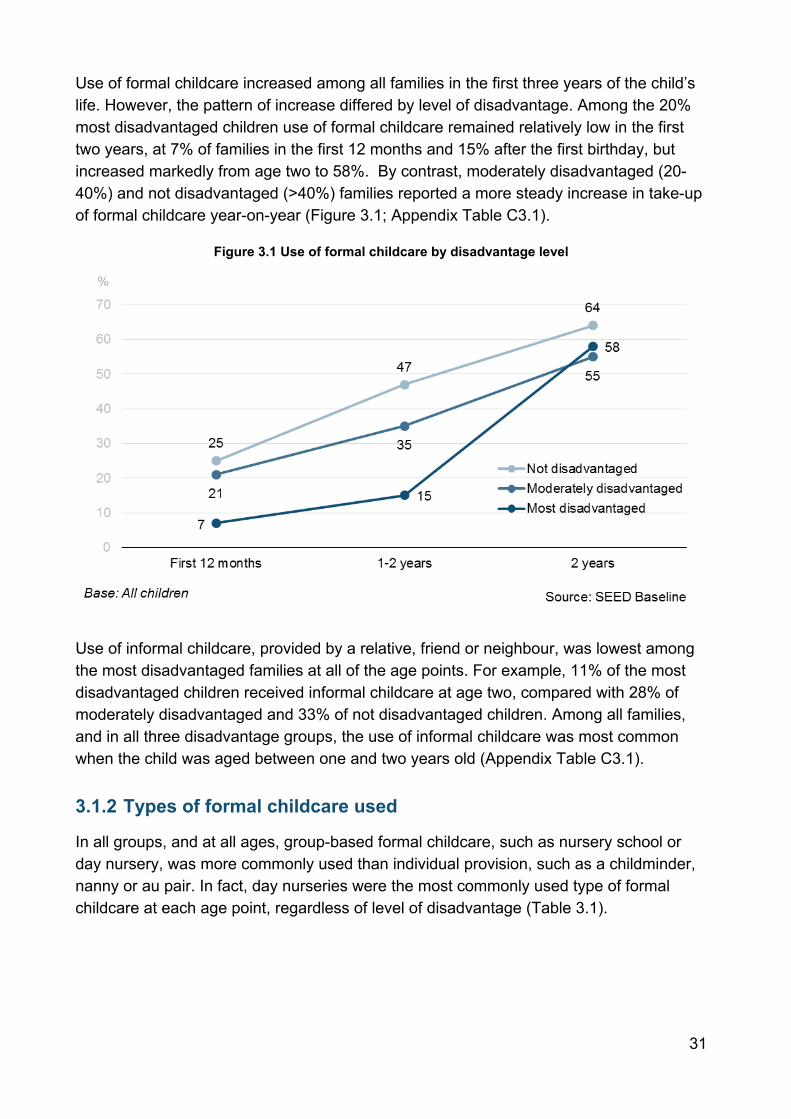
However, a more detailed look at the types of formal childcare used at three age points in the early years shows that as the take-up of formal childcare increased, so did the breadth of different types of childcare commonly used.
One fifth (20%) of all children received some type of formal childcare in the first 12 months (Appendix Table C3.1), and at this age childcare mainly took the form of a day nursery (10%) or a childminder (5%) (Table 3.1).
By the age of two, when 60% of children were receiving some type of formal childcare, day nurseries remained the most commonly used type of childcare but other types of group-based provision were also relatively widely used. The most commonly used types of formal childcare at age two (as reported by the parents) were:
• Day nursery (25% of all children at this age)
• Nursery school (13%)
• Pre-school (13%)
• Childminder (8%)
This change in the types of formal childcare used at different age points is related to two factors: certain types of childcare settings only taking children aged two and older; and the changing composition of childcare users.
Firstly, Table 3.1 suggests that nursery schools, nurseries attached to a primary school and pre-schools are not generally available to babies up to the age of 12 months, and take-up of these types of settings increases greatly from the age of two. While 4% of families reported using one or more of these types of childcare in the first 12 months and 9% of families when the child was between one and two, 28% of families used these forms of childcare when the child was two years old.
Secondly, as use of formal childcare became more common with children getting older, the types of families using formal childcare became more diverse. It is likely that families with children under two using formal childcare were mainly working families requiring childcare to cover parents’ working hours. Information from the latest Childcare and Early Years Survey of Parents shows that the largest proportion (82%) of parents using a day nursery for their pre-school aged child cite economic reasons such as going out to work, while the majority of those using nursery school and nursery class provision cite child-related reasons such as for the child’s educational or social development (62% and 77% respectively; Huskinson et al., 2014). By the time the child turned two, 60% of SEED families were using formal childcare (see Appendix Table C3.1). Childcare users at this age are likely to be a more varied group of families including both working families and families using childcare for other reasons such as early educational purposes.

3.1.3 Time spent in formal childcare
Families that reported using childcare at any of the age points were asked how much time the child spent in each type of childcare at that age. This section examines how time spent in different types of formal childcare varied by age of the child and by level of disadvantage.
It is important to bear in mind the substantial increase in take-up of formal childcare outlined in the previous section when interpreting the change in the time spent in formal childcare. Reflecting this increase in take-up, the overall average (mean) time spent in formal childcare for all children (whether or not they received formal childcare at a given time point) increased with age from just under 4 hours per week on average in the first 12 months to just under 10 hours per week at the age of two (Figure 3.2; Appendix Table C3.2).
The average (mean) time spent in formal childcare by children who received childcare at the age of two was shorter (16.5 hours) than the average time spent in formal childcare by children who received childcare in the first 12 months (20.7 hours) (Figure 3.2; Appendix Table C3.2). As discussed in section 3.1.2, only a fifth (20%) of children received formal childcare in the first 12 months of their lives, while at the age of two this increased to three fifths (60%) of children. Therefore this apparent decline in average hours among children who received formal childcare at a given age point, reflects the increased diversity in the types of families using childcare, and probably a greater variety of reasons for using childcare, rather than individual families reducing the number of hours used over time.
In fact, among those children who received some type of formal childcare at all three age points, the average time spent in formal childcare increased by 1 hour and 42 minutes per week between their first 12 months and the age of two (see Figure 3.2).
34

Figure 3.2 Time spent in formal childcare by age point
Analysis of time spent in different types of formal childcare reveals that children who went to a childminder in their first 12 months spent on average 21.4 hours per week there. As the proportion of children going to a childminder increased with the child’s age, the overall average time spent with a childminder decreased to 18.9 hours per week at the age of two years old (see Appendix Table C3.3). The time spent per week with a childminder did not vary significantly by level of disadvantage.
Time spent in day nursery varied significantly by level of disadvantage. Compared with less disadvantaged children, the most disadvantaged children spent somewhat less time per week at nursery. This was particularly the case at age two. The most disadvantaged children who attended a day nursery at age two spent on average 15 hours per week there, moderately disadvantaged children (20-40%) spent on average 18.7 hours, and children who were not from disadvantaged families spent on average 19.1 hours per week at day nursery (see Appendix Table C3.4).
Take-up of day nursery places among the most disadvantaged families increased substantially by the time their child was two. Over a quarter (26%) of the most disadvantaged children attended a day nursery at age two, compared with 3% in the first 12 months (see Table 3.1). This at least in part relates to the high level of take-up of funded childcare among the most disadvantaged families, which is discussed later in this chapter.
3.1.4 Age when child started receiving childcare
This section examines the average age when children in the study started receiving childcare. Before presenting the analysis, it is worth noting that different types of formal
35

childcare providers cater for children of different ages, depending on the type of setting and registration. For example, childminders, nannies and some day nurseries may provide care for children from when they are just a few months old. Some day nurseries only take children from age two, while nursery schools, pre-schools and nursery classes attached to primary schools generally provide early education to children under compulsory schooling age but over the age of two or three years old. Furthermore, information collected in the study is based on the parents’ report of childcare types used and as such, there may be some misreporting of some group-based childcare categories.
Overall, the most disadvantaged children started receiving formal childcare at a later age, at nearly two years of age (22.5 months) on average, compared with between a year and a year and a half among children from less disadvantaged backgrounds (16.6 months among moderately disadvantaged children and 15.3 months among not disadvantaged children; see Appendix Table C3.6). This suggests that many of the most disadvantaged children probably started receiving formal childcare when they qualified for the funded provision.
Looking in more detail at the type of formal childcare used, there were significant differences by level of disadvantage in the age at which children started attending a nursery school or a day nursery. Among the most disadvantaged children, the average age of starting these types of childcare providers was nearly two years (23.4 months for nursery school and 22.4 months for day nursery). In comparison, moderately disadvantaged children started using nursery school, on average, aged 18.2 months and day nursery aged 14.8 months. Children from families that were not disadvantaged started using these types of provision at the youngest age: nursery school aged 16.6 months and day nursery aged 13.8 months (Figure 3.3; Appendix Table C3.8).
Figure 3.3 Age (in months) child started using formal childcare by disadvantage level
36

On the other hand, there were no significant differences by level of disadvantage in the age of starting with a childminder, pre-school or play group. On average, children in all groups of families who used childminders started with the childminder aged just over a year (13 months; see Appendix Table C3.7). Many childminders accept babies and children from an early age and it may be that childminder care is more widely used by families to support parents working, which may explain the mean age of starting with a childminder being close to the timing of the end of maternity leave entitlement. Further, children who attended pre-school started attending this type of provision aged just over two (24.9 months on average), regardless of level of disadvantage, and as discussed above, these providers often only accept children from the age of two years.
To sum up, in general children from the most disadvantaged families started receiving formal childcare at a later age than children from less disadvantaged families. However, the reverse was the case for informal childcare, with the most disadvantaged children receiving care from family, friends or neighbours on a regular basis from an earlier age compared with their less disadvantaged peers. The most disadvantaged children were, on average, 7.9 months old when the family started using informal childcare regularly. This compares with 9.2 months old for moderately disadvantaged children and 9.7 months old for children from families that were not disadvantaged (see Appendix Table C3.6).
3.2 Childcare use at age two
3.2.1 Type of childcare used in school term time and in school holidays
Of the families who used childcare when the child was aged two, the majority (79%) reported using the same arrangements both in term time and in school holidays. However, this proportion was significantly lower among the most disadvantaged families (70%), compared with moderately disadvantaged (82%) and not disadvantaged families (81%; table not shown).
Among all families who used any childcare during term time, a substantial minority reported using no childcare in the holidays (20%). The proportion that used childcare in term time but not in school holidays was higher among the most disadvantaged families (36% compared with 17% among the moderately disadvantaged and 15% among the not disadvantaged families; Appendix Table C3.9).
This is unsurprising as the free entitlement childcare is often taken during term-time only (because certain types of childcare settings are open only during term-time). The difference in take-up of childcare between term-time and school holidays is also most evident for group-based childcare settings such as different types of nursery provision,
37

while differences in take-up of informal childcare or childminders between term-time and school holidays were very small.
3.2.2 Maternal employment and childcare use at age two
As discussed in Chapter 2, the proportion of mothers in work differed by level of disadvantage, with about 10% of mothers in the most disadvantaged families working, compared with around two-thirds of mothers in moderately disadvantaged (65%) and not disadvantaged (69%) families (Table 2.3).
Overall, two-year-olds with working mothers were more likely to receive formal childcare, and use of formal childcare was more common the higher the number of hours worked by the mother. About three-quarters (76%) of children with a full-time working mother had formal childcare when aged two, this was 72% among children whose mothers worked long part-time hours (16-29 hours per week), 55% among children whose mothers worked short part-time hours and just under half (47%) among children with non-working mothers (Appendix Table C3.10). The pattern of formal childcare use by mothers’ working hours did not differ significantly by level of disadvantage (analysis not shown).
Looking separately at different types of formal childcare used by level of disadvantage and mothers’ working hours suggests that different types of formal childcare may serve different purposes or needs. Attendance at pre-schools was more common among children whose mothers did not work or worked short part-time hours. The use of childminders and day nurseries, on the other hand, was associated with longer hours of maternal work (Appendix Table C3.11). The pattern of association between take-up of these forms of childcare and hours of maternal work was similar for the three levels of disadvantage among the families (table not shown).
3.2.3 Take-up of the two-year-old entitlement
As discussed in Chapter 1, the Government funds 15 hours of early education and childcare per week for two-year-olds in the 20% most disadvantaged families (from September 2013 onwards), and from September 2014 the provision was extended to include two-year-olds in moderately disadvantaged families (20%-40%). Most types of formal childcare can provide funded hours, including childminders, nursery schools and classes (including SEN provision), day and maintained nurseries and pre-schools. For each type of childcare respondents mentioned having used since their child turned two, they were asked whether this childcare was funded by the Government (fully or partially).
Take-up of the two-year-old entitlement was highest among the most disadvantaged families. Almost half (48%) of the most disadvantaged families had used the funded childcare, while 11% of moderately disadvantaged families had done so (Table 3.2). The low take-up of funded hours among moderately disadvantaged families reflects the fact that funded provision was extended to this group a year later than to the most disadvantaged families. Therefore the majority of children from moderately
38

disadvantaged families were not eligible for the two-year-old entitlement at the time of the baseline survey (see Figure A.1 in Appendix A).4
Table 3.2 Take-up of two-year-old entitlement by disadvantage level
Most
disadvantaged (20%)
Moderately disadvantaged
(20-40%)
Not disadvantaged
(>40%)
All
Received funded childcare 48 11 3 16
Received formal childcare but no funded hours
10 44 59 43
Did not receive formal childcare*
42 46 38 41
Unweighted bases 1,649 1,975 2,018 5,642
Weighted bases 1,263 1,918 2,461 5,642 Base: All families. Table shows column percentages. Source: SEED Baseline *Note: Formal childcare ‘eligible’ for funded hours are childminders, pre-schools and all forms of nursery provision. A small number of children classified here as not receiving formal childcare may have had a nanny or attended a crèche but these forms of childcare cannot provide funded hours.
A small proportion of families in the not disadvantaged group reported having received funded childcare (3%). This could be due to mis-reporting (e.g. because the parent thought the question referred to some other form of help with childcare costs, such as childcare vouchers), because the family had either been wrongly classified at the time of sampling as not disadvantaged, or because of a change in family circumstances having occurred between the time of sample selection and the time of the interview so that at the time of the interview the family was eligible to receive funded childcare.
As can be seen in Table 3.2, in addition to the 48% of the most disadvantaged children who received funded hours, another 10% did not receive funded hours although they attended the type of formal childcare setting eligible to offer funded places. This could be because the particular childcare provider they attended did not offer the early education funded hours. Some of these families may also have had a change in their household income since the time of sampling so that they were no longer eligible for the funded provision, but the majority of the families in this group did report that their income was below the qualifying income threshold (£16,190 per year).
Of the families who reported that they had used a funded place for their two-year-old, the largest proportion (46% of the most disadvantaged and 45% of the moderately disadvantaged families) reported using a day nursery (Figure 3.4; Appendix Table C3.12). Nursery schools and pre-schools were the next most commonly used childcare
4 Moderately disadvantaged families became entitled to a place from 1 September 2014 although some local authorities began offering places to children in this group on a discretionary basis earlier.
39
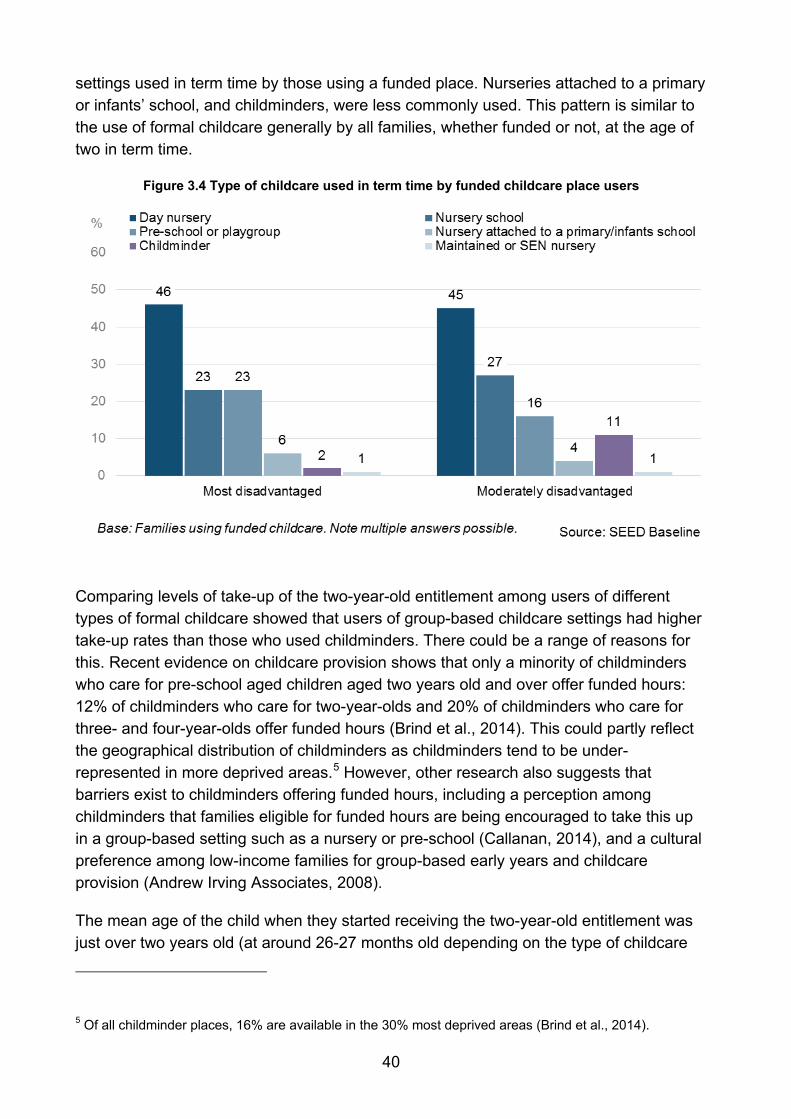
settings used in term time by those using a funded place. Nurseries attached to a primary or infants’ school, and childminders, were less commonly used. This pattern is similar to the use of formal childcare generally by all families, whether funded or not, at the age of two in term time.
Figure 3.4 Type of childcare used in term time by funded childcare place users
Comparing levels of take-up of the two-year-old entitlement among users of different types of formal childcare showed that users of group-based childcare settings had higher take-up rates than those who used childminders. There could be a range of reasons for this. Recent evidence on childcare provision shows that only a minority of childminders who care for pre-school aged children aged two years old and over offer funded hours: 12% of childminders who care for two-year-olds and 20% of childminders who care for three- and four-year-olds offer funded hours (Brind et al., 2014). This could partly reflect the geographical distribution of childminders as childminders tend to be under-represented in more deprived areas.5 However, other research also suggests that barriers exist to childminders offering funded hours, including a perception among childminders that families eligible for funded hours are being encouraged to take this up in a group-based setting such as a nursery or pre-school (Callanan, 2014), and a cultural preference among low-income families for group-based early years and childcare provision (Andrew Irving Associates, 2008).
The mean age of the child when they started receiving the two-year-old entitlement was just over two years old (at around 26-27 months old depending on the type of childcare
5 Of all childminder places, 16% are available in the 30% most deprived areas (Brind et al., 2014).
40

they attended; see Appendix Table C3.13). This is consistent with the fact that this funding becomes available to lower income families from the beginning of the school term after their child turns two.
It should be noted that the questions regarding Government funding for childcare were only asked of families using formal childcare that was eligible to offer funded places (a childminder or any type of nursery or pre-school provision).
3.3 Families not using formal early years provision A substantial proportion of two-year-olds (42% of the most disadvantaged and 46% of moderately disadvantaged children) either received no childcare at all in term time or received childcare from providers who were not eligible to offer funded hours (e.g. informal childcare providers). This section explores the characteristics of families that were not using formal childcare (i.e. either a childminder, nursery or pre-school), as well as their reasons for not doing so.
3.3.1 Characteristics of families not using formal childcare
As discussed earlier in the chapter (Figure 3.1), take-up of formal childcare was highest among the not disadvantaged families. Overall, take-up also varied significantly by family type, parental work status and maternal level of qualifications.6 These differences were smaller among the most disadvantaged families, the main group to whom funded childcare hours were available, and were more pronounced among the moderately disadvantaged and not disadvantaged families (Figure 3.5; Appendix Tables C3.14 and C3.15).
Among the most disadvantaged families lone parents were somewhat less likely not to use formal childcare (40%) than couple families (48%), a difference of eight percentage points. Among moderately disadvantaged families this difference was even larger at 20 percentage points, with 30% of lone parents and 50% of couple families not using formal childcare. However, the reverse pattern was found among the not disadvantaged families, where 43% of lone parents and 37% of couples were not using any formal childcare. (The small number of lone parents among the not disadvantaged families (n=56) on which this estimate is based suggests we should treat this finding with caution.)
6 Maternal qualifications here are measured as the highest academic or vocational qualification obtained.
41

Figure 3.5 Per cent of families not using formal childcare, by family type, mother’s qualification level and by disadvantage group
There was also a strong association between mothers’ level of educational attainment and family use of formal childcare. In all three disadvantage groups, mothers who had no or low formal qualifications were the least likely to use formal childcare, and mothers with degrees were the most likely to use formal childcare. The differences by level of education were particularly pronounced among the moderately disadvantaged and the not disadvantaged families.
3.3.2 Reasons for not using formal childcare
Families who were not using a type of formal childcare eligible to offer funded hours (i.e. a childminder, nursery or pre-school) when the child was aged two were asked for their main reason for not doing so. The most common reason given in all of the disadvantage groups was the parents’ personal preference not to use this form of childcare.
The proportion of parents citing this as their main reason varied somewhat by level of disadvantage. About half of the most the disadvantaged families (50%) and of not disadvantaged families (51%) gave this as their main reason, while a somewhat lower
42

proportion (45%) of the moderately disadvantaged families cited personal preference. Furthermore, a higher proportion of moderately disadvantaged families (34%) cited cost as their main reason for not using formal childcare, compared with 17% of the most disadvantaged and 26% of the not disadvantaged families (Figure 3.6; Appendix Table C3.16).
Figure 3.6 Reason for not using formal childcare
Some of the families that did not use formal childcare did use informal childcare on a regular basis. In all disadvantage groups, families that used informal childcare were less likely than families that used no formal or informal childcare to report that it was their personal preference not to use formal childcare (37% and 53% respectively). Families that used informal childcare were instead more likely to cite cost (44%) as their main reason, compared with families that used no childcare (22%) (analysis not shown).
The decision-making process surrounding childcare is complex. Relatively few families reported not using childcare because a parent was not working and was therefore available to look after the child, or that the child was too young for formal childcare. Instead a large proportion of parents stated that it was their personal preference not to use formal childcare, which for many parents may in fact encompass a combination of the above, and/or a whole range of other reasons. A higher proportion of non-working mothers cited personal preference as their main reason which suggests that at least for some parents the preference not to work and not to use childcare are linked.
Cost and availability are also two reasons that should be considered in tandem; both can be indicators of the limited availability of affordable childcare. More disadvantaged families, who are more likely to be eligible for funded childcare, may have their childcare
43

options constrained if the availability of funded places in the area is limited, even if other non-funded childcare may be available. Equally, better off families may have childcare places available to them in principle but feel that the cost is too high as they do not qualify for the funded places.
44

4 Links between home environment, child outcome measures and childcare take-up
Key findings
• Families’ economic circumstances were strongly associated with their home environment. Parents in disadvantaged families were significantly less likely to engage in home learning activities and more likely to have chaotic (on the CHAOS score) homes than those whose economic circumstances were better.
• Within the groups of families who were not disadvantaged or were moderately disadvantaged, there were further differences by use of childcare. Families where children were receiving formal childcare before age two were more likely to engage in home learning and less likely to be chaotic than those families where children had never received any formal childcare. However, there were no statistically significant differences by childcare use within the group of the most disadvantaged families.
• Children from the most disadvantaged families had substantially less developed language skills (SSLM score of 69.8) compared with children from moderately disadvantaged families (77.5) and children from families that were not disadvantaged (80.3).
• Children’s receipt of formal childcare before age two was associated with better developed language skills compared with no formal childcare, but only in families which were not disadvantaged or were only moderately disadvantaged.
• Children from the most disadvantaged families were reported by parents to be showing less positive behaviour (on the following ASBI scales: Conformity and Compliance, Pro-social, and Confidence and Independence) and more negative behaviour (on the scales Anti-social and Anxiety) compared with children from families that were not disadvantaged.
• Children who received formal childcare before age two were showing more positive behaviour than children who had not attended any formal childcare, controlling for level of disadvantage. With regard to negative behaviour, there were no consistent patterns of association between childcare use and children’s behaviour.
This chapter presents a detailed descriptive analysis exploring the extent to which home environment and child outcome measures differ at baseline between the three

disadvantage groups and in relation to whether the families use formal early years provision. Differences in childcare use are explored through whether formal childcare was used from the age of two only, before the age of two, or was not used at all.
4.1 Home environment by disadvantage group and formal childcare use
4.1.1 Home learning environment
The Home Learning Environment index is a composite measure of parenting and children’s activities.7 In our data the index ranges from 0 to 35, with a higher score indicating a more positive environment for the child.
Figure 4.1 shows how the Home Learning Environment score differed by disadvantage group and formal childcare use.8 Those who were most disadvantaged had the lowest average Home Learning Environment score (22.8), followed by the moderately disadvantaged group (23.6), while the not disadvantaged group had the highest average score (24.9) (all differences were statistically significant). There were also differences by formal childcare use, with children who had been in formal childcare before the age of two having higher Home Learning Environment scores – both overall and among the moderately disadvantaged and not disadvantaged groups. For the most disadvantaged there was no statistically significant difference in Home Learning Environment score by formal childcare use.
7 The Home Learning Environment index is based on questions such as how often the child reads at home with their parent(s), draws or paints at home, and typical number of hours the child spends watching TV. 8 Tables are in Appendix C.
46

Figure 4.1 Home learning environment score by disadvantage group and formal childcare use
Source: SEED Baseline
4.1.2 CHAOS: the Confusion, Hubbub And Order Scale
The Confusion, Hubbub And Order Scale (CHAOS) is a measure designed to assess the level of confusion and disorganisation in the child’s home environment.9 In our data the scale ranges from 4 to 18, with a lower score indicating a more positive home environment for the child. Figure 4.2 shows how the CHAOS score differed by disadvantage group and formal childcare use (see Table C4.11 in Appendix C for more detail). Those who were most disadvantaged had the highest average (mean) CHAOS score (8.6), followed by the moderately disadvantaged group (8.0), while the not disadvantaged group had the lowest average score (7.5) (all differences were statistically significant).
The average score in the SEED sample was 7.9 (see Table C4.11 in Appendix C). This finding is broadly consistent with those reported in other surveys. For example, the Growing Up in Scotland survey reported the average (mean) CHAOS score of 8.9 for families with 4-5 year olds (Chanfreau et al., 2011).
9 The scale is made up of four statements that parents have to rate from ‘Strongly agree’ to ‘Strongly disagree’. An example statement from the scale is ‘It is really disorganised in our home’.
47

As with the Home Learning Environment index, there were differences between CHAOS scores by formal childcare use. Overall, children in formal childcare before the age of two had lower CHAOS scores than children in the other two childcare groups. This was the case both overall and among the moderately disadvantaged and not disadvantaged groups. Again, for the most disadvantaged there was no statistically significant difference in CHAOS score by formal childcare use.
Figure 4.2 CHAOS score by formal childcare use and disadvantage group
Source: SEED Baseline
4.2 Baseline child measures by disadvantage group and formal childcare use
4.2.1 Sure Start Language Measure
The Sure Start Language Measure (SSLM) is an instrument used to assess the language performance and early language development of children. It includes a measure of vocabulary based on a list of 100 words. In our data we have four different measures:
• the total number of words the child can definitely say in English
• the total number of words the child can say in English or can say a similar word for in English
48

• the total number of words the child can say in English or in another language
• the total number of words the child can say in English or can say a similar word for in English or can say in another language
Each SSLM measure ranges from 0 to 100, with a higher score indicating a greater number of words known and therefore higher language development. Figure 4.3 shows the first SSLM measure10, by disadvantage group and formal childcare use. Those who were most disadvantaged had a significantly lower average SSLM score (69.8) than the not disadvantaged group (75.5), and there were also differences by formal childcare use. Overall, among the moderately disadvantaged group, and among the not disadvantaged group, children in formal childcare before the age of two had higher average SSLM scores than those either in formal childcare from age two only or not in formal childcare. For children in the most disadvantaged group there were not any statistically significant differences by formal childcare use.
Figure 4.3 SSLM score by formal childcare use and disadvantage group
Source: SEED Baseline
4.2.2 The Adaptive Social Behaviour Inventory
The Adaptive Social Behavioural Inventory (ASBI) is made up of five factors that are used to measure children's social and behavioural development. The five factors are:
10 Tables for all four of the SSLM measures are shown in Appendix C.
49

Conformity and Compliance; Pro-social; Confidence and Independence; Anti-social; and Anxiety. Each factor ranges from one to five, with a higher score on the first three factors signifying positive behaviour, whereas higher scores on the last two are indicative of negative behaviour. The average scores for each of the ASBI factors for the different family disadvantage groups are shown in Table 4.1.
Table 4.1 ASBI scores by disadvantage group
Most
disadvantaged (20%)
Moderately disadvantaged
(20-40%)
Not disadvantaged
(>40%)
All
Conformity & compliance score 3.6 3.7 3.8 3.7
Pro-social score 3.9 3.9 4.0 3.9
Confidence score 4.3 4.4 4.4 4.4
Anti-social score* 1.8 1.8 1.7 1.8
Anxiety score* 2.6 2.5 2.4 2.5
Unweighted base 1,603 1,939 1,989 5,531
Weighted base 1,225 1,879 2,418 5,521 Base: All families. Table shows mean scores. Source: SEED Baseline *Lower Anti-Social and Anxiety scores are indicative of positive behaviour.
Figure 4.4 shows the Conformity and Compliance measure by disadvantage group and formal childcare use. Those who were most disadvantaged had a significantly lower average score (3.6) than either the moderately disadvantaged group (3.7) or the not disadvantaged group (3.8), which means that a greater level of disadvantage was associated with less positive behaviour in terms of conformity and compliance. There were also differences by formal childcare use – both overall and within each of the disadvantage groups – with children in formal childcare before the age of two having higher average scores (i.e. more positive behaviour) than those either in formal childcare from age two only or not in formal childcare.
50

Figure 4.4 ASBI Conformity and Compliance score by formal childcare use and disadvantage group
Source: SEED Baseline
Figure 4.5 shows the Anti-Social measure by disadvantage group and childcare use. Those who were most disadvantaged had a significantly higher (and so worse) average score (1.8) than the not disadvantaged group (1.7). Therefore, a greater level of disadvantage was associated with less positive behaviour in terms of ASBI Anti-Social score. Overall and among the moderately disadvantaged group, children in formal childcare before the age of two had lower average Anti-Social scores than those either in formal childcare from age two only or not in formal childcare. For children in the most disadvantaged group and children in the not disadvantaged group there were no statistically significant differences by formal childcare use.
51

Figure 4.5 ASBI Anti-Social score by formal childcare use and disadvantage group
Source: SEED Baseline
For the Pro-Social and Confidence measures there were statistically significant differences by disadvantage group and by formal childcare use – both overall and within each of the disadvantage groups – following the same pattern as the Conformity and Compliance measure. For the Anxiety measure the most disadvantaged had a higher (and therefore worse) average score (2.6) than either the moderately disadvantaged group (2.5) or the not disadvantaged group (2.4). For this measure, there were no statistically significant differences by formal childcare use for children in either the most disadvantaged group or the not disadvantaged group.
There could be a number of factors contributing to differences by childcare use observed in the data presented in this chapter. They could be related to parents being encouraged and supported by their childcare providers to engage in home learning activities with their child and to support their child’s cognitive and socio-emotional development in other ways. However, the differences by childcare use could also be related to differences among families as regards parental educational attainment and social class, which have been found to affect home environment and child development in previous research (Bradshow et al., 2008; Gutman and Feinstein, 2007; Maisey et al. 2013; Smith et al., 2009). The report controlled for these to some extent by carrying out analysis within the three disadvantage groups but that did not account for all of the socio-economic variation within these groups, especially in relation to the not disadvantaged group (>40%).
52

5 Conclusions This report provides descriptive findings from the first wave of the longitudinal survey of parents. Over 5,600 families (six cohorts of children) took part in the baseline survey over the period from October 2013 to November 2014. Most children in the study were two years old at the time of the baseline interview (with a small proportion having just turned three). The socio-demographic profile of the SEED sample was broadly similar to that of other surveys with families, such as the Childcare and Early Years Survey of Parents 2012-2013.
5.1 Childcare during the first two years The most recent Childcare and Early Years Survey of Parents 2012-2013 found that overall take-up of childcare among 0-2 year olds was lower than among any other age group. This was largely due to the low use of formal childcare for children in this age group, as informal childcare use for 0-2 year olds was higher than for older children (Huskinson et al., 2014). The SEED baseline survey findings, reported here, show a diversity in childcare used by families during their child’s first two years.
The analysis shows clear differences between the three groups of families in the study: the 20% most disadvantaged families, the moderately disadvantaged (20-40%) and the not disadvantaged (<40%). Children from the most disadvantaged families were least likely to receive formal childcare before age two. Only 7% of these children received formal childcare before the age of 12 months and only 15% between one and two years old, compared with 20% and 36% respectively for all children in the study. However, after turning two, over half of children in all three groups were receiving formal childcare (58% of children in the most disadvantaged families, and 60% of all children).
In all groups, and at all ages, group-based formal provision, such as a day nursery or a pre-school, was more common than individual provision, such as a childminder. However, as take-up of formal childcare increased with the child’s age, so did the range of different types of childcare used by the families. In the first 12 months, day nurseries and childminders were the most common providers (10% of children attended a day nursery and 5% attended a childminder). At age two, the most common types of formal childcare were day nursery (25%), nursery school (13%) and pre-school (13%).
Children from the most disadvantaged families started receiving formal childcare at a later age on average (22.5 months), compared with children from moderately disadvantaged families (16.6 months) and children from the not disadvantaged families (15.3 months). This suggests that many of the most disadvantaged children started receiving formal childcare when they qualified for the funded provision.
53

5.2 Take-up of funded provision for two-year-olds from lower income families
From September 2013, two-year-old children living in the 20% lower income households became eligible for 15 hours of funded early education per week. This was extended in September 2014, so that two-year-old children in the 40% lower income households in England became eligible for 15 hours of funded provision.
The 20% most disadvantaged families in the SEED sample were sampled on the basis that they would have been eligible for funded early years provision at the time of the baseline survey. Report findings show that almost half of children (48%) from these families were receiving the Government funded two-year-old entitlement. About a tenth of children (10%) in these families were receiving formal childcare but not the funded hours, and about two fifths (42%) were not receiving any formal childcare at age two.
The largest proportion of those who were receiving the two-year-old entitlement reported using a day nursery. Forty-six per cent of children in the most disadvantaged families that were taking up the two-year-old entitlement were attending a day nursery at age two, compared with 23% attending a nursery school and 23% attending a pre-school.
The most common reason for not using formal childcare reported by parents in the most disadvantaged families was personal preference (50% of parents mentioned that as their main reason). Cost of childcare was the main reason for 17% of the most disadvantaged families, and issues with availability were mentioned by 12% of parents in this group.
5.3 Home environment, child outcomes and childcare take-up The SEED evaluation aims to explore to what extent early years provision, and high quality early years provision in particular, can improve outcomes for children and especially outcomes for children from disadvantaged backgrounds. Home environment factors, such as home learning environment, also affect child outcomes and need to be considered as an important context.
The analysis shows that parents in disadvantaged families were significantly less likely to engage in home learning activities with their children than those whose economic circumstances were better. There were pronounced differences by level of disadvantage in how organised or chaotic family homes were as well. There is some evidence that formal childcare use was associated with better home learning environment and less chaotic family life even after controlling for level of disadvantage, but these patterns of association are not consistent across different groups of families and need further investigation.
Analysis of child outcomes focussed on language skills (as reported by parents) and social and behavioural development. Children from the most disadvantaged families had substantially less developed language skills compared with children from families in
54

better economic circumstances. There is some evidence of association between children’s language skills and receipt of formal childcare, again, however, these patterns are not clear cut and need further research to understand them better.
On social behaviour measures, children from the most disadvantaged families were reported by parents to be showing less positive behaviour and more negative behaviour compared with children from families that were not disadvantaged. Children who received formal childcare before age two were showing more positive behaviour than children who had not attended any formal childcare, and this significant association held within each of the three disadvantage groups. However, there were no consistent patterns of association between formal childcare use and negative behaviour measures.
5.4 Next steps for this strand of the SEED evaluation In this report, we presented a detailed analysis of childcare use by families with two-year-olds, and tentatively examined relationships between childcare use, family environment and child outcomes. This descriptive analysis sets a context for the impact report further down the line. In addition to data from the baseline survey, the impact analysis will be able to draw on data from follow-up surveys when children are aged three and four (including child assessments as part of those surveys), as well as administrative data from the National Pupil Database once children in the SEED sample start school. The aim of that analysis will be to unpick the complexity of factors contributing to outcomes for children in different economic circumstances and to explore the effects of policy changes on children and families in England.
55

References Andrew Irving Associates (2008) Promoting Take-up of Formal Childcare Among Low Income Families: Message Testing Research, Research Report RR068: Department for Children Schools and Families.
Becker, B. (2011) ‘Social disparities in children's vocabulary in early childhood. Does pre-school education help to close the gap?’, The British Journal of Sociology, 62(1): 69-88.
Bradshow, P., Cunningham-Burley, S., Dobbie, F., MacGregor, A., Marryat, L., Ormston, R., and Wasoff, F. (2008) Growing Up in Scotland: Sweep 2 Overview Report, Scottish Centre for Social Research.
Brind, R., McGinigal, S., Lewis, J, and Ghezelayagh, S. with Ransom, H., Robson, J., Street, C. and Renton, Z. (2014) Childcare and Early Years Providers Survey 2013. DfE Research Report.
Callanan, M. (2014) Study of Early Education and Development: Views and Experiences of Childminders, DfE Research Report, DFE-RR395.
Chanfreau, J., Barnes, M., Tomaszewski, W., Philo, D., Hall, J. and Tipping, S. (2011) Growing Up in Scotland: Change in Early Childhood and the Impact of Significant Events, Edinburgh: Scottish Government.
Gutman, L. M., and Feinstein, L. (2007) Parenting Behaviours and Children’s Development from Infancy to Early Childhood: Changes, Continuities and Contributions, Wider Benefits of Learning Research Report No. 22, London: Institute of Education.
HM Government (2013) More Affordable Childcare, DFE-00025-2013.
HMRC (2012) Child Benefit: Income Tax Charge on Those with Higher Incomes.
Huskinson, T., Kostadintcheva, K., Greevy, H., Salmon, C., Dobie, S. and Medien K. with Gilby,N., Littlewood, M. and D’Souza, J. (2014) Childcare and Early Years Survey of Parents 2012-2013, DfE Research Report, London: DfE.
Lloyd, E., and Potter, S. (2014) Early Childhood Education and Care and Poverty: Working Paper Prepared for the Joseph Rowntree Foundation, London: Joseph Rowntree Foundation.
Maisey, R., Speight, S., Haywood, S., Hall, J., Sammons, P., Hussey, D., Goff, J., Evangelou, M., Sylva, K. (2013) Evaluation of Children’s Centres in England (ECCE). Strand 2: Baseline Survey of Families Using Children’s Centres in the Most Disadvantaged Areas, Research Report DFE-RR260, London: Department for Education.
Maisey, R., Speight, S., Marsh, V. and Philo, D. (2013) The Early Education Pilot for Two Year Old Children: Age Five Follow-up, DfE Research Report DFE-RR225, London: DfE.
56

Maplethorpe, N., Chanfreau, J., Philo, D., and Tait, C. (2010) Families with Children in Britain: Findings from the 2008 Families and Children Study (FACS), Department for Work and Pensions Research Report No. 656. London: DWP.
Melhuish, E. (2004) A Literature Review of the Impact of Early Years Provision on Young Children, with emphasis given to Children from Disadvantaged Backgrounds. Report for the Audit Commission. London: Birkbeck College, University of London.
National Audit Office (2012) Department for Education: Delivering the free entitlement to education for three- and four-year-olds. London: The Stationary Office.
Office for National Statistics (2015) Families and Households, 2014, ONS statistical Bulletin.
Smith, R., Purdon, S., Schneider, V., La Valle, I., Wollny, I., Owen, R., Bryson, C., Mathers, S., Sylva, K. and Lloyd E. (2009) Early Education Pilot for Two Year Old Children Evaluation. DCSF Research Report No. DCSF-RR134.
Smith, R., Speight, S., and La Valle, I. (2009) Fitting It All Together: How Families Arrange their Childcare and the Influence on Children’s Home Learning, Research Deport DCSF-RR090, London: Department for Children, Schools and Families.
Speight, S., Smith, R., Lloyd, E., and Coshall, C. (2010a) Families Experiencing Multiple Disadvantage: Their Use of and Views on Childcare Provision, Research Report DCSF-RR191, London: Department for Children, Schools and Families.
Speight, S., Smith, R., Lloyd, E., and Coshall, C. (2010b) Towards Universal Early Years Provision: Analysis of Take-up by Disadvantaged Families From Recent Annual Childcare Surveys, DfE Research Report DFE-RR066. London: Department for Education.
Sylva, K., Melhuish, E., Sammons, P., Siraj-Blatchford, I. and Taggart, B. (2004) The effective provision of pre-school education (EPPE) project: final report: A longitudinal study funded by the DfES 1997-2004, London: DfES/Institute of Education, University of London.
Sylva, K., Melhuish, E., Sammons, P., Siraj-Blatchford, I., and Taggard B. (2010, eds.) Early Childhood Matters: Evidence from the Effective Pre-school and Primary Education Project. London: Routledge.
57

A. Appendix - Methodology
Design overview
The longitudinal survey of families collects information at three time points:
• when the families’ child is about two years old (Wave 1)
• when the child is about three years old (Wave 2)
• when the child is about four years old (Wave 3).
Information is collected from the child’s parent or guardian at all three waves, and cognitive assessments of children are administered at Wave 2 and Wave 3. Information collected in the interviews will also be linked with information from the National Pupil Database to track children’s progress as they enter school and up to the age of seven.
Two-year-old children living in the 20% lower income households became eligible for 15 hours of funded early education per week in September 2013. In September 2014, this was extended to children in the 40% lower income households in England.11 SEED was designed to cover families across the spectrum of eligibility so that comparisons could be made that explore the effect of eligibility on children’s outcomes. It includes families whose children are born across six consecutive academic terms, covering two complete academic years.
The oldest children in SEED were born between September and December 2010 (cohort 1), and the youngest children were born between April and August 2012 (cohort 6). Figure A.1 shows how these different cohorts of children were affected by the roll-out of the offer. So for example, the blue bars show that the most disadvantaged families (20%) in cohort 1 were eligible for the two-year-olds offer for just one term, and then they became eligible for the three- and four-year-olds offer instead. In contrast, the blue and yellow bars show that for cohort 6, both the most disadvantaged (20%) and moderately disadvantaged (20-40%) families were eligible for all three terms of the two-year-olds offer.
11 Children become eligible for this offer the term after their second birthday. However, eligibility may be assessed at any point so that if families become eligible they can take up the funded early education late. The opposite is not true, i.e. eligibility funded place cannot be revoked.
58
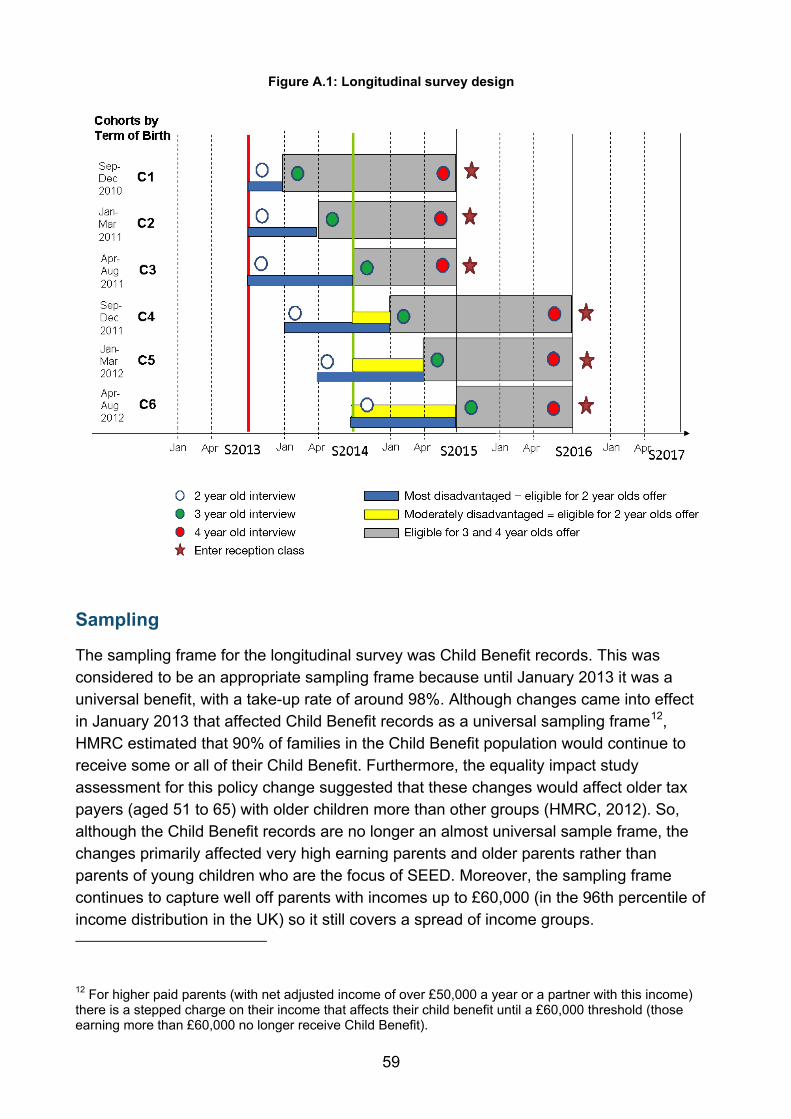
Figure A.1: Longitudinal survey design
Sampling
The sampling frame for the longitudinal survey was Child Benefit records. This was considered to be an appropriate sampling frame because until January 2013 it was a universal benefit, with a take-up rate of around 98%. Although changes came into effect in January 2013 that affected Child Benefit records as a universal sampling frame12, HMRC estimated that 90% of families in the Child Benefit population would continue to receive some or all of their Child Benefit. Furthermore, the equality impact study assessment for this policy change suggested that these changes would affect older tax payers (aged 51 to 65) with older children more than other groups (HMRC, 2012). So, although the Child Benefit records are no longer an almost universal sample frame, the changes primarily affected very high earning parents and older parents rather than parents of young children who are the focus of SEED. Moreover, the sampling frame continues to capture well off parents with incomes up to £60,000 (in the 96th percentile of income distribution in the UK) so it still covers a spread of income groups.
12 For higher paid parents (with net adjusted income of over £50,000 a year or a partner with this income) there is a stepped charge on their income that affects their child benefit until a £60,000 threshold (those earning more than £60,000 no longer receive Child Benefit).
59

Clustering
Face-to-face surveys are often geographically clustered to improve fieldwork efficiency. For this survey, clustering was particularly important because of the desire to assess the quality of early years and childcare settings used by parents. In many areas (particularly urban areas), a large number of settings are available locally, and without adequate clustering we would have found that many settings would have been used by just one family in our achieved sample. To improve the chance that families in our achieved sample used the same settings as each other we used two stages of clustering for SEED. First we selected postcode districts (or groups of postcode districts) as Primary Sampling Units (PSUs), followed by three postcode sectors (or groups of sectors) as Secondary Sampling Units (SSUs) within each PSU. This meant that the cost of assessing a setting’s quality involved a more efficient use of money because the score could be associated with many children instead of just one.
In practice the sampling was done in three stages:
• 111 PSUs were selected in proportion to a weighted sum of the number of eligible families within each PSU (with weights calculated to reflect the final desired proportions of the three disadvantage groups, see below)
• Three SSUs were selected within each PSUs in proportion to a weighted sum of the number of eligible families within each SSU
• Five or six families in each disadvantage group were selected within each SSU in proportion to their weights.
Disadvantage groups
To maximise our ability to make comparisons in child outcomes across the spectrum of eligibility for funded early education for two-year-olds, each cohort of children within SEED was designed to have three subgroups:
(1) the 20% most disadvantaged families
(2) the moderately disadvantaged (20-40%)
(3) the not disadvantaged (>40%).
The three subgroups were sampled in equal proportion, i.e. such that each group made up around a third of the sample in each cohort. As the three groups were not of equal size in the population, a weighted sampling approach was used to create as close to an equal probability sample as possible, with weights equal to the ratio of the desired proportion (one third) to the population proportion in each cohort.
60

Families were put into groups by DWP prior to sampling using the following criteria.
• The 20% most disadvantaged families had a parent in receipt of one of the following benefits or tax credits:13
• Income-based Jobseeker’s Allowance (JSA-IB)
• Income-related Employment Support Allowance (ESA-IR)
• Income Support (IS)
• Guaranteed element of the State Pension Credit (PC with Guarantee Credit)
• Child Tax Credit only (not in receipt of an accompanying Working Tax Credit award) with household gross earnings of less than £16,190.
• The moderately disadvantaged group (20-40%) had a parent in receipt of Working Tax Credits with household gross earnings of less than £16,190.14
• The not disadvantaged group (>40%) had parents not in receipt of any of the qualifying benefits or tax credits.
Questionnaire
The questionnaire was developed in Blaise, a software programme for computer assisted interviewing (CAI) techniques, covering the following topics.
Table A.1 Questionnaire topics
Section Topics included at Wave 1 Household grid Eligibility check
Name, DOB and sex of all household members
Marital status
Relationships within the household
13 The full DfE eligibility criteria from September 2013 are: (i) All 2-year-olds who are looked after by their local authority; (ii) 2-year-olds whose family receives one of the following are also eligible: income support; income-based Jobseeker’s Allowance (JSA); income-related Employment and Support Allowance (ESA); support through part 6 of the Immigration and Asylum Act; the guaranteed element of State Pension Credit; Child Tax Credit (but not Working Tax Credit) and have an annual income not over £16,190; the Working Tax Credit 4-week run on (the payment you get when you stop qualifying for Working Tax Credit) or Universal Credit. 14 From September 2014, the eligibility criteria include two-year-olds who meet any one of the following criteria: eligibility criteria also used for free school meals; if their families receive Working Tax credits and have annual gross earnings of no more than £16,190 per year; if they have a current statement of special educational needs (SEN) or an education, health and care plan; if they attract Disability Living Allowance; if they are looked after by their local authority; or if they have left care through special guardianship or through an adoption or child arrangements order.
61

Working status of parent/carer
Working status of partner (if relevant)
Childcare Childcare used for SEED child between 0-1 years of age
Childcare used for SEED child between 1-2 years of age
Childcare used for SEED child since two years of age – in both term and holiday time
Whether receives any funding for childcare places
Why does not currently use any childcare
Child development *
Sure Start Language Measure (SSLM)
Adaptive Social Behaviour Inventory (ASBI)
Home environment Home learning environment
Confusion, hubbub and order
Area of residence
Child health Birth weight
Accidents and injuries
Longstanding health problems
Concerns about child development
Parent/Carer health*
General health
Kessler 6 Inventory
Cognitive difficulties
Parenting/Caring*
Parent/carer-child relationship
Parenting/caring behaviour
Socio-demographics Ethnicity of SEED child
Parent/carer academic and vocational qualifications
Partner academic and vocational qualifications (where relevant)
Sources of income and income bracket
NSSEC classification for parent/carer
NSSEC classification for partner (where relevant)
Tenure
62

Language spoken at home
Administration Permission to recontact for following waves
Recontact information (where relevant)
Stable contact information (where relevant)
Permission to link survey data to NPD records
* These sections are self-completion and where possible were completed by the parent/carer themselves. Where this was not possible interviewer completion was offered.
The questionnaire was developed by NatCen Social Research in collaboration with Oxford University, Frontier Economics, 4Children and the Department for Education.
Data collection
The fieldwork procedure is outlined below.
All families who were sampled for the study were sent an opt-out letter giving them information about the study and providing a three-week period in which they could opt out of the study by a variety of methods (by returning an opt-out slip by Freepost, by telephone, email or through the study website). A copy of the opt-out letter can be found in Appendix D.
Any families who opted out of the study were removed from the sample which was issued to NatCen interviewers.
Families who did not opt out of the study were sent an advance letter (see Appendix D).
Enclosed with the advance letter was a study leaflet which provided further information about the study and details about how families could get in touch with NatCen about the study or how they could arrange an appointment (see Appendix D).
Interviewers contacted families face-to-face, and where possible they traced families who had moved.
The interview was conducted face-to-face in respondents’ homes using Computer Assisted Personal Interviewing (CAPI) and show cards with answer options where appropriate. Some sections of the questionnaire – those containing more sensitive questions – were completed by respondents on their own using Computer Assisted Self Interviewing (CASI) (see Table A.1). The average (median) length of the interview was 45 minutes. A total of 182 interviewers worked on the baseline survey.
The questionnaire was piloted with parents who had a two-year-old child born between August 2010 and March 2011. The pilot sample was collected through children’s centres through an opt-in exercise and also by snowballing local contacts. Fieldwork for the pilot
63

was undertaken between June and July 2013 and the pilot findings were used to refine the questionnaire in time for the main stage of fieldwork.
As illustrated in Figure A.1, the fieldwork for the main baseline survey was undertaken during these time periods:
Cohort 1: October 2013 – November 2013
Cohort 2: October 2013 – December 2013
Cohort 3: November 2013 – January 2014
Cohort 4: January 2014 – March 2014
Cohort 5: April 2014 – June 2014
Cohort 6: September 2014 – November 2014
The ideal timing for the baseline interviews was the term immediately after the families’ child turned two so that (a) families had had time to take-up the two-year-old offer (and knew which setting their child would attend) but that (b) they had not been using the two-year-old offer for too long (so that the survey data would represent a reasonable baseline of families’ circumstances at the time their eligibility was assessed). Unfortunately it was not possible to achieve this timing for cohorts 1 and 2 due to the overall project timeline, and children from the first two cohorts were somewhat older at the time of the baseline survey than children from subsequent cohorts (in total, 92% of children in the baseline survey were aged two and 8% had turned three in the school term in which their family was surveyed).
Response rates
Table A.2 and Table A.3 provide a breakdown of fieldwork response for the baseline survey.15 In total, 5,643 parents took part in the baseline survey (5,641 fully productive and two partially productive interviews) and the overall response rate was 63%. Response was lower for the most disadvantaged group (58%) than for the not disadvantaged group (66%).
15 The intention was to sample one-third of families from each of the three disadvantage groups. The size of the three groups in the survey is not equal due to re-classification of some families by DWP which took place once the fieldwork had started.
64

Table A.2 Fieldwork response figures (N)
Outcome Total Most
disadvantaged (20%)
Moderately disadvantaged
(20-40%)
Not disadvantaged
(>40%)
Issued 9188 2888 3168 3132
Ineligible 156 44 46 66
Eligible 9032 2844 3122 3066
Fully productive 5641 1650 1973 2018
Partially productive 2 0 2 0
Non-contact 1215 419 357 439
- Moved (new address unknown) 764 229 224 311
- Other 451 190 133 128
Refusal 1990 704 725 561
- Office refusal 336 97 132 107
- Refusal in person 1088 360 381 347
- Broken appointment 492 221 179 92
- Other 74 26 33 15
Other unproductive 164 63 57 44
Unknown eligibility 20 8 8 4
Source: All participants issued at baseline
Table A.3 Standard fieldwork response rates
Response rate Total Most
disadvantaged (20%)
Moderately disadvantaged
(20-40%)
Not disadvantaged
(>40%)
Overall response rate 63 58 63 66
Full response rate 63 58 63 66
Co-operation rate 72 68 72 77
Contact rate 86 85 88 86
Refusal rate 22 25 23 18
Eligibility rate 98 98 98 98
Source: All participants issued at baseline
Table A.4 shows how responding and non-responding samples compare on a number of characteristics available in the sampling frame.
65

Table A.4 Characteristics of responding and non-responding samples
Characteristics
Non-response (pre-survey
opt-outs and survey non-response)
Productive interview
Base
Disadvantage group
Most disadvantaged (20%) 47 53 3091
Moderately disadvantaged (20-40%) 42 58 3419
Not disadvantaged (>40%) 40 60 3345
Sex
Female 42 58 8266
Male 45 55 785
Age
16-24 48 52 1205
25-29 45 55 2142
30-34 40 60 2561
35-39 39 61 1996
40-44 40 60 979
45+ 45 55 251
Family type
Couple household 42 58 7730
Lone parent household 45 55 1762
IMD quintile
0.53->8.49 (least deprived) 41 59 1672
8.49->13.79 40 60 1601
13.79->21.35 43 57 1933
21.35->34.17 44 56 2105
34.17->87.80 (most deprived) 45 55 2544
Base: All sampled families excluding confirmed ineligible households. Table shows row percentages. Cases with missing non-respondent data are not shown in the table. Source: DWP data.
Weighting
The sample was designed to produce as close to an equal probability sample as possible but, due to highly variable proportions of families in the three “disadvantage groups” within each Secondary Sampling Unit (SSU), it was not possible to achieve an entirely equal probability sample. Selection weights were calculated at the sampling stage as the
66

inverse of the probability of selection. However, these were not used in weighting as they would have adversely affected the efficiency of the weighted sample whilst being unlikely to reduce bias.
The first step in the weighting process was to use the information we had available on sampled families in order to model the response process and create weights to adjust for non-response. Logistic regression was used for this purpose with the dependent variable being a dichotomous outcome (1=response; 0=non-response) and only those families known to be eligible being included in the model.
The following variables were used as predictors of response:
• Cohort * Disadvantage group (18 categories indicating the cohort 1-6 and disadvantage group);
• Sex • Lone parent status (Y/N) • Age group of parent (16-24; 25-29; 30-34; 35-39; 40-44; 45+) • Working status (working/not working) • Child’s month of birth • Number of eligible children in family • Region • IMD quintile (based on sampled postcode) • Population density quintile (based on sampled postcode) • Urban/rural indicator (six groups)
The variable indicating cohort/disadvantage group was fixed in the model and a forward stepwise procedure was used to select the other predictors (double checked using backwards stepwise which produced an identical model). The final model, in addition to cohort/disadvantage group, included the following variables:
• Sex • Lone parent status (Y/N) • Age group of parent (16-24; 25-29; 30-34; 35-39; 40-44; 45+) • Working status (working/not working) • Region • Population density quintile (based on sampled postcode)
Non-response weights were created as the inverse of the predicted probability of response. The top 0.5% of these non-response weights were trimmed back to the 99.5th percentile.
Finally, calibration weighting was used to adjust the weights to population totals for region and, separately, the number of children by cohort and disadvantage group (18 categories). The calibrated weights were then scaled back to the achieved sample size (i.e. to have a mean of 1).
67

B. Appendix - Socio-demographic characteristics of participants
Table B.1 Sex of respondent by disadvantage level
Most
disadvantaged (20%)
Moderately disadvantaged (20-
40%)
Not disadvantaged (>40%)
All
Male 6 9 8 8
Female 94 91 92 92
Unweighted bases 1,649 1,975 2,018 5,642
Weighted bases 1,263 1,918 2,461 5,642
Base: All families. Table shows column %. Source: SEED Baseline
Table B.2: Family type by disadvantage level
Most
disadvantaged (20%)
Moderately disadvantaged (20-
40%)
Not disadvantaged (>40%)
All
Lone parent 72 21 3 25
Couple 28 79 97 75
Unweighted bases 1,649 1,975 2,018 5,642
Weighted bases 1,263 1,918 2,461 5,642
Base: All families. Table shows column %. Source: SEED Baseline
Table B.3: Respondent’s legal marital status by disadvantage level
Most
disadvantaged (20%)
Moderately disadvantaged
(20-40%)
Not disadvantaged
(>40%)
All
Single (never married) 74 42 21 40
Married/in a civil partnership and living with husband/wife
14 51 76 54
Married/in a civil partnership and separated from husband/wife
7 3 1 3
Divorced 5 4 2 3
Widowed + + + +
Unweighted bases 1,649 1,974 2,018 5,641
Weighted bases 1,263 1,916 2,461 5,640
Base: All families. Table shows column %. Source: SEED Baseline
68

Table B.4: Number of children in the household by disadvantage level
Most
disadvantaged (20%)
Moderately disadvantaged
(20-40%)
Not disadvantaged
(>40%)
All
1 child 39 36 46 41
2 children 30 39 38 37
3 children 18 17 11 15
4 children or more 14 8 5 8
Unweighted bases 1,649 1,975 2,018 5,642
Weighted bases 1,263 1,918 2,461 5,642
Base: All families. Table shows column %. Source: SEED Baseline
69

Table B.5: Child’s ethnicity by disadvantage level
Most
disadvantaged (20%)
Moderately disadvantaged
(20-40%)
Not disadvantaged
(>40%)
All
White - British 72 71 77 74
White - Irish 0 + + +
White - Other 3 9 7 7
Mixed - White and Black Caribbean 3 1 1 1
Mixed - White and Black African 2 1 1 1
Mixed - White and Asian 2 2 2 2
Mixed - any other Mixed Backgrounds
2 1 1 1
Asian or Asian British - Indian + 2 3 2
Asian or Asian British - Pakistani 3 4 3 4
Asian or Asian British - Bangladeshi
1 1 + 1
Asian or Asian British - any other Asian Backgrounds
2 2 2 2
Black or British Black - Caribbean 3 1 1 1
Black or British Black - African 7 4 2 4
Black or British Black - any other African Backgrounds
1 + + +
Chinese or other Ethnic Group - Chinese
+ + 1 +
Chinese or other Ethnic Group - any other Ethnic Group
+ + + +
Unweighted bases 1,646 1,972 2,017 5,635
Weighted bases 1,260 1,916 2,460 5,636
Base: All families. Table shows column %. Source: SEED Baseline
70

Table B.6: Language spoken at home by disadvantage level
Most
disadvantaged (20%)
Moderately disadvantaged
(20-40%)
Not disadvantaged
(>40%)
All
English is first language for both parents
84 76 79 79
For at least one parent, English is not their first language
16 24 21 21
Main language spoken at home (where for at least one parent, English is not their first language):
English 25 22 34 28
Other 38 48 35 41
Speak each language equally
37 31 31 32
Unweighted bases – more than one language spoken at home
227 444 377 1,048
Weighted bases – more than one language spoken at home
202 469 508 1,179
Base: All families who speak more than one language at home. Table shows column %. Source: SEED Baseline
71

Table B.7: Housing tenure by disadvantage level
Most
disadvantaged (20%)
Moderately disadvantaged
(20-40%)
Not disadvantaged
(>40%)
All
Own it outright 1 3 7 4
Buying it with help of a mortgage or loan
4 32 65 40
Pay part rent and part mortgage (shared ownership)
1 2 1 1
Rent it from local authority or housing association
51 26 7 23
Rent it from a private landlord
38 33 19 28
Live rent-free (including rent-free in relatives/friends home)
6 4 3 4
Unweighted bases 1,647 1,972 2,013 5,632
Weighted bases 1,261 1,916 2,455 5,632
Base: All families. Table shows column %. Source: SEED Baseline
72

Table B.8: Sources of income by disadvantage level
Most
disadvantaged (20%)
Moderately disadvantaged
(20-40%)
Not disadvantaged (>40%)
All
Earnings from employment or self-employment
18 96 97 79
Child benefit 98 98 86 93
Child Tax Credit 93 75 20 55
Working Tax Credit 8 48 11 23
Jobseekers Allowance 6 1 1 2
Income Support 65 2 1 16
Housing Benefit/Council Tax Benefit
70 21 5 25
Incapacity Benefit 1 + + +
Employment and Support Allowance
7 1 1 2
Disability Living Allowance 10 5 2 5
Personal Independence Payment
+ + + +
Universal Credit + + + +
Other State benefits (e.g. carers allowance or widow allowance)
3 2 1 2
Interest from savings and investments (e.g. stocks and shares)
+ 1 9 4
Private or state pension 1 + 1 1
Child maintenance from former partner (including Child Support Agency grant)
12 7 2 6
Student grant 3 1 1 1
None 0 0 + +
Unweighted bases 1,632 1,948 2,004 5,584
Weighted bases 1,247 1,889 2,443 5,579
Base: All families. Table shows column %. Columns add up to more than 100% as more than one category may apply. Source: SEED Baseline
73

Table B.9: Level of household income by disadvantage level
Most
disadvantaged (20%)
Moderately disadvantaged
(20-40%)
Not disadvantaged
(>40%)
All
£9,999 or less 46 11 3 15
£10,000 - £16,190 37 22 8 19
£16,190 - £29,999 13 38 14 22
£30,000 - £49,000 3 24 32 23
£50,000 or more 1 5 43 21
Unweighted bases 1,498 1,793 1,881 5,172
Weighted bases 1,138 1,735 2,283 5,156
Base: All families. Table shows column %. Source: SEED Baseline Note: The relatively small number of families with income of £16,190 or more in the most disadvantaged group may be due to misreporting, misclassification, or change in circumstances between time of sampling and the date of interview.
Table B.10: Household economic status by disadvantage level
Most
disadvantaged (20%)
Moderately disadvantaged (20-
40%)
Not disadvantaged (>40%)
All
Lone parent - working 5 19 2 8
Lone parent - not working 67 3 1 16
Couple - both working 3 40 65 43
Couple - one working 10 37 31 28
Couple - neither working 15 1 2 4
Unweighted bases 1,649 1,975 2,018 5,642
Weighted bases 1,263 1,918 2,461 5,642
Base: All families. Table shows column %. Source: SEED Baseline
74

Table B.11: Highest parental NSSEC by disadvantage level
Most
disadvantaged (20%)
Moderately disadvantaged
(20-40%)
Not disadvantaged
(>40%)
All
Professional/Managerial 2 6 32 17
Lower managerial 9 27 40 28
Intermediate occupations 12 19 9 13
Small employers/own account workers
6 12 6 8
Low supervisory 6 10 5 7
Semi-routine 30 19 5 15
Routine 18 7 2 7
Not working 18 + + 4
Unweighted bases 1,641 1,970 2,011 5,622
Weighted bases 1,257 1,912 2,451 5,620
Base: All families. Table shows column %. Source: SEED Baseline
Table B.12: Mother’s highest academic qualification by disadvantage level
Most
disadvantaged (20%)
Moderately disadvantaged
(20-40%)
Not disadvantaged
(>40%)
All
None 30 14 6 14
Level 1 GCSE Grade D-G 18 10 4 9
Level 2 GCSE Grade A*-C 32 32 20 27
Level 3 A-Level 9 15 12 12
Level 4 Certificate of Higher Education
4 7 6 6
Level 5 Foundation Degree 2 4 3 3
Level 6 Honours Degree 3 13 29 17
Level 7 Master’s Degree 2 6 19 11
Level 8 Doctorates + + 2 1
Unweighted bases 1,573 1,874 1,945 5,392
Weighted bases 1,200 1,813 2,368 5,381
Base: All families. Table shows column %. Source: SEED Baseline
75

Table B.13: Mother’s highest vocational qualification by disadvantage level
Most
disadvantaged (20%)
Moderately disadvantaged
(20-40%)
Not disadvantaged
(>40%)
All
None 49 44 57 51
Level 1 NVQ 10 7 4 7
Level 2 NVQ 25 22 11 18
Level 3 NVQ 13 21 20 18
Level 4 NVQ 1 3 3 2
Level 5 NVQ 1 2 3 3
Level 6 NVQ + + 1 +
Level 7 NVQ + + + +
Level 8 NVQ + + 1 1
Unweighted bases 1,545 1,864 1,855 5,264
Weighted bases 1,184 1,812 2,268 5,265
Base: All families. Table shows column %. Source: SEED Baseline
76

C. Appendix - Additional tables
Table C3.1 Childcare use from birth to age two by disadvantage level
Most disadvantaged (20%) Moderately disadvantaged (20-40%)
Not disadvantaged (>40%) All
First 12 months
1-2 years 2 years First 12 months
1-2 years 2 years First 12 months
1-2 years 2 years First 12 months
1-2 years 2 years
Formal childcare 7 15 58 21 35 55 25 47 64 20 36 60
Formal childcare - Group based
5 13 56 15 26 48 18 35 55 14 27 53
Formal childcare - Individual
2 3 3 6 10 9 8 14 14 6 10 10
Informal childcare 11 13 11 26 31 28 27 38 33 23 30 26
No Childcare 83 74 37 60 44 32 58 33 24 64 46 29
Unweighted bases 1,647 1,649 1,649 1,975 1,975 1,975 2,018 2,018 2,018 5,640 5,642 5,642
Weighted bases 1,262 1,263 1,263 1,918 1,918 1,918 2,461 2,461 2,461 5,640 5,642 5,642
Base: All Families. Table shows column %. Columns add up to more than 100% as more than one category may apply. Source: SEED Baseline

Table C3.2 Time spent in formal childcare (hours per week)
Most disadvantaged (20%) Moderately disadvantaged (20-40%)
Not disadvantaged (>40%) All
First 12 months
1-2 years 2 years First 12 months
1-2 years 2 years First 12 months
1-2 years 2 years First 12 months
1-2 years 2 years
All families
Bottom percentile (1%) 0 0 0 0 0 0 0 0 0 0 0 0
Mean 1.3 2.4 8.2 4.2 7.0 9.2 5.4 9.6 11.6 3.8 6.6 9.7
Median 0 0 8 0 0 4 0 0 8 0 0 6
Top percentile (99%) 35 40 40 45 48 47 45 50 50 42 47 48
Standard Deviation 6.4 7.1 8.7 9.8 12.0 11.9 11.1 13.2 12.9 9.57 11.65 11.54
Unweighted bases 1,644 1,642 1,639 1,970 1,970 1,972 2,002 2,007 2,010 5,616 5,619 5,621
Weighted bases 1,644 1,642 1,639 1,970 1,970 1,972 2,002 2,007 2,010 5,616 5,619 5,621
Formal childcare users
Bottom percentile (1%) 1 1 2 1 2 2 2 1 2 2 2 2
Mean 20.1 16.0 14.3 19.9 19.8 16.8 21.5 20.5 17.8 20.7 19.7 16.5
Median 16 15 15 18 18 15 20 18 16 18.0 18.0 15.0
Top percentile (99%) 60 45 40 50 51 50 50 50 50 50 50 50
Standard Deviation 16.0 11.1 6.6 11.9 12.4 11.5 11.7 12.2 12.1 12.3 12.2 10.7
Unweighted bases 107 243 935 412 691 1,078 506 940 1,306 1,025 1,874 3,319
Weighted bases 107 243 935 412 691 1,078 506 940 1,306 1,025 1,874 3,319 Base: All Families/Families using formal childcare at given age point. Table shows hours per week. Source: SEED Baseline
78

Table C3.3 Time spent with childminder (hours per week)
Most disadvantaged (20%) Moderately disadvantaged (20-40%)
Not disadvantaged (>40%) All
First 12 months
1-2 years 2 years First 12 months
1-2 years 2 years First 12 months
1-2 years 2 years First 12 months
1-2 years 2 years
Bottom percentile (1%) [3] [1] [1] 2 2 3 0 2 0 1 2 1
Mean [20.9] [18.7] [16.0] 21.7 21.6 20.4 21.3 20.2 18.4 21.4 20.7 18.9
Median [18.5] [17] [15] 20 20 18 20 19 16 20 20 16
Top percentile (99%) [40] [45] [40] 50 50 47 50 50 45 50 50 45
Standard Deviation [12.5] [11.4] [9.7] 10.6 11.3 10.8 10.8 10.7 10.6 10.8 11.0 10.6
Unweighted bases 30 42 43 124 194 177 140 224 225 294 460 445
Weighted bases 30 42 43 124 194 177 140 224 225 294 460 445
Base: Families using childminder at given age point. Table shows hours per week. Source: SEED Baseline

Table C3.4 Time spent at day nursery (hours per week)
Most disadvantaged (20%) Moderately disadvantaged (20-40%)
Not disadvantaged (>40%) All
First 12 months
1-2 years 2 years First 12 months
1-2 years 2 years First 12 months
1-2 years 2 years First 12 months
1-2 years 2 years
Bottom percentile (1%) * [1] 3 1 3 3 2 1 2 1 1 2
Mean * [17.1] 15.0 20.0 20.0 18.7 21.0 19.7 19.1 20.4 19.4 17.8
Median * [15] 15 17 18 16 20 18 18 18 18 15
Top percentile (99%) * [45] 40 50 50 48 48 48 47 50 50 45
Standard Deviation * [10.7] 5.9 12.0 11.6 10.7 10.9 10.8 11.1 11.4 11.1 9.9
Unweighted bases 17 47 213 62 150 252 74 173 253 528 933 1,379
Weighted bases 17 47 213 62 150 252 74 173 253 528 933 1,379
Base: Families using day nursery at given age point. Table shows hours per week. Source: SEED Baseline

Table C3.5 Time spent at nursery school (hours per week)
Most disadvantaged (20%) Moderately disadvantaged (20-40%)
Not disadvantaged (>40%) All
First 12 months
1-2 years 2 years First 12 months
1-2 years 2 years First 12 months
1-2 years 2 years First 12 months
1-2 years 2 years
Bottom percentile (1%) [2] 2 3 0 3 2 0 3 1 0 3 2
Mean [19.8] 15.5 14.4 17.1 17.3 15.5 21.6 19.3 16.3 19.6 18.0 15.4
Median [16] 15 15 16 15.5 14 20 16 15 18 16 15
Top percentile (99%) [0] 3 1 40 40 50 45 45 40 45 45 45
Standard Deviation [13.7] 9.7 6.2 10.0 10.4 10.6 11.5 11.3 10.3 11.3 10.8 9.4
Unweighted bases 47 213 277 150 252 464 173 253 500 153 370 718
Weighted bases 47 213 277 150 252 464 173 253 500 153 370 718
Base: Families using nursery school at given age point. Table shows hours per week. Source: SEED Baseline

Table C3.6 Age in months when started using childcare
Most
disadvantaged (20%)
Moderately disadvantaged
(20-40%)
Not disadvantaged
(>40%)
All
Formal
Minimum 0 0 0 0
Mean 22.5 16.6 15.3 17.8
Median 25 14 12 18
Standard Deviation 7.89 8.76 8.29 8.87
Maximum 36 36 36 36
Unweighted bases 971 1,125 1,348 3,444
Weighted bases 971 1,125 1,348 3,444
Informal
Minimum 0 0 0 0
Mean 7.9 9.2 9.7 9.2
Median 6 9 9 9
Standard Deviation 7.54 5.85 5.08 5.83
Maximum 36 34 35 36
Unweighted bases 279 758 871 1,908
Weighted bases 279 758 871 1,908
Base: Families ever used informal or formal childcare, respectively. Table shows age in months.
Source: SEED Baseline

Table C3.7 Age in months when started using individual formal childcare
Most
disadvantaged (20%)
Moderately disadvantaged
(20-40%)
Not disadvantaged
(>40%)
All
Childminder
Minimum 0 1 1 0
Mean 14.8 12.5 13 13
Median 13 11 11 11
Standard Deviation 8.63 6.27 6.58 6.78
Maximum 33 33 34 34
Unweighted bases 74 239 277 590
Weighted bases 74 239 277 590
Nanny/au pair
Minimum * * 0 0
Mean * * 14 13.2
Median * * 12 12
Standard Deviation * * 8.45 8.8
Maximum * * 35 35
Unweighted bases 11 11 77 99
Weighted bases 11 11 77 99
Base: Families ever used type of childcare. Table shows age in months.
Source: SEED Baseline

Table C3.8 Age in months when started using group-based formal childcare
Most
disadvantaged (20%)
Moderately disadvantaged
(20-40%)
Not disadvantaged (>40%)
All
Nursery school
Minimum 2 2 2 2
Mean 23.4 18.2 16.6 19.1
Median 25 18 14 21
Standard Deviation 7.06 8.2 7.8 8.22
Maximum 36 36 36 36
Unweighted bases 224 277 277 778
Weighted bases 224 277 277 778
Nursery attached to a school
Minimum 2 [2] [10] 2
Mean 25.8 [25.1] [26.9] 25.9
Median 25 [25] [26] 25
Standard Deviation 4.88 [7.55] [7.72] 6.61
Maximum 36 [36] [36] 36
Unweighted bases 50 35 36 121
Weighted bases 50 35 36 121
Day nursery
Minimum 0 1 0 0
Mean 22.4 14.8 13.8 16.5
Median 24 12 12 13
Standard Deviation 7.63 8.05 7.08 8.4
Maximum 36 36 36 36
Unweighted bases 421 474 621 1,516
Weighted bases 421 474 621 1,516
Pre-school or play group
Minimum 1 0 0 0
Mean 25.2 24.4 25.2 24.9
Median 26 25 26 26
Standard Deviation 6.7 7.84 7.82 7.5
Maximum 36 36 36 36
Unweighted bases 248 255 296 799
Weighted bases 248 255 296 799 Base: Families ever used type of childcare. Table shows age in months. Source: SEED Baseline

Table C3.9 Childcare use in term time and school holidays at age two by disadvantage level
Term-time Holidays All
Most
disadvantaged (20%)
Moderately disadvantaged
(20-40%)
Not disadvantaged
(>40%)
Most disadvantaged
(20%)
Moderately disadvantaged
(20-40%)
Not disadvantaged
(>40%)
Term Holiday
Day nursery 41 32 36 26 28 32 36 30
Nursery school 20 19 17 12 14 13 18 13
Pre-school 23 17 17 11 8 9 18 9
Childminder 4 13 14 3 11 11 12 9
Nursery attached to a school
5 2 2 2 2 1 3 1
Nanny or au pair + + 5 + + 4 2 2
Crèche 1 + 1 1 + 1 1 +
Maintained nursery 1 + 1 + + + + +
SEN nursery or unit + + + + + + + +
Other childcare 1 + + + + + + +
Informal 17 41 43 17 39 41 37 36
No childcare n/a n/a n/a 36 17 15 n/a 20
Unweighted bases 1,024 1,358 1,551 1,022 1,357 1,550 3,933 3,929
Weighted bases 793 1,310 1,875 792 1,308 1,874 3,979 3,974
Base: All Families using formal or informal childcare in term time. Table shows column %. Columns can add up to more than 100% as more than one category may apply.
Source: SEED Baseline

Table C3.10 Childcare use at age two by mother’s work status
Working FT (30+) Working PT (16-29)
Working PT (1-15)
Mother not working
All
Formal childcare 76 72 55 47 60
Informal childcare only 14 18 19 5 11
No childcare 10 11 26 48 30
Unweighted bases 948 1,409 360 2,877 5,594
Weighted bases 1,072 1,489 368 2,670 5,599
Base: All mothers. Table column %. Source: SEED Baseline
Table C3.11 Formal childcare type used at age two by mother’s work status
Working FT (30+) Working PT (16-29)
Working PT (1-15)
Mother not working All
Childminder, nanny or au pair 18 16 10 3 10
Nursery school or nursery attached to school 17 16 15 13 15
Day nursery 38 31 17 18 25
Preschool or playgroup 8 13 19 14 13
None of these 24 29 45 54 41
Unweighted bases 948 1409 360 2881 5,598
Weighted bases 1072 1489 368 2673 5,602
Base: All mothers. Table column %. Source: SEED Baseline
Table C3.12 Type of formal childcare used by children receiving funded places
Most disadvantaged
(20%)
Moderately disadvantaged
(20-40%)
Not disadvantaged
(>40%)*
All
Day nursery 46 45 42 45
Nursery school 23 27 19 24
Pre-school 23 16 27 22
Childminder 2 11 10 5
Nursery attached to a school 6 4 6 5
Maintained nursery 1 0 2 1
SEN day school, nursery or unit + 1 2 1
Unweighted bases 781 180 70 1,031

Weighted bases 606 202 85 893
Base: All children receiving funded childcare. Table shows age in months. Source: SEED Baseline *Note: The small number of not disadvantaged families reporting receipt of funded hours may be due to misreporting, misclassification, or change in circumstances between time of sampling and the date of interview.
Table C3.13 Age of child (in months) when started receiving the funded provision
Day
nursery Nursery school
Pre-school Nursery at school
Childminder
Mean 25.7 26.0 26.5 27.4 [24.6]
Median 26 26 27 27 [27]
Standard deviation 4.7 4.2 5.2 4.6 [6.0]
Unweighted bases 452 242 236 54 47
Weighted bases 452 242 236 54 47
Base: All children receiving funded childcare. Table shows age in months. Source: SEED Baseline
87

Table C3.14 Take-up of two-year-old entitlement by disadvantage level and family type
Most disadvantaged (20%)
Moderately disadvantaged (20-40%)
Not disadvantaged (>40%)*
All
Lone parent Couple Lone parent Couple Lone parent Couple Lone parent Couple
Received funded childcare 51 40 20 8 15 3 40 8
Received formal childcare but no funded hours 9 12 50 42 42 60 23 49
Did not receive formal childcare* 40 48 30 50 43 37 37 43
Unweighted bases 1,174 475 408 1,567 56 1,962 1,638 4,004
Weighted bases 909 354 409 1,509 67 2,393 1,385 4,257
Base: All Families. Table shows column %. Source: SEED Baseline

Table C3.15 Take-up of two-year-old entitlement by disadvantage level and mother’s level of qualification
Most disadvantaged (20%) Moderately disadvantaged (20-40%)
Not disadvantaged (>40%) All
No/Low qual.
GCSE, A level, FE
Degree or
higher
No/Low qual.
GCSE, A level, FE
Degree or
higher
No/Low qual.
GCSE, A level,
FE
Degree or
higher
No/Low qual.
GCSE, A level,
FE
Degree or
higher
Received funded childcare 45 50 45 15 11 7 7 5 2 29 18 5
Received formal childcare, no funded hours
8 11 19 19 47 57 21 53 70 13 40 65
Did not receive formal childcare* 48 39 36 66 42 37 73 42 28 58 41 30
Unweighted bases 517 966 77 262 1,235 372 96 870 974 875 3,071 1,423
Weighted bases 395 735 59 258 1,196 354 121 1,043 1,198 774 2,974 1,612
Base: All Families. Table shows column %. Source: SEED Baseline

Table C3.16 Reason for not using formal childcare
Most disadvantaged
(20%)
Moderately disadvantaged
(20-40%)
Not disadvantaged
(>40%)
All
Personal preference 50 45 51 48
Cost problems (e.g. too expensive)
17 34 26 27
Child too young 11 6 6 7
Availability problems – providers full/on waiting list
12 5 3 6
Parent/carer not working or on maternity/paternity leave
3 4 5 4
Uses other family members/friends
+ + 1 1
Child has health or behavioural problems
2 1 + 1
Childcare is not open during school holidays
+ + + +
Other reason 5 5 6 6
Unweighted bases 716 931 773 2,420
Weighted bases 537 902 960 2,398
Base: Families not using formal childcare. Source: SEED Baseline

Table C4.1 Sure Start Language measure
Type of childcare Most
disadvantaged (20%)
Moderately disadvantaged
(20%-40%)
Not disadvantaged
(>40%)
All
Mean SSLM1
score Mean SSLM1
score Mean SSLM1
score Mean SSLM1
score Formal childcare before aged two
69.8 77.5 80.3 78.4
Formal childcare from age two only
71.0 72.2 77.2 73.4
No formal childcare 68.0 62.2 67.5 65.6 Total 69.6 69.9 75.5 72.2 Unweighted bases Formal childcare before two 269 714 966 1,949
Formal childcare from two 710 422 391 1,523
No formal childcare 670 839 661 2,170
All children 1,649 1,975 2,018 5,642 The total number of words the child can definitely say in English Source: SEED Baseline
Table C4.2 Sure Start Language measure (including similar word in English)
Type of childcare Most
disadvantaged (20%)
Moderately disadvantaged
(20%-40%)
Not disadvantaged
(>40%)
All
Mean SSLM2
score Mean SSLM2
score Mean SSLM2
score Mean SSLM2
score Formal childcare before aged two
72.7 80.3 82.7 80.9
Formal childcare from age two only
73.6 74.4 79.3 75.7
No formal childcare 70.8 64.6 70.0 68.1 Total 72.3 72.3 77.8 74.7 Unweighted bases Formal childcare before two 269 714 966 1,949
Formal childcare from two 710 422 391 1,523
No formal childcare 670 839 661 2,170
All children 1,649 1,975 2,018 5,642 The total number of words the child can either say in English or can say a similar word for in English
Source: SEED Baseline

Table C4.3 Sure Start Language measure (including word in another language)
Type of childcare Most
disadvantaged (20%)
Moderately disadvantaged
(20%-40%)
Not disadvantaged
(>40%)
All
Mean SSLM3
score Mean SSLM3
score Mean SSLM3
score Mean SSLM3
score Formal childcare before aged two
71.5 79.3 81.4 79.7
Formal childcare from age two only
72.2 74.4 79.4 75.2
No formal childcare 70.5 69.9 74.6 71.8 Total 71.4 74.2 78.8 75.6 Unweighted bases Formal childcare before two 269 714 966 1,949
Formal childcare from two 710 422 391 1,523
No formal childcare 670 839 661 2,170
All children 1,649 1,975 2,018 5,642 The total number of words the child can either say in English or in another language
Source: SEED Baseline
Table C4.4 Sure Start Language measure (including word in another language or similar word in English)
Type of childcare Most
disadvantaged (20%)
Moderately disadvantaged
(20%-40%)
Not disadvantaged
(>40%)
All
Mean SSLM4
score Mean SSLM4
score Mean SSLM4
score Mean SSLM4
score Formal childcare before aged two
74.4 82.0 83.8 82.3
Formal childcare from age two only
74.8 76.6 81.5 77.5
No formal childcare 73.3 72.3 77.1 74.4 Total 74.1 76.7 81.1 78.1 Unweighted bases Formal childcare before two 269 714 966 1,949
Formal childcare from two 710 422 391 1,523
No formal childcare 670 839 661 2,170
All children 1,649 1,975 2,018 5,642 The total number of words the child can either say in English or can say a similar word for in English or can say in another language Source: SEED Baseline
92

Table C4.5 ASBI: Conformity & compliance
Type of childcare Most
disadvantaged (20%)
Moderately disadvantaged
(20%-40%)
Not disadvantaged
(>40%)
All
ASBI: Conformity & Compliance
score
ASBI: Conformity & Compliance
score
ASBI: Conformity & Compliance
score
ASBI: Conformity & Compliance
score Formal childcare before aged two
3.68 3.88 3.86 3.85
Formal childcare from age two only
3.65 3.67 3.79 3.70
No formal childcare 3.54 3.66 3.70 3.64 Total 3.61 3.74 3.79 3.73 Unweighted bases Formal childcare before two 261 708 957 1,926
Formal childcare from two 690 416 386 1,492
No formal childcare 652 815 646 2,113
All children 1,603 1,939 1,989 5,531 Source: SEED Baseline
Table C4.6 ASBI: Pro-social
Type of childcare Most
disadvantaged (20%)
Moderately disadvantaged
(20%-40%)
Not disadvantaged
(>40%)
All
ASBI: Pro-social
score ASBI: Pro-social
score ASBI: Pro-social
score ASBI: Pro-social score
Formal childcare before aged two
3.95 4.11 4.02 4.04
Formal childcare from age two only
3.86 3.84 3.99 3.90
No formal childcare 3.83 3.85 3.88 3.85 Total 3.86 3.94 3.96 3.93 Unweighted bases Formal childcare before two 262 709 955 1,926
Formal childcare from two 686 419 388 1,493
No formal childcare 656 823 645 2,124
All children 1,604 1,951 1,988 5,543 Source: SEED Baseline
93

Table C4.7 ASBI: Confidence
Type of childcare Most
disadvantaged (20%)
Moderately disadvantaged
(20%-40%)
Not disadvantaged
(>40%)
All
ASBI: Confidence
score ASBI: Confidence
score ASBI: Confidence
score ASBI:
Confidence score
Formal childcare before aged two
4.36 4.52 4.49 4.49
Formal childcare from age two only
4.28 4.31 4.42 4.34
No formal childcare 4.24 4.29 4.37 4.31 Total 4.28 4.38 4.44 4.38 Unweighted bases Formal childcare before two 266 712 965 1,943
Formal childcare from two 699 419 391 1,509
No formal childcare 662 827 653 2,142
All children 1,627 1,958 2,009 5,594 Source: SEED Baseline
Table C4.8 ASBI: Anti-social
Type of childcare Most
disadvantaged (20%)
Moderately disadvantaged
(20%-40%)
Not disadvantaged
(>40%)
All
ASBI: Anti-social
score ASBI: Anti-social
score ASBI: Anti-social
score ASBI: Anti-social score
Formal childcare before aged two
1.77 1.69 1.70 1.70
Formal childcare from age two only
1.79 1.79 1.73 1.77
No formal childcare 1.86 1.85 1.74 1.81 Total 1.81 1.78 1.72 1.76 Unweighted bases Formal childcare before two 265 708 957 1,930
Formal childcare from two 695 415 390 1,500
No formal childcare 662 820 648 2,130
All children 1,622 1,943 1,995 5,560 Source: SEED Baseline
94

Table C4.9 ASBI: Anxiety
Type of childcare Most
disadvantaged (20%)
Moderately disadvantaged
(20%-40%)
Not disadvantaged
(>40%)
All
ASBI: Anxiety
score ASBI: Anxiety
score ASBI: Anxiety
score ASBI: Anxiety
score Formal childcare before aged two
2.52 2.40 2.44 2.44
Formal childcare from age two only
2.58 2.53 2.43 2.51
No formal childcare 2.60 2.55 2.46 2.52 Total 2.57 2.49 2.44 2.49 Unweighted bases Formal childcare before two 265 712 963 1,940
Formal childcare from two 697 418 390 1,505
No formal childcare 656 824 649 2,129
All children 1,618 1,954 2,002 5,574 Source: SEED Baseline
Table C4.10 Home Learning Environment score
Type of childcare Most
disadvantaged (20%)
Moderately disadvantaged
(20%-40%)
Not disadvantaged
(>40%)
All
Mean HLE score Mean HLE score Mean HLE score Mean HLE
score Formal childcare before aged two
22.7 24.5 25.3 24.8
Formal childcare from age two only
22.7 22.6 25.0 23.4
No formal childcare 22.9 23.3 24.3 23.6 Total 22.8 23.6 24.9 24.0 Unweighted bases Formal childcare before two 269 714 966 1,949
Formal childcare from two 710 422 391 1,523
No formal childcare 670 838 660 2,168
All children 1,649 1,974 2,017 5,640 Source: SEED Baseline
95

Table C4.11 CHAOS: Confusion, Hubbub And Order Scale
Type of childcare Most
disadvantaged (20%)
Moderately disadvantaged
(20%-40%)
Not disadvantaged
(>40%)
All
Mean CHAOS
score Mean CHAOS
score Mean CHAOS
score Mean CHAOS
score Formal childcare before aged two
8.4 7.7 7.3 7.6
Formal childcare from age two only
8.6 8.1 7.6 8.2
No formal childcare 8.6 8.2 7.7 8.1 Total 8.6 8.0 7.5 7.9 Unweighted bases Formal childcare before two 269 714 965 1,948
Formal childcare from two 709 422 390 1,521
No formal childcare 669 834 660 2,163
All children 1,647 1,970 2,015 5,632 Source: SEED Baseline
96

D. Appendix – Survey materials Opt-out letter
97

98

99

Advance letter
100

101

Survey leaflet
102

103

© NatCen Social Research 2015
Reference: DFE-RR480
ISBN: 978-1-78105-509-0
This research was commissioned under the under the 2010 to 2015 Conservative and Liberal Democrat coalition government. As a result the content may not reflect current Government policy. This research was commissioned under the under the 2010 to 2015 Conservative and Liberal Democrat coalition government. As a result the content may not reflect current Government policy.
The views expressed in this report are the authors’ and do not necessarily reflect those of the Department for Education.
Any enquiries regarding this publication should be sent to us at [email protected] or www.education.gov.uk/contactus
This document is available for download at www.gov.uk/government/publications
104