Baseline Area Analysis Presentation to Steering Group May 20.
24
Baseline Area Analysis Presentation to Steering Group May 20
-
Upload
gwendolyn-reeves -
Category
Documents
-
view
216 -
download
2
Transcript of Baseline Area Analysis Presentation to Steering Group May 20.

Baseline Area Analysis
Presentation to Steering Group
May 20

Presentation Structure
• Starting point
• Approach
• Assessment framework and measures
• Some findings

Starting PointThe Ferries Review is to:
"identify where changes and improvements to ferry services can enable the creation of
dynamic and growing economies for our island and remote rural communities.”
This requires identification of specific islands/mainland areas with economies with
such potential

Approach

TABLE 1.1: STRAND A: INCREASE PRODUCTIVITY AND COMPETITIVENESS: MEASURES
Ref
Measure Description
Basis Measure Data Sources
Data Issues/Availability
A1 Companies of Scale
HIE Operating Plan-secure businesses of greater scale
Number of HIE key account companies % of business units with 25+ employees
HIEABI-2007
HIE analysis limited geographically due to data confidentialityABI analysis limited to higher geographies due to data confidentiality. No trend analysis due to changes in survey method
A2 Presence of Key Sectors
GES: Supportive Business Environment-policy focus on a number of key sectors with high growth potential
% of island/area employment in each of the six key sectors: * Creative Industries* Energy* Financial and Business Services* Food & Drink (including agriculture & fisheries)* Life Sciences* Tourism
ABI-20072001 Census
ABI analysis limited to higher geographies due to data confidentiality. No trend analysis due to changes in survey methodNo data available for either Energy or Life Sciences due to mismatch between sectoral definitions and ABI definitionsABI and Census data are not comparable due to differences in definitionsCensus data for food & drink relate to agriculture and fisheries and the data for tourism relate to hotels & restaurants
A3 Presence of Third Sector
GES: Supportive Business Environment-increase the number of highly successful, competitive businesses
Number of HIE key account social enterprises
HIE Analysis limited geographically due to data confidentiality

Ref
Measure Description
Basis Measure Data Sources
Data Issues/Availability
A4 Export Activity
GES: Supportive Business Environment-pursuit of opportunities outside of Scotland
Value of exports Global Connections Survey
Data only available at HIE area office level
A5 New Business Start-Ups
GES: Scotland's performance in Enterprise identified as one of the reasons for Scotland’s poor productivity
Number of start ups per 1,000
population
Committee of Scottish Clearing Bankers: New Business Statistics
Data only available at HIE area office level
A6 UHI HE Activity
HIE Operating Plan: UHI to be capable of transforming the economic, academic and demographic profile of communities
Number of registered HE students
UHI Data not available for some smaller geographies
A7 Educational Qualifications-Secondary School Attainment
GES: Learning, Skills and Well-being- the skills required to contribute to the wider economy.
% of the S4 year group from two years previously achieving 3+ Awards at SCQF level 6 (Higher) or better
Scottish Government
Data only available at local authority level
A8 Workforce Qualifications
GES: Learning, Skills and Well-being-a skilled and educated workforce is essential to building our comparative advantage
Proportion of working age adults with SCQF level 4 qualifications or below
Annual Population
Survey
Data only available at local authority level due to confidentiality and low sample sizes

TABLE 1.2: STRAND B: INCREASE POPULATION: MEASURES
Ref
Measure
Description
Measure Data Sources Data Issues/Availability
B1 Absolute Levels and Trends
% change 1971-2001% change 2001-2007
Censuses-1971-2001 GRO(S) estimates-post 2001
Census data not available for areas with very small populationsGRO data not available for areas with smaller populations. Some areas’ data combined with those of other areas
B2 Age Average (median) age 2001 Census Data not available for some areas with very small populations
B3 Age Structur
e
% of population aged 20-44
2001 CensusGRO(S) estimates-post 2001
Census data not available for areas with very small populationsGRO data not available for areas with smaller populations. Some areas’ data combined with those of other areas

TABLE 1.3: STRAND C: REDUCE REGIONAL DISPARITY: MEASURES
Ref
Measure Description
Basis Measure Data Sources
Data Issues/Availability
C1 GVA GES: Key measure of relative performance
GVA per capita ONS Data only available for some HIE area office levels
C2 Income GES: Differences in income across Scotland act as a drag on our economic performance and potential
Household income per capita
CACI Estimates not available for some areas with very small populations. Results expressed in terms of four quartiles across the islands/areas covered in the baseline analysis
C3 Unemployment
HIE Operating Plan: Extending the high participation rate-unemployment is more acute in peripheral and island areas
Claimant unemployment rateNumber of claimant unemployed of over 6 months duration as a % of total number of claimant unemployed
NOMIS and GRO(S)
Due to data unavailability, rates calculated as % of all men aged 16-64 and all women aged 16-59, rather than as a % of economically active in those age groups. Thus rates shown are not comparable to published official rates. Analysis limited to higher geographies due to data availability
C4 Narrow Economic Base
HIE Operating Plan: Widen the employment base
% of employment in three largest categoriesPublic sector employment as a % of total employment
2001 Census ABI-2007
Categories used are based on SIC 1 digit codesABI analysis limited to higher geographies due to data confidentiality. No trend analysis due to changes in survey methodABI and Census data are not comparable due to differences in definitions used

Findings

Islands/Areas With Strong Concentration in Key Sectors
Financial & Business ServicesBute Lewis
Food & Drink Islay & Jura
Barra & VatersayLismore
Eday
Creative Industries LewisSkye
Tourism Arran
Mull & IonaColonsay
Iona

New Business Starts Per 1,000 Population: 2007
0
1
2
3
4
5
6
Argyll & TheIslands
Lochaber,Skye & Wester
Ross
OuterHebrides
Orkney Shetland

Milan and Shetland -
Equidistant from London

The G8: Largest Islands/Areas By Population: 2007
0 5,000 10,000 15,000 20,000 25,000
Shetland
Orkney
Lewis
Cowal
Kintyre
Skye
Bute
Arran

The Wee 8: Smallest Islands/Areas By Population:
2001
0 20 40 60 80 100
Fetlar
Flotta
Skerries
North Ronaldsay
Fair Isle
Eigg
Papa Westray
Easdale

1971-2001: Population Change By Number of Islands/Areas
-9
-8-7
-6
-5
-4-3
-2
-1
01
2
3
45
6
Argyll & Clyde Highland Outer Hebrides Orkney Shetland

Main Losers and Gainers: Population Change (%):1971-
2001
-60
-40
-20
0
20
40
60
Bressay
Ardn
amurchan
Luing
Ardg
our
Arran Mull
Skye
Skerr
ies
Harris &
Scalp
ayEd
ay Unst
Gigh
a
Papa
Westra
y
North
Ron
aldsay
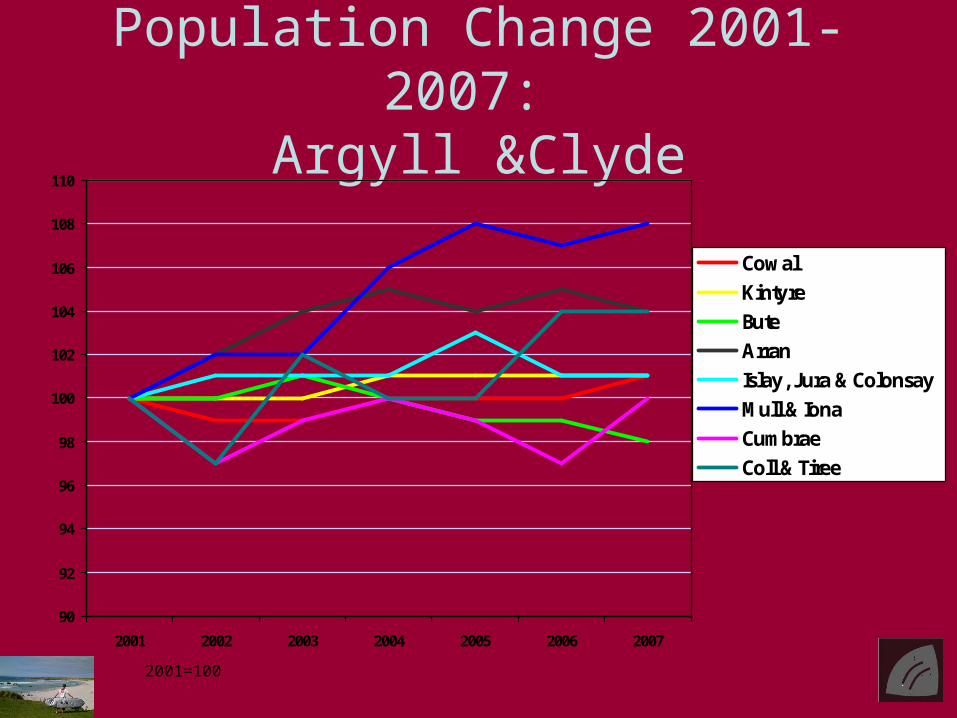
Population Change 2001-2007:
Argyll &Clyde
90
92
94
96
98
100
102
104
106
108
110
2001 2002 2003 2004 2005 2006 2007
CowalKintyreButeArranIslay, Jura & Colonsay Mull & IonaCumbraeColl & Tiree
2001=100

Population Change 2001-2007:
Outer Hebrides
90
92
94
96
98
100
102
104
2001 2002 2003 2004 2005 2006 2007
LewisNorth Uist & BenbeculaHarris & ScalpaySouth Uist & EriskayBarra & Vatersay
2001=100

Population Change 2001-2007:
Orkney
90
92
94
96
98
100
102
104
106
108
110
2001 2002 2003 2004 2005 2006 2007
Orkney North Ronaldsay, Sanday & Stronsay Westray, Papa Westray & Eday Shapinsay, Rousay, Egilsay & Wyre
2001=100

Average Age of Resident: 2001
Under 40Whalsay (36)Fair Isle (37)
Small Isles (38)Shetland (39)
Over 50 Lismore (57)Cumbrae (54)
North Ronaldsay (53)Easdale (51)

Change in Percentage of Population Aged 20-44:
Shetland
0%
5%
10%
15%
20%
25%
30%
35%
40%
2001 2002 2003 2004 2005 2006 2007
Shetland Unst & Fetlar Whalsay & Skerries Yell

Average Per Capita Household Income
First QuartileArdnamurchan
BressayColl
CowalEasdaleFetlarJura
MorvernPapa Westray
ShetlandYell
Fourth QuartileCannaEgilsay
EiggFlotta
LismoreMuck
North RonaldsayRum
SandayShapinsayStronsay
Wyre