
Basel III Pillar 3 Regulatory Capital Disclosures · Wells Fargo & Company . Basel III Pillar 3...
38
Wells Fargo & Company Basel III Pillar 3 Regulatory Capital Disclosures For the quarter ended March 31, 2017 1
Transcript of Basel III Pillar 3 Regulatory Capital Disclosures · Wells Fargo & Company . Basel III Pillar 3...

Wells Fargo amp Company
Basel III Pillar 3 Regulatory Capital Disclosures
For the quarter ended March 31 2017
1
Table of Contents
Disclosure Map 3 Introduction 6
Executive Summary 6 Company Overview 7 Basel III Overview 7
Capital Requirements and Management 12Capital Summary 14Credit Risk 16
Overview 16Wholesale Credit Risk 17Retail Credit Risk 19Counterparty Credit Risk 22Securitization Credit Risk 26Equity Investment Credit Risk 30
Operational Risk 33Market Risk 34Supplementary Leverage Ratio 35Glossary of Acronyms 37Forward-Looking Statements 38
2
Any reference to ldquoWells Fargordquo ldquothe Companyrdquo ldquowerdquo ldquoourrdquo or ldquousrdquo in this Report means Wells Fargo amp Company and
Subsidiaries (consolidated) When we refer to the ldquoParentrdquo we mean Wells Fargo amp Company See the Glossary of Acronyms and
Other Terms for the definition of terms used throughout this Report This Report contains forward-looking statements which may
include our current expectations and assumptions regarding our business the economy and other future conditions Please see
the ldquoForward-Looking Statementsrdquo section for more information including factors that could cause our actual results to differ
materially from our forward-looking statements
Disclosure Map
The table below shows where disclosures related to topics addressed in this Pillar 3 disclosure report can be found in our first
quarter 2017 Form 10-Q and our 2016 Form 10-K
Pillar 3 Requirement
Pillar 3 Report page
Pillar 3 Requirement Description
First Quarter 2017 Form 10-Q reference
2016 Form 10-K reference
Scope of Application Capital Structure amp Capital Adequacy
6-11 Overview Capital Management and Note 1 Capital Management Risk Framework Board Oversight of Risk Management Oversight of
Risk Note 1 and Note 3
12-13 Capital Management and Structure Capital Management Capital Planning and Stress Testing
Capital Management Risk Framework Board and Management-level Committee Structure
Board Oversight of Risk Management Oversight of Risk Capital Planning and Stress
Testing Note 18 and Note 19
14-15 Measurement of Capital
Credit Risk General Disclosures
16-21 Credit Risk Management Overview Credit Risk Management AssetLiability Management and Note 1
Credit Risk Management AssetLiability Management and Note 1
17 Exposure typesImpaired Loans and ALLL Note 4 Note 5 Note 12 and Table 28
17 Industry and Geographic distribution Note 4 Note 12 Table 1 Table 8 Table 12 Table 13 Table 14 Table 16 Table 21
Table 23 and Table 27
15 Risk-Weighted Assets
Credit Risk Internal Ratings-Based
16-21 Credit Risk Management Credit Risk Management AssetLiability Management and Note 1
Credit Risk Management AssetLiability Management and Note 1
16-21 Credit Quality Overview
Counterparty Credit Risk 22-23 Overview
22-25 Counterparty Credit Risk ManagementCollateral
Note 12
Credit Risk Mitigation mdash Guarantees and Credit Derivatives Note 10 Off-Balance Sheet Arrangements and Note 14
Securitization 26-29 Objectives and Roles Note 1 and Note 7 Note 1
28-29 Risk Management and Methodology
29-30 Accounting Valuation and Current Period Activity
Note 7
29-30 Assets Securitized and Re-securitized Note 7
Equity Investments -Non-covered
30-31
32
Policies and Practices
Nonmarketable and Marketable Equity Investments
Note 1 Note 1
30-32 Realized and Unrealized Gains(Losses) Consolidated Statement of Income
Operational Risk 33-34 Operational Risk Operational Risk Management Risk Management
Market Risk 34 Market risk Market Risk - Trading Activities Risk Framework Board Oversight of Risk Management Oversight of Risk and Market
Risk - Trading Activities
Interest Rate Risk mdash Overview Interest Rate Risk for Non-Trading Activities
mdash Earnings Sensitivity AssetLiability Management and Table 30
Supplementary Leverage Ratio
35-36 Supplementary Leverage Ratio Capital Management
3
The tables below provide page references to our first quarter 2017 Form 10-Q and our 2016 Form 10-K for certain topics and
financial information listed in the table on the previous page
Page First Quarter 2017 Form 10-Q reference
Managements Discussion and Analysis
Operational Risk Management 22
Credit Risk Management 22-42
AssetLiability Management 43-53
Interest Rate Risk 43-44
Market Risk - Trading Activities 44-50
Capital Management 54-60
Capital Planning and Stress Testing 59-60
Table 1 Average Balances Yields and Rates Paid (Taxable-Equivalent Basis) 7
Table 8 Maturities for Selected Commercial Loan Categories 19
Table 12 Commercial and Industrial Loans and Lease Financing by Industry 25
Table 13 CRE Loans by State and Property Type 26
Table 14 Select Country Exposures 28
Table 16 Real Estate 1-4 Family First and Junior Lien Mortgage Loans by State 29
Table 21 Junior Lien Mortgage Line and Loan and Senior Lien Mortgage Line Portfolios Payment Schedule 33
Table 23 Analysis of Changes in Nonaccrual Loans 35
Table 27 Loans 90 Days or More Past Due and Still Accruing 39
Table 28 Net Charge-offs 40
Table 30 Net Interest Income Sensitivity Over Next Two-Year Horizon Relative to Base Expectation 43
Forward-Looking Statements 67-68
Consolidated Statement of Income 71
Notes to Consolidated Financial Statements
Note 1 Summary of Significant Accounting Policies 77-78
Note 4 Investment Securities 80-86
Note 5 Loans and Allowance for Credit Losses 87-102
Note 7 Securitizations and Variable Interest Entities 104-110
Note 10 Guarantees Pledged Assets and Collateral 116-119
Note 12 Derivatives 122-128
4
Page 2016 Form 10-K
reference
Managements Discussion and Analysis
Off-Balance Sheet Arrangements 61-62
Risk Management 62-104
Risk Framework 63
Board and Management-level Committee Structure 63-64
Board Oversight of Risk 65
Management Oversight of Risk 65
Credit Risk Management 67-91
AssetLiability Management 91-104
Market Risk - Trading Activities 93-100
Capital Management 104-110
Capital Planning and Stress Testing 109-110
Risk Factors 121-136
Notes to Consolidated Financial Statements
Note 1 Summary of Significant Accounting Policies 147-157
Note 3 Cash Loan and Dividend Restrictions 158
Note 14 Guarantees Pledged Assets and Collateral 208-212
Note 18 Preferred Stock 245-247
Note 19 Common Stock and Stock Plans 248-251
5
IntroductionExecutive Summary
The Pillar 3 disclosures included within this Report are required by the regulatory capital rules issued by the Office of the
Comptroller of the Currency (OCC) the Board of Governors of the Federal Reserve System (FRB) (collectively the
Agencies) and the Federal Deposit Insurance Corporation (FDIC) and are designed to comply with the rules and regulations
associated with the Basel III capital adequacy framework which prescribed these disclosures under its Pillar 3 - Market
Discipline rules These disclosures should be read in conjunction with our Quarterly Report on Form 10-Q for the quarter
ended March 31 2017 (first quarter 2017 Form 10-Q) and our Annual Report on Form 10-K for the year ended December 31
2016 (2016 Form 10-K) The Pillar 3 disclosures provide qualitative and quantitative information about regulatory capital
calculated in conformity with the transition provisions under the Advanced Approach for first quarter 2017
At March 31 2017 we calculated our Common Equity Tier 1 (CET1) tier 1 and total capital ratios in accordance with the
Standardized and Advanced Approaches The lower of each ratio calculated under the two approaches is used in the
assessment of our capital adequacy The CET1 and tier 1 capital ratios were lower under the Standardized Approach and our
total capital ratio was lower under the Advanced Approach Table 1 summarizes CET1 tier 1 total capital risk-weighted
assets (RWAs) and the respective capital ratios under the Advanced and Standardized Approaches with transition
requirements at March 31 2017 The capital ratios set forth in Table 1 exceed the minimum required capital ratios for CET1
tier 1 and total capital ratios respectively
Table 1 Capital Components and Ratios Under Basel III (Transition Requirements) March 31 2017
(in millions except ratios) Advanced Approach
Standardized Approach
Common Equity Tier 1 Capital
Tier 1 Capital
Total Capital
Risk-Weighted Assets
$ 149860
172543
205269
1250630
149860
172543
215158
1300723
Common Equity Tier 1 Capital Ratio
Tier 1 Capital Ratio
Total Capital Ratio
1198
1380
1641
1152
1327
1654
Denotes the lowest capital ratio determined under the Advanced and Standardized Approaches
In addition under supplementary leverage ratio (SLR) requirements which required disclosure beginning in 2015 the
Companyrsquos estimated SLR was 777 at March 31 2017 using the Advanced Approach capital framework with transition
requirements The SLR rule which becomes effective on January 1 2018 will require a covered bank holding company to
maintain a minimum SLR of at least 50 to avoid restrictions on capital distributions and discretionary bonus payments
The rule will also require that all of our insured depository institutions maintain a SLR of at least 60 under applicable
regulatory capital adequacy guidelines Based on our review our current leverage levels would exceed the applicable
requirements for each of our insured depository institutions
6
Company Overview
Wells Fargo amp Company is a diversified community-based financial services company with $195 trillion in assets Founded in
1852 and headquartered in San Francisco we provide banking insurance investments mortgage and consumer and
commercial finance through more than 8500 locations 13000 ATMs digital (online mobile and social) and contact centers
(phone email and correspondence) and we have offices in 42 countries and territories to support customers who conduct
business in the global economy With approximately 273000 active full-time equivalent team members we serve one in three
households in the United States and ranked No 27 on Fortunersquos 2016 rankings of Americarsquos largest corporations We ranked
third in assets and second in the market value of our common stock among all US banks at March 31 2017
Wells Fargo manages a variety of risks that can significantly affect our financial performance and our ability to meet the
expectations of our customers stockholders regulators and other stakeholders Among the risks that we manage are conduct
risk operational risk credit risk and assetliability management related risks which include interest rate risk market risk
liquidity risk and funding related risks We operate under a Board-level approved risk framework which outlines our company-
wide approach to risk management and oversight and describes the structures and practices employed to manage current and
emerging risks inherent to Wells Fargo A discussion of our risk management framework and culture is provided in the ldquoRisk
Frameworkrdquo ldquoBoard Oversight of Riskrdquo and ldquoManagement Oversight of Riskrdquo sections in Managements Discussion and
Analysis to our 2016 Form 10-K and is applicable to our management of the conduct operational credit and assetliability
management risks as discussed in this Report
Basel III Overview
The Company is subject to final and interim final rules issued by the Agencies and FDIC to implement the Basel Committee
on Banking Supervision (BCBS) Basel III capital requirements for US banking organizations (Final Rule) Basel III
establishes a capital adequacy framework which provides for measuring required capital under two approaches applied in a
phased manner encouraging market discipline These approaches consist of the Advanced Approach and Standardized
Approach The Advanced Approach is only applicable to banking organizations with consolidated assets greater than $250
billion or with foreign exposures exceeding $10 billion on their balance sheet See the ldquoCapital Managementrdquo section in
Managements Discussion and Analysis to our first quarter 2017 Form 10-Q and our 2016 Form 10-K for additional
information concerning various regulatory capital adequacy rules applicable to us
In the assessment of our capital adequacy we must report the lower of our CET1 tier 1 and total capital ratios calculated
under the Standardized Approach and under the Advanced Approach As of March 31 2017 our CET1 and tier 1 capital
ratios were lower under the Standardized Approach and our total capital ratio was lower under the Advanced Approach The
capital requirements that apply to us can change in future reporting periods as a result of these rules and the tables within this
report include RWAs information under the Advanced Approach
7
The Final Rule is part of a comprehensive set of reform measures and regulations intended to improve the banking sectorrsquos
ability to absorb shocks arising from financial and economic stress improve risk management and governance and
strengthen banksrsquo transparency and disclosures To achieve these objectives the Final Rule among other things requires on a
fully phased-in basis
bull A minimum CET1 ratio of 90 comprised of a 45 minimum requirement plus a capital conservation buffer of
25 and for us as a global systemically important bank (G-SIB) a capital surcharge to be calculated annually
which is 20 based on our year-end 2015 data
bull A minimum tier 1 capital ratio of 105 comprised of a 60 minimum requirement plus the capital conservation
buffer of 25 and the G-SIB capital surcharge of 20
bull A minimum total capital ratio of 125 comprised of a 80 minimum requirement plus the capital conservation
buffer of 25 and the G-SIB capital surcharge of 20
bull A potential countercyclical buffer of up to 25 to be added to the minimum capital ratios which is currently not in
effect but could be imposed by regulators at their discretion if it is determined that a period of excessive credit
growth is contributing to an increase in systemic risk
bull A minimum tier 1 leverage ratio of 40 and
bull A minimum SLR of 50 (comprised of a 30 minimum requirement plus a supplementary leverage buffer of
20) for large and internationally active bank holding companies (BHCs)
The Company has been designated as a G-SIB indicating it is subject to the FRBrsquos rule implementing the additional capital
surcharge of between 10 - 45 on those US banking organizations that have been designated by the Financial Stability
Board (FSB) as G-SIBs Under the rule we must annually calculate our surcharge under two methods and use the higher of
the two surcharges The first method (method one) will consider our size interconnectedness cross-jurisdictional activity
substitutability and complexity consistent with a methodology developed by the BCBS and FSB The second method
(method two) will use similar inputs but will replace substitutability with use of short-term wholesale funding and will
generally result in higher surcharges than the BCBS methodology The phase-in period for the capital conservation buffer and
the G-SIB surcharge began on January 1 2016 and will become fully effective on January 1 2019 Based on year-end 2015
data our 2017 G-SIB surcharge under method two is 20 (on a fully phased-in basis) of the Companys RWAs which is the
higher of method one and method two Because the G-SIB surcharge is calculated annually based on data that can differ over
time the amount of the surcharge is subject to change in future years The bullets above set forth the fully phased-in
minimum required capital ratios the Company must maintain in order for the Company to avoid limitations on capital
distributions and discretionary bonus payments
The Company is not subject to any limitations on capital distributions and discretionary bonus payments under the Final Rule
as our capital ratios at March 31 2017 exceeded the minimum required capital ratios with transition requirements by 477 bps
for CET1 and 502 bps for tier 1 capital under the Standardized Approach and 616 bps for total capital under the Advanced
8
Approach At March 31 2017 our eligible retained income was $219 billion which was our net income for the four quarters
preceding the current quarter
The following table presents the minimum required capital ratios with transition requirements and their anticipated phase-in
through 2019
2015 2016 2017 (1) 2018 (2) 2019 (2)
Common Equity Tier 1 Capital 4500 5625 6750 7875 9000
Tier 1 Capital 6000 7125 8250 9375 10500
Total Capital 8000 9125 10250 11375 12500
(1) At March 31 2017 under transition requirements the CET1 tier 1 and total capital minimum ratio requirements for Wells Fargo amp Company include a capital conservation buffer of 125 and a G-SIB surcharge of 1
(2) These minimum required capital ratios assume that no countercyclical buffer has been imposed and that there is no change to our G-SIB surcharge
The Final Rule is structured around three Pillars as follows
bull Pillar 1 - Minimum Capital Adequacy Standards Relative to Basel I Basel III requires banks to develop more
refined approaches to quantifying the capital requirements for credit risk and also introduces a capital charge for
operational risk under the Advanced Approach which was not included in Basel I
bull Pillar 2 - Internal Capital Adequacy Assessment Process Pillar 2 modifies Pillar 1 capital requirements to
include idiosyncratic risk in addition to risks banks face that are not included in Pillar 1 (eg interest rate risk on the
banking book) Pillar 2 is principle-based and places significant emphasis not just on the calculations of capital but
also the calculation processes and the mechanisms management uses to assure itself that Wells Fargo is adequately
capitalized In accordance with Pillar 2 Wells Fargo is required to develop and maintain an Internal Capital
Adequacy Assessment Process (ICAAP) to support the assessment of its capital adequacy Furthermore Pillar 2
outlines principles of supervisory review to monitor the banksrsquo capital and evaluate the banksrsquo management of risks
through the use of internal control processes
bull Pillar 3 - Market Discipline The objective of Pillar 3 is to improve risk disclosure in order to permit market forces
to exert pressure on insufficiently capitalized banks This results in the establishment of new minimum requirements
for qualitative and quantitative disclosures to be made available to the public that contain the outcome of capital
calculations and risk estimates as well as the methods and assumptions used in performing those calculations Wells
Fargo was required to comply with the Final Rule beginning January 1 2014 with certain provisions subject to
phase-in periods On January 28 2015 the BCBS issued phase 1 of the final standard and a proposal for phase 2 on
March 11 2016 for the revised Pillar 3 disclosure requirements These revisions will enable market participants to
compare banksrsquo disclosures of risk-weighted assets and improve transparency of the internal model-based
approaches that banks use to calculate minimum regulatory capital requirements The Agencies have not yet
published the proposed rules to implement the revised requirements issued by the BCBS
9
Scope of Application of Basel III
The Basel III framework applies to Wells Fargo amp Company and its subsidiary banks Wells Fargo amp Companyrsquos subsidiary
banks are Wells Fargo Bank National Association (Wells Fargo Bank NA) Wells Fargo Bank South Central National
Association (Wells Fargo Bank South Central NA) Wells Fargo Bank Northwest National Association (Wells Fargo Bank
Northwest NA) Wells Fargo Financial National Bank Wells Fargo Delaware Trust Company National Association (Wells
Fargo Delaware Trust Company NA) and Wells Fargo Bank Ltd
The basis of consolidation used for regulatory reporting is the same as that used under US Generally Accepted Accounting
Principles (GAAP) We currently do not have any unconsolidated entities whose capital is deducted from the Companys total
capital except for certain insurance subsidiaries For additional information on our basis for consolidating entities for
accounting purposes see Note 1 (Summary of Significant Accounting Policies) to Financial Statements in our first quarter
2017 Form 10-Q and our 2016 Form 10-K For information regarding restrictions or other major impediments on the transfer
of funds and capital distributions see Note 3 (Cash Loan and Dividend Restrictions) to Financial Statements in our 2016
Form 10-K
Capital under Basel III
Basel III modified earlier rules by narrowly defining qualifying capital and increasing capital requirements for certain
exposures CET1 capital primarily includes common stockholdersrsquo equity accumulated other comprehensive income (AOCI)
and retained earnings less deductions for certain items such as goodwill gains related to securitization transactions
intangibles and minority interest as well as certain items exceeding specified thresholds including mortgage servicing rights
(MSRs) and deferred tax assets (DTAs) and investments in financial institutions as defined by the Final Rule Tier 1 capital
consists of CET1 capital in addition to capital instruments that qualify as tier 1 capital such as preferred stock Tier 2 capital
includes qualifying allowance for credit losses and long-term debt and other instruments qualifying as Tier 2 capital Total
capital is the sum of tier 1 and tier 2 capital The requirements of CET1 capital tier 1 capital and total capital are subject to a
phase-in period that began on January 1 2014 and concludes on December 31 2021
Risk-Weighted Assets under Basel III
Compared with the Standardized Approach the calculation of RWAs under the Advanced Approach requires that applicable
banks employ robust internal models for risk quantification The significant differences in the two approaches consist of the
following
bull Credit Risk under the Advanced Approach credit risk RWAs is calculated using risk-sensitive calculations that rely
upon internal credit models based upon the Companyrsquos experience with internal rating grades whereas under the
Standardized Approach credit risk RWAs is calculated using risk-weights prescribed in the Final Rule that vary by
exposure type
10
bull Operational Risk the Advanced Approach includes a separate operational risk component within the calculation of
RWAs while the Standardized Approach does not
bull Credit Valuation Adjustment (CVA) capital charge the Advanced Approach for counterparty credit risk includes a
charge for CVA and the Standardized Approach does not and
bull Add-on Multiplier under the Advanced Approach a 6 add-on multiplier is applied to all components of credit risk
RWAs other than the CVA component
The primary components of RWAs under the Advanced Approach include
bull Credit Risk RWAs which reflect the risk of loss associated with a borrower or counterparty default (failure to meet
obligations in accordance with agreed upon terms) and is presented by exposure type including wholesale credit
risk retail credit risk counterparty credit risk securitization exposure equity investments and other assets
bull Market Risk RWAs which reflect the risk of possible economic loss from adverse changes in market risk factors
such as interest rates credit spreads foreign exchange rates equity commodity prices mortgage rates and market
liquidity and
bull Operational Risk RWAs which reflect the risk of loss resulting from inadequate or failed internal controls and
processes people and systems or resulting from external events
Transitional Period for Basel III
The Final Rule provides for a transitional period for certain elements of the rule calculations extending through the end of
2021 at which point the capital requirements become fully phased-in as demonstrated in the diagram below The risk-
weighted assets disclosed within this report are based upon the transitional capital provisions unless otherwise expressly
stated
Transitional Period Fully Phased-in
2014 2015-2018 2019 amp beyond
Capital (Numerator) Basel III Transitional Capital Basel III Capital (1)
Risk-Weighted Assets Standardized Approach Basel I With 25 (2) Basel III Standardized
(Denominator)
Advanced Approach (3) Basel III Advanced
(1) Trust preferred securities (TruPS) and other non-qualifying capital instruments to be phased-out by December 31 2021 (2) Refers to the Final Market risk rule issued August 30 2012 Collectively this approach is referred to as the General Approach (3) Only firms that have exited parallel are allowed to use the Advanced Approach
11
Capital Requirements and Management
Wells Fargorsquos objective in managing its capital is to maintain capital at an amount commensurate with our risk profile and risk
tolerance objectives and to meet both regulatory and market expectations We primarily fund our capital needs through the
retention of earnings net of both dividends and share repurchases as well as through the issuance of preferred stock and long and
short-term debt We manage capital to meet internal capital targets with the goal of ensuring that sufficient capital reserves
remain in excess of regulatory requirements and applicable internal buffers (set in excess of minimum regulatory requirements by
the Companyrsquos Board of Directors) There are operational and governance processes in place designed to manage forecast
monitor and report to management and the Companyrsquos Board of Directors capital levels in relation to regulatory requirements
and capital plans
The Company and each of its insured depository institutions are subject to various regulatory capital adequacy requirements
administered by the Agencies and the FDIC Risk-based capital guidelines establish a risk-adjusted ratio relating capital to
different categories of assets and off-balance sheet exposures Our capital adequacy assessment process contemplates material
risks that the Company is exposed to and also takes into consideration our performance under a variety of stressed economic
conditions as well as regulatory expectations and guidance
Capital Management
Wells Fargo actively manages capital through a comprehensive process for assessing its overall capital adequacy Our Capital
Management Committee (CMC) and Corporate AssetLiability Management Committee (ALCO) each overseen by the Finance
Committee of our Board of Directors (Board) provide oversight of our capital management framework CMC recommends our
capital objectives and strategic actions to the Finance Committee for approval establishes our capital targets and triggers and sets
the capital policy ALCO reviews the actual and forecasted capital levels every month and together with CMC monitors capital
against regulatory requirements and internal triggers for signs of stress CMC and ALCO review the Companyrsquos capital
management performance against objectives to ensure alignment with the expectations and guidance offered by regulatory
agencies and our Board The Companyrsquos annual capital plan serves as our primary planning tool to establish and test our capital
strategy relative to our capital policy and provides a comprehensive discussion of our capital targets Throughout the year
progress against our capital plan is monitored and reported to executive management CMC ALCO and our Board Our capital
plan incorporates baseline forecasts as well as forecasts under stress in order to assess our capital position under multiple
economic conditions Our Boardrsquos Risk Committee Finance Committee and Credit Committee meet regularly throughout the
year to establish the risk appetite and the Finance Committee and Credit Committee review the results of stress testing in order to
evaluate and oversee the management of the Companyrsquos projected capital adequacy For information on the terms and conditions
of our regulatory capital instruments refer to Note 18 (Preferred Stock) and Note 19 (Common Stock and Stock Plans) to
Financial Statements in our 2016 Form 10-K For a discussion on our risk management framework see the ldquoRisk Frameworkrdquo
12
ldquoBoard and Management-level Committee Structurerdquo ldquoBoard Oversight of Riskrdquo and ldquoManagement Oversight of Riskrdquo sections
in Managements Discussion and Analysis to our 2016 Form 10-K
Additionally the Companyrsquos Capital Reporting Committee (CRC) provides oversight of the regulatory capital calculation results
and capital calculation disclosures The CRC reports directly to the Regulatory and Risk Reporting Oversight Committee
(RRROC) a management governance committee overseen by the Audit and Examination Committee of the Companyrsquos Board
The RRROC provides oversight of Wells Fargorsquos regulatory reporting and disclosures and assists executive management in
fulfilling their responsibilities for oversight of the regulatory financial reports and disclosures made by the Company
Wells Fargo amp Company is the primary provider of capital to its subsidiaries However each of the Companyrsquos insured depository
institutions manages its own capital to support planned business growth and meet regulatory requirements within the context of
the Companyrsquos annual capital plan For additional information on our capital management see the ldquoCapital Managementrdquo section
in Managements Discussion and Analysis to our first quarter 2017 Form 10-Q and to our 2016 Form 10-K
Internal Capital Adequacy Assessment Process (ICAAP)
Our internal capital adequacy assessment process referred to as ICAAP is designed to identify our exposure to material risks and
evaluate the capital resources available to absorb potential losses arising from those risks Semiannually we execute company-
wide capital stress tests as a key analytical tool to assess our capital adequacy relative to our risk profile and risk appetite
Company-wide capital stress testing is a forward-looking assessment of the potential impact of adverse events and circumstances
on Wells Fargorsquos capital adequacy The key outputs from stress testing are pro forma balance sheets and income statements
prepared consistent with US GAAP which are then used to evaluate capital adequacy
Comprehensive Capital Analysis and Review
In addition to its use in Wells Fargorsquos ongoing ICAAP company-wide capital stress testing also supports the FRBrsquos annual
Comprehensive Capital Analysis and Review (CCAR) the FRBrsquos lsquoMid-Cycle Stress Testrsquo as required by the Dodd-Frank Act for
BHCs with assets in excess of $50 billion and the OCC Annual Stress Test including related regulatory reporting requirements
and disclosure by Wells Fargo of stress testing methodologies and certain adverse scenario results For details on our CCAR
process refer to the ldquoCapital Planning and Stress Testingrdquo section in Managements Discussion and Analysis to our first quarter
2017 Form 10-Q and to our 2016 Form 10-K
13
Capital Summary
Table 2 shows the adequacy of risk-based capital for Wells Fargo amp Company and its insured depository subsidiaries under the
Advanced Approach with transition requirements at March 31 2017
Table 2 Capital Adequacy of Wells Fargo amp Company and its Insured Depository Subsidiaries March 31 2017
Advanced Approach
(in millions except ratios)
CET 1 Capital (1)
Tier 1 Capital (2)
Total Capital
(3)
Advanced Approach RWAs (4)
CET1 Capital Ratio (5)
Tier 1 Capital Ratio (6)
Total Capital Ratio (7)
Wells Fargo amp Company
Wells Fargo Bank NA
Wells Fargo Bank South Central NA
Wells Fargo Bank Northwest NA
Wells Fargo Financial National Bank
Wells Fargo Bank Ltd
$ 149860
133362
1256
1252
1113
441
172543
133362
1256
1252
1113
441
205269
147007
1256
1252
1113
441
1250630
1123251
4427
2885
6513
1113
1198
1187
2837
4340
1708
3962
1380
1187
2837
4340
1708
3962
1641
1309
2837
4340
1708
3962
(1) Common Equity Tier 1 capital (CET1 capital) consists of common shares issued and additional paid-in capital retained earnings and other reserves excluding cash flow hedging reserves less specified regulatory adjustments
(2) Tier 1 capital is the sum of CET1 capital and additional Tier 1 capital
(3) Total capital is defined as Tier 1 capital plus Tier 2 capital (4) Total Risk-Weighted Assets (RWA) under Advanced Approach includes the 6 credit risk multiplier where applicable (5) CET1 capital ratio = CET1 capital RWA (6) Tier 1 capital ratio = Tier 1 capital RWA (7) Total capital ratio = Total capital RWA
Table 3 provides information regarding the components of capital used in calculating CET1 capital tier 1 capital tier 2 capital
and total capital under the Advanced Approach with transition requirements for Wells Fargo amp Company at March 31 2017
Table 3 Total Regulatory Capital Base March 31 2017
(in millions)
Common stock plus related surplus net of treasury stock $ 45534
Retained earnings 136032
Accumulated other comprehensive income (AOCI) (2601)
Common Equity Tier 1 capital (CET1) before regulatory adjustments and deductions
Less Goodwill (net of associated deferred taxes)
Other (includes intangibles net gainloss on cash flow hedges)
178965
27063
2042
Total adjustments and deductions for Common Equity Tier 1 capital 29105
CET1 capital 149860
Additional Tier 1 capital instruments plus related surplus 23112 Less Total additional Tier 1 capital deductions 429
Additional Tier 1 capital 22683
Tier 1 capital 172543
Tier 2 capital before regulatory adjustments and deductions 32985
Less Total Tier 2 capital deductions 259
Tier 2 capital
Total capital
32726
$ 205269
14
Table 4 presents information on the RWAs components included within our regulatory capital ratios under the Advanced
Approach with transition requirements for Wells Fargo amp Company at March 31 2017
Table 4 Risk-Weighted Assets by Risk Type - Advanced Approach March 31 2017
(in millions)
Credit
Wholesale exposures
Corporate $ 308962
Bank 11501
Sovereign 3379
Income Producing Real Estate 76541
High Volatility Commercial Real Estate 31372
Total Wholesale exposures 431755
Retail exposures Residential mortgage - first lien 90376
Residential mortgage - junior lien 5263
Residential mortgage - revolving 49647
Qualifying revolving (1) 40963
Other retail 82581
Total Retail exposures 268830
Counterparty exposures OTC Derivatives 19257
Margin loans and repo style transactions 17235
Cleared transactions (2) 2320
Unsettled Trades 293
Total Counterparty exposures 39105
Credit Valuation Adjustments (CVA) 20420 Securitization exposures 69785
Equity investment exposures 36399
Other exposures (3) 43340
Total Credit Risk-Weighted Assets 909634
Market risk Operational risk
Total Risk-Weighted Assets (Advanced Approach)
42759 298237
$ 1250630
(1) Qualifying revolving exposures are unsecured revolving exposures where the undrawn portion of the exposure is unconditionally cancellable by the bank
(2) Includes Derivative and Repo exposures to Central Counterparties with RWAs of $587 million and $32 million respectivelyDefault fund contribution to counterparties resulted in RWAs of $1701 million which is also included
(3) Other exposures include other assets and transition items (non-deducted Intangibles and Mortgage Servicing Rights)
15
Credit RiskOverview
We define credit risk as the risk of loss associated with a borrower or counterparty default (failure to meet obligations in
accordance with agreed upon terms) Credit risk exists with many of our assets and exposures such as debt security holdings
certain derivatives and loans Our loan portfolios represent the largest component of assets on our balance sheet for which we
have credit risk A key to our credit risk management is our adherence to a well-controlled underwriting process which we
believe is appropriate for the needs of customers as well as investors who purchase loans or securities collateralized by the loans
we underwrite We only approve applications and make loans if we believe the customer has the ability to repay the loan or line of
credit in accordance with all of its contractual terms Our ongoing methods for monitoring and measuring various forms of credit
risks are discussed by respective credit risk type in subsequent sections
Wells Fargo uses numerous control processes to monitor and validate its systems on an ongoing basis These control processes are
independent of the development implementation and operation of the Advanced Internal Ratings Based (A-IRB) systems Under
the A-IRB systems risk parameters (probability of default - PD loss given default - LGD and exposure at default- EAD) are
calculated using internal models We rely on historical data along with external benchmarks such as agency reports and
macroeconomic data to develop and implement these models and various corporate risk groups are responsible for independent
model validation and ongoing performance monitoring
The Companyrsquos credit risk management oversight process is governed centrally but provides for decentralized management and
accountability by our lines of business The overall credit process includes comprehensive credit policies disciplined credit
underwriting frequent and detailed risk measurement and modeling extensive credit training programs and a continual
independent loan review and audit process In addition regulatory examiners review and perform detailed tests of our credit
underwriting and loan administration processes Refer to the ldquoCredit Risk Managementrdquo section in Managements Discussion and
Analysis to our first quarter 2017 Form 10-Q and to our 2016 Form 10-K for additional information
Information about our credit risk management and practices accounting policies and current exposures as reported under US
GAAP is provided in our first quarter 2017 Form 10-Q and 2016 Form 10-K The following provides specific references
Accounting Policies
bull Refer to Note 1 (Summary of Significant Accounting Policies) to Financial Statements in our first quarter 2017 Form 10-
Q and our 2016 Form 10-K for a summary of our significant accounting policies including policy discussion on
nonaccrual and past due loans as well as returning nonaccrual loans to accrual status impaired loans and loan charge-
off policies
16
Total Credit Risk Exposures Impaired Loans Net Charge-offs and Allowance for Credit Losses
bull Investment Securities- refer to Note 4 (Investment Securities) to Financial Statements in our first quarter 2017 Form 10-
Q
bull Credit Exposure and Impaired Loans - refer to Note 5 (Loans and Allowance for Credit Losses) to Financial Statements
in our first quarter 2017 Form 10-Q
bull Derivatives - refer to Note 12 (Derivatives) to Financial Statements in our first quarter 2017 Form 10-Q and
bull Net Charge-offs - refer to Table 28 (Net Charge-offs) to Financial Statements in our first quarter 2017 Form 10-Q
Distribution by Geography Industry or Counterparty Type and Contractual Maturity
bull Investment Securities - refer to Note 4 (Investment Securities) to Financial Statements in our first quarter 2017 Form 10-
Q for details on counterparty type and contractual maturity
bull Loans - refer to Table 8 (Maturities for Selected Commercial Loan Categories) Table 12 (Commercial and Industrial
Loans and Lease Financing by Industry) Table 13 (CRE Loans by State and Property Type) Table 14 (Select Country
Exposures) Table 16 (Real Estate 1-4 Family First and Junior Lien Mortgage Loans by State) Table 21 (Junior Lien
Mortgage Line and Loan and Senior Lien Mortgage Line Portfolios Payment Schedule) Table 23 (Analysis of Changes
in Nonaccrual Loans) and Table 27 (Loans 90 Days or More Past Due and Still Accruing) in Managements Discussion
and Analysis to our first quarter 2017 Form 10-Q
bull Derivatives - refer to Note 12 (Derivatives) to Financial Statements in our first quarter 2017 Form 10-Q
Average Balances
bull Refer to Table 1 (Average Balances Yields and Rates Paid (Taxable-Equivalent Basis)) in Managements Discussion and
Analysis to our first quarter 2017 Form 10-Q
Following is a discussion of how we assess manage and measure credit risk by Basel exposure type
Wholesale Credit Risk
Overview Management approach
Wholesale exposures primarily include the following
bull All individually risk-rated loans and commitments excluding certain commercial loans under $1 million which receive
retail regulatory capital treatment and other commercial loans which meet the definition of securitization exposures
bull Deposits with and money due from banks excluding cash items in the process of collection
bull Debt securities excluding those asset-backed securities (ABS) which meet the definition of a securitization exposure
17
bull Trading assets that do not qualify as covered positions but meet the definition of a wholesale exposure
bull Accounts receivable that do not fit in other reporting categories
bull Certain insurance exposures where the Company could suffer a loss if the insurer were to default
bull Reverse repurchase transactions that do not meet the definition of a securitization exposure or a repo-style transaction
due to the nature of the collateral or contractual terms of the arrangement and
bull Non-derivative financial guarantees that obligate the Company to make payment if another party fails to perform
At origination and throughout the life of a wholesale loan exposure our underwriters and loan officers use a risk rating
methodology to indicate credit quality Risk rating is essential to wholesale credit approval risk management monitoring and
reporting loan pricing determination of an appropriate allowance for loan and lease losses regulatory capital assignments under
the Advanced Approach and sound corporate governance processes Risk ratings are individually evaluated and incorporate
quantitative and qualitative factors including both point-in-time and through-the-cycle elements External ratings and other
assessments may be considered by underwriters and loan officers as a part of their overall credit evaluation and independent
assignment of an internal rating
Credit Officers certify risk ratings quarterly and are accountable for their accuracy Our Corporate Credit Group and line of
business credit functions continually evaluate and modify credit policies including risk ratings to address unacceptable levels of
risk as they are identified Further oversight is provided by our Corporate Risk Asset Review group
RWAs Measurement Advanced Internal Ratings Based
Table 4 presents risk-weighted assets by Basel reporting classification The Corporate Bank and Sovereign classifications include
credit exposure to corporate entities banks and sovereign entities respectively Loans made for the purposes of real estate
acquisition development and construction other than 1-4 family residential properties present higher risk and are categorized as
high volatility commercial real estate (HVCRE) Additionally loans which finance commercial real estate (CRE) where the
prospects for repayments and recovery depend solely on the cash flows generated by the real estate serving as collateral for the
exposures are categorized as income-producing real estate (IPRE) in the Final Rule
Risk-weighted assets are determined by using internal risk weight parameters The estimation process for these parameters begins
with internal risk-ratings assigned to the obligor and internal loss severity classifications assigned to the credit facility The
obligor ratings are mapped to estimates of PD and the loss severity classifications are mapped to estimates of LGD Obligor
ratings and loss severity classifications are used for both internal risk management and regulatory capital calculations Parameters
are based on models which are validated and back-tested by an independent internal model risk governance team
To calculate wholesale credit RWAs the Company inputs its modeled risk parameters (PD EAD and LGD) and maturity (M) into
the A-IRB risk weight formula as specified by the Final Rule PD is an estimate of the probability that an obligor will default
over a one-year horizon EAD is an estimate of the amount that would be owed to Wells Fargo if the obligor were to default LGD
18
is an estimate of the portion of the EAD that would be lost (including the economic cost of delayed recovery and the cost of
collection) in a stressed environment with high default rates M is the effective remaining maturity of the exposures Additionally
modeled parameters may be supplemented with judgmental overlays to address model or data limitations and to help ensure
conservatism where appropriate
The risk mitigating benefit of guarantees and credit derivative hedges are reflected in the RWAs calculation by adjusting the PD
or LGD At March 31 2017 $96 billion of wholesale exposures reflected the benefit of eligible guarantees
Table 5 provides the distribution of wholesale exposures and key parameter estimates by PD bands While the commercial loan
portfolio comprises the majority of the wholesale EAD and more than 80 of the wholesale RWAs the non-loan categories
(identified in the bullet points at start of Wholesale Credit Risk section) add significant balances to the low-risk part of the
portfolio
Table 5 The Companys Credit Risk Assessment of Wholesale Exposures by Probability of Default (PD) Grades March 31 2017
(in millions except ratios) Exposure-weighted average
Advanced PD Range (percentage)
Balance Sheet Amount
Undrawn Commitments
Exposure at Default
Approach RWAs (1) PD LGD Risk Weight
000 to lt 005 $ 538246 10654 543110 17742 002 1009 327
005 to lt 025 174510 177663 252103 83028 014 3652 3293
025 to lt 150 253475 147274 313463 219803 062 3985 7012
150 to lt 500 58980 24422 70969 74742 264 3476 10532
500 to lt 1350 13705 7812 17920 26130 952 3212 14581
1350 to lt 100 2286 114 2492 5465 1993 3920 21927
100 (default) 3857 1799 4586 4845 10000 3918 10567
Total Wholesale (2) $ 1045059 369738 1204643 431755 100 2810 3584
(1) RWAs under Basel III Advanced Approach includes the 6 credit risk multiplier where applicable
(2) Includes commercial loans debt securities deposits with (and other funds due from) banksother institutions plus other non-loan exposures
Retail Credit Risk
Overview Management approach
The credit quality of retail exposures is indicated through loan scoring or other statistical approaches appropriate for homogenous
types of credits Modelers supporting lines of business with retail portfolios are responsible for developing valid statistically
based models for credit decisions collateral valuation and risk management All credit scoring loss forecasting valuation and
other risk management models are subject to the Wells Fargo Model Risk Management Policy See ldquoAssetLiability Managementrdquo
section in Managements Discussion and Analysis to our first quarter 2017 Form 10-Q and to our 2016 Form 10-K for discussion
on our model risk management
19
RWAs Measurement Advanced Internal Ratings Based
In accordance with Basel III the retail population for regulatory capital includes all loans in the consumer loan portfolio segment
for US GAAP including certain small business banking loans plus some accounts receivable related to other retail exposures
Retail exposures are assigned to both PD and LGD segments by retail segment Retail segmentation is determined by portfolios
which align with respective Basel categories Residential Mortgage - First Lien Residential Mortgage - Junior Lien Residential
Mortgage - Revolving Qualifying Revolving Exposures and Other Retail The retail segmentation process uses various factors
relevant to the credit risk of retail borrowers and groups those borrowers into pools for risk quantification purposes after which
the risk parameters are quantified at the pool level The model development methodology selection incorporates expert judgment
business knowledge account management collection strategy and risk management experience PD and LGD are estimated
separately for each retail segment and EAD is estimated for each retail exposure The risk parameters for each retail segment are
used as inputs to an A-IRB risk-based capital formula specified in the Final Rule As with the wholesale parameters the retail risk
parameters are estimated using proprietary internal models and independently validated by a model governance team
20
Table 6 provides the distribution of the portfolio segments in alignment with Basel segmentation and key parameter estimates by PD bands
Table 6 The Companys Credit Risk Assessment of Retail Exposures by Probability of Default (PD) Grades March 31 2017
(in millions except ratios) Exposure-weighted average
Advanced PD range (percentage)
Balance Sheet Amount
Undrawn Commitments
Exposure at Default
Approach RWAs (1) PD (2) LGD Risk Weight
Residential mortgage - first lien
000 to lt 010 $ 87232 mdash 88266 6807 010 3136 771 010 to lt 020 mdash mdash mdash mdash mdash mdash mdash 020 to lt 075 107878 9247 118423 22456 033 3129 1896 075 to lt 550 35893 353 36788 17631 132 3094 4793 550 to lt 1000 14846 mdash 15099 15694 773 2433 10395 1000 to lt 10000 11607 217 11996 13602 3861 2153 11339 100 (default) 19297 mdash 19587 14186 10000 1978 7242
Total residential mortgage first lien $ 276753 9817 290159 90376 919 2968 3115
Residential mortgage - junior lien
000 to lt 010 $ 883 mdash 907 159 007 8271 1748 010 to lt 020 mdash mdash mdash mdash mdash mdash mdash 020 to lt 075 920 mdash 946 532 034 8581 5626 075 to lt 550 1370 mdash 1421 2587 199 8915 18187 550 to lt 1000 255 mdash 267 913 741 8737 34267 1000 to lt 10000 180 mdash 186 847 3612 8463 45695 100 (default) 201 mdash 212 225 10000 7519 10600
Total residential mortgage junior lien $ 3809 mdash 3939 5263 840 8579 13360
Residential mortgage - revolving
000 to lt 010 $ 12310 55918 27902 2664 003 8348 955 010 to lt 020 21970 7785 23394 7672 017 8438 3280 020 to lt 075 2178 638 2378 2078 063 8549 8738 075 to lt 550 15641 775 16143 26770 178 8620 16582 550 to lt 1000 717 62 741 2784 720 8905 37561 1000 to lt 10000 1263 52 1305 6398 2123 8733 49050 100 (default) 1222 62 1247 1281 10000 7970 10276
Total residential mortgage revolving $ 55301 65292 73110 49647 264 8450 6791
Qualifying revolving (3)
000 to lt 050 $ 9690 94221 34792 3344 018 9438 961 050 to lt 200 10424 12964 15265 7825 125 9474 5126 200 to lt 350 6292 2624 8807 7915 297 9235 8987 350 to lt 500 2783 1882 3144 3179 381 9440 10112 500 to lt 800 3041 366 3445 4623 559 9475 13425 800 to lt10000 6003 1004 6654 14068 2358 9437 21143 100 (default) 7 2 8 9 10000 9384 10600
Total qualifying revolving $ 38240 113063 72115 40963 334 9423 5680
Other retail
000 to lt 050 $ 37689 32162 53722 14314 015 7731 2664 050 to lt 200 45272 4507 49176 34663 106 6680 7049 200 to lt 350 9367 1011 10418 10551 280 7166 10127 350 to lt 500 7602 58 7809 7786 425 6547 9972 500 to lt 800 4011 174 4222 4586 656 7118 10860 800 to lt10000 7372 63 7669 10201 2060 6664 13300 100 (default) 485 26 498 480 10000 4977 9637
Total other retail $ 111798 38001 133514 82581 273 7139 6185
Total Retail Exposures $ 485901 226173 572837 268830 611 5484 4693
(1) RWAs under Basel III Advanced Approach includes the 6 credit risk multiplier where applicable
(2) Exposure-weighted average PD may fall outside of the PD range due to precision
(3) Qualifying revolving exposures are unsecured revolving exposures where the undrawn portion of the exposure is unconditionally cancellable by the bank
21
Counterparty Credit Risk
Overview Management Approach
Counterparty Credit Risk (CCR) is the possibility that a customer or trading counterparty will fail to fulfill contractual
obligations and such failure may result in the termination or replacement of the transaction at a loss to Wells Fargo Such
exposures arise primarily in relation to over-the-counter (OTC) derivatives repo-style transactions margin loans transactions
cleared through a central counterparty or exchange and unsettled trades The majority of CCR exposure is incurred in transactions
designed to help our clients manage their interest rate currency and other risks and in the associated hedging of those
transactions
Wells Fargo uses a range of models and methodologies to estimate the potential size of counterparty exposures and establishes
limits and controls around activities incurring these risks Counterparty exposure is typically mitigated using collateral Collateral
arrangements supporting Wells Fargorsquos counterparty credit risk exposures can be grouped into two broad categories
bull Many of Wells Fargorsquos counterparty risks arise out of its derivatives activities undertaken with corporate clients In many
cases the counterparty credit risk is managed by relationshipcredit officers close to the client and is cross-collateralized
with securities supporting loan and other exposures to the same counterparty (eg receivables and inventory) Any
benefit deemed to accrue from this type of cross-collateralization is reflected in the credit grades applied to the exposure
which in turn impacts the regulatory capital required
bull Exposures for many counterparty relationships are covered by stand-alone collateral arrangements which require the
posting of liquid financial collateral Collateral arrangements are managed by a dedicated collateral management
function which handles the posting and receipt of collateral per the Collateral Support Annex (CSA) The CSA is
supporting documentation for a collateral arrangement between counterparties The majority of the absolute value of
collateral received and posted typically comprises cash with the remainder primarily in the form of instruments issued or
backed by the US Government or Government Sponsored Entities (GSEs) (eg treasuries agencies or agency
mortgage-backed securities) For disclosure of the impact on the amount of collateral we would be required to post in the
event of a significant deterioration in our credit see Note 12 (Derivatives) to Financial Statements in our first quarter
2017 Form 10-Q
The Final Rule provides a specific definition of derivative exposures which differs from the US GAAP definition Some of the
key differences include
bull Certain forward-settling transactions are considered derivatives under the Final Rule but not under US GAAP due to
the timing of settlement
bull Derivative transactions where we act as an agent between a qualifying clearing agent and a client are considered
derivatives under the Final Rule but not recognized as assets or liabilities under US GAAP and
22
bull Certain embedded derivatives subject to bifurcation are considered derivatives under US GAAP but not under the Final
Rule
Wells Fargo establishes counterparty credit risk exposure limits in a decentralized manner that relies on the expertise of those
closest to the customer and is guided by policies and procedures established at the enterprise-level as well as within the individual
lines of business Aggregate counterparty risk is managed on a centralized basis to ensure consistent application of standards and
risk appetite Internal ratings are the starting point in establishing credit assessments and are based on multiple factors including
the counterpartys financial condition liquidity quality of management and the counterpartys financial performance Risk limits
are set based on the credit assessment customer need and risk mitigation embedded in a qualifying master netting agreement
which can cover items such as daily margining termination events credit support and cross collateralization At the enterprise-
level risk limit exceptions are identified and delivered to each risk officer responsible for the specific counterparty limit Risk
officers are responsible for addressing each one of these exceptions Counterparty Credit Risk Management (CCRM) maintains a
record of all responses with unapproved exceptions reported and discussed with senior management on a monthly basis
RWAs Measurement
Wells Fargo uses the Current Exposure Method (CEM) to calculate EAD which is used in the calculation of RWAs using the
wholesale credit risk exposure model Mitigants are recognized using the Collateral Haircut approach with prescribed regulatory
haircuts Under the CEM approach EAD is the sum of current credit exposure (CCE) and the potential future exposure (PFE)
The CCE is the sum of net positive fair values and the PFE is an estimate of the maximum amount of the exposure that could
occur over a one year horizon The PFE is based on the derivative notional amount and a credit conversion factor (CCF) and is a
component of EAD irrespective of the fair value of the derivative contract The CCF is based on the underlying contract type and
remaining maturity PFE is also adjusted for those contracts subject to a master netting agreement as prescribed by the Final Rule
The netting benefits of master netting agreements (eg International Swaps and Derivatives Association) and collateral
arrangements (eg Credit Support Annex) are reflected in the EAD For descriptions of counterparty credit risk see Note 12
(Derivatives) to Financial Statements in our first quarter 2017 Form 10-Q
Table 7 shows derivative metrics by underlying exposure type and segregates our derivative activity between contracts traded in
OTC markets from those cleared through a central counterparty or exchange OTC derivatives are those traded between two
parties directly without the use of an exchange and result in counterparty credit exposure to the OTC counterparty Derivatives
cleared through a central counterparty or an exchange limit counterparty risk because the central clearing party or exchange serves
as the counterparty to both parties to the derivative
23
Table 7 Counterparty Credit Risk Derivatives Exposure Types March 31 2017
(in millions) Notional (1) Gross Positive Fair Value
Adjusted PFE
Pre-mitigant EAD
Netting amp Collateral Benefit
Post Mitigant Exposure at Default
Advanced Approach RWAs (2)
OTC derivatives Interest rate contracts $ 2854525 32742 11380 44122 30185 13937 9426
Foreign exchange contracts 355563 7425 4775 12200 6098 6102 3553
Equity contracts 133359 5008 4728 9736 6577 3159 2133
Credit derivatives contracts 26818 667 1474 2141 1070 1071 830
Commodities and Other 79629 3670 4443 8113 2973 5140 3315
Total OTC derivative contracts (principal+agent)
$ 3449894 49512 26800 76312 46903 29409 19257
Central counterparty (CCP) amp Exchange traded derivatives
Interest rate contracts $ 6473013 44357 13765 58122 38708 19414 412
Foreign exchange contracts mdash mdash mdash mdash mdash mdash mdash
Equity contracts 40866 1837 1499 3336 1146 2190 46
Credit derivatives contracts 5366 119 711 830 mdash 830 28
Commodities and Other 30555 838 1601 2439 (2235) 4674 101
Total CCP amp Exchange traded derivatives contracts
$ 6549800 47151 17576 64727 37619 27108 587
(1) Excluding sold derivatives and written options
(2) RWAs under Basel III Advanced Approach includes the 6 credit risk multiplier where applicable
The table above distinguishes between OTC and centrally cleared or exchange traded derivatives and includes
bull Notional which is used in the calculation of the PFE add-on
bull Gross Positive Fair Value which is the sum of all derivative transactions with a positive fair value before the mitigating
effects of counterparty netting and collateral
bull Adjusted PFE which is the PFE adjusted for those contracts subject to a master netting agreement as prescribed by the
Final Rule
bull Pre-mitigant EAD which is the sum of the Gross Positive Fair Value and the Adjusted PFE
bull Netting amp Collateral Benefit which is the EAD reduction realized by fair value netting and the application of collateral
when valid netting agreements are in place
bull Post Mitigant EAD which is the EAD after fair value netting and application of eligible collateral This is the total EAD
amount used for RWAs calculation and
bull Advanced Approach RWAs which is calculated under the Basel III Advanced Approach with transition requirements
24
Table 8 displays a breakout of collateral by type which has been received by the Company as part of derivatives repo-style
transactions and margin loans
Table 8 Counterparty Collateral Types March 31 2017
(in millions) Derivatives Collateral
Repo amp Margin Loan Collateral
Cash $ 22007 93443
Treasuries 6207 46915
Agencies 1227 15498
Corporate Bonds 88 3625
Main Index Equities 3277 13455
Other Public Equities 1623 45346
Mutual Funds 4 10580
Other 39 3389
Total Collateral $ 34472 232251
Table 9 presents a distribution of EAD RWAs and weighted average measures by PD band for counterparty credit risk exposures
Table 9 Counterparty Credit Risk Exposure Type March 31 2017
(in millions except ratios) Exposure-weighted average
PD Range (percentage) Exposure at Default
Advanced Approach RWAs (1) PD LGD Risk weight
OTC Derivatives amp Repos 000 to lt 005 $ 3315 460 003 4566 1387
005 to lt 025 36315 14400 012 4487 3965
025 to lt 150 21910 17791 074 4357 8120
150 to lt 500 1199 1553 282 4069 12953
500 to lt 1350 240 419 971 3832 17440
1350 to lt 100 mdash mdash mdash mdash mdash
100 (default) 62 66 10000 6133 10600
Default Fund Contribution 1164 1701 mdash mdash 14621
Margin Loans 1594 1803 mdash mdash 11316
Cleared Transactions (2) 28606 619 mdash mdash 216
Unsettled Trades 250 293 mdash mdash 11690
Total Counterparty Credit Risk Exposure $ 94655 39105 054 4434 4131
(1) RWAs under Basel III Advanced Approach includes the 6 credit risk multiplier where applicable
(2) Includes cleared derivative and cleared repo transactions
CVA Capital Charge
A credit valuation adjustment (CVA) is a required fair value adjustment under US GAAP which is included in earnings and
capital to reflect counterparty credit risk in the valuation of an OTC derivative contract In order to improve a bankrsquos ability to
withstand losses due to CVA volatility an incremental CVA capital charge was introduced in the Final Rule The CVA capital
charge is a bank holding company level bi-lateral derivative portfolio measure and is based on counterparty credit quality
remaining trade duration and EAD The RWAs arising due to the CVA capital charge were $204 billion at March 31 2017
25
Securitization Credit Risk
Overview Management Approach
Securitization exposures are those which arise from traditional securitization synthetic securitization or re-securitization
transactions where credit risk from underlying assets has been transferred to third parties and separated into at least two tranches
reflecting different levels of seniority whereby the performance of the issued exposures is dependent on the performance of the
underlying assets and substantially all of the underlying assets are considered financial assets A re-securitization is a
securitization which has more than one underlying exposure and in which one or more of the underlying exposures is a
securitization exposure In addition the Final Rule distinguishes between traditional and synthetic securitizations In a traditional
securitization assets which are typically loans or debt securities are transferred from an originator or sponsor to a special
purpose entity (SPE) which receives funds to purchase the assets by issuing debt and equity securities to investors Synthetic
securitization achieves the transfer of credit risk to the investor through the use of credit derivatives or guarantees
Conforming residential mortgage loan securitizations are those guaranteed by the GSEs including the Government National
Mortgage Association (GNMA) Due to the additional credit protection provided by the government guarantee these positions
usually do not include credit tranching Since the presence of tranches is the key determinant of whether a given exposure would
be subject to the securitization capital rules such exposures do not meet the definition of a securitization per the Final Rule As a
result our investments in conforming residential mortgage loan securitizations have been excluded from our disclosure of
securitization exposure and activity in this report
On-balance sheet securitization exposures include a portion of the assets classified on our balance sheet as loans for US GAAP
purposes securities and non-GSE securitization servicer cash advances Off-balance sheet securitization exposures include
commitments guarantees and derivatives to SPEs
Wells Fargos objectives in relation to securitization activity are as follows
bull Provide proactive and prudent management of our balance sheet and multiple diverse sources of funding
bull Earn fee income by providing credit facilities to clients via securitization related activities
bull Earn fee income from structuring securitizations for internally and third-party originated assets and
bull Earn fee income as servicer andor trustee for asset securitizations
In connection with our securitization activities the Company also has various forms of ongoing involvement with SPEs
which may include
bull Making markets in ABS
bull Providing OTC derivatives to Securitization SPEs that require securitization treatment and
bull Providing credit enhancement on securities issued by SPEs or market value guarantees of assets held by SPEs through
the use of letters of credit financial guarantees (on a limited basis) credit default swaps and total return swaps or
entering into other derivative contracts with SPEs
26
Wells Fargorsquos roles in the securitization process are multi-faceted and generally include certain or all the following
bull Originator where the bank through the extension or credit or otherwise creates a financial asset that
collateralizes an asset-backed security and sells that asset directly or indirectly to a sponsor The originator may
be a sole originator or affiliated with the sponsor (including for legacy positions)
bull Sponsor where the bank organizes and initiates an asset-backed securities transaction by selling or transferring
assets either directly or through an affiliate to the issuing entity This includes approving positions and where
applicable managing a securitization program that retains residual tranches (providing excess spread or over
collateralization) with sponsors having first loss exposure
bull Investor where the bank assumes the credit risk of a securitization exposure (other than through acting as
originator or sponsor)
bull Trustee where the bank considers the interests of investors who own the securities issued via the securitization
and which retains primary responsibility for administering the SPE or trust that maintains the securitized assets
and
bull Servicer where the bank engages in direct interaction with borrowers by collecting payments providing
customer service administrating escrow accounts and managing the delinquency process (including loan
modifications short sales and foreclosures)
Our due diligence process provides us with an understanding of the features that would materially affect the performance
of a securitization or re-securitization Based on the requirements of the Final Rule for all securitization and re-
securitization positions Wells Fargo conducts initial due diligence prior to acquiring the position and documents the due
diligence within three business days after the acquisition We also evaluate review and update our ongoing
understanding of each securitization position at least quarterly as appropriate The level of detail is commensurate with
the complexity of the position and materiality of the position in relation to capital The Companys accounting policies
with respect to securitization and securitization vehicles are established in accordance with US GAAP For additional
information refer to Note 1 (Summary of Significant Accounting Policies) in our first quarter 2017 Form 10-Q and in
our 2016 Form 10-K and Note 7 (Securitizations and Variable Interest Entities) in our first quarter 2017 Form 10-Q
As part of the initial and ongoing due diligence process we review the following items in accordance with the Final
Rule
bull Structural features of the securitization that would materially impact the performance of the position
bull Relevant information regarding the performance of the underlying credit exposure(s)
bull Relevant market data on the securitization and
bull For any re-securitization position performance information on the underlying securitization exposures
27
When applicable individual business lines must review the accuracy of any assigned internal risk ratings within their
portfolios on a quarterly basis Minimum credit exposure thresholds for this certification may be established by the
businesses with approval from the Corporate Credit group Initial reviews may include collateral quality credit
subordination levels and structural characteristics of the securitization transaction Ongoing regular performance reviews
may include checks of periodic servicer reports against any performance triggerscovenants in the loan documentation as
well as overall performance trends in the context of economic sector and servicer developments
The Company manages the risks associated with securitization and re-securitization positions through the use of offsetting
positions and portfolio diversification The monitoring of re-securitization positions takes into consideration the performance of
the securitized tranches underlying assets to the extent available as it relates to the re-securitized position
RWAs Measurement
Based on regulatory guidance Wells Fargo uses a combination of the Supervisory Formula Approach (SFA) and the Simplified
Supervisory Formula Approach (SSFA) in assessing its regulatory capital requirements for securitization exposures SSFA is used
for the majority of the exposures except for those exposures where the data available permits the application of SFA SSFA
requires the use of inputs and assumptions which consider the credit quality of the underlying assets the point in the SPErsquos
capitalization at which our exposure begins to absorb losses and likewise the point in the SPErsquos capitalization that would result
in a total loss of principal The SFA requires a calculation of the capital requirement of the underlying exposures as if they were
held by us directly as well as the degree of credit enhancement provided by the structure Use of the SFA approach requires
approval by our regulators
Table 10 presents the aggregate EAD amount of the Companyrsquos outstanding on-balance sheet and off-balance sheet
securitizations positions and RWAs by exposure type
Table 10 Aggregate Amount of On- and Off- Balance Sheet Securitization Exposures March 31 2017
(in millions) On-Balance Sheet
EAD Off-Balance Sheet EAD
Total Exposure at Default
Advanced Approach RWAs (1)
Commercial mortgages
Residential mortgages
Corporate
Auto loans leases
Student loans
Other
Total Securitization Exposures
$ 15020
12030
48799
12513
9497
8958
$ 106817
4665
1960
7674
4087
495
6956
25837
19685
13990
56473
16600
9992
15914
132654
9661
21581
13123
4325
2163
18932
69785
(1) RWAs under Basel III Advanced Approach includes the 6 credit risk multiplier where applicable
28
Table 11 presents the aggregate EAD amount of securitization exposures retained or purchased and their associated risk
approaches and RWAs categorized between securitization and re-securitization exposures
Table 11 Aggregate Amount of Securitized and Resecuritized Exposures by Risk Weights and Approach March 31 2017
(in millions)
Securitizations
Risk Weight
0 to lt50 50 to lt100 100 to lt1250 Equal to 1250
Total Securitizations
Re-securitizations (2) Risk Weight
0 to lt50 50 to lt100 100 to lt1250 Equal to 1250
Total Resecuritizations
Total Securitizations and Resecuritizations
SFA SSFA
Exposure at Default
Advanced Approach RWAs (1)
Exposure at Default
Advanced Approach RWAs (1)
$ 52726 11232 67564 14707 98 14305 2186 1708
112 385 7704 25829
mdash 7 63 829
$ 52936 25929 77517 43073
$ 144 31 1979 441
mdash mdash 41 37 mdash mdash 19 36 mdash mdash mdash mdash
$ 144 31 2039 514
$ 53080 25960 79556 43587
1250 Risk Weight
Exposure at Default
Advanced Approach RWAs (1)
mdash mdash mdash mdash mdash mdash 18 238
18 238
mdash mdash mdash mdash mdash mdash mdash mdash
mdash mdash
18 238
Total
Exposure at Default
Advanced Approach RWAs (1)
120290 25939 2284 16013 7816 26214
81 1074
130471 69240
2123 472 41 37 19 36 mdash mdash
2183 545
132654 69785
(1) RWAs under Basel III Advanced Approach includes the 6 credit risk multiplier where applicable
(2) The bank is not applying credit risk mitigation to any resecuritization exposures
The bank holds the RWAs buffer of $142 billion to account for the uncertainty to execute the SFA for certain portfolios under the Advanced Approach
Securitization Activity
For information on our 2016 activity and realized gains or loss on sales of financial assets in securitizations see Note 7
(Securitizations and Variable Interest Entities) to Financial Statements in our first quarter 2017 Form 10-Q Gains on sale from
securitization of $42 million were deducted from tier 1 capital in accordance with transition requirements as of March 31 2017
This deduction is required for a portion of the gain generated through the sale of assets resulting from securitization transactions
In addition to the assets already securitized we currently have $503 million of commercial mortgage loans we expect to securitize
that are currently risk-weighted as wholesale exposures Exposures we expect to securitize include those loans currently classified
on our balance sheet as either mortgages held for sale or loans held for sale and are saleable in an active securitization market
We periodically securitize consumer and CRE loans For a discussion on this topic refer to loans sales and securitization activity
in Note 7 (Securitizations and Variable Interest Entities) to Financial Statements in our first quarter 2017 Form 10-Q
29
Table 12 provides information on the principal amount of past due or impaired assets and losses recognized on our balance sheet
related to interests held in securitization transactions we transferred assets to andor sponsored
Table 12 Impaired Past-Due Assets and Current Quarter Recognized Losses on Securitized Assets by Exposure Types March 31 2017
Total Impaired or Past Due Amount Total Current
(in millions) on Securitized Assets (1) Period Losses (2)
Commercial mortgages $ 5 5
Residential mortgages 420 3
Commercial loans and debt obligations mdash mdash
Other loans mdash mdash
Total Securitized Assets $ 425 8
(1) The total impaired amount on securitized assets represents the carrying value of investment securities held by us that were issued from securitization
transactions we sponsored and for which we have recognized other-than-temporary impairment (OTTI) for accounting purposes This column also includes the total past due amount on securitized assets which represents loans recorded on our balance sheet that are 90 days or more past due or in nonaccrual status that are held in securitization transactions we sponsored
(2) Total Current Period Losses represents year-to-date other-than-temporary impairment recognized on investment securities and charge-offs and allowances recognized on loans held on our balance sheet related to securitization transactions we sponsored
Equity Investment Credit Risk
Overview Management Approach
Certain equity exposures are excluded from market risk regulatory capital treatment (non-covered equity investments) but are
subject to credit risk capital rules Non-covered equity investments include exposures classified in other short-term investments
trading assets available-for-sale investment securities or other assets in our financial statements Trading assets are measured at
fair value through net income Available-for-sale investment securities are measured at fair value through other comprehensive
income Nonmarketable equity securities are measured at fair value through earnings amortized cost less impairment or
accounted for under the equity method of accounting Investments subject to equity method of accounting are adjusted for our
proportionate share of the investeesrsquo earnings and other changes in shareholdersrsquo equity less impairment All equity investments
other than those reported at fair value through earnings are assessed at least quarterly for other-than-temporary impairment
(OTTI) For information on accounting policies related to equity investments refer to Note 1 (Summary of Significant
Accounting Policies) to Financial Statements in our first quarter 2017 Form 10-Q and our 2016 Form 10-K For information on
net gains arising from equity investments refer to ldquoConsolidated Statement of Incomerdquo in our first quarter 2017 Form 10-Q
Equity investments made with a strategic objective or to maintain strategic relationships include investments in support of the
Community Development Reinvestment Act statutory andor financing investments required for membership in the Federal
Reserve or Federal Home Loan Bank and separate account bank-owned life insurance (BOLI) invested in various asset strategies
Non-covered equity investments are also held to generate capital gains and include discretionary private equity and venture
capital transactions Under the Final Rule equity exposures also include investment funds (including separate accounts) and
investments made in connection with certain employee deferred compensation plans
30
Equity investment activities are conducted in accordance with corporate policy and regulatory requirements Discretionary equity
investments are reviewed at both the individual investment and portfolio level Individual lines of business are responsible for
conducting a periodic review of all individual investments which may include recent financial performance exit strategy current
outlook and expected returns We monitor nonmarketable equity investments through portfolio reviews which include
monitoring portfolio objectives current assessments of portfolio performance and internal ratings historical returns risk profiles
current strategies and unfunded commitments Corporate Risk provides independent oversight over equity investments
Investments in separate account BOLI portfolios which are classified as equity exposures make up a significant percentage of
our equity investments portfolio and are monitored centrally within Corporate Treasury and reported on a monthly basis to senior
management and annually to the Board The investments in separate accounts are exclusive of balances attributable to stable value
protection which are considered wholesale credit exposures to the underlying insurance company Separate account exposures are
assigned risk weights using a look-through approach whereas general account exposures are considered general obligations of
the issuing insurance company and are risk-weighted as wholesale exposures to the issuing insurance company General and
separate account BOLI exposures are reported as an aggregate amount in our 2016 Form 10-K Only our separate account BOLI
exposure is separately disclosed in this report in Table 13
RWAs Measurement
For equity exposures the Company applies the Full Look-Through Approach (FLTA) the Simple Risk-Weight Approach (SRWA)
or the Alternative Modified Look-Through Approach (AMLTA) to determine RWAs Under the FLTA risk weights are applied on
a proportional ownership share basis to each equity exposure held by an investment fund as if Wells Fargo held the exposure
directly Under the SRWA the RWAs for each equity exposure are calculated by multiplying the adjusted carrying value of the
equity exposure by the applicable regulatory prescribed risk weight Under the AMLTA the adjusted carrying value of the equity
exposure in an investment fund is assigned on a pro rata basis to different risk weight categories based on investment limits in the
fundrsquos prospectus or other legal document Wells Fargorsquos non-significant equity exposure is the sum of publicly and non-publicly
traded equity investments that are 10 or less of total capital and is risk-weighted at 100
31
Table 13 details the carrying value and estimated fair value of the Companyrsquos equity exposures in the banking book in addition to
those in the trading non-covered portfolio as of March 31 2017
Table 13 Equity Exposures March 31 2017
(in millions) Carrying Value Fair Value Unrealized
gain(loss) (1)(2)
Nonmarketable equity investments Cost method
Private equity investments
Federal bank stock
$ 1484
6185 2053 6185
569 mdash
Total cost method 7669 8238 569 Equity method
Low income housing tax credit investments 9624 9624 mdash Private equity and other 5910 8790 2880
Total equity method 15534 18414 2880 Fair value method 3780 3780 mdash
Total nonmarketable equity investments (3) 26983 30432 3449
Marketable equity investments Total marketable equity investments in AFS (4) 643 643 435 Other marketable equities (5) 4690 4690 mdash
Total marketable equity investments 5333 5333 435
Separate Account BOLI (6) 13207 13207 mdash
Total Equities $ 45523 48972 3884
(1) Excludes unrealized gainloss recorded in earnings Includes $435 million of net unrealized gains in AOCI and $34 billion of net unrealized gains related to
cost and equity method investments measured at amortized cost The amount of unrealized gain (net of tax) recorded in AOCI for the amounts presented in the table above that are included in tier 1 and tier 2 capital is $191 million and $22 million respectively These amounts do not include unrealized gains included in tier 1 and tier 2 capital of $11 million and $1 million respectively for preferred equity securities that are reported in Wholesale Credit Risk
(2) AFS securities are recorded on our balance sheet at fair value with unrealized gainloss recorded in AOCI The amortized cost basis for total marketable equity investments in AFS is $208 million
(3) Nonmarketable equities consist of non-publicly traded investments including equity investments that are measured at fair value (4) Marketable equities are publicly-traded Equity exposures that are considered securitization and wholesale under the Final Rule are not included in Table 13 (5) Primarily includes trading non-covered portfolio positions Also excludes certain equity derivatives designated in a hedge pair treatment (6) Total carrying value for BOLI is $194 billion The carrying value of certain separate account BOLI components which are classified as equity exposures
under the Final Rule is $132 billion The remaining carrying value of separate account BOLI along with the carrying value of general account BOLI which are considered obligations of the issuer and are classified as wholesale exposures under the Final Rule is $61 billion
Table 14 includes the RWAs for equity exposures as of March 31 2017
Table 14 Capital Requirements by Risk Weight for Equity Exposures March 31 2017
Advanced
(in millions) Carrying Value
Exposure at Default
Approach RWAs (1)
Simple Risk-Weight Approach (SRWA)
Federal Reserve stock and Sovereign exposures $ 3317 3317 mdash
Federal Home Loan Bank exposures 2910 2910 617
Community development equity exposures 10248 10429 11054
Effective portion of hedge pairs (2) 3776 4320 4579
Non-significant equity exposures (3) 8558 10192 10804
Significant investments in unconsolidated financial institutions 1372 1986 2105
600 risk-weight equity exposures 37 44 279
Equity Exposures to Investment Funds
Full look-through approach 14003 14267 4891
Alternative modified look-through approach 1302 1302 2070
Total Equity Exposures $ 45523 48767 36399
(1) RWAs under Basel III Advanced Approach includes the 6 credit risk multiplier where applicable (2) Carrying value column includes lower adjusted carrying value portion of the hedge pair of $37 billion with zero included in EAD and RWA as only the largest
exposure in a hedge pair is subject to RWA
(3) Publicly and non-publicly traded equity investments do not exceed 10 of the Companys total capital
32
Operational Risk
Operational risk is defined as the risk of loss resulting from inadequate or failed internal controls and processes people and
systems or resulting from external events These losses may result from events such as fraud breaches of customer privacy
business disruptions vendors that do not adequately or appropriately perform their responsibilities and regulatory fines and
penalties At March 31 2017 our operational risk RWA was $2982 billion
Operational Risk Capital Measurement
As one of the largest bank holding companies in the United States we are required to develop a quantification system using the
Advanced Measurement Approach (AMA) to estimate the regulatory capital charge for the Companyrsquos operational risk exposures
To satisfy this requirement the AMA model estimates aggregate operational risk exposure at a 999 confidence level over a one-
year time horizon
Per the regulatory guidance we incorporate the following data elements into our AMA model
bull Internal Loss Data (ILD) - an objective quantitative historical view of our loss experience that provides the foundation
for capital modeling efforts We record and maintain operational loss event data an essential element in our ability to
measure and manage operational risk and to comply with the requirements of the AMA Operational loss events are
recorded in an internal database with those $10000 or greater appropriately enriched and reviewed and are captured
across all business lines product types and geographic locations
bull External Loss Data (ELD) - an objective quantitative historical view of the loss experiences of other financial
institutions that supports capital modeling efforts by supplementing ILD Event-level ELD is obtained through our
membership in the Operational Riskdata eXchange Association (ORX) an industry consortium containing information
on operational risk loss events of euro20000 or more
bull Scenario Analysis Estimates (SAE) - we conduct an annual scenario analysis process designed to identify key scenarios
and derive estimates of plausible future operational loss events The scenario analysis process and the resulting estimates
are informed by internal and external loss data to provide useful insight into potential future losses especially those that
have not yet been observed
bull Business Environment and Internal Control Factors (BEICF) - an estimate of potential operational risk loss exposures
based on managementrsquos forward-looking assessment of the state of internal controls and the current business
environment BEICF data is obtained from a variety of sources including but not limited to the Risk and Control Self-
Assessment (RCSA) process risk appetite measures and operational risk profile reports The RCSA is a process
executed across the Company designed to capture managementrsquos assessment of the operational risks and controls in its
business The assessment considers the products and activities the existing and emerging risks the design and
effectiveness of controls and any changes in the business environment
33
The AMA model is based on a Loss Distribution Approach (LDA) that estimates the frequency and severity of operational losses
that could occur to determine quarterly the level of operational risk capital required to meet management and regulatory
expectations
Under the LDA
bull Our internal losses (and relevant external losses) are segmented into units of measure (UOMs) or partitions defined by
business line and seven event types prescribed by international regulatory guidance
bull For each partition the LDA combines two distributions one for the loss frequency (based on our historical loss
experience) and the other for the severity of events (based on our historical loss experience as well as relevant external
loss data)
bull The frequency and severity distributions are combined into the aggregate loss distribution for each partition and
bull The enterprise-level operational risk exposure is estimated by aggregating the partition-level loss distributions taking
into account correlation across business lines and event types
The scenario analysis estimates and BEICF information are then evaluated and considered in conjunction with the statistical
model results and adjustments are made as appropriate to reflect the Companyrsquos operational risk profile
Use of Insurance
While Wells Fargo purchases insurance to provide financial protection against specific losses these policies are not currently
incorporated into the AMA capital model to provide any offset to the capital levels calculated
For additional information on operational risk refer to the ldquoOperational Risk Managementrdquo section in Managements Discussion
and Analysis to our first quarter 2017 Form 10-Q and the ldquoRisk Managementrdquo section in Managements Discussion and Analysis
to our 2016 Form 10-K
Market Risk
Market risk is the risk of possible economic loss from adverse changes in market factors such as interest rates credit spreads
foreign exchange rates equity commodity prices mortgage rates and market liquidity At March 31 2017 our market risk RWA
was $428 billion calculated under the Advanced Approach
For a discussion of the Companyrsquos market risk oversight monitoring and controls please refer to the ldquoMarket Risk - Trading
Activitiesrdquo section in the Managements Discussion and Analysis to our first quarter 2017 Form 10-Q and to our 2016 Form 10-K
For a discussion of risk oversight refer to the ldquoRisk Frameworkrdquo ldquoBoard Oversight of Riskrdquo and ldquoManagement Oversight of
Riskrdquo sections in Managements Discussion and Analysis to our 2016 Form 10-K
34
Supplementary Leverage Ratio
In April 2014 federal banking regulators finalized a rule that enhances the supplementary leverage ratio (SLR) requirements for
BHCs like Wells Fargo and their insured depository institutions The SLR consists of tier 1 capital divided by the Companyrsquos
total leverage exposure Total leverage exposure consists of total average on-balance sheet assets plus off-balance sheet
exposures such as undrawn commitments and derivative exposures less amounts permitted to be deducted from tier 1 capital
The SLR rule which becomes effective on January 1 2018 will require a covered BHC to maintain a SLR of at least 50 to
avoid restrictions on capital distributions and discretionary bonus payments The SLR rule will also require that all of our insured
depository institutions maintain a SLR of 60 under applicable regulatory capital adequacy guidelines In September 2014
federal banking regulators finalized additional changes to the SLR requirements to implement revisions to the Basel III leverage
framework finalized by the BCBS in January 2014 These additional changes among other things modify the methodology for
including off-balance sheet items including credit derivatives repo-style transactions and lines of credit in the denominator of
the SLR and will become effective on January 1 2018 For additional details on the SLR refer to the ldquoCapital Managementrdquo
section in Managements Discussion and Analysis to our first quarter 2017 Form 10-Q
The following table sets forth our Supplementary Leverage Ratio and related components for the quarter ended March 31 2017
Table 15a Supplementary Leverage Ratio (Transition Requirements) March 31 2017
(in millions except ratio)
Tier 1 capital $ 172543
Total average assets 1931041
Less amounts deducted from Tier 1 capital 29668
Total adjusted average assets 1901373
Adjustment for derivative exposures 68025
Adjustment for repo-style transactions 3092
Adjustment for other off-balance sheet exposures 248810
Total adjustments 319927
Total leverage exposure 2221300
Supplementary leverage ratio 777
35
The table below presents the components of the total leverage exposure for derivatives repo-style transaction and other off-
balance sheet exposures The other off-balance sheet exposures consist of wholesale and retail commitments after the application
of credit conversion factors
Table 15b Components of Total Leverage Exposure (Transition Requirements) March 31 2017
(in millions)
On-balance sheet exposures
Total average assets as reported
Less amounts deducted from Tier 1 capital
Total on-balance sheet exposures
Derivative exposures
Replacement cost for derivative exposures (that is net of cash variation margin)
$ 1931041
29668
1901373
14281
Add-on amounts for potential future exposure (PFE) for derivative exposures 49325
Gross-up for cash collateral posted if deducted from the on-balance sheet assets except for cash variation margin 3692
LESS Deductions of receivable assets for cash variation margin posted in derivative transactions if included in on-balance sheet assets LESS Exempted CCP leg of client-cleared transactions
mdash
mdash
Effective notional principal amount of sold credit protection 33072
LESS Effective notional principal amount offsets and PFE adjustments for sold credit protection
LESS on-balance sheet assets for derivative exposures
19168
13177
Total off-balance sheet derivative exposures
Repo-style transactions
On-balance sheet assets for repo-style transactions except include the gross value of receivables for reverse repurchase transactions LESS Reduction of the gross value of receivables in reverse repurchase transactions by cash payables in repurchase transactions under netting agreements
Counterparty credit risk for all repo-style transactions
68025
77141
15059
3001
LESS on-balance sheet assets for repo-style transactions
Total off-balance sheet exposures for repo-style transactions
Other off-balance sheet exposures
61991
3092
Off-balance sheet exposures at gross notional amounts 621200
LESS Adjustments for conversion to credit equivalent amounts
Total Other off-balance sheet exposures
372390
248810
Total leverage exposure $ 2221300
36
Glossary of AcronymsAcronym Description
ABS Asset-Backed Securities AMA Advanced Measurement Approach A-IRB Advanced Internal Ratings Based ALCO AssetLiability Management Committee AMLTA Alternative Modified-Look Through Approach AOCI Accumulated Other Comprehensive Income BCBS Basel Committee on Banking Supervision BEICF Business Environment and Internal Control Factors BHCs Bank Holding Companies Board Wells Fargo Board of Directors BOLI Bank-Owned Life Insurance CCAR Comprehensive Capital Analysis and Review CCE Current Credit Exposure CCF Credit Conversion Factor CCP Central Counterparty CCR Counterparty Credit Risk CEM Current Exposure Method CET1 Common Equity Tier 1 CMC Capital Management Committee CRC Capital Reporting Committee CRE Commercial Real Estate CVA Credit Valuation Adjustment DTA Deferred Tax Assets EAD Exposure at Default ELD External Loss Data FDIC Federal Deposit Insurance Corporation Final Rule Basel III Final Rule for US Bank Holding Companies and Banks FLTA Full Look-Through Approach FRB Board of Governors of the Federal Reserve System FSB Financial Stability Board G-SIB Global Systemically Important Banks GAAP Generally Accepted Accounting Principles GNMA Government National Mortgage Association GSE Government Sponsored Entity HVCRE High Volatility Commercial Real Estate ICAAP Internal Capital Adequacy Assessment Process ILD Internal Loss Data IPRE Income-Producing Real Estate LDA Loss Distribution Approach LGD Loss Given Default MSR Mortgage Servicing Rights OCC Office of the Comptroller of the Currency ORX Operational Riskdata eXchange Association OTC Over-the-counter OTTI Other-Than-Temporary Impairment PD Probability of Default PFE Potential Future Exposure RRROC Regulatory and Risk Reporting Oversight Committee RCSA Risk and Control Self-Assessment RWAs Risk-Weighted Assets SAE Scenario Analysis Estimates SLR Supplementary Leverage Ratio SPE Special Purpose Entity SRWA Simple Risk-Weight Approach SFA Supervisory Formula Approach SSFA Simplified Supervisory Formula Approach UOM Unit of Measure
37
Forward-Looking Statements
This document contains ldquoforward-looking statementsrdquo within the meaning of the Private Securities Litigation Reform Act of
1995 In addition we may make forward-looking statements in our other documents filed or furnished with the SEC and our
management may make forward-looking statements orally to analysts investors representatives of the media and others
Forward-looking statements can be identified by words such as ldquoanticipatesrdquo ldquointendsrdquo ldquoplansrdquo ldquoseeksrdquo ldquobelievesrdquo ldquoestimatesrdquo
ldquoexpectsrdquo ldquotargetrdquo ldquoprojectsrdquo ldquooutlookrdquo ldquoforecastrdquo ldquowillrdquo ldquomayrdquo ldquocouldrdquo ldquoshouldrdquo ldquocanrdquo and similar references to future
periods In particular forward-looking statements include but are not limited to statements we make about (i) the future
operating or financial performance of the Company including our outlook for future growth (ii) our noninterest expense and
efficiency ratio (iii) future credit quality and performance including our expectations regarding future loan losses and allowance
levels (iv) the appropriateness of the allowance for credit losses (v) our expectations regarding net interest income and net
interest margin (vi) loan growth or the reduction or mitigation of risk in our loan portfolios (vii) future capital levels or targets
and our estimated Common Equity Tier 1 ratio under Basel III capital standards (viii) the performance of our mortgage business
and any related exposures (ix) the expected outcome and impact of legal regulatory and legislative developments as well as our
expectations regarding compliance therewith (x) future common stock dividends common share repurchases and other uses of
capital (xi) our targeted range for return on assets and return on equity (xii) the outcome of contingencies such as legal
proceedings and (xiii) the Companyrsquos plans objectives and strategies Forward-looking statements are not based on historical
facts but instead represent our current expectations and assumptions regarding our business the economy and other future
conditions Investors are urged to not unduly rely on forward-looking statements as actual results could differ materially from
expectations Forward-looking statements speak only as of the date made and we do not undertake to update them to reflect
changes or events that occur after that date
For more information about factors that could cause actual results to differ materially from expectations refer to the ldquoForward-
Looking Statementsrdquo discussion in our first quarter 2017 Form 10-Q as well as to our other reports filed with the Securities and
Exchange Commission and available on its website at wwwsecgov including the discussion under ldquoRisk Factorsrdquo in our 2016
Form 10-K
38
- Basel III Pillar 3 Regulatory Capital Disclosures
-
- Table of Contents
- Disclosure Map
-
- First Quarter 2017 Form 10-Q
- 2016 Form 10-K
-
- Introduction
-
- Executive Summary
-
- Table 1 Capital Components and Ratios Under Basel III (Transition Requirements)
-
- Company Overview
- Basel III Overview
-
- Scope of Application of Basel III
- Capital under Basel III
- Risk-Weighted Assets under Basel III
- Transitional Period for Basel III
-
- Capital Requirements and Management
-
- Capital Management
- Internal Capital Adequacy Assessment Process (ICAAP)
- Comprehensive Capital Analysis and Review
-
- Capital Summary
-
- Table 2 Capital Adequacy of Wells Fargo amp Company and its Insured Depository Subsidiaries
- Table 3 Total Regulatory Capital Base
- Table 4 Risk-Weighted Assets by Risk Type -Advanced Approach
-
- Credit Risk
-
- Overview
-
- Accounting Policies
- Total Credit Risk Exposures Impaired Loans Net Charge-offs and Allowance for Credit Losses
- Distribution by Geography Industry or Counterparty Type and Contractual Maturity
- Average Balances
-
- Wholesale Credit Risk
-
- Overview Management approach
- RWAs Measurement Advanced Internal Ratings Based
-
- Retail Credit Risk
-
- Overview Management approach
- RWAs Measurement Advanced Internal Ratings Based
-
- Counterparty Credit Risk
-
- Overview Management Approach
- RWAs Measurement
- CVA Capital Charge
-
- Securitization Credit Risk
-
- Overview Management Approach
- RWAs Measurement
- Securitization Activity
-
- Equity Investment Credit Risk
-
- Overview Management Approach
- RWAs Measurement
-
- Operational Risk
-
- Operational Risk Capital Measurement
- Use of Insurance
-
- Market Risk
- Supplementary Leverage Ratio
-
- Table 15a Supplementary Leverage Ratio (Transition Requirements)
- Table 15b Components of Total Leverage Exposure (Transition Requirements)
-
- Glossary of Acronyms
- Forward-Looking Statements
-
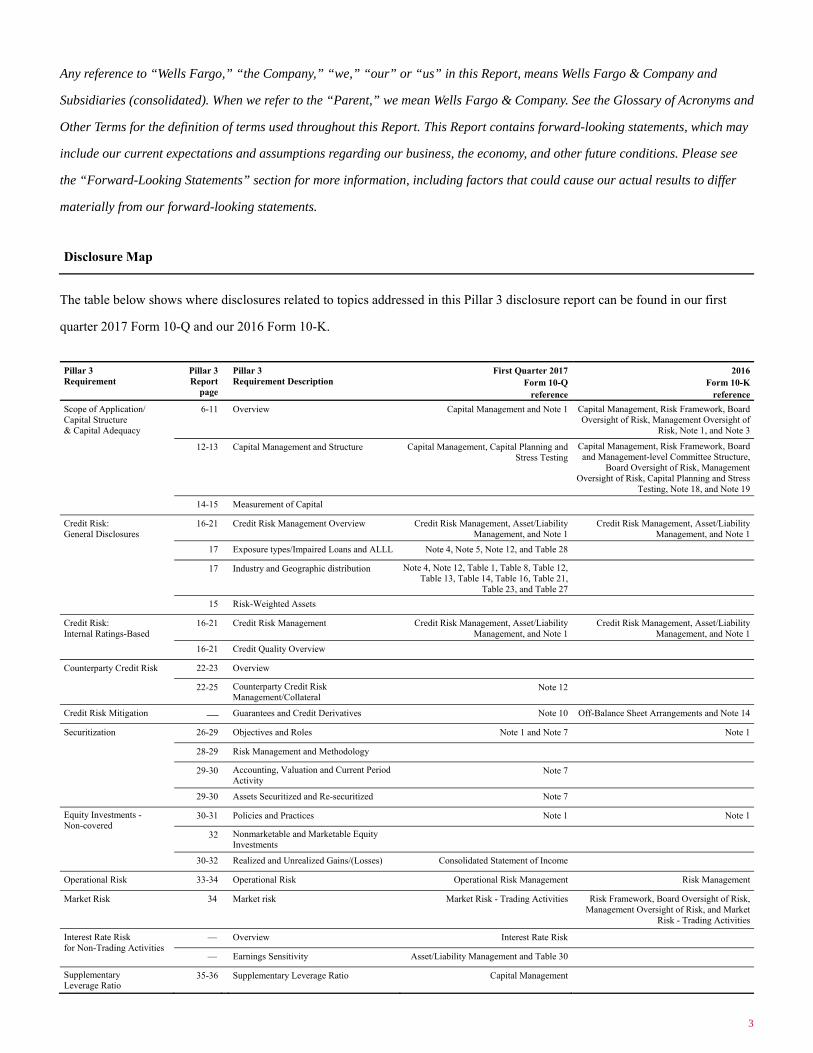
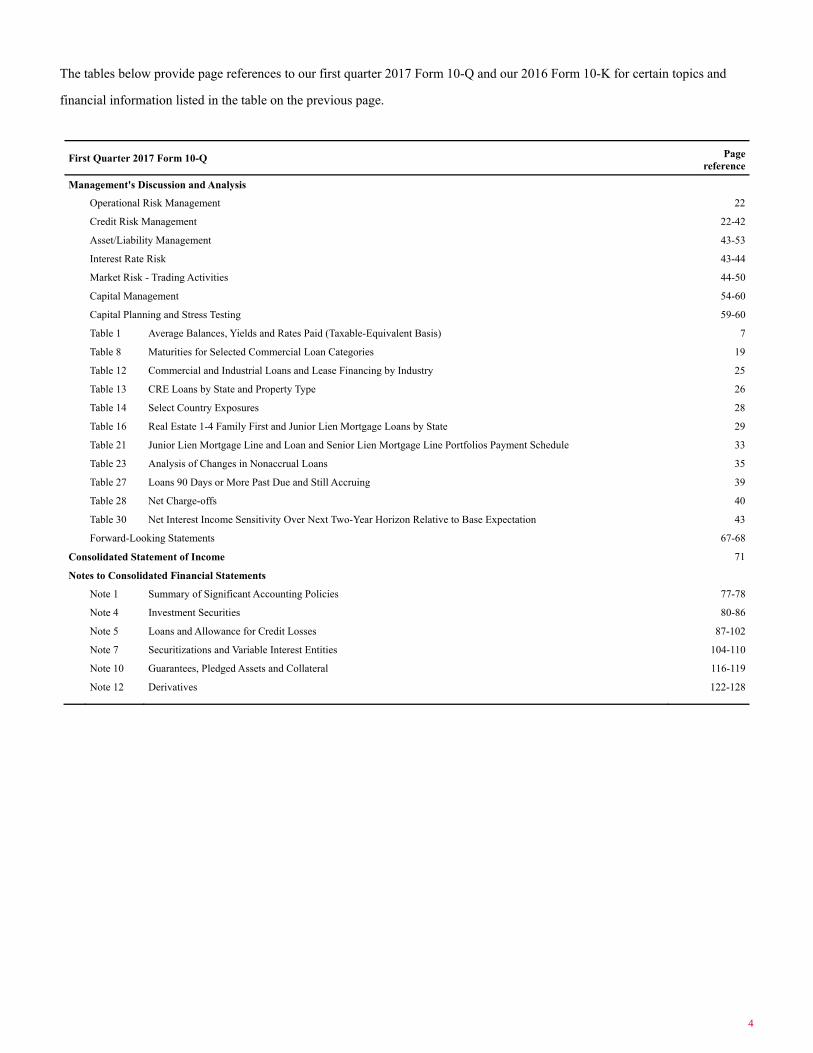
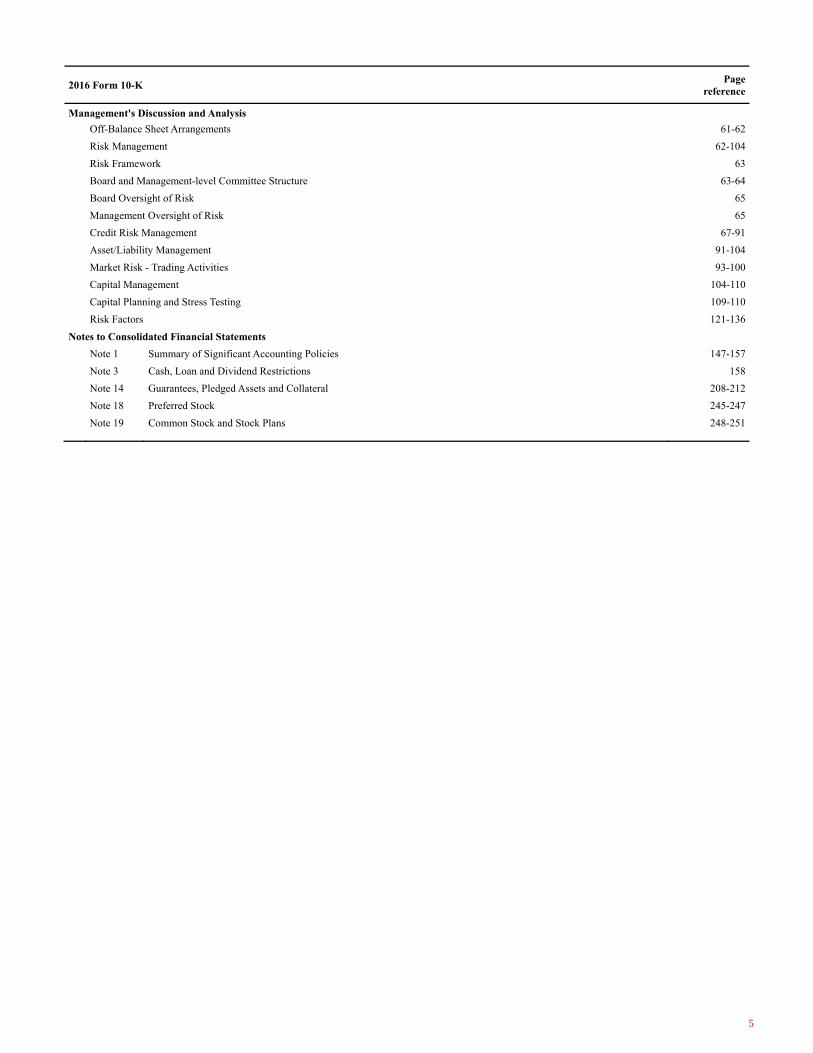
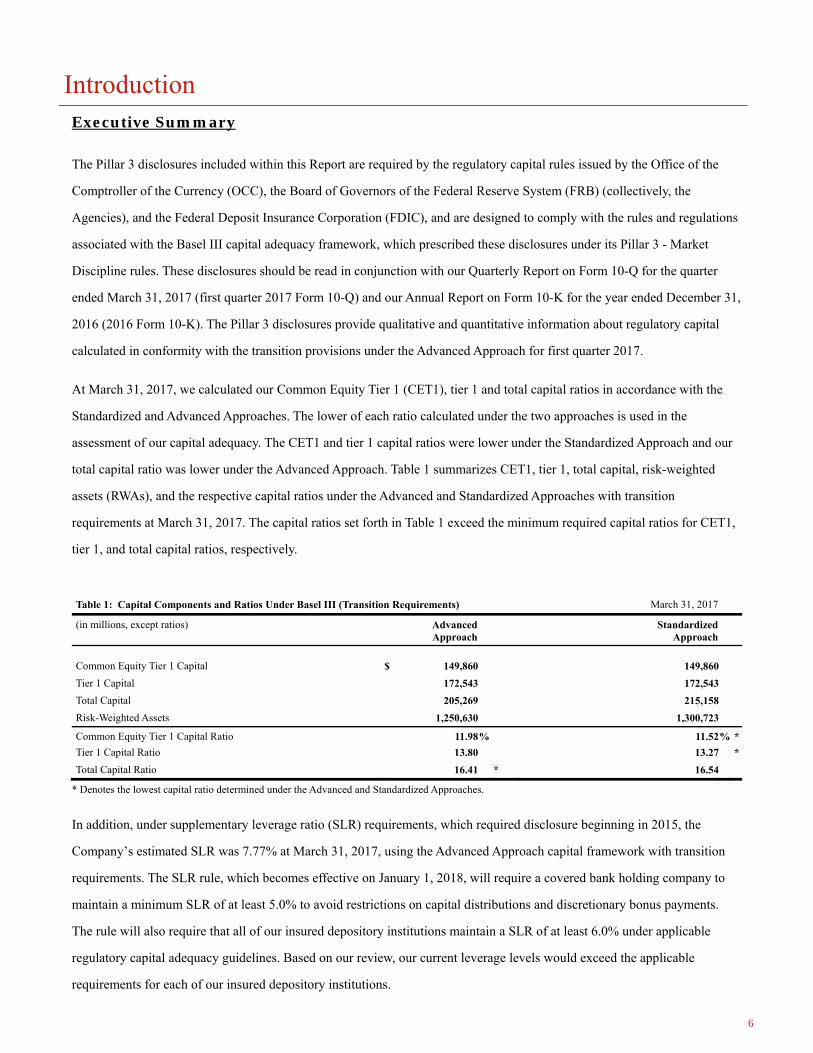
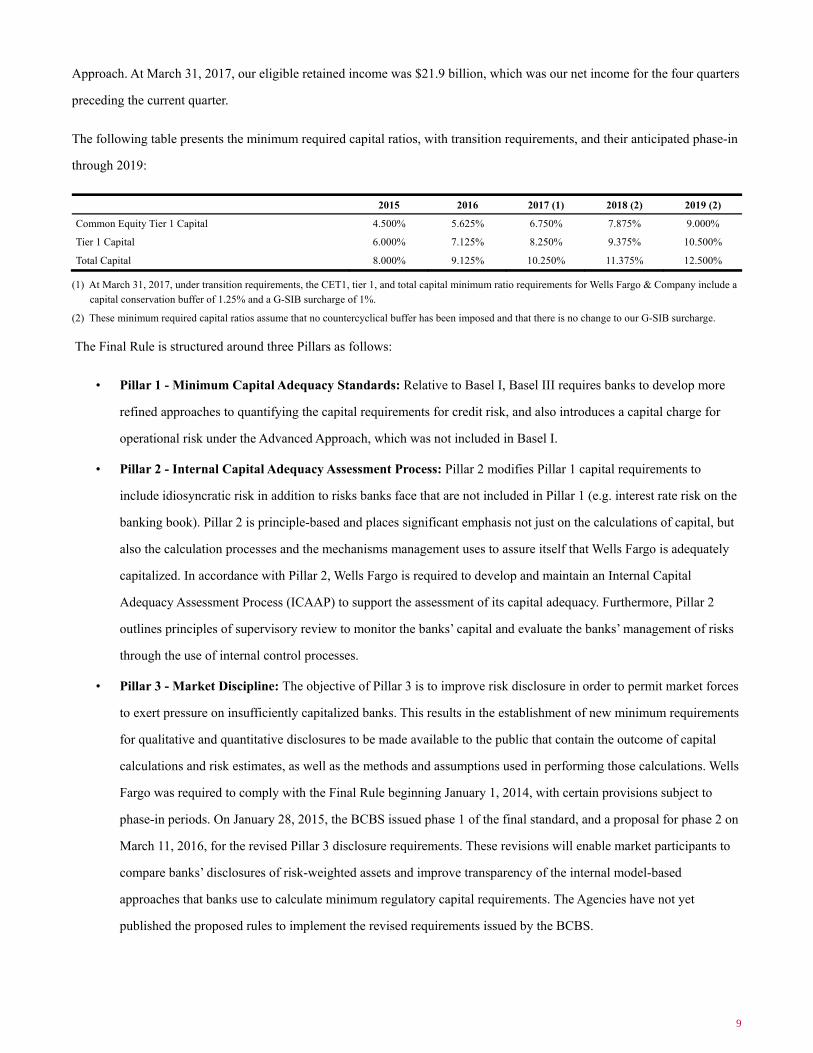
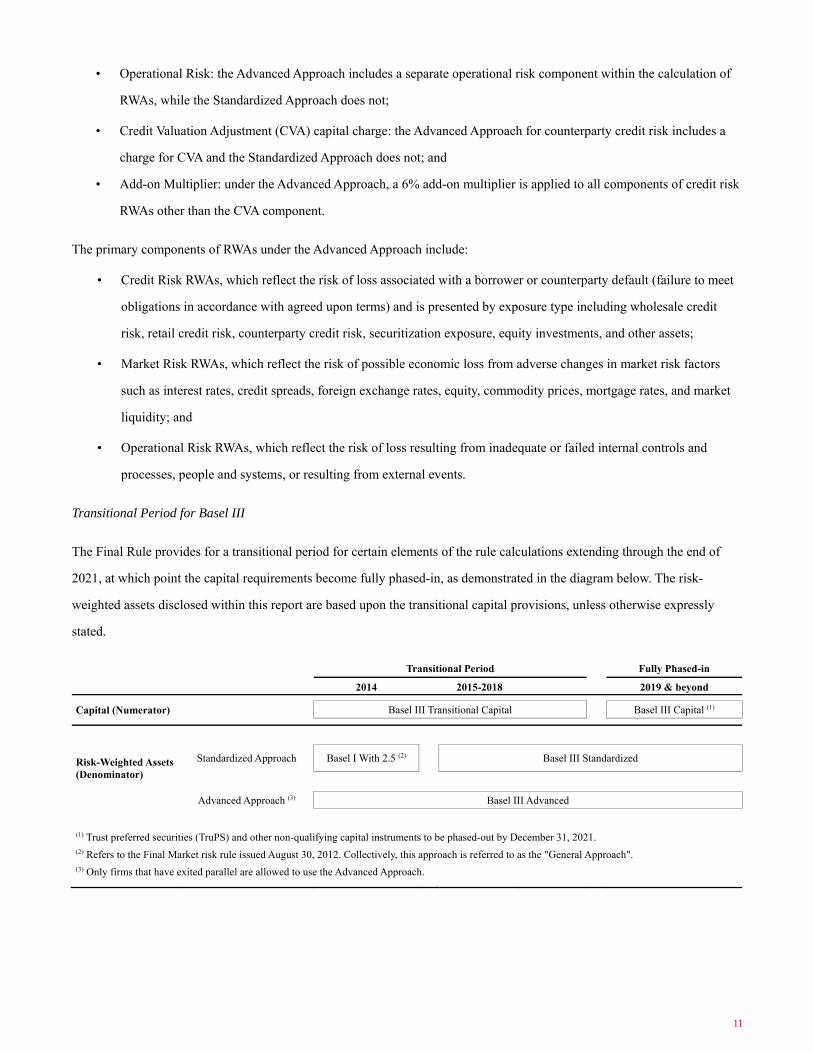
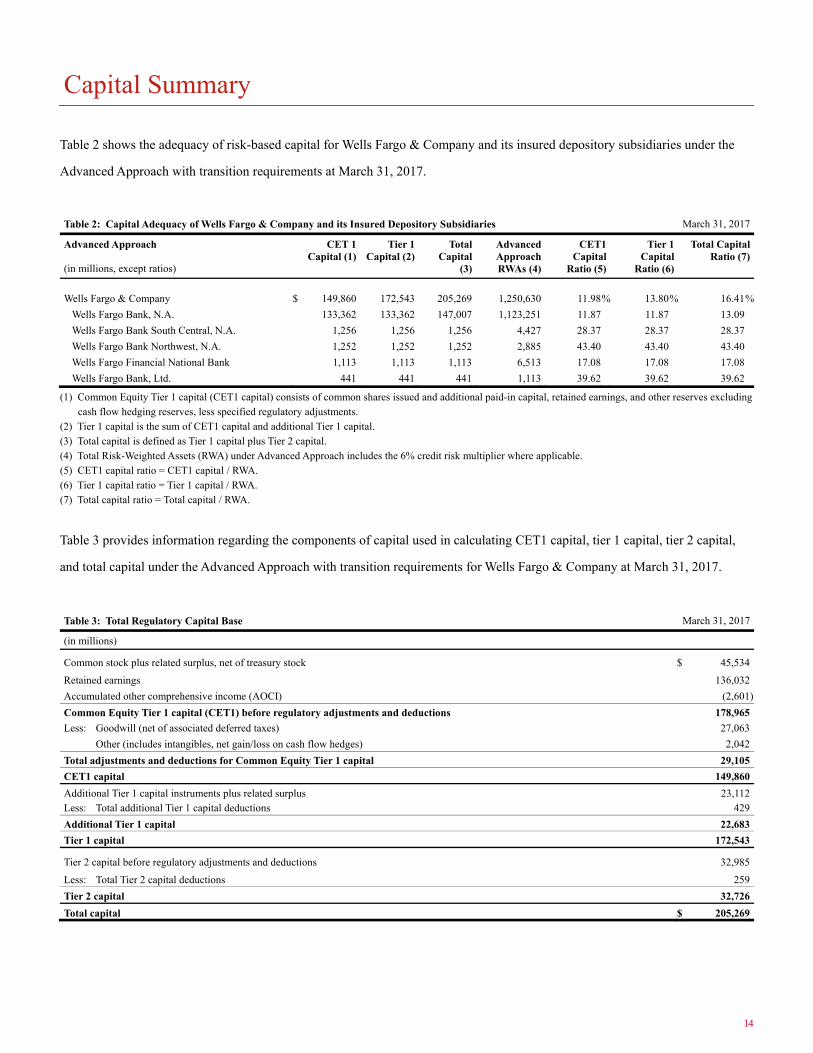
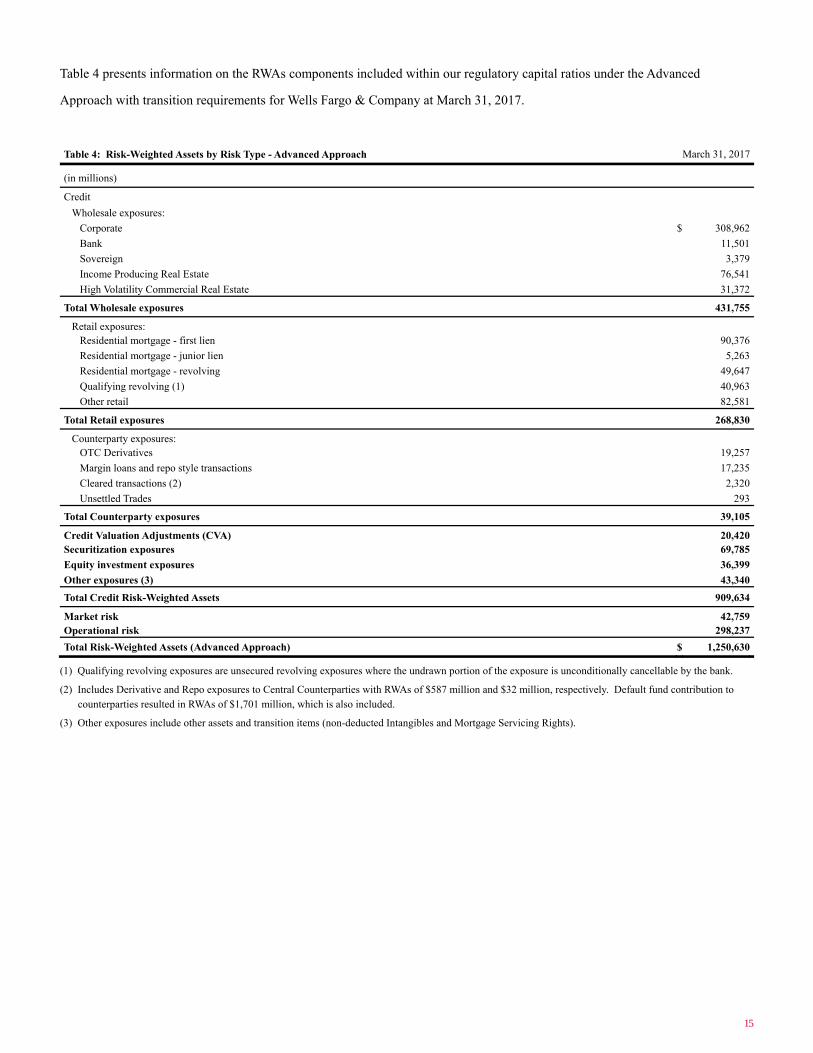
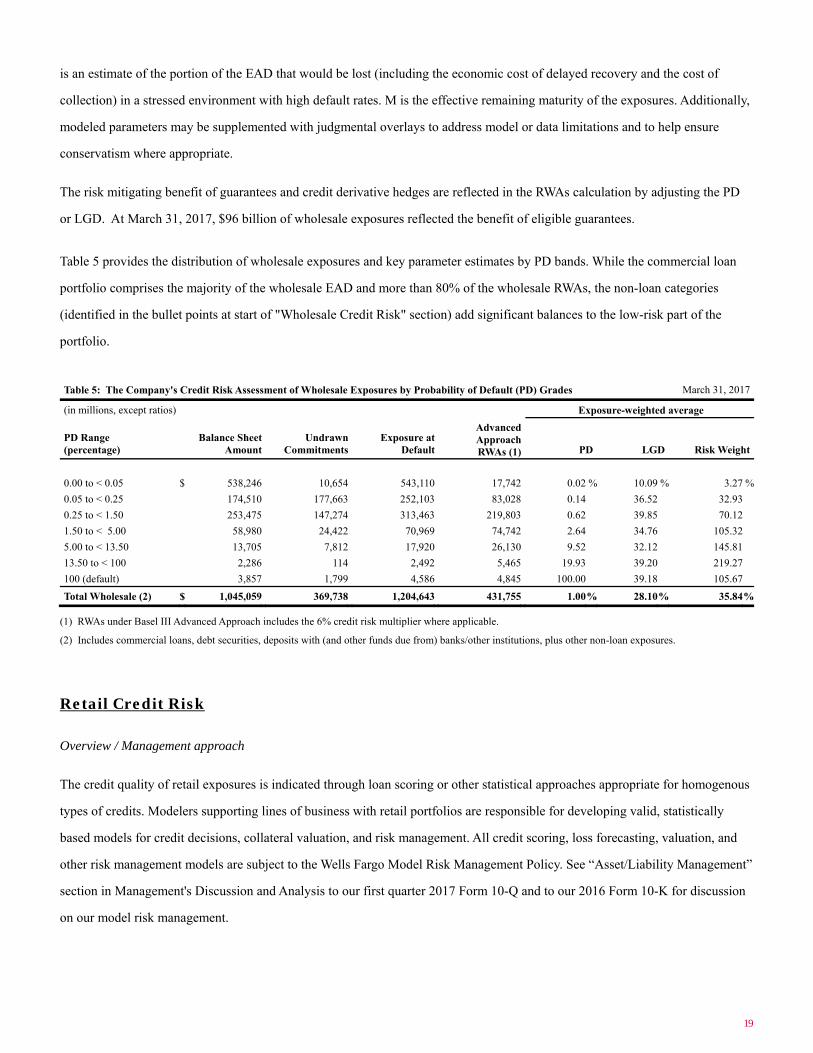
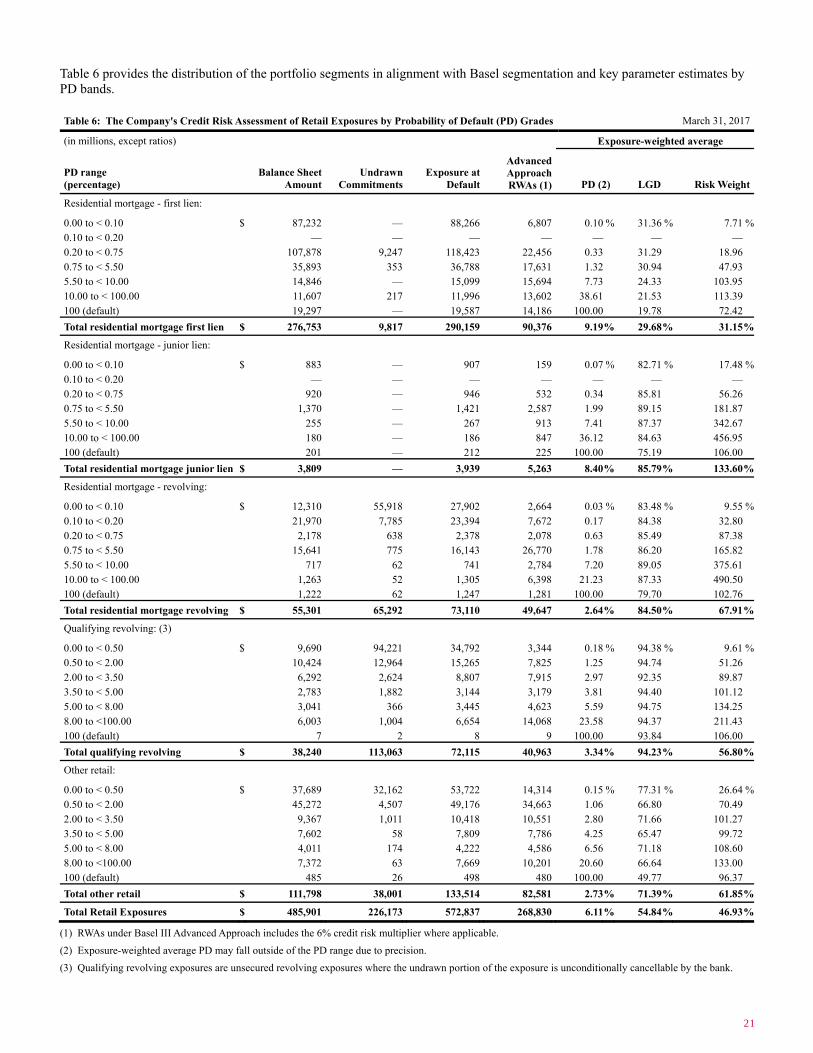
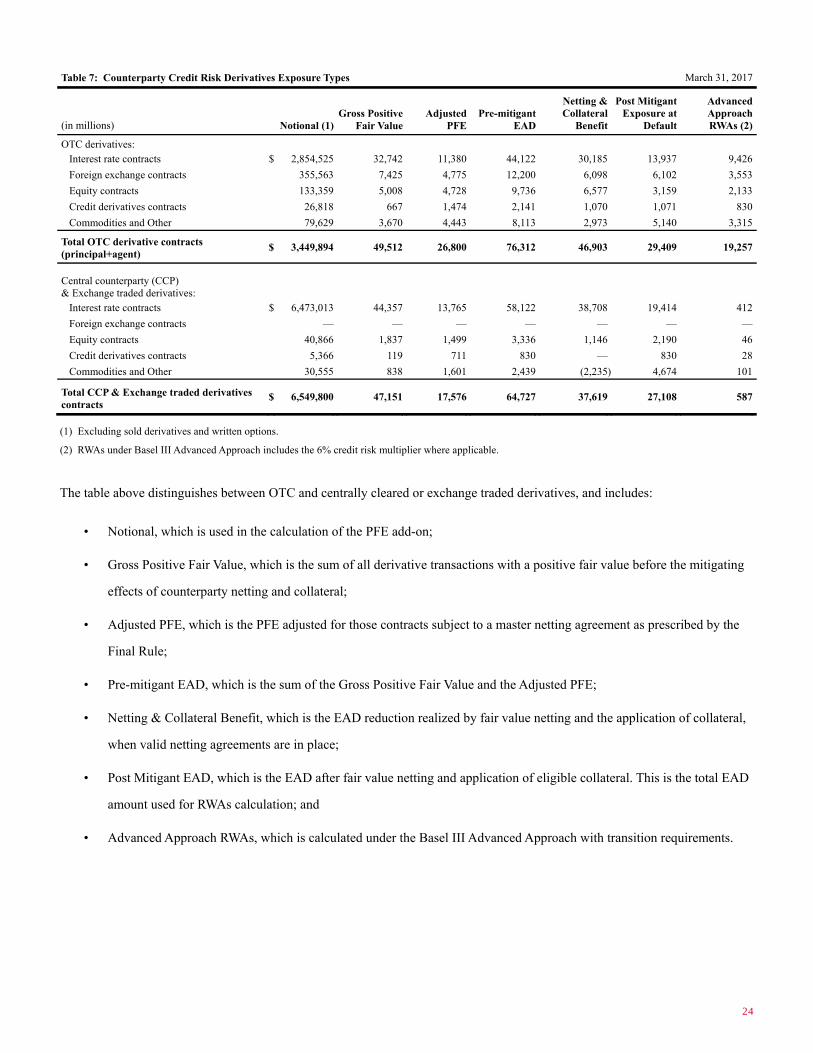
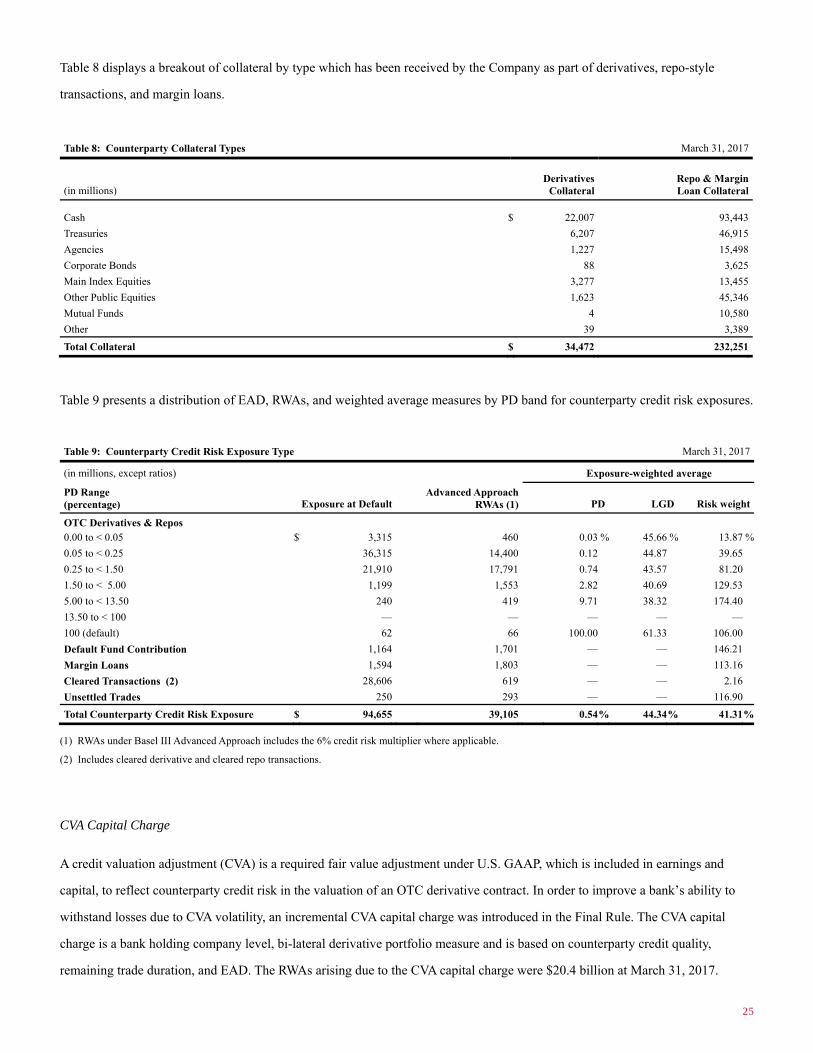
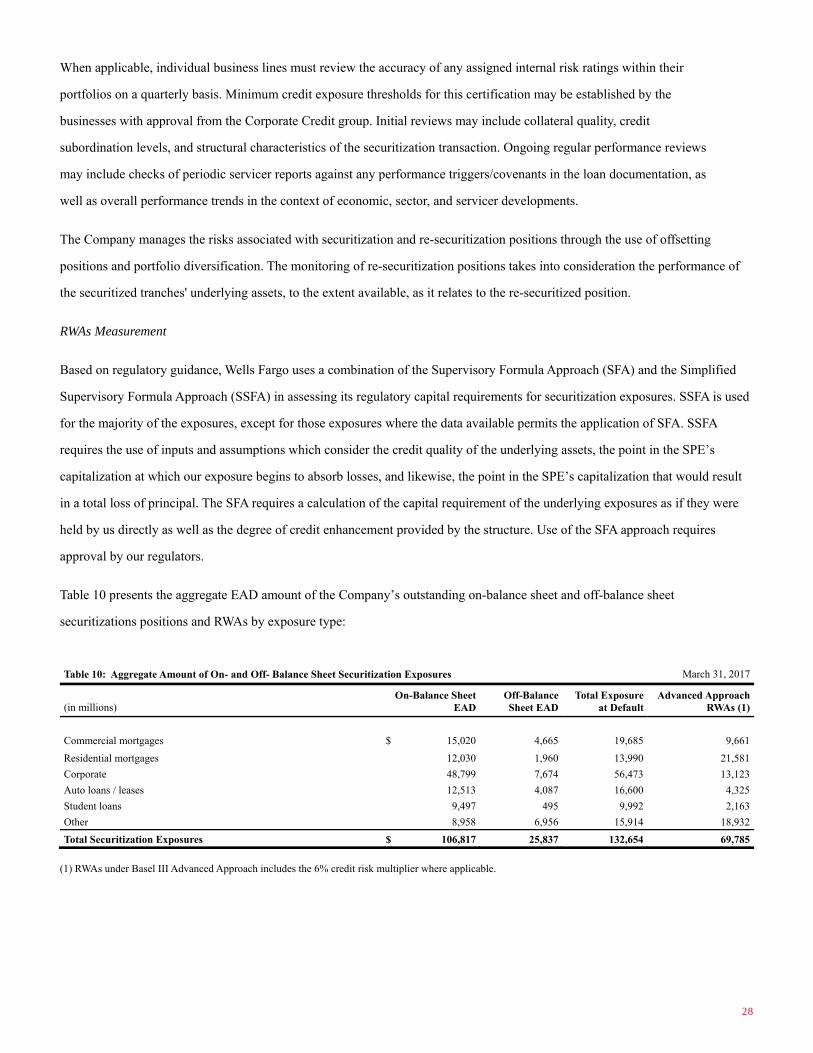
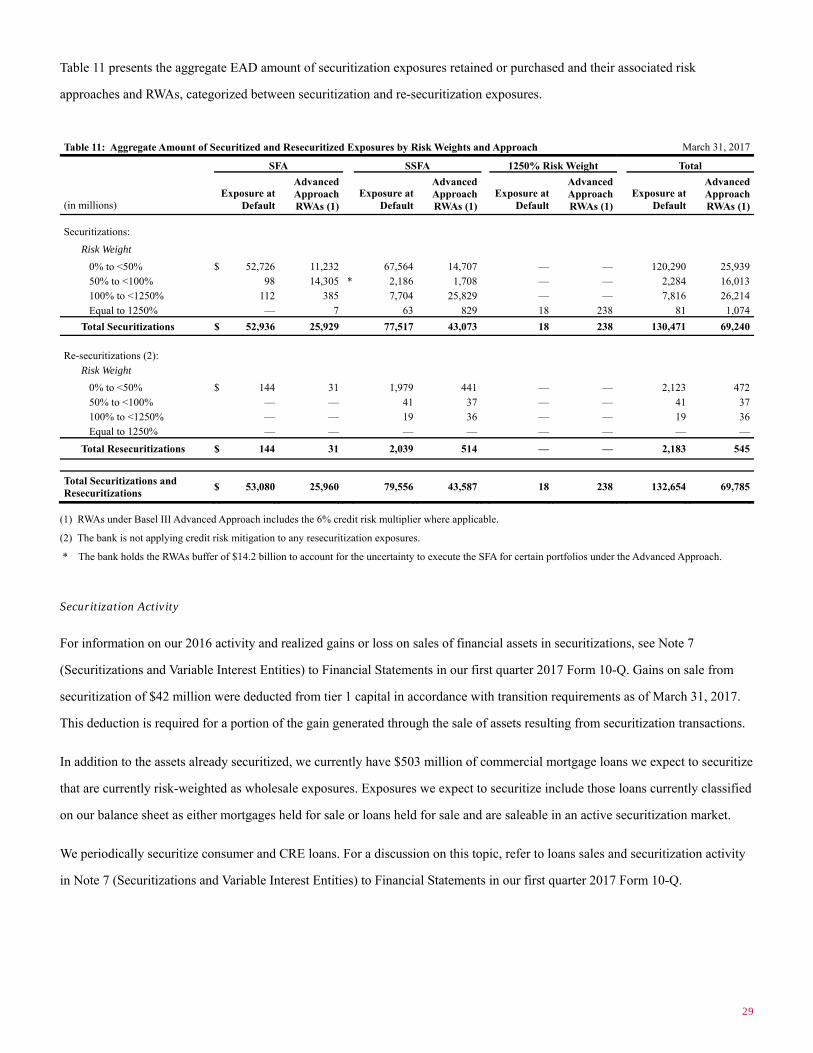
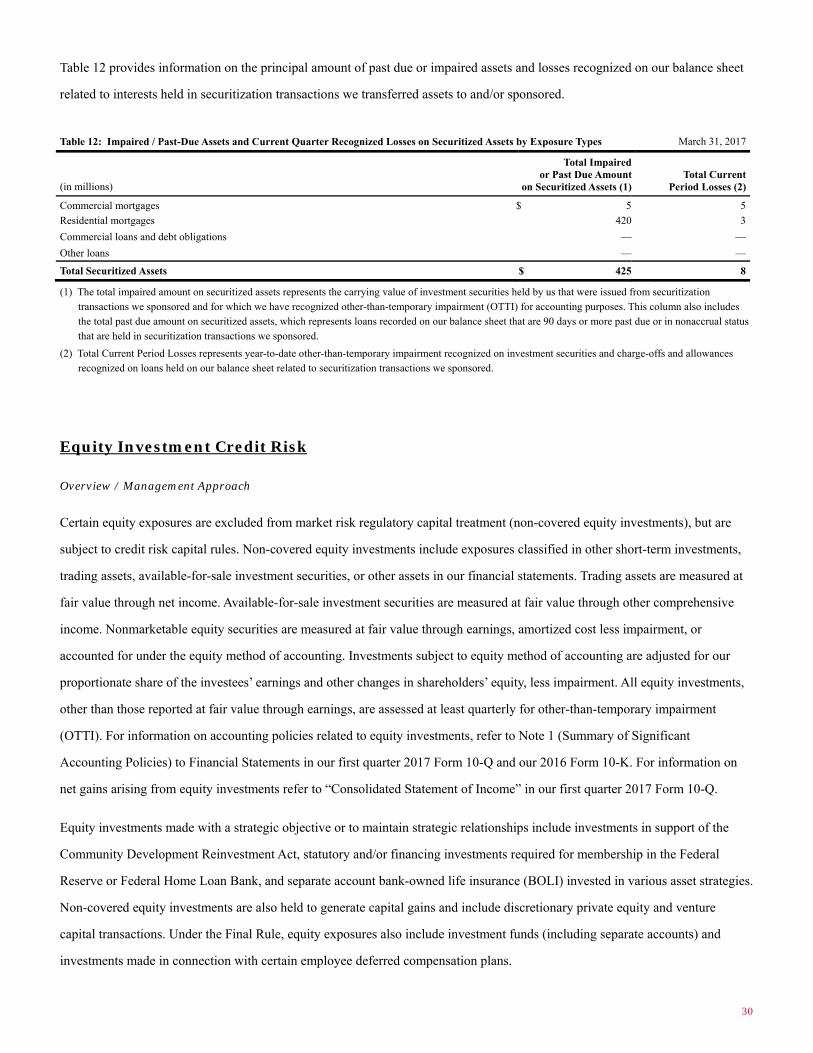
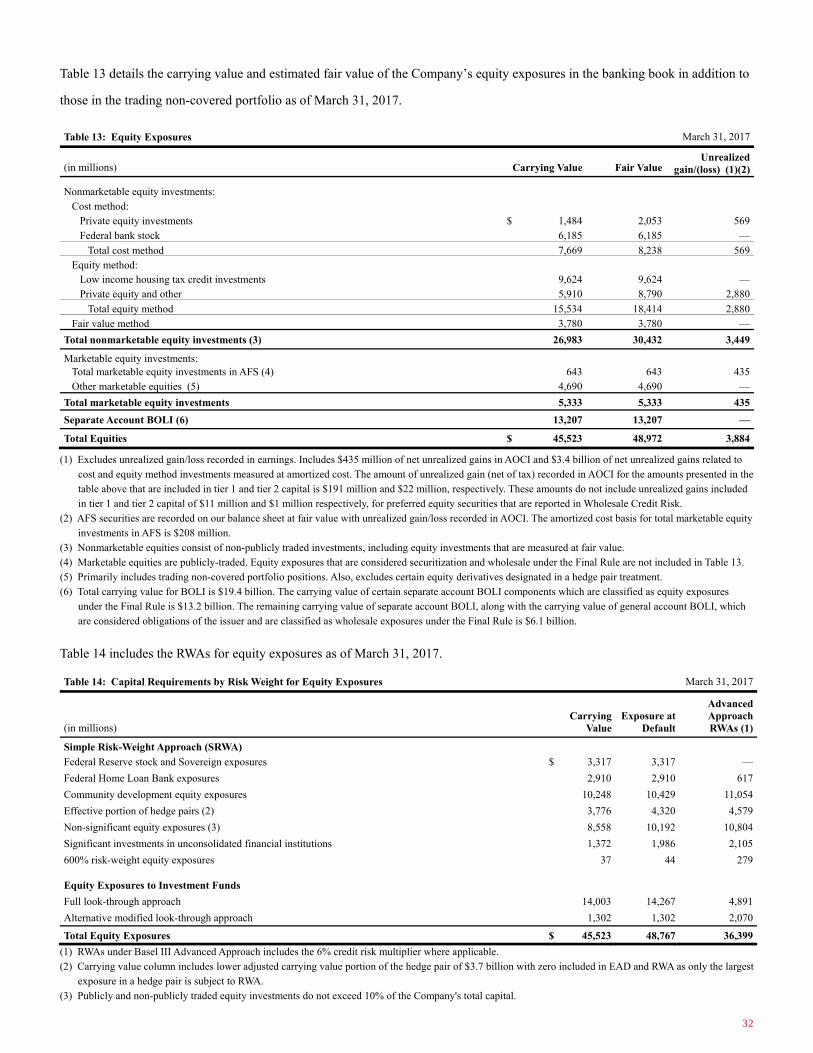
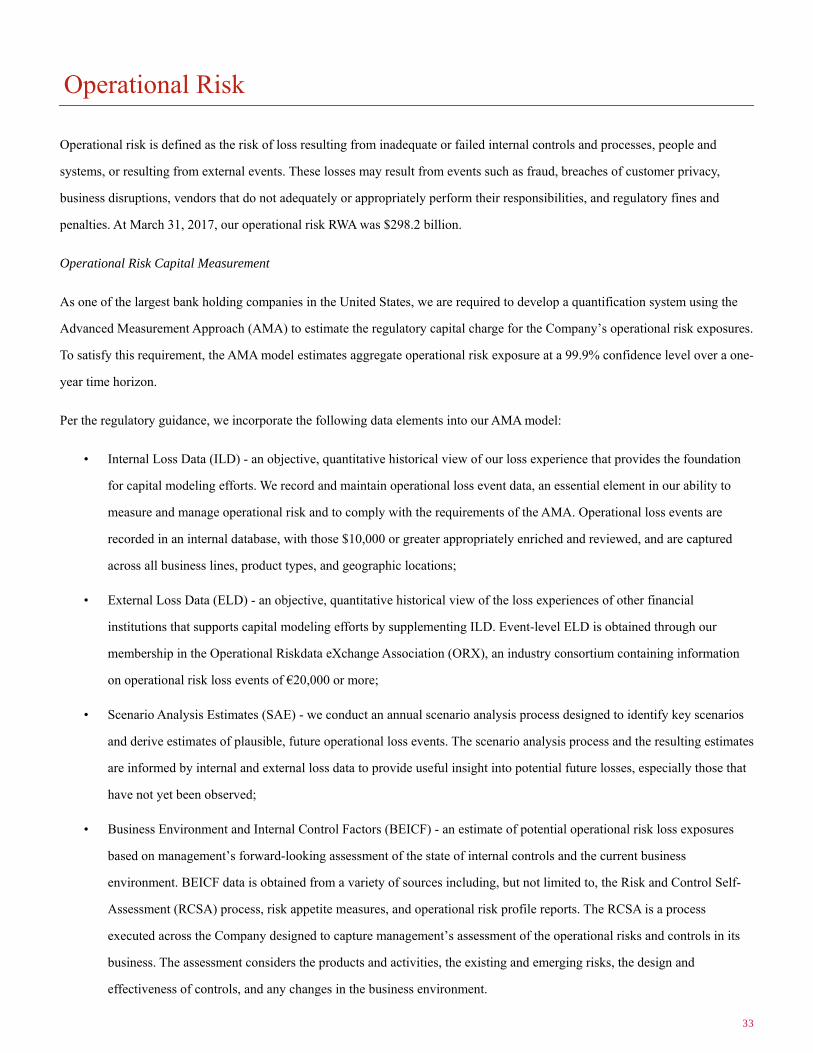
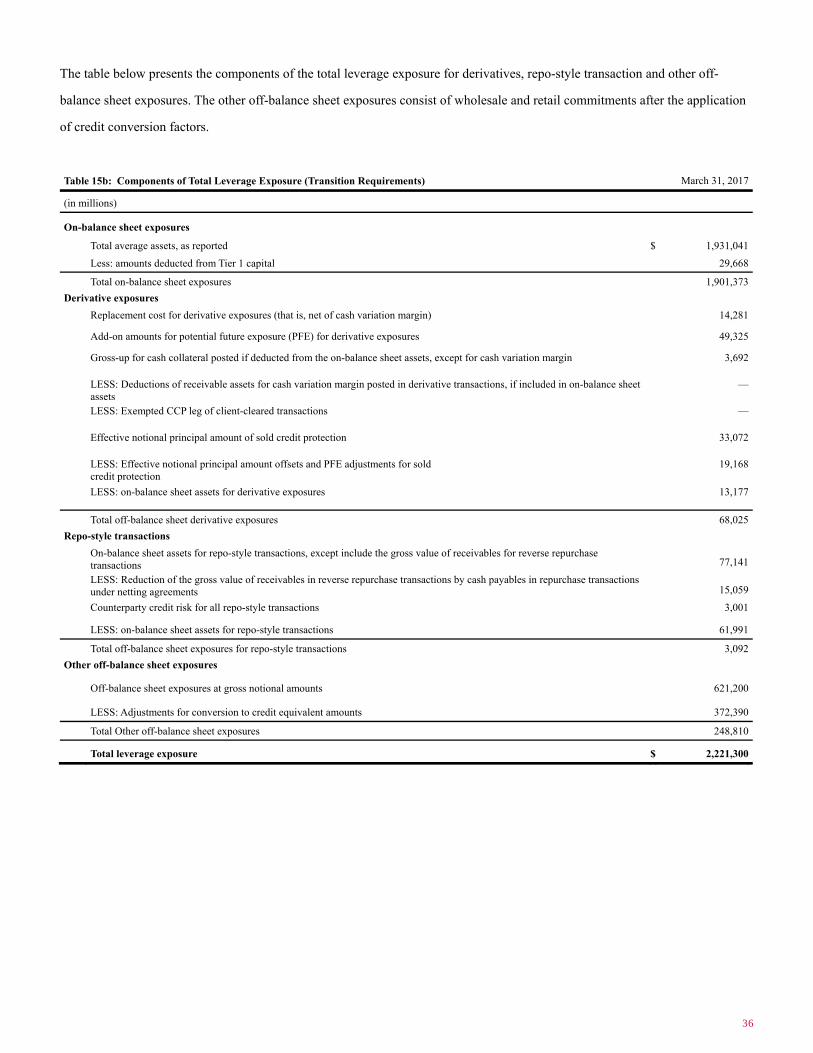
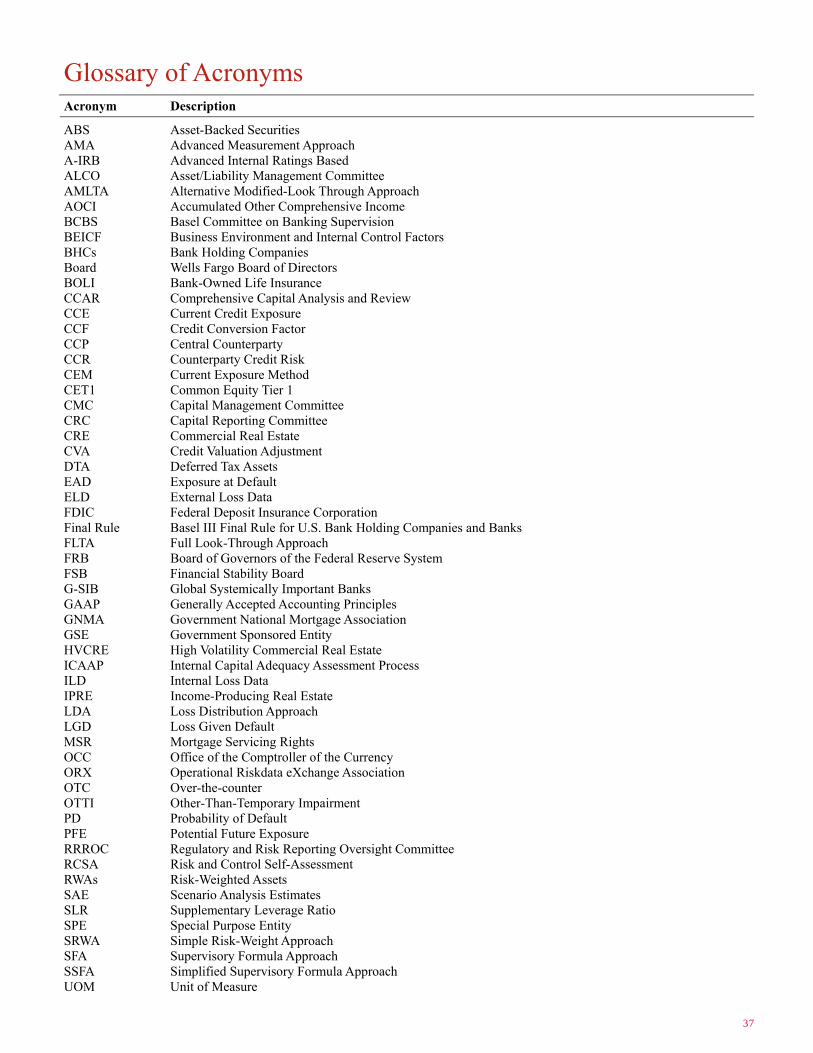