Certificated Salaries and Benefits 2012-13 - Certificated Salaries ...

WO
RK
ING
PA
PE
R
Base Salaries, Bonus Payments, and Work Absence
among Managers in a German Company
University of Lüneburg Working Paper Series in Economics
No. 259
December 2012
www.leuphana.de/institute/ivwl/publikationen/working-papers.html
ISSN 1860 - 5508
by
Christian Pfeifer

Base Salaries, Bonus Payments, and Work Absence
among Managers in a German Company
Christian Pfeifer a) b)
a) Leuphana University Lüneburg, Institute of Economics, Scharnhorststr. 1, 21335 Lüneburg, Germany; phone: +49-4131-6772301; e-mail: [email protected].
b) IZA, Bonn, Germany.
(December 17, 2012)
Abstract
Questions about compensation structures and incentive effects of pay-for-performance
components are important for firms' Human Resource Management as well as for
economics in general and labor economics in particular. This paper provides scarce
insider econometric evidence on the structure and the incentive effects of fixed base
salaries, paid bonuses, and agreed bonuses under a Management-by-Objectives (MBO)
incentive scheme. Six years of personnel data of 177 managers in a German company
are analyzed. The main findings are: (1) base salaries increase significantly with age,
whereas bonuses decrease with age; (2) larger agreed bonuses are correlated with fewer
absent working days.
Keywords: Absenteeism; Bonus; Effort; Incentives; Insider econometrics; Wages
JEL Classification: J22; J24; J31; J33; M12; M52
Acknowledgements: This work was financially supported by the VolkswagenStiftung. I thank Knut Gerlach, participants of the European Economic Association Congress 2012 in Malaga and of research seminars at Albert-Ludwigs-University Freiburg and at Leuphana University Lüneburg for their comments.

1
1. Introduction
"Incentives are the essence of economics. Despite many wide-ranging claims
about their supposed importance, there has been little empirical assessment of
incentive provision for workers."
(Prendergast, 1999, Journal of Economic Literature 37(1), p. 7)
Incentive pay, i.e., monetary rewards to increase work effort, has received increasing
attention in recent decades (for reviews see among others Gibbons, 1998; Lazear, 1999;
Prendergast, 1999; Lazear and Oyer, 2007; Lazear and Shaw, 2007; Bloom and van
Reenen, 2010; Oyer and Schaefer, 2010; Rebitzer and Taylor, 2010). The general idea
of incentive pay, which has been formalized in principal-agency models, is that better
job performance or higher work effort can be expected if a worker's pay is more
strongly attached to his performance. One stream of the literature on incentive pay is
primarily theoretical and concerned with efficient contract design. Another stream is
empirical and tries to identify the effects of incentive pay. However, most empirical
research use data that allow rather indirect statistical inference. The majority of
empirical studies use household, administrative, or aggregated firm survey data. Only
few studies use more appropriate personnel data of single firms which are not easy to
obtain as a researcher (Bartel et al., 2004). Such econometric case studies with
personnel data ("insider econometrics") are of course not representative, but they are
still suitable to test economic theories and their underlying assumptions. Furthermore,
results of econometric case studies can often be generalized. For example, the
relationship between incentive pay and performance is also important for other firms
than the analyzed one and a main assumption in economics is that agents react to

2
incentives. Moreover, personnel data of single firms have several advantages. First,
personnel data are not subject to unobserved firm heterogeneity. Second, different
incentive schemes and outcome variables are not aggregated across firms and industries.
Third, personnel data often contain information about pay (e.g., fixed base salary,
bonus), productivity (e.g., output, work absence), and job levels, which are not included
in many other data sets. Fourth, information is usually unbiased because the data are
used for payrolls, taxes, and social security contributions.
This paper adds to the few insider econometric studies on incentive pay by analyzing
the pay structure (total income, fixed base salary, paid bonus, and maximum bonus
agreed under a Management-by-Objectives scheme) and the incentive effects of agreed
Management-by-Objectives (MBO) bonuses on individual work absence in a sample of
177 managers, who were employed in a large German company from 2000 until 2005.
In order to evaluate and reward the performance of managers, the analyzed company
has implemented a MBO incentive scheme. All managers are paid a yearly bonus based
on points of an individual performance rating how far the set goals have been
accomplished in several dimensions. The use of work absence as a proxy for
performance is driven by the fact that a better variable is not available. But work
absence also has the advantage that it is not subject to a subjectivity bias such as
supervisor ratings. Moreover, Flabbi and Ichino (2001) find, in an analysis of personnel
records, that absenteeism is strongly correlated with employees’ performance ratings by
supervisors. Work absence has been used previously as a proxy for provision of work
effort, shirking behavior, and work attachment (e.g., Barmby et al., 1994; Brown and
Sessions, 1996; Audas et al., 2004; Engellandt and Riphahn, 2004; Ichino and Riphahn,
2004; Engellandt and Riphahn, 2005; Bradley et al., 2007; Hassink and Koning, 2009;

3
Ichino and Moretti, 2009; Pfeifer, 2010), which are especially important in management
jobs because of the supervisor function. It has to be noted, however, that work absence
in the data is officially sickness-related. But reported sickness and extended recovery
periods need of course not to be true or necessary. Even if a manager is really sick, his
work absence is still costly for the company.
Previous studies mostly report positive incentive effects of direct performance pay such
as piece rates on easily measured output in production, agricultural, sales, and recruiting
jobs (e.g., Asch, 1990; Banker et al., 1996; Banker et al., 2000; Lazear, 2000; Paarsch
and Shearer, 2000; Oettinger, 2001; Shearer, 2004; Bandiera et al., 2007; Bandiera et
al., 2009; Franceschelli et al., 2010). Although a stream of the literature has specialized
in executive compensation (Murphy, 1999), few studies look at the effects of bonus
payments in regular management positions. This is due to a lack in data availability on
individual manager bonuses and because complex managerial tasks cannot be easily
measured. Thus, performance ratings, overtime hours, or – as in this paper – work
absence are used to evaluate incentive effects among managers.
An earlier study, which is close to this paper, is Kahn and Sherer (1990) who have
analyzed bonus payments and performance evaluations of 92 middle-level to upper-
level managers in a U.S. firm from the production sector. The firm also uses MBO.
Their main finding is that individual performance is better rated by supervisors, if bonus
payments are larger. A recent study by Engellandt and Riphahn (2011) uses personnel
data on blue- and white-collar workers and managers in a Swiss unit of an international
company. They find that employees in company divisions, which have paid on average
higher bonuses in the previous period, work significantly more overtime hours in the
current period. The effect on work absence is, however, only significantly negative in a

4
specification without control variables (Engellandt and Riphahn, 2004). Although both
studies apply sophisticated econometric research designs, they have some limitations.
First, both studies use rather short panels of personnel data in their estimations. Second,
both studies analyze the effects of actually paid bonuses. This might be in general
problematic since the paid bonus also contains information about actual performance,
even if the lagged bonus is considered. Kahn and Sherer (1990) apply a structural
approach to overcome this problem, which might however suffer from identification
problems of the instruments and sensitivity in small samples. Engellandt and Riphahn
(2011) do not use individual bonuses but average bonus payments in single divisions so
that statistical inference on the incentive effect is not unambiguously obtained (e.g.,
peer effects).
Compared to Kahn and Sherer (1990) and Engelland and Riphahn (2011), the advantage
of the personnel data used in my analysis is the information about the agreed maximum
bonus payment a manager can obtain in a given year if all set goals are accomplished
(MBO). This information is valuable because it does not simultaneously contain
information about an employee's performance in that year, which would be contained in
the actually paid bonus. From a pure incentive perspective, the effort decision of a
rational utility maximizing agent, who benefits from monetary gains and has to cover
effort costs, should be affected by the size of the bonus, which can potentially be earned
in the current period, and not by the size of the bonus already earned in the last period.
Consequently, statistical inference on incentive effects is more likely detected if the
agreed maximum bonus instead of the actually paid bonus is used as an explanatory
variable.

5
One main finding of my empirical analysis is a positive and concave relationship
between fixed base salaries and age, whereas bonuses decrease with age. This finding
highlights the question about incentives for older employees, because larger base
salaries and lower bonus payments are usually associated with lower incentives to
supply effort. There are however several reasons why this relationship might be weaker
for older employees than for younger employees so that the company might reduce
bonuses and increase base salaries for older managers (e.g., preferences for stable
income, deferred compensation, selection). The results on work absence reveal that
managers with a larger agreed maximum MBO bonus are indeed significantly fewer
days absent from work, whereas no significant effects of the base salary is found. These
findings support the incentive effect of bonus payments but are not in line with ideas
from efficiency wage models that higher wage levels increase effort levels (e.g., gift-
exchange, non-shirking).
The paper is structured as follows. The next section describes the analyzed company
and manager sample. Section 3 presents and discusses the regression results for the
determinants of total income, base salary, paid bonus, and agreed MBO bonus as well as
the effects on work absence. The paper concludes with a short summary of the results in
Section 4.
2. Company and Manager Sample Information
The manager sample was directly extracted from computerized personnel records of a
West German limited liability company that develops and produces innovative products

6
for the world market and is in good economic condition.1 The company employs on
average about 1500 workers, has a works council, and is subject to an industry-wide
collective contract. The manager sample contains information about all employees in
managerial positions ("außertariflich": above pay-scale of the collective contract) at the
company's headquarter, except executive board members. The nature of the research
topic and the data make some restrictions necessary. First, information about base
salaries, paid bonuses2, and agreed maximum MBO bonuses are available on a yearly
basis and work absence is volatile over a year. Therefore, the monthly personnel records
are transformed into yearly data and the sample is restricted to managers who are
employed with the company over an entire calendar year. Second, although bonuses and
MBO already exist prior to the year 2000, information about the agreed maximum
MBO bonus is only reliable in the data since 2000 so that only the years from 2000 to
2005 can be used. The sample for the subsequent analysis comprises 722 yearly
observations without missing values of 177 different managers in an unbalanced panel
design.3
The uniqueness of the data is the precise information about the yearly total income
(fixed base salary plus bonus component), the agreed maximum MBO bonus in each
1 The personnel records of all blue-collar and white-collar workers have been previously used to analyze,
for example, wages and the effects of probation periods on work absence (Pfeifer, 2008; Pfeifer and Sohr,
2009; Pfeifer, 2010).
2 The term "paid bonus" is used, although it aggregates all kind of payments which are not included in the
fixed base salary (e.g., vacation pay). The majority of these additional payments are bonus components
stemming from the MBO incentive scheme. Nevertheless, the aggregation of additional payments can
result in a larger paid bonus than agreed bonus.
3 Note that the sample reduction is about 16 percent as the total sample contains 210 managers.

7
year, and the number of absent days from work. Socio-demographic and job
characteristics are rather sparse in the data. In this study only gender, age, and tenure are
included, which are measured at the end of each year. Furthermore, the management
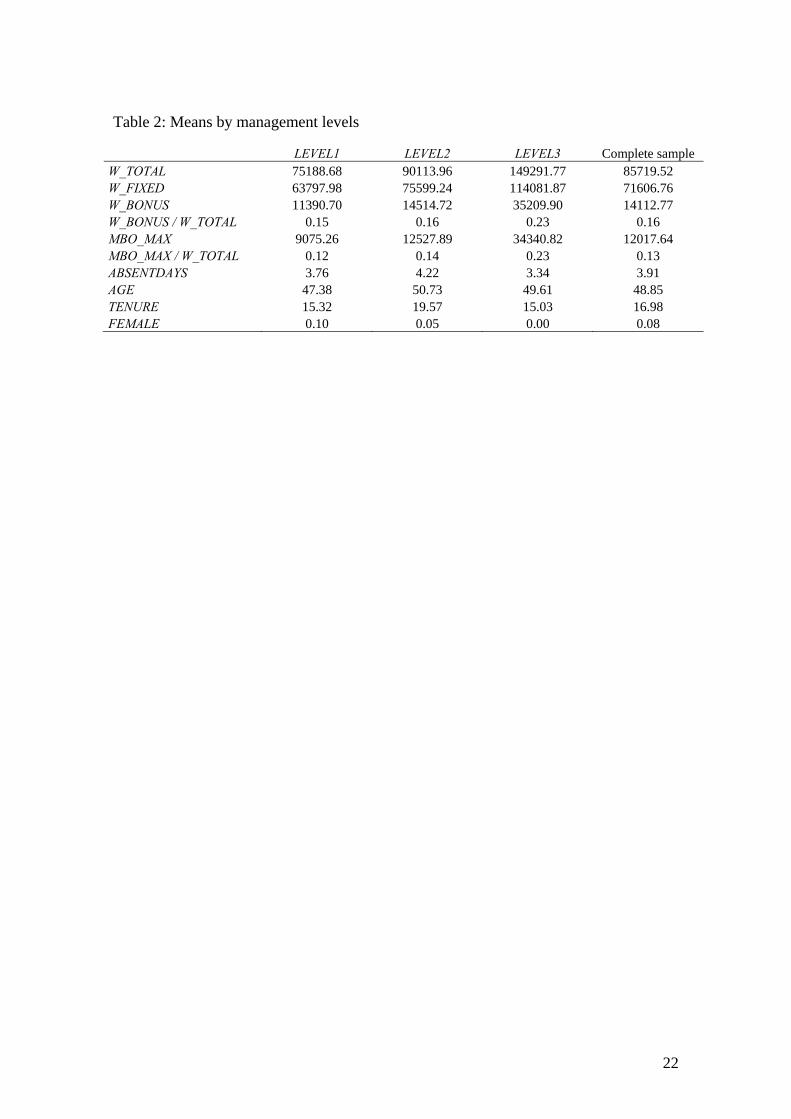
positions are divided in three levels (1: low, 2: middle, 3: high). Table 1 presents
variable definitions and descriptive statistics for the complete estimation sample and
Table 2 presents variable means separately for the three management levels. More than
half of the managers work at the lowest level, about 40 percent at the middle level, and
less than 10 percent at the highest level. The share of female managers is about 10
percent at the lowest level, 5 percent at the middle level, and no women are employed at
the highest management level. The managers are on average 49 years old and have 17
years of tenure.
- insert Table 1 about here
- insert Table 2 about here
Wages and bonus size are largely attached to the three management levels. Mean yearly
total gross income (W_TOTAL) is about €75000 for managers at the lowest level, about
€90000 for middle managers, and about €150000 for upper managers. Although the
fixed base salary (W_FIXED) accounts for most of total income, bonus payments
(W_BONUS) are quite sizeable. These paid bonuses have a mean of more than €14000
and range from €3658 to €74300 per year. The share of bonus payments in total income
is about 15 percent for managers at the lowest and the middle management level,
whereas the 23 percent for top managers is significantly larger. Most of the paid
bonuses are based on MBO agreements, which are mandatory for all employees in
management positions and explicitly used as an incentive tool. The objectives are

8
categorized by goals in different domains and are formally agreed in an employee-
supervisor dialog. Typically, individual goals are weighted lower and business unit and
company goals are weighted higher, if the managerial position is higher. Bonus
payments for reached objectives are then based on formal performance evaluations by
supervisors and a further employee-supervisor dialog. The agreed maximum MBO
bonus (MBO_MAX) ranges from about €2000 to €60000 per year.
The number of absent working days in a given calendar year (ABSENTDAYS) serves as
an effort proxy in order to analyze the incentive effects of manger remuneration. This
count variable ranges from zero to 48 days per year for the managers in the sample. The
mean number of absent working days per year is 3.9 for all managers and 7.7
conditional on being absent. Differences between the three management levels are
rather small and unsystematic.
In the next section, the determinants of total income, base salary, paid bonus, and agreed
maximum MBO bonus are estimated with a special focus on age profiles. Afterwards,
the effects of agreed MBO bonus and base salary on work absence are estimated.
3. Regression Results
3.1. Determinants of Total Income, Base Salaries, and Bonuses
In order to estimate the determinants of total income, fixed base salary, paid bonus, and
agreed maximum MBO bonus and to predict their age profiles, I use log-linear
specifications and random effects generalized least squares (GLS) regressions. Lagrange
multiplier tests reject the null hypothesis that the variance of the random effects is zero

9
for all regressions (Breusch and Pagan, 1980). Hence, the random effects model is
preferable to pooled cross-section least squares. Random effects models also have the
advantage of exploiting the between and the within variance, whereas fixed effects
models are problematic to estimate in this application. First, the used panel is rather
short and within variance is relatively low. Second, age, tenure, and time fixed effects
are perfectly collinear in fixed effects models.
The basic regression function is specified as in equation (1). The dependent variable Y is
either the log of total income (log_W_TOTAL), the log of fixed base salary
(log_W_FIXED), the log of paid bonus (log_W_BONUS), or the log of agreed
maximum MBO bonus (log_MBO_MAX). The explanatory variables are age, tenure,
gender, and management levels. The parameters to be estimated are denoted with α,
are manager-specific random effects, and ε is the usual remaining error term. The
regressions further include time fixed effects (year dummies) to control for aggregated
effects such as the inflation rate and overall changes in the pay structure. The year index
is t and the manager index is i.
2 3
0 1 2 3 4
5 6 72 3it it it it it
it it it t i it
Y AGE AGE AGE TENURE
FEMALE LEVEL LEVEL
(1)
The regression results for specifications with linear age and tenure terms are presented
in Table 3. Since the dependent variables are logs of nominal values in Euros, let us first
take a look at the estimated year effects to assess if they take account of the inflation
rate properly. The results in specification (1) show that total income increases on
average by about 5 percent per year, which exceeds the inflation rate and regular pay
increases in collective contracts. But total income contains a fixed base as well as a

10
bonus component. The yearly pay increase is lower for fixed base salaries in
specification (2) than for paid bonuses in specification (3), which indicates that base
salaries increase by about the inflation rate and bonuses increase by much more. As can
be seen from specification (4) much of the increase in paid bonuses can be attributed to
an increase in the size of agreed maximum MBO bonus, i.e., the company uses bonus
payments more intensively.
- insert Table 3 about here
The estimated coefficients of management levels show that base salaries and especially
bonus payments are significantly larger at higher levels. Moreover, the estimates reveal
interesting gender differences, which have however to be interpreted with caution
because the sample contains only 15 female managers and no information about
effective working hours is available. Women earn on average significantly lower total
income, which can be attributed to significant lower fixed base salaries and not to
significant lower bonus payments. Especially noteworthy is that the agreed maximum
MBO bonus is not lower for women than for men. This finding is consistent with
previous results about lower gender wage gaps in performance-based than in time-based
remuneration schemes, which might be attributed to lower discrimination possibilities
against women (Jirjahn and Stephan, 2004).
The results for age and tenure are of special interest as they shed some light into a
possible incentive problem among older employees. Let us first consider briefly
specifications (1) to (4) with linear age and tenure variables. Age seems to have no
significant effect and tenure has only a modest negative effect on total income. For
fixed base salaries, the effect of tenure is even less significant, but age has a significant

11
positive effect of on average 0.5 percent per year. Paid bonuses are also not significantly
affected by tenure but decrease on average by 0.9 percent for every additional year of
age. The effects of age and tenure on the agreed maximum MBO bonus are both
significantly negative. One additional year of age or tenure decreases the agreed bonus
by about 1.3 percent. The overall results from these linear specifications indicate that
fixed base salaries increase with age, whereas bonus payments decrease with age. As
age is likely to have nonlinear effects, further specifications have been estimated that
include additional squared and cubed age terms. The results are then used to predict age
profiles for an average manager in Figure 1.
- insert Figure 1 about here
Figure 1 plots the predicted age profiles of total income, fixed base salary, paid bonus,
and agreed maximum MBO bonus. Total income increases with age until the age of 50,
after which it slightly decreases again. The predicted base salary-age profile is concave.
Base salaries increase from about €60000 at the age of 30 to more than €70000 in the
mid 50s, at which level base salaries remain until managers reach retirement at the age
of 65. The paid bonus increases slightly with age until it reaches its maximum of about
€14000 at the age of 40. Afterwards, bonus payments decrease with age. The picture is
even more striking when looking at the agreed maximum MBO bonus. The agreed
bonuses stay quite constant at about €11000 for managers in their 30s and early 40s but
decrease for older managers to less than €8000.
Although the predicted nonlinear age profiles are more precise than the specifications
with only linear age terms, the overall results hold: base salaries are larger and bonuses
are smaller for older managers. From an incentive-based principal-agent perspective,

12
this finding implies less motivation to supply work effort for older managers, which
would make their employment less likely. There are, however, several theoretical
arguments against such a conclusion. First, older employees might have higher
preferences for a stable income than younger employees and interpret a larger base
salary as a gift for which they exchange higher effort levels (Akerlof, 1982). Second,
increasing base salary-age profiles are an indicator of deferred compensation schemes
(Lazear, 1979), which uphold incentives especially for older employees with longer
tenure and make bonus payments a less necessary incentive device. Third, older
managers might have already accumulated more signals and reputation during their
longer work experience than younger managers. The company can consequently select
and employ older managers, who are more likely to show high work morale or intrinsic
motivation so that extrinsic incentives are not needed as much as for lazy and "greedy"
managers.
Several robustness checks have been performed. All specifications were re-estimated
without the tenure variable and the estimates were also repeated for a balanced panel of
69 managers. Since the main results hold, these robustness checks are not included in
the paper but can be requested from the author.
3.2. Effects of Base Salaries and Bonuses on Work Absence
The effects of fixed base salaries and agreed maximum MBO bonuses on managers'
work absence are estimated to evaluate potential incentive effects. In efficiency wage
models, a larger fixed base salary is associated with higher work effort for two potential
reasons. First, the value of the current job is higher independent of uncertain variable

13
payments and, ceteris paribus, outside options are less attractive. Consequently, the
threat of getting fired when caught shirking and its incentive effect is larger (Shapiro
and Stiglitz, 1984). Second, an unconditional larger base salary might be interpreted as
a gift by the company, for which the manager exchanges higher effort levels (Akerlof,
1982). Larger agreed maximum MBO bonuses should have a direct incentive effect,
because a manager can earn more income if his performance is better rated. Although
we might expect a larger incentive effect from bonuses than base salaries, it can be
expected that both are correlated with less work absence.
The basic regression function is specified as in equation (2), in which the dependent
variable is the number of absent working days in a calendar year (ABSENTDAYS). The
explanatory variables of interest are the log of fixed base salary (log_W_FIXED) and
the log of agreed maximum MBO bonus (log_MBO_MAX). The regressions further
control for differences in age, tenure, gender, and management levels. The parameters to
be estimated are denoted with β and ε is the usual remaining error term. The regressions
also include time fixed effects (year dummies) to control for aggregated effects such
as infectious diseases and the inflation rate. The year index is t and the manager index is
i.
0 1 2
3 4 5
6 72 3
it it it
it it it
it it t it
ABSENTDAYS log_W_FIXED log_MBO_MAX
AGE TENURE FEMALE
LEVEL LEVEL
(2)
The number of absent working days per year, which is the dependent variable, is
characterized by counts of non-negative values. Thus, count data estimation techniques
are appropriate and usually applied in the econometric analyses of work absence
(Winkelmann, 1999; Barmby et al., 2001; Winkelmann, 2008). Due to the panel nature

14
of the data, random effects and conditional fixed effects negative binomial
(overdispersion) models are estimated, which allow the dispersion parameters to vary
between managers in the sample.4 The negative binomial models outperform the
Poisson models and the random and fixed effects models outperform the pooled models
with respect to Akaike and Bayesian information criteria in my application.
Table 4 presents the results of the random and fixed effects negative binomial
regressions for the unbalanced panel (complete sample) as well as for a balanced panel
of managers, who are employed in the firm over the entire 6 year observation period.
The estimation results indicate a significant incentive effect of the agreed MBO bonus
(log_MBO_MAX) but not of the fixed base salary (log_W_FIXED) throughout all
regressions. Overall, the agreed MBO bonus seems to be the only variable that
significantly affects the number absent working days. The random effects model for the
unbalanced panel shows that a one log point larger agreed MBO bonus is on average
correlated with about 29 percent fewer absent working days ( 0.3407 1 29%e ). The
estimated effect is slightly larger in the fixed effects model for the unbalanced panel
( 0.3903 1 32%e ). The last two columns contain the results for the balanced panel, in
which a one log point larger agreed MBO bonus reduces absent working days even by
about 45 percent (random effects: 0.5905 1 45%e ; fixed effects: 0.6056 1 45%e ).
4 Note that the terms random effects and fixed effects refer to the dispersion parameter and not to the
person-specific error term in conventional panel regression techniques. Thus, the fixed effects negative
binomial regressions still contain time invariant variables such as gender. Because the fixed effects
binomial regression uses a conditional likelihood so that the manager-specific dispersion parameters
cancels out, at least two yearly observations and within variance of the dependent variable
(ABSENTDAYS) are necessary for a manager to remain in the estimation sample.

15
- insert Table 4 about here
In sum, the results for equation (2) in Table 4 support the idea of incentive effects from
agreed MBO bonuses. The incentive effect (β2<0) in equation (2) might, however,
suffer from an endogeneity problem in terms of reverse causality, if the current agreed
MBO bonus is negatively affected by a manager's past work absence and if work
absence is path dependent. Although an upward bias due to this endogeneity problem
seems unlikely from a theoretical perspective, because a rational firm should rather
react with more than less variable payment components (agreed maximum bonus) to
less work effort (more work absence), several empirical checks have been performed.5
At first, I have re-estimated equation (1) from Section 3.1 for the current log of agreed
maximum MBO bonus with the lagged number of absent working days as additional
explanatory variable. The estimates show that work absence in the past year does not
significantly affect the agreed bonus in the current year, neither in random nor fixed
effects estimates for the unbalanced and balanced panels. Furthermore, I have re-
estimated equation (2) for the number of current absent working days with the lagged
agreed MBO bonus as additional explanatory variable. The findings indicate that
managers' current work absence is not significantly affected by past year's agreed bonus
but significantly lower if current year's agreed bonus is larger. Overall, the estimated
incentive effects of the agreed maximum MBO bonus are unlikely to be upward biased
by an endogeneity problem.
5 The results of the robustness checks can be requested from the author.

16
4. Conclusion
In the last two decades, an emerging number of econometric case studies with personnel
data (large-scale or field-experiments) analyzed incentive effects of piece rates on easily
observed productivity variables such as output or sales. This paper contributes new
empirical findings about the compensation structure of managers and the incentive
effects of fixed base salaries and agreed maximum MBO bonuses in a German
company. Bonus payments account on average for more than 15 percent of total income
and most parts of these bonuses are paid under a MBO incentive scheme. Fixed base
salaries increase with age, whereas bonuses decrease with age, which points to the issue
of employability of older workers due to lower incentives, because larger base salaries
and lower bonus payments are usually associated with lower incentives to supply effort.
Due to preferences for stable income, deferred compensation schemes, and selection of
less "greedy" managers, the company might reduce bonus payments and increase base
salaries for older managers. The results, moreover, strongly support an incentive effect
of bonus payments because the number of absent working days is significantly lower for
managers with larger agreed MBO bonuses.

17
References
Akerlof, G.A. (1982). Labor contracts as partial gift exchange. Quarterly Journal of Economics 97(4),
543-569.
Asch, B.J. (1990). Do incentives matter? The case of Navy recruiters. Industrial and Labor Relations
Review 43(3), 89S-106S.
Audas, R., Barmby, T., and Treble, J. (2004). Luck, effort, and reward in an organizational hierarchy.
Journal of Labor Economics 22(2), 379-395.
Bandiera, O., Barankay, I., and Rasul, I. (2007). Incentives for managers and inequality among workers:
evidence from a firm-level experiment. Quarterly Journal of Economics 122(2), 729-773.
Bandiera, O., Barankay, I., and Rasul, I. (2009). Social connections and incentives in the workplace:
evidence from personnel data. Econometrica 77(4), 1047-1094.
Banker, R.D., Lee, S.-Y., and Potter, G. (1996). A field study of the impact of a performance-based
incentive plan. Journal of Accounting and Economics 21(2), 195-226.
Banker, R.D., Lee, S.-Y., Potter, G., and Srinivasan, D. (2000). An empirical analysis of continuing
improvements following the implementation of a performance-based compensation plan. Journal of
Accounting and Economics 30(3), 315-350.
Barmby, T., Nolan, M., Winkelmann, R. (2001). Contracted workdays and absence. Manchester School
69(3), 296-275.
Barmby, T., Sessions, J.G., and Treble, J. (1994). Absenteeism, efficiency wages and shirking.
Scandinavian Journal of Economics 96(4), 561-566.
Bartel, A., Ichniowski, C., and Shaw, K. (2004). Using "insider econometrics" to study productivity.
American Economic Review 94(2), 217-223.
Bloom, N., and van Reenen, J. (2010). Human resource management and productivity. Handbook of
Labor Economics 4B (forthcoming) (NBER Working Paper No. 16019).
Bradley, S., Green, C., and Leeves, G. (2007). Worker absence and shirking: evidence from matched
teacher school data. Labour Economics 14(3), 319-334.

18
Breusch, T.S., and Pagan, A.R. (1980). The Lagrange multiplier test and its applications to model
specification in econometrics. Review of Economic Studies 47(1), 239-253.
Brown, S., and Sessions, J.G. (1996). The economics of absence: theory and evidence. Journal of
Economic Surveys 10(1), 23-53.
Engellandt, A., and Riphahn, R.T. (2005). Temporary contracts and employee effort. Labour Economics
12(3), 281-299.
Engellandt, A., and Riphahn, R.T. (2004). Incentive effects of bonus payments: evidence from an
international company. IZA Discussion Paper No. 1229.
Engellandt, A., and Riphahn, R.T. (2011). Evidence on incentive effects of subjective performance
evaluations. Industrial and Labor Relations Review 64(2), 241-257.
Flabbi, L., and Ichino, A. (2001). Productivity, seniority and wages: new evidence from personnel data.
Labour Economics 8(3), 359-387.
Franceschelli, I., Galiani, S., and Gulmez, E. (2010). Performance pay and productivity of low- and high-
ability workers. Labour Economics 17(2), 317-322.
Gibbons, R. (1998). Incentives in organizations. Journal of Economic Perspectives 12(4), 115-132.
Hassink, W.H.J., and Koning, P. (2009). Do financial bonuses reduce employee absenteeism? Evidence
from a lottery. Industrial and Labor Relations Review 62(3), 327-342.
Ichino, A., and Moretti, E. (2009). Biological gender differences, absenteeism, and the earnings gap.
American Economic Journal: Applied Economics 1(1), 183-218.
Ichino, A., and Riphahn, R.T. (2005). The effect of employment protection on work effort: absenteeism
during and after probation. Journal of the European Economic Association 3(1), 120-143.
Jirjahn, U., and Stephan, G. (2004). Gender, piece rates and wages: evidence from matched employer-
employee data. Cambridge Journal of Economics 28(5), 683-704.
Kahn, L.M., and Sherer, P.D. (1990). Contingent pay and managerial performance. Industrial and Labor
Relations Review 43(3), 107S-120S.
Lazear, E.P. (1979). Why is there mandatory retirement? Journal of Political Economy 87(6), 1261-1284.

19
Lazear, E.P. (1999). Personnel economics: past lessons and future directions. Journal of Labor Economics
17(2), 199-236.
Lazear, E.P. (2000). Performance pay and productivity. American Economic Review 90(5), 1346-1361.
Lazear, E.P., and Oyer, P. (2007). Personnel economics. Handbook of Organizational Economics
(forthcoming) (NBER Working Paper No. 13480).
Lazear, E.P., and Shaw, K.L. (2007). Personnel economics: the economist's view of human resources.
Journal of Economic Perspectives 21(4), 91-114.
Murphy, K.J. (1999). Executive compensation. Handbook of Labor Economics 3B, 2485-2563.
Oettinger, G.S. (2001). Do piece rates influence effort choices? Evidence from stadium vendors.
Economics Letters 73(1), 117-123.
Oyer, P., and Schaefer, S. (2010). Personnel economics: hiring and incentives. Handbook of Labor
Economics 4B (forthcoming) (NBER Working Paper No. 15977).
Paarsch, H.J., and Shearer, B. (2000). Piece rates, fixed wages, and incentive effects: statistical evidence
from payroll records. International Economic Review 41(1), 59-92.
Pfeifer, C. (2008). An empirical note on wages in an internal labour market. Economics Letters 99(3),
570-573.
Pfeifer, C. (2010). Work effort during and after employment probation: evidence from German personnel
data. Jahrbücher für Nationalökonomie und Statistik 230(1), 77-91.
Pfeifer, C., and Sohr, T. (2009). Analysing the gender wage gap (GWG) using personnel records.
LABOUR 23(2), 257-282.
Prendergast, C. (1999). The provision of incentives in firms. Journal of Economic Literature 37(1), 7-63.
Rebitzer, J.B., and Taylor, L.J. (2010). Extrinsic rewards and intrinsic motives: standard and behavioral
approaches to agency and labor markets. Handbook of Labor Economics 4A (forthcoming) (IZA
Discussion Paper No. 5058).
Shapiro, C., and Stiglitz, J.E. (1984). Equilibrium unemployment as a worker discipline device. American
Economic Review 74(3), 433-444.

20
Shearer, B. (2004). Piece rates, fixed wages, and incentive effects: evidence from a field experiment.
Review of Economic Studies 71(2), 513-534.
Winkelmann, R. (1999). Wages, firm size and absenteeism. Applied Economics Letters 6, 337-341.
Winkelmann, R. (2008). Econometric analysis of count data. 5th edition. Springer: Berlin, Heidelberg.

21
Figures and Tables Included in Text
Table 1: Definitions and pooled summary statistics of variables
Variable name Definition Mean Std. dev. Min. Max. W_TOTAL Yearly total income (Euros, nominal gross) 85719.5200 23368.4800 24801.2800 237031.5000 log_W_TOTAL log of W_TOTAL 11.3300 0.2295 10.1187 12.3760 W_FIXED Yearly fixed base salary (Euros, nominal gross) 71606.7600 16570.4400 18697.8000 170563.5000 log_W_FIXED log of W_FIXED 11.1560 0.2096 9.8362 12.0469 W_BONUS Yearly bonus payments (Euros, nominal gross) 14112.7700 8501.6460 3658.0400 74299.7000 log_W_BONUS log of W_BONUS 9.4330 0.4641 8.2047 11.2159 MBO_MAX Yearly agreed max. MBO bonus (Euros, nominal gross) 12017.6400 8973.4070 2045.1700 60000.0000 log_MBO_MAX Log of MBO_MAX 9.1603 0.6861 7.6232 11.0021 ABSENTDAYS Absent days from work in calendar year 3.9137 7.0295 0 48 AGE Age in years 48.8499 7.1859 28.8548 64.1753 TENURE Tenure in years 16.9844 9.8100 1.0000 42.7808 FEMALE Female (dummy) 0.0762 0.2655 0 1 LEVEL1 Lowest management level (dummy, reference group) 0.5416 0.4986 0 1 LEVEL2 Middle management level (dummy) 0.3961 0.4894 0 1 LEVEL3 Highest management level (dummy) 0.0623 0.2419 0 1 YEAR2000 Year 2000 (dummy, reference group) 0.1524 0.3596 0 1 YEAR2001 Year 2001 (dummy) 0.1593 0.3662 0 1 YEAR2002 Year 2002 (dummy) 0.1676 0.3738 0 1 YEAR2003 Year 2003 (dummy) 0.1731 0.3786 0 1 YEAR2004 Year 2004 (dummy) 0.1717 0.3774 0 1 YEAR2005 Year 2005 (dummy) 0.1759 0.3810 0 1 Notes: 722 yearly observations of 177 managers in unbalanced panel.
22
Table 2: Means by management levels
LEVEL1 LEVEL2 LEVEL3 Complete sample W_TOTAL 75188.68 90113.96 149291.77 85719.52 W_FIXED 63797.98 75599.24 114081.87 71606.76 W_BONUS 11390.70 14514.72 35209.90 14112.77 W_BONUS / W_TOTAL 0.15 0.16 0.23 0.16 MBO_MAX 9075.26 12527.89 34340.82 12017.64 MBO_MAX / W_TOTAL 0.12 0.14 0.23 0.13 ABSENTDAYS 3.76 4.22 3.34 3.91 AGE 47.38 50.73 49.61 48.85 TENURE 15.32 19.57 15.03 16.98 FEMALE 0.10 0.05 0.00 0.08

23
Table 3: Determinants of total income, fixed base salary, paid bonus, and agreed MBO bonus
(1) log_W_TOTAL
(2) log_W_FIXED
(3) log_W_BONUS
(4) log_MBO_MAX
AGE 0.0026 0.0051** -0.0090** -0.0132** (0.0020) (0.0020) (0.0041) (0.0067)
TENURE -0.0025* -0.0024 -0.0035 -0.0136*** (0.0015) (0.0015) (0.0030) (0.0049)
FEMALE -0.1754*** -0.1816*** -0.1181 -0.0226 (0.0422) (0.0426) (0.0831) (0.1383)
LEVEL2 0.1323*** 0.0944*** 0.3291*** 0.3720*** (0.0165) (0.0154) (0.0413) (0.0522)
LEVEL3 0.4852*** 0.3870*** 0.9655*** 0.9635*** (0.0345) (0.0326) (0.0818) (0.1098)
YEAR2001 0.0726*** 0.0479*** 0.2039*** 0.1366*** (0.0089) (0.0080) (0.0288) (0.0277)
YEAR2002 0.0586*** 0.0558*** 0.0629** 0.3019*** (0.0093) (0.0084) (0.0293) (0.0290)
YEAR2003 0.0902*** 0.0693*** 0.1882*** 0.3569*** (0.0100) (0.0092) (0.0304) (0.0314)
YEAR2004 0.1436*** 0.0983*** 0.3791*** 0.4584*** (0.0108) (0.0100) (0.0315) (0.0342)
YEAR2005 0.1948*** 0.1229*** 0.5422*** 0.5358*** (0.0117) (0.0110) (0.0326) (0.0371)
CONSTANT 11.0845*** 10.8315*** 9.5323*** 9.5786*** (0.0819) (0.0823) (0.1639) (0.2677)
R² (overall) 0.5988 0.5267 0.5063 0.4289 Number of observations 722 722 722 722 Number of managers 177 177 177 177 Notes: Coefficients of random effects GLS estimates. Standard errors in parentheses. Significant at * 10%, ** 5%, and *** 1%.

24
05
00
01
00
00
15
00
02
00
00
25
00
03
00
00
pre
dic
ted
ye
arly
va
lue
s in
Eu
ros
(bo
nu
s)
30
00
04
00
00
50
00
06
00
00
70
00
08
00
00
90
00
0
pred
icte
d ye
arly
va
lues
in E
uro
s (t
ota
l, ba
se)
30 40 50 60
age in years
predicted total income - age - profile (Euros)
predicted base salary - age - profile (Euros)
predicted paid total bonus - age - profile (Euros)
predicted max. MBO bonus - age - profile (Euros)
Figure 1: Predicted nonlinear age profiles for an average manager

25
Table 4: Effects of fixed base salary and agreed MBO bonus on number of absent working days
(1) RE for
unbalanced panel (2) FE for
unbalanced panel (3) RE for
balanced panel (4) FE for
balanced panel log_W_FIXED 0.3534 0.2896 0.8661 0.8586
(0.4562) (0.6616) (0.7497) (1.0386) log_MBO_MAX -0.3407*** -0.3903** -0.5905*** -0.6056***
(0.1192) (0.1650) (0.1748) (0.2148) AGE 0.0138 0.0057 0.0401** 0.0096
(0.0120) (0.0190) (0.0187) (0.0272) TENURE 0.0023 -0.0062 -0.0373*** -0.0452**
(0.0084) (0.0137) (0.0130) (0.0190) FEMALE 0.0005 0.2093 0.8080* 0.5563
(0.2489) (0.3958) (0.4123) (0.5313) LEVEL2 -0.1486 -0.0990 0.5082** 0.3609
(0.1649) (0.2413) (0.2431) (0.3139) LEVEL3 0.1601 0.4972 1.0693 1.2608
(0.3841) (0.6122) (0.7118) (1.0267) YEAR2001 0.1626 0.1192 0.0844 0.1648
(0.1811) (0.1877) (0.2130) (0.2174) YEAR2002 0.0894 0.1123 0.0707 0.1398
(0.1846) (0.1947) (0.2266) (0.2354) YEAR2003 0.2235 0.2876 0.0731 0.2187
(0.1844) (0.2033) (0.2398) (0.2571) YEAR2004 -0.0128 0.0454 -0.0746 0.1079
(0.1957) (0.2156) (0.2511) (0.2758) YEAR2005 0.2494 0.3724 0.4040 0.6040**
(0.2001) (0.2278) (0.2508) (0.2851) CONSTANT -2.5719 -0.7883 -6.8513 -4.8741
(4.9795) (7.0995) (7.9102) (10.7573) Log likelihood -1571.6722 -940.9076 -909.8404 -620.8626 AIC 3173.3445 1907.8151 1849.6808 1267.7252 BIC 3242.0748 1964.9969 1910.0688 1319.0835 Number of observations 722 601 414 384 Number of managers 177 126 69 64 Notes: Coefficients of random effects and conditional fixed effects negative binomial (overdispersion) models for ABSENTDAYS. Standard errors in parentheses. Significant at * 10%, ** 5%, and *** 1%.

Working Paper Series in Economics (recent issues)
No.258: Daniel Fackler, Claus Schnabel, and Joachim Wagner: Lingering illness or sudden death? Pre-exit employment developments in German establishments, December 2012
No.257: Horst Raff and Joachim Wagner: Productivity and the Product Scope of Multi-product Firms: A Test of Feenstra-Ma, December 2012
No.256: Christian Pfeifer and Joachim Wagner: Is innovative firm behavior correlated with age and gender composition of the workforce? Evidence from a new type of data for German enterprises, December 2012
No.255: Maximilian Benner: Cluster Policy as a Development Strategy. Case Studies from the Middle East and North Africa, December 2012
No.254: Joachim Wagner und John P. Weche Gelübcke: Firmendatenbasiertes Benchmarking der Industrie und des Dienstleistungssektors in Niedersachsen – Methodisches Konzept und Anwendungen (Projektbericht), Dezember 2012
No.253: Joachim Wagner: The Great Export Recovery in German Manufacturing Industries, 2009/2010, November 2012
No.252: Joachim Wagner: Daten des IAB-Betriebspanels und Firmenpaneldaten aus Erhebungen der Amtlichen Statistik – substitutive oder komplementäre Inputs für die Empirische Wirtschaftsforschung?, Oktober 2012
No.251: Joachim Wagner: Credit constraints and exports: Evidence for German manufacturing enterprises, October 2012
No.250: Joachim Wagner: Productivity and the extensive margins of trade in German manufacturing firms: Evidence from a non-parametric test, September 2012 [published in: Economics Bulletin 32 (2012), 4, 3061-3070]
No.249: John P. Weche Gelübcke: Foreign and Domestic Takeovers in Germany: First Comparative Evidence on the Post-acquisition Target Performance using new Data, September 2012
No.248: Roland Olbrich, Martin Quaas, and Stefan Baumgärtner: Characterizing commercial cattle farms in Namibia: risk, management and sustainability, August 2012
No.247: Alexander Vogel and Joachim Wagner: Exports, R&D and Productivity in German Business Services Firms: A test of the Bustos-model, August 2012
No.246: Alexander Vogel and Joachim Wagner: Innovations and Exports of German Business Services Enterprises: First evidence from a new type of firm data, August 2012
No.245: Stephan Humpert: Somewhere over the Rainbow: Sexual Orientation Discrimination in Germany, July 2012
No.244: Joachim Wagner: Exports, R&D and Productivity: A test of the Bustos-model with German enterprise data, June 2012 [published in: Economics Bulletin, 32 (2012), 3, 1942-1948]
No.243: Joachim Wagner: Trading many goods with many countries: Exporters and importers from German manufacturing industries, June 2012 [published in: Jahrbuch für Wirtschaftswissenschaften/Review of Economics, 63 (2012), 2, 170-186]
No.242: Joachim Wagner: German multiple-product, multiple-destination exporters: Bernard-Redding-Schott under test, June 2012 [published in: Economics Bulletin, 32 (2012), 2, 1708-1714]

No.241: Joachim Fünfgelt and Stefan Baumgärtner: Regulation of morally responsible agents with motivation crowding, June 2012
No.240: John P. Weche Gelübcke: Foreign and Domestic Takeovers: Cherry-picking and Lemon-grabbing, April 2012
No.239: Markus Leibrecht and Aleksandra Riedl: Modelling FDI based on a spatially augmented gravity model: Evidence for Central and Eastern European Countries, April 2012
No.238: Norbert Olah, Thomas Huth und Dirk Löhr: Monetarismus mit Liquiditätsprämie Von Friedmans optimaler Inflationsrate zur optimalen Liquidität, April 2012
No.237: Markus Leibrecht and Johann Scharler: Government Size and Business Cycle Volatility; How Important Are Credit Contraints?, April 2012
No.236: Frank Schmielewski and Thomas Wein: Are private banks the better banks? An insight into the principal-agent structure and risk-taking behavior of German banks, April 2012
No.235: Stephan Humpert: Age and Gender Differences in Job Opportunities, March 2012
No.234: Joachim Fünfgelt and Stefan Baumgärtner: A utilitarian notion of responsibility for sustainability, March 2012
No.233: Joachim Wagner: The Microstructure of the Great Export Collapse in German Manufacturing Industries, 2008/2009, February 2012
No.232: Christian Pfeifer and Joachim Wagner: Age and gender composition of the workforce, productivity and profits: Evidence from a new type of data for German enterprises, February 2012
No.231: Daniel Fackler, Claus Schnabel, and Joachim Wagner: Establishment exits in Germany: the role of size and age, February 2012
No.230: Institut für Volkswirtschaftslehre: Forschungsbericht 2011, January 2012
No.229: Frank Schmielewski: Leveraging and risk taking within the German banking system: Evidence from the financial crisis in 2007 and 2008, January 2012
No.228: Daniel Schmidt and Frank Schmielewski: Consumer reaction on tumbling funds – Evidence from retail fund outflows during the financial crisis 2007/2008, January 2012
No.227: Joachim Wagner: New Methods for the Analysis of Links between International Firm Activities and Firm Performance: A Practitioner’s Guide, January 2012
No.226: Alexander Vogel and Joachim Wagner: The Quality of the KombiFiD-Sample of Business Services Enterprises: Evidence from a Replication Study, January 2012 [published in: Schmollers Jahrbuch/Journal of Applied Social Science Studies 132 (2012), 3, 379-392]
No.225: Stefanie Glotzbach: Environmental justice in agricultural systems. An evaluation of success factors and barriers by the example of the Philippine farmer network MASIPAG, January 2012
No.224: Joachim Wagner: Average wage, qualification of the workforce and export performance in German enterprises: Evidence from KombiFiD data, January 2012 [published in: Journal for Labour Market Research, 45 (2012), 2, 161-170]
No.223: Maria Olivares and Heike Wetzel: Competing in the Higher Education Market: Empirical Evidence for Economies of Scale and Scope in German Higher Education Institutions, December 2011
No.222: Maximilian Benner: How export-led growth can lead to take-off, December 2011

No.221: Joachim Wagner and John P. Weche Gelübcke: Foreign Ownership and Firm Survival: First evidence for enterprises in Germany, December 2011
No.220: Martin F. Quaas, Daan van Soest, and Stefan Baumgärtner: Complementarity, impatience, and the resilience of natural-resource-dependent economies, November 2011
No.219: Joachim Wagner: The German Manufacturing Sector is a Granular Economy, November 2011 [published in: Applied Economics Letters, 19(2012), 17, 1663-1665]
No.218: Stefan Baumgärtner, Stefanie Glotzbach, Nikolai Hoberg, Martin F. Quaas, and Klara Stumpf: Trade-offs between justices , economics, and efficiency, November 2011
No.217: Joachim Wagner: The Quality of the KombiFiD-Sample of Enterprises from Manufacturing Industries: Evidence from a Replication Study, November 2011 [published in: Schmollers Jahrbuch/Journal of Applied Social Science Studies 132 (2012), 3, 393-403]
No.216: John P. Weche Gelübcke: The Performance of Foreign Affiliates in German Manufacturing: Evidence from a new Database, November 2011
No.215: Joachim Wagner: Exports, Foreign Direct Investments and Productivity: Are services firms different?, September 2011
No.214: Stephan Humpert and Christian Pfeifer: Explaining Age and Gender Differences in Employment Rates: A Labor Supply Side Perspective, August 2011
No.213: John P. Weche Gelübcke: Foreign Ownership and Firm Performance in German Services: First Evidence based on Official Statistics, August 2011 [forthcoming in: The Service Industries Journal]
No.212: John P. Weche Gelübcke: Ownership Patterns and Enterprise Groups in German Structural Business Statistics, August 2011 [published in: Schmollers Jahrbuch / Journal of Applied Social Science Studies, 131(2011), 4, 635-647]
No.211: Joachim Wagner: Exports, Imports and Firm Survival: First Evidence for manufacturing enterprises in Germany, August 2011
No.210: Joachim Wagner: International Trade and Firm Performance: A Survey of Empirical Studies since 2006, August 2011 [published in: Review of World Economics, 2012, 148 (2), 235-267]
No.209: Roland Olbrich, Martin F. Quaas, and Stefan Baumgärtner: Personal norms of sustainability and their impact on management – The case of rangeland management in semi-arid regions, August 2011
No.208: Roland Olbrich, Martin F. Quaas, Andreas Haensler and Stefan Baumgärtner: Risk preferences under heterogeneous environmental risk, August 2011
No.207: Alexander Vogel and Joachim Wagner: Robust estimates of exporter productivity premia in German business services enterprises, July 2011 [published in: Economic and Business Review, 13 (2011), 1-2, 7-26]
No.206: Joachim Wagner: Exports, imports and profitability: First evidence for manufacturing enterprises, June 2011 [published in: Open Economies Review 23 (2012), 5, 747-765]
No.205: Sebastian Strunz: Is conceptual vagueness an asset? Resilience research from the perspective of philosophy of science, May 2011
(see www.leuphana.de/institute/ivwl/publikationen/working-papers.html for a complete list)

Leuphana Universität Lüneburg
Institut für Volkswirtschaftslehre
Postfach 2440
D-21314 Lüneburg
Tel.: ++49 4131 677 2321
email: [email protected]
www.leuphana.de/institute/ivwl/publikationen/working-papers.html