Base Rates Of Cognitive And Academic Weaknesses
74
University of South Carolina University of South Carolina Scholar Commons Scholar Commons Theses and Dissertations 6-30-2016 Base Rates Of Cognitive And Academic Weaknesses Base Rates Of Cognitive And Academic Weaknesses Allison L. Stafford University of South Carolina Follow this and additional works at: https://scholarcommons.sc.edu/etd Part of the Arts and Humanities Commons, and the Psychology Commons Recommended Citation Recommended Citation Stafford, A. L.(2016). Base Rates Of Cognitive And Academic Weaknesses. (Master's thesis). Retrieved from https://scholarcommons.sc.edu/etd/3463 This Open Access Thesis is brought to you by Scholar Commons. It has been accepted for inclusion in Theses and Dissertations by an authorized administrator of Scholar Commons. For more information, please contact [email protected].
Transcript of Base Rates Of Cognitive And Academic Weaknesses

University of South Carolina University of South Carolina
Scholar Commons Scholar Commons
Theses and Dissertations
6-30-2016
Base Rates Of Cognitive And Academic Weaknesses Base Rates Of Cognitive And Academic Weaknesses
Allison L. Stafford University of South Carolina
Follow this and additional works at: https://scholarcommons.sc.edu/etd
Part of the Arts and Humanities Commons, and the Psychology Commons
Recommended Citation Recommended Citation Stafford, A. L.(2016). Base Rates Of Cognitive And Academic Weaknesses. (Master's thesis). Retrieved from https://scholarcommons.sc.edu/etd/3463
This Open Access Thesis is brought to you by Scholar Commons. It has been accepted for inclusion in Theses and Dissertations by an authorized administrator of Scholar Commons. For more information, please contact [email protected].
BASE RATES OF COGNITIVE AND ACADEMIC WEAKNESSES
by
ALLISON L. STAFFORD
Bachelor of Arts
Christopher Newport University, 2013
Submitted in Partial Fulfillment of the Requirements
For the Degree of Master of Arts in
School Psychology
College of Arts and Sciences
University of South Carolina
2016
Accepted by:
Scott L. Decker, Director of Thesis
Mark D. Weist, Reader
Lacy Ford, Senior Vice Provost and Dean of Graduate Studies

ii
© Copyright by Allison L. Stafford, 2016
All Rights Reserved

iii
ACKNOWLEDGEMENTS
I would like to acknowledge the school psychology faculty, especially Dr. Scott
Decker and Dr. Mark Weist for their guidance and support throughout the completion of
this thesis and my Masters degree. I would also like to thank Riverside Publishing for
their permission to utilize the Woodcock Johnson normative data for this study.
iv
ABSTRACT
The identification of learning disabilities is critical for receiving intervention
services; however, special education eligibility criteria often varies across districts,
resulting in large variations in identification rates. (Hallahan, Keller, & Ball, 1986;
Scruggs & Mastropieri, 2002; Reschly & Hosp, 2004; Maki, Floyd & Roberson, 2015). A
new method for identifying learning disabilities, patterns of strengths and weaknesses
(PSW), has risen in popularity as a method for assessing and informing interventions for
students with learning disabilities. Despite the growing popularity of PSW approaches,
little is known about the prevalence of cognitive and academic weaknesses in the
population (Miciak, Fletcher, Stuebing, Vaughn, & Tolar, 2014). The current study
sought to fill this gap by examining the base rates of cognitive and academic weaknesses
using the normative sample of the Woodcock-Johnson, Fourth Edition. Additionally, the
study examined the effect of differences in assessment methodology on the base rates of
cognitive and academic weaknesses; and explored how the Integrated Assessment
Intervention model could be used for children with specific learning disabilities (Decker,
2012).

v
TABLE OF CONTENTS
ACKNOWLEDGMENTS ................................................................................................. iii
ABSTRACT ...................................................................................................................... iv
LIST OF TABLES ............................................................................................................. vi
CHAPTER ONE: OVERVIEW OF SPECIAL EDUCATION ELIGIBILITY ....................1
CHAPTER TWO: ASSESSMENT OF LEARNING DISABILITIES ................................9
CHAPTER THREE: METHODS ......................................................................................21
CHAPTER FOUR: RESULTS ...........................................................................................26
CHAPTER FIVE: DISCUSSION ......................................................................................52
REFERENCES ..................................................................................................................59
vi
LIST OF TABLES
Table 1.1 Wechsler’s Intelligence Classification According to IQ......................................8
Table 3.1 WJ-IV Cognitive Subtests...................................................................................25
Table 4.1 Cognitive Weaknesses for the WJ CHC Extended Battery ................................33
Table 4.2 Cognitive Weaknesses using the WJ-IV Cog Standard Battery .........................34
Table 4.3 WJ-IV Achievement standard battery: Broad Achievement ..............................35
Table 4.4 WJ-IV Standard Battery: Cut-off score of 90 ....................................................36
Table 4.5 WJ-IV Extended Battery: Cut-off Score of 90 ....................................................37
Table 4.6 WJ-IV Standard Battery: Cut-off score of 85 ....................................................38
Table 4.7 WJ-IV Extended Battery: Cut-off Score of 85 ....................................................39
Table 4.8 WJ-IV Standard Battery: Cut-off score of 80 ....................................................40
Table 4.9 WJ-IV Extended Battery: Cut-off Score of 80 ....................................................41
Table 4.10 WJ-IV Standard Battery: Cut-off score of 75 ..................................................42
Table 4.11 WJ-IV Extended Battery: Cut-off Score of 80 ..................................................43
Table 4.12 Integrated Assessment Intervention Model ......................................................44

vii
LIST OF FIGURES
Figure 4.1 WJ Cognitive Standard Battery, Cut off Score of 90 ........................................47
Figure 4.2 WJ Cognitive Standard Battery, Cut off Score of 85 ........................................48
Figure 4.3 WJ Cognitive Standard Battery, Cut off Score of 80 ........................................49
Figure 4.4 WJ Cognitive Standard Battery, Cut off Score of 75 ........................................50
Figure 4.5 Prevalence rates of cognitive weaknesses ........................................................51
1
CHAPTER ONE:
OVERVIEW OF SPECIAL EDUCATION ELIGIBILITY
The creation of special education legislation in the United States (U.S.) was an
important landmark for students who have been stigmatized as different, and in many
cases “uneducable” based on their ability level (Artiles & Bal, 2008). The Education of
All Handicapped Children Act of 1975, currently enacted as the Individual with
Disabilities Education Act (IDEA), was designed to protect the educational rights of all
students with disabilities, creating regulations for special education (Dean, Burns,
Grialou, & Varro, 2006). While IDEA regulates certain criteria for special education
eligibility, the process of referral and identification for special education in the U.S.
varies greatly depending on the school district policies (Hallahan & Kauffman, 1994).
With the introduction of this legislation, the number of children enrolled in special
education has risen from 3,694,000 in 1976 to 6,401,000 students in 2011 (NCES, 2015).
Over the past 10 years, the number of U.S. students enrolled in special education
programs has risen 30 percent. Currently, approximately 13.5 percent of all students in
K–12 schools receive special education services (NEA, 2007).
Special Education Funding and Identification
Special education in the U.S. is currently funded by a combination of federal,
state and local governments. From 1999-2000 the U.S. spent a total of $77.3 billion on

2
special education services (Aron & Loprest, 2012). The federal government spent a total
of $12.5 billion, leaving the majority of the funding up to the states (Jones, 2002). The
increase in special education enrollment has caused problems for government agencies,
which already are on small budgets. Special education costs are influenced by both
eligibility criteria for disabilities, as well as the instructional and administrative costs per
student, which can cost 1.9 times more for students in special education than students in
general education. Special education costs are influenced by both the eligibility criteria
for disabilities, as well as the budget the district has for instructional and administrative
costs per student (Chaikind, Danielson, Brauen, 1993). Due to the cost of services, the
over identification of students can cause potential problems at a systems level. Therefore,
the rise of students who are eligible for special education services has been a source of
concern for policymakers. Education systems can only feasibly serve a certain number of
students in special education due to current budget and administrative limitations
(National Research Council, 2002; Harry & Klingner, 2006). In order to feasibly serve
students in special education, educators need to have clearly defined eligibility criteria
and assessment methodology that will identify the number of students they can
realistically serve in special education.
Intellectual and Cognitive Assessment
Today, intellectual assessments have become critical for eligibility requirements
in special education. Current estimates report that approximately 1-1.8 million
intelligence tests are administered to children each year in the U.S. (Hale & Fiorello,
2004). Despite the overwhelming importance of intelligence tests, intellectual
assessments are a relatively new field. Alfred Binet created the first intelligence test in
3
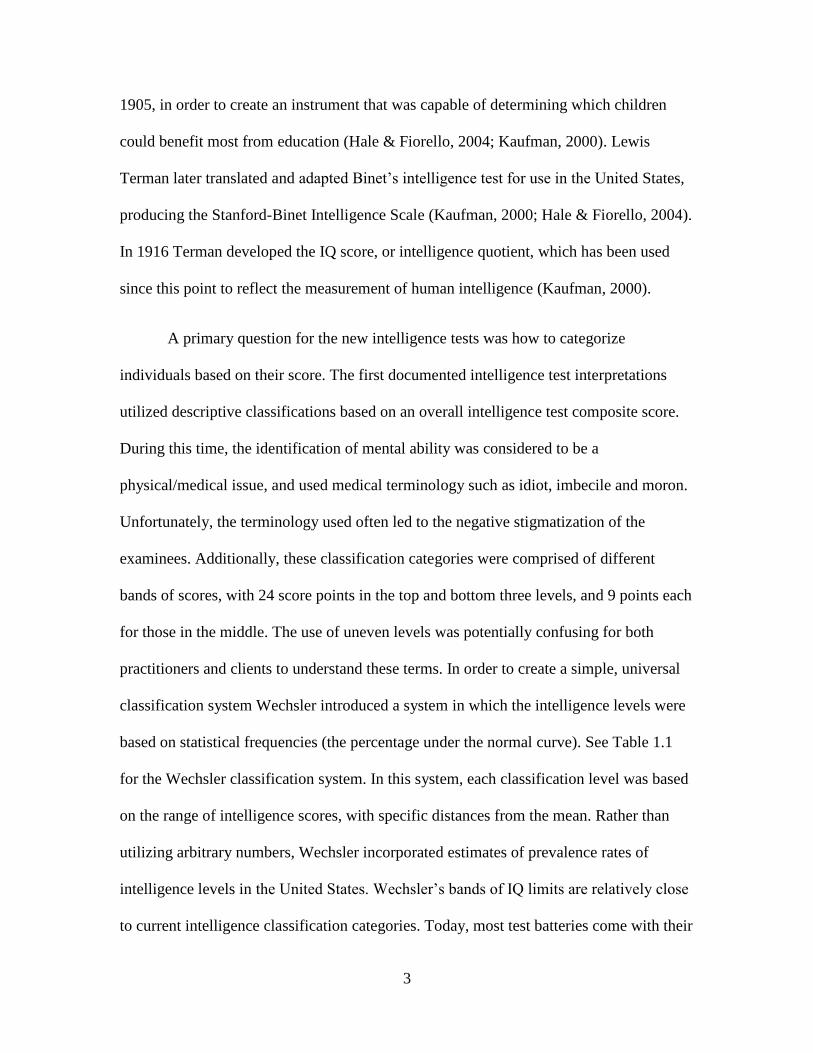
1905, in order to create an instrument that was capable of determining which children
could benefit most from education (Hale & Fiorello, 2004; Kaufman, 2000). Lewis
Terman later translated and adapted Binet’s intelligence test for use in the United States,
producing the Stanford-Binet Intelligence Scale (Kaufman, 2000; Hale & Fiorello, 2004).
In 1916 Terman developed the IQ score, or intelligence quotient, which has been used
since this point to reflect the measurement of human intelligence (Kaufman, 2000).
A primary question for the new intelligence tests was how to categorize
individuals based on their score. The first documented intelligence test interpretations
utilized descriptive classifications based on an overall intelligence test composite score.
During this time, the identification of mental ability was considered to be a
physical/medical issue, and used medical terminology such as idiot, imbecile and moron.
Unfortunately, the terminology used often led to the negative stigmatization of the
examinees. Additionally, these classification categories were comprised of different
bands of scores, with 24 score points in the top and bottom three levels, and 9 points each
for those in the middle. The use of uneven levels was potentially confusing for both
practitioners and clients to understand these terms. In order to create a simple, universal
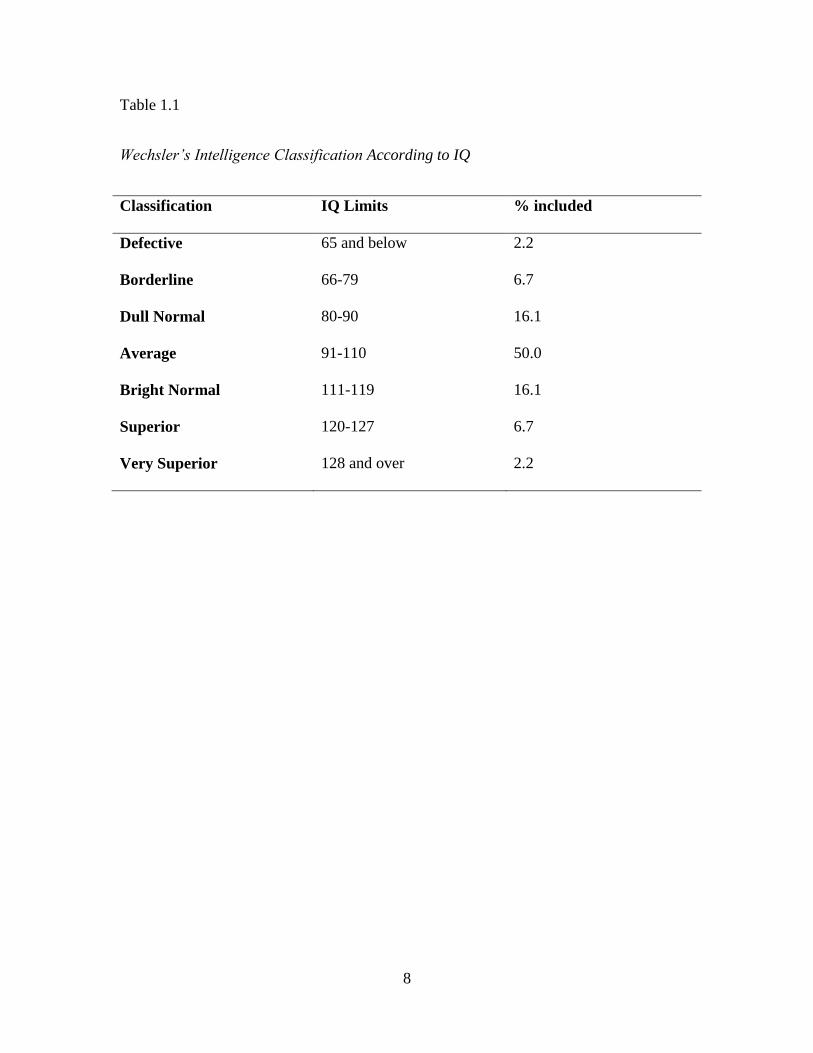
classification system Wechsler introduced a system in which the intelligence levels were
based on statistical frequencies (the percentage under the normal curve). See Table 1.1
for the Wechsler classification system. In this system, each classification level was based
on the range of intelligence scores, with specific distances from the mean. Rather than
utilizing arbitrary numbers, Wechsler incorporated estimates of prevalence rates of
intelligence levels in the United States. Wechsler’s bands of IQ limits are relatively close
to current intelligence classification categories. Today, most test batteries come with their
4
own classification schemes in the test manuals. These systems are generally based on the
deviation from a mean of 100, providing consistency for most intelligence tests
(Kamphaus, Winsor, Rowe, & Kim, 2012).
Identification of Learning Disabilities
The recognition of learning disabilities in schools began approximately 100 years
ago when teachers saw that some children who appeared to be intelligent had great
difficulty learning how to read. This condition was investigated by physicians, who
described it with terms such as word blindness, strephosymbolia, dyslexia, and learning
disability. The term learning disabilities began to gain acceptance in the education field
when it was introduced to educators in 1963 by Samuel Kirk. In 1975, learning
disabilities were officially accepted as a recognized disability in the Education for All
Handicapped Children Act (Aaron, Joshi, Gooden & Bentum, 2008). Today, specific
learning disabilities (SLD) are the most common category of disability in special
education in the United States, with 2.4 million public school students in America
identified as having a learning disability (approximately 5% of the population). Learning
disabilities are the most prevalent category of special education, with over 50% of
students in special education served under this category, and 4.8% of all students in
public schools (Heward, 2006). While grouped into a singular category, learning
disabilities represent a heterogeneous set of disabilities. The most common types of
specific learning disabilities are: dyslexia, a specific deficit with phonological processing
that impacts reading; dyscalculia, which is characterized by a specific deficit in
mathematical ability; and dysgraphia, which is characterized by a specific deficit in
written expression (Cortiello & Horowitz, 2014; LDA, 2015).

5
The Individuals with Disabilities Education Act defines specific learning
disability as “a disorder in one or more of the basic psychological processes involved in
understanding or in using language, spoken or written, which disorder may manifest itself
in the imperfect ability to listen, think, speak, read, write, spell or do mathematical
calculations” (IDEA, 2004). This broad definition entails one of the critical components
of a learning disability, as a deficit in a psychological process that manifests in an
academic problem. According to the Diagnostic and Statistical Manual of Mental
Disorders, Fifth Edition (DSM-V), there are four diagnostic criteria that must be met for a
diagnosis of a specific learning disability. Primarily, there must be evidence of
difficulties in reading, writing, arithmetic or mathematical reasoning that have persisted
for at least six months despite interventions that target these difficulties. These deficits
must be quantifiably below those expected for the person’s age, and must cause
difficulties with academic performance or activities of daily living. The learning
difficulties must begin during school-age years, however, these skills may not become
apparent until the demands exceed their skill level. Furthermore, these learning
difficulties must not be better accounted for by intellectual disabilities, vision problems,
neurological or mental disorders, psychosocial adversity, lack of proficiency in the
language of instruction, or inadequate educational instruction (American Psychological
Association [APA], 2013).
Due to the high prevalence of learning disabilities, there has been extensive
research on their development (Kovas, Haworth, Dale, Plomin, Weinberg, Thomson, &
Fischer, 2007; Galaburda, 2005; Buttner & Hasselhorn, 2011). Learning disabilities have
been to found to develop from neurological differences in brain structure, either innate or
6
developed through specific environmental influences (or a combination thereof)
(Cortiello & Horowitz, 2014; Kovas et al., 2007; Galaburda, 2005). A strong genetic
component has been found to exist with individuals with learning disabilities, with
learning disabilities often running in families (Kovas et al., 2007). Prenatal factors such
as maternal illness during pregnancy, drug use during pregnancy, low birth weight,
oxygen deprivation, have also been found to increase the likelihood of the development
of learning disabilities for the child. Furthermore, postnatal factors such as traumatic
injuries, severe nutritional deficiencies or exposure to certain toxins have been found to
be associated with learning disabilities (Cortiello & Horowitz, 2014).
While there was a significant increase in the number of students diagnosed with
learning disabilities between 1976 and 2002, more recently the number of students has
declined (NCES, 2015). Between 2002 and 2011, the number of students identified with
learning disabilities has declined by 18%, while overall special education identification
rates have declined only by three percent. Since 2006, the identification rates of
learning disabilities have declined in all but five states, with decreases by as much as
45%. While there is not a singular cause known for this decline, there are several
possible reasons for the decline of prevalence rates for learning disabilities in the school.
Primarily, this could be due to improvements in reading instruction in general education,
making it less likely for students to experience difficulties with reading. Additionally,
there has been an increase in access to preschool and early screenings and evaluations to
help identify students who need early intervention. Furthermore, changes in the
assessment of learning disabilities may result in more accurate identification, as well as
an increase in students receiving early intervention services. Importantly, this decrease

7
could also be due to students with learning disabilities not receiving special education
services (Cortiello & Horowitz, 2014)
8
Table 1.1
Wechsler’s Intelligence Classification According to IQ
Classification IQ Limits % included
Defective 65 and below 2.2
Borderline 66-79 6.7
Dull Normal 80-90 16.1
Average 91-110 50.0
Bright Normal 111-119 16.1
Superior 120-127 6.7
Very Superior 128 and over 2.2
9
CHAPTER TWO:
ASSESSMENT OF LEARNING DISABILITIES
The official recognition of learning disabilities in public schools created a need
for developing objective and uniform criteria for diagnosis for children in the schools
(Aaron, Joshi, Gooden & Bentum, 2008). Since 1975, the assessment of learning
disabilities has undergone a number of challenges and revisions. Although IDEA
regulations have certain criteria for the LD identification, they do not provide operational
criteria for LD eligibility. As a result, there are varying rates of LD across states as well
as variation in students identified as having LD (Hallahan, Keller, & Ball, 1986; Scruggs
& Mastropieri, 2002; Reschly & Hosp, 2004; Maki, Floyd & Roberson, 2015). Typically,
there are three different methods of assessment: the aptitude/IQ achievement discrepancy
model, response to intervention, and strengths/weaknesses models (Hale & Fiorello,
2004).
Aptitude/IQ Achievement Discrepancy Model
The aptitude/IQ achievement discrepancy model was first proposed in the 1960s
and has historically been the most widely used approach for identifying students with
learning disabilities. In this model, academic achievement is compared with cognitive
aptitude, based on their IQ score. An individual is then identified with a learning
disability if there is a significant discrepancy between their IQ and academic achievement
(Dombrowski & Gischla, 2014). The most commonly used method for determining
10
discrepancies, standard-score discrepancy, calculated the difference between IQ scores
and achievement scores. If the difference between the scores is large enough (and IQ is
higher than achievement), then the child would be identified as having a learning
disability (Meyer, 2000). Currently, 67% of states allow for the use of ability-
achievement discrepancy for determining LD eligibility, 20% of states allow for the use
of discrepancy, and 20% of states prohibit the use of discrepancy. Thirteen percent of
states have no guidelines of whether or not discrepancy can be used for elibility (Maki,
Floyd & Roberson, 2015).
Response to Intervention
A more recent method of eligibility is Response to Intervention (RTI), which was
first implemented in 2004. While this process is not required for special education
identification, it was identified as a potential method of identification of learning
disabilities in the 2004 revision of IDEA. In this process, all students are screened
through a school-wide assessment at least once per year. All students who score below a
certain criterion (usually below the 15th percentile) are then considered for further
intervention. If the team members decide that the child requires intervention services, the
child will receive small-group services. The students’ progress during the intervention
would be monitored. If the student makes little or no progress, the student would then be
assessed and a meeting would be held in order to determine if the student qualifies for
special education services (Burns, 2008). Currently, 16% of states (n =8) require the sole
use of RTI in LD identification, 17% of states (n = 9) allow for the use of RTI in
combination with other identification methods, and the remaining states (n = 34) allow
for the use of RTI as required by IDEA (Maki, Floyd & Roberson, 2015).

11
Patterns of Strengths and Weaknesses
Despite the inclusion of RTI, special education eligibility typically still requires
the use of cognitive assessment for eligibility. In addition to RTI as a method of
eligibility, IDEA also allows an evidence based third method approach to be used in
order to identify students with a learning disability. Despite the relative widespread use of
third method approaches, little is known among school psychologists about the third
method approach to learning disabilities (Flanagan, Fiorello, & Ortiz, 2010). Typically,
third method approaches are considered to be a pattern of strengths and weaknesses
approach (PSW), in which clinicians examine cognitive profiles of individuals and
determine if there is a cognitive weakness that may contribute to their academic
weakness. About 25% of states (n = 14) specify that the PSW approach can be used to
identify LD, another 25% of states (n = 12) do not specify whether or not this approach
can be used, and the other half of states (n = 25) do not allow this approach. Furthermore,
most states (n = 23) that allow for this method do not provide further guidance on specific
policies and procedures related to this method (Maki, Floyd & Roberson, 2015). There
are three models used in patterns of strength and weaknesses approaches: Naglieri’s
Discrepancy/Consistency Model, Flanagan’s Operational Definition of SLD, and Hale &
Fiorello’s Concordance-Discordance model of SLD. All of the third-method approaches
discuss a link between achievement deficits and a cognitive weakness, in an otherwise
normal cognitive profile (Flanagan, Fiorello, & Ortiz, 2010). However, differences
among them include differences in exclusionary factors for LD identification, different
thresholds for achievement and cognitive deficits, as well as the methods utilized to
establish a discrepancy (Miciak, Fletcher, Stuebing, Vaughn, & Tolar, 2014).
12
In 1999 Naglieri developed one of the first methods of patterns and strengths and
weaknesses, the Discrepancy/Consistency model. This method was developed in
association with the Cognitive Assessment System (CAS) and is based on the Planning,
Attention, Simultaneous and Successive (PASS) intelligence theory. This approach
examines whether the within-child variability is greater than expected. Therefore, the
goal of the evaluation is to determine if there are cognitive weaknesses associated with
the presentation of the disorder, as well as cognitive strengths in unrelated areas
(Flanagan, Fiorello, Ortiz, 2010).
Another third-method approach is the “Operational Definition of SLD” created by
Flanagan and colleagues (2002). According to this approach, there are three levels of
evaluation design to identify normative strengths and weaknesses in academic and
cognitive abilities. On the first level, there are exclusionary factors, such as mental
disorders, behavior, problems, or cultural/linguistic differences that should first be
evaluated in order to determine if the child’s performance is due to noncognitive factors
(Flanagan, Fiorello, Ortiz, 2010). The child should have an average ability profile with a
below average aptitude-achievement discrepancy. For example, the child should have a
deficit in a cognitive area that is consistent with the academic weakness. Flanagan and
colleagues define a standard score of less than 90 as a cognitive weakness (Miciak,
Fletcher, Stuebing, Vaughn & Tolar, 2014).
Most recently, Hale and Fiorello proposed the Concordance-Discordance model
of SLD determination, a third PSW approach. This model emphasizes the need to collect
data from multiple sources and multiple methods in order to ensure validity. Similar to
other methods, the goal of the model is to determine if there is concordance between a
13
cognitive and academic deficit. Additionally, there should be a discordant cognitive
strength that is not associated with the specific academic deficit (Flanagan, Fiorello, &
Ortiz, 2010). In this model, the determination of concordance and discordance is based on
a threshold for significant differences. The thresholds are based on a calculation of either
the standard error of the difference or standard error of the residual (Miciak, Fletcher,
Stuebing, Vaughn, & Tolar, 2014).
Criticisms of Learning Disability Assessment Methodology
The use of IQ/achievement discrepancy, RTI, and PSW approaches for learning
disability eligibility criteria have been criticized for the assessment methodology used, as
well as the potential over identification of students. Primarily, the IQ-Achievement
discrepancy model has been subject to numerous criticisms by school psychologists and
educators (Spencer et al., 2014; Dombrowski & Gischla, 2014, Meyer, 2000). Current
research has provided evidence that this approach does not accurately differentiate
individuals with a learning disability versus individuals who do not have a learning
disability, who may have similar symptoms in disorders such as ADHD (Dombrowki &
Gishla, 2014). Additionally, this method has been shown to have psychometrical flaws,
proven in multiple research studies (Dombrowski & Gischla, 2014; Spencer et al., 2014).
Unfortunately, there was not any agreement between states on what threshold the
difference needed to be in order for a child to qualify. Around one-third of states required
a standard deviation difference (15 points), another third required a 1.5 standard deviation
difference (20 points), and the other third required various amounts. This lack of
consistency across states meant that children may qualify in one state, but not in another

14
(or vice versa) (Meyer, 2000).Importantly, this model also does not provide any resources
for informing instruction or interventions (Spencer et al., 2014).
After implementation of the discrepancy model, educators began to classify many
students whose ability and performance were not congruent as having a learning
disability. Thus, the number of students with a learning disability continued to increase,
worrying policymakers due to worries of increased cost and misclassification. Due to
concerns about the identification of learning disabilities, RTI was offered as an
alternative method of assessment in 2004 (Turnbull, 2004). While RTI holds potential,
RTI has not been established as a reliable and valid method of LD identification, and
there are several other problems with this approach. For instance, this approach makes
the assumption that if a child does not respond to intervention, it is due to a disability
inherit within the child. However, this could be due to other contextual factors such as the
quality of instruction, integrity of implementation, or environmental factors influencing
the child. Furthermore, there is not a clearly defined method for determining what
unresponsiveness is, leaving this interpretation to the educators on a case by case basis
(Dombrowski & Gischla, 2014). Expected performance levels or growth rates are not
given a specific criterion by legislators or in the research literature. Fuchs and Fuchs
(2001) proposed using a 1 standard deviation between the student’s performances
compared to their peers for eligibility determination; however, practices may differ
greatly among school psychologists. Furthermore, there has not been any research on the
impact of eligibility criteria used on the number of students identified for RTI eligibility.
While research has suggested that RTI results in improvements in student outcomes and
reduces the number of students receiving special education, the use of RTI for special
15
education eligibility has not been validated in the literature. Therefore, it is currently
unclear whether RTI identifies students correctly with a learning disability, or if it
identifies all low achievers as having a learning disability (Maki, Floyd, & Roberson,
2015).
A third method of identification, PSW approaches, became common as the result
of criticisms of the IQ/achievement discrepancy and RTI models. Although the PSW
approach has become a popular method of identification of learning disabilities, there are
concerns that it may over identifying children with learning disabilities (Stuebing, 2012).
One problem associated with this method is that the assessment methodology used to
determine cognitive weaknesses as well as the base rates of cognitive weaknesses, have
not been validated in the literature. Currently, there have not been empirical studies that
support the reliability and validity of LD identification through a PSW approach.
Additionally, simulation studies have found that the different models result in different
LD identification decisions (Maki, Floyd & Roberson, 2015; Spencer, 2014).
Despite the importance of cognitive testing for learning disability eligibility, there
are large variations in the methods used to determine cognitive weaknesses. Cutoff scores
are scores used in order to divide a test score into two or more categories, typically
identifying a score as below average, average or above average. Typically, cutoff scores
based on standard scores are used to determine whether performance is in the normal
range. There is not one cut off score used, instead practitioners typically use cut off
scores based on the distribution of scores used with the measure (Haynes, Smith &
Hunsley, 2011). Usually, practitioners use cutoffs based on standard deviations, ranging
from 1 to 1.98 (Godefroy et al., 2014; Brooks, 2010; Schretlen, Testa, Winicki, Pearlson
16
& Gordon, 2008). Using a normal distribution, this may range from including 2.3% to
15.9% of individuals (Schretlen, 2008). Wechsler tests typically classify test scores that
are below the 10th percentile as borderline, and scores below the 2nd percentile as
extremely low (Tanner-Eggen, Balzer, Perrig, & Gutbrod, 2015). While it is common for
practitioners to vary in the cut off score they use, the effect of using different cutoff
scores has not been sufficiently addressed in the literature. Additionally, in order to
determine whether the child has a disability, practitioners must select a battery of tests
and the number of tests required to demonstrate that the child has a disability. While not
usually considered, the use of multiple tests in assessments can increase sensitivity but
lower specificity, thus increasing the false positive rate (Godefroy et al., 2014; Brooks,
2010). Therefore, the more tests that are administered, the probability of having a low
score on one of the tests also increases (Tanner-Eggen, Balzer, Perrig, & Gutbrod, 2015).
For example, according to a normal distribution, approximately 5% of children will
obtain a score at or below the 5th percentile for a single subtest. However, as the number
of subtests are added, approximately 20% of typically developing children and
adolescents obtain an index score in the 5th percentile on the Children’s Memory Scale
when looking at the battery of tests (Brooks, 2010). To interpret score profiles on a
battery of tests, there are no recommendations currently available, because the number of
low scores is dependent on the number of tests administered (Tanner-Eggen et al., 2015).
Base rates, or the percentage of a population that falls within a specific cognitive
category, are of particular interest in clinical diagnostic assessment. Base rates allow
clinicians to determine whether a symptom is truly related to that condition.
Psychologists often compare specific strengths and weakness es to the standardization
17
sample, and determine whether the discrepancy shows an infrequent base rate (Glutting,
McDermott, Marley, & Kush, 1997). For example, the high base rate of “exceptional”
subtest profiles has been an issue in the field of special education and school psychology.
Practitioners often interpret the subtest scores of intelligence tests, either examining
statistically significant strengths or weaknesses between subtest scores, or base rate
scores. In using statistical significance of score differences (i.e. p values), a child’s
performance is compared to either the group average or the personal mean. By
establishing statistical significance, the practitioner assumes that the score difference is
meaningful and is not due to chance. However, differences that are statistically
significant can still be common in the population, representing a natural variation of test
scores (Konold, Glutting, McDermott, Kush, & Watkins, 1999). Previous research has
demonstrated that low cognitive and neuropsychological test scores exist in healthy
populations, due to intra-individual variability (Tanner-Eggen et al., 2015). For example,
Konold and colleagues studied the number of children from the Wechsler Intelligence
Scale for Children, Third Edition standardization sample (N=2,200) with at least one
statistically significant subtest deviation (p < .05). The results indicated that 42.7% of
children had at least one statistically significant weakness (Konold, Glutting, McDermott,
Kush, & Watkins, 1999). Therefore, because significant differences in performance is
common, base rates are crucial in order to determine if strengths and weaknesses are
common in the population.
In order to determine base rates of cognitive and academic weaknesses associated
with PSW approaches, multiple simulation studies have been conducted. In one study to
assess patterns of strengths and weaknesses models, Stuebing and colleagues (2012) used
18
stimulated data to determine the technical adequacy of the three PSW methods. The
results of the stimulation found that all three methods showed good specificity but poor
sensitivity. Therefore, many students may not be identified as LD, and many would be
false positives. Additionally, the results of the study found three methods identified a
small percentage of the population (1%-2%) (Stuebing et al., 2012).
In another study designed to assess strengths and weaknesses models, Miciak and
colleagues (2014) examined cognitive assessment data for 139 adolescents with
inadequate response to intervention. The data were assessed using C/DM method and the
XBA method. The three PSW methods have different suggested cutoff points. For
instance, the C/DM method is usually implemented with a cutoff point of less than 90,
whereas Flanagan proposed a threshold of 85 (Miciak, Fletcher, Stuebing, Vaughn, &
Tolar, 2014). Therefore, Miciak evaluated the data using both cutoff points. The results
of the study indicated that the percentage of participants that met LD identification
criteria ranged from 17.3% (XBA 85) to 47.5% (C/DM 90). The study also found that the
C/DM model identified more students than the XBA approach at equivalent cut off
points. Across methods, the rate of LD identification was significantly higher when a
cutoff point of 90 rather than 85 was used. When comparing the groups that met and did
not meet LD identification criteria on externally academic variables, they were largely
null, thus questioning the external validity of these approaches. Additionally, the study
found low agreement between the two different pattern of strengths and weaknesses
model (kappa range- .04- .31). The low agreement is not necessarily surprising, as the
approaches vary differently in the way the classify students. The C/DM model is a
within-person approach, whereas the XBA method is a normative approach. However,

19
the results of the study does raise important questions about the utility of using different
diagnostic criteria (Miciak, Fletcher, Stuebing, Vaughn, & Tolar, 2014).
Integrated Assessment Model
While PSW models and hybrid models are promising practices for combining
comprehensive assessments with intervention services, there are still many logistical
issues with determining the feasibility of these methods. One model that has been
proposed is the Integrated Assessment and Intervention Model (I-AIM), proposed by
Decker (2012). The I-AIM is a potential method for connecting assessment with
intervention. In this model, disabilities are categorized along a dimension that describes
the severity of the condition. Therefore, intervention treatment intensity can vary based
on the severity of the disability. The severity of the disability can be based on cognitive,
academic and social-emotional deficits for the child. These deficits could be noted based
on curriculum-based measurements, normative measurements, or other criteria. For each
deficit, the child would receive a number ranging from 0 (no deficits to 3 (three deficits).
In order to obtain the classification, the number of deficits in each domain is represented
by a three-digit coding scheme. For instance, the first digit could represent the number of
academic deficits, the second could represent the number of cognitive deficits, and the
third number could represent the number of social-emotional deficits (Decker, 2012).
This model is a data-based decision making tool that can help educators to easily
categorize individuals based on their current cognitive and academic needs.
In following this method, interventions can be directly based on the severity of the
deficit in the associated domain. For example, Level 0 intervention services would
include all students in general education, where there is no evidence of an academic
20
deficit. For students in Level 1, they may have minor accommodations in the general
education classroom, Students receiving Level 2 intervention services are for students
with both academic and cognitive deficits, typical for students with learning disabilities.
In this level, children may receive specialized intervention services, generally in a
resource setting. Students in level 3 would be best served through intense interventions
and support services primarily in a non-general education setting (Decker, 2012).
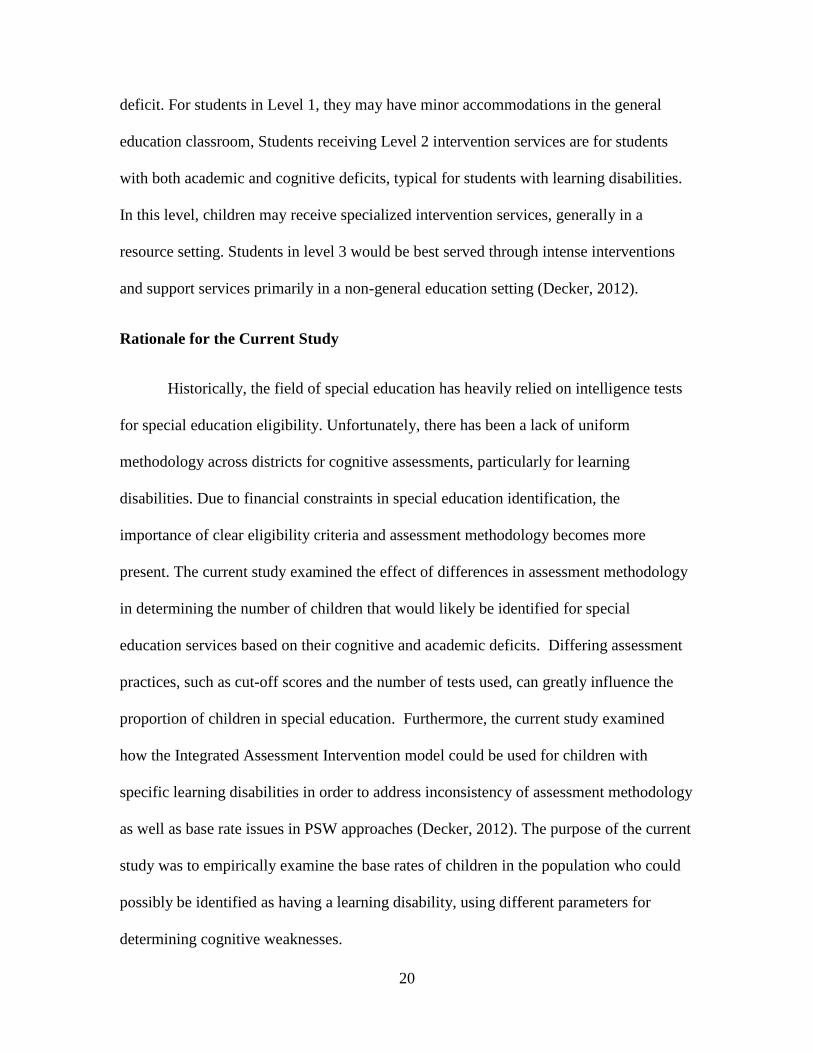
Rationale for the Current Study
Historically, the field of special education has heavily relied on intelligence tests
for special education eligibility. Unfortunately, there has been a lack of uniform
methodology across districts for cognitive assessments, particularly for learning
disabilities. Due to financial constraints in special education identification, the
importance of clear eligibility criteria and assessment methodology becomes more
present. The current study examined the effect of differences in assessment methodology
in determining the number of children that would likely be identified for special
education services based on their cognitive and academic deficits. Differing assessment
practices, such as cut-off scores and the number of tests used, can greatly influence the
proportion of children in special education. Furthermore, the current study examined
how the Integrated Assessment Intervention model could be used for children with
specific learning disabilities in order to address inconsistency of assessment methodology
as well as base rate issues in PSW approaches (Decker, 2012). The purpose of the current
study was to empirically examine the base rates of children in the population who could
possibly be identified as having a learning disability, using different parameters for
determining cognitive weaknesses.
21
CHAPTER THREE:
METHODS
Participants
The current study used the Woodcock-Johnson IV (WJ-IV) standardization
sample, which consists of 7,416 participants between the ages of 12 months to over 90
years of age. The data for the normative sample were collected between December 2009
and January 2012. Subjects were randomly selected within a stratified sampling design,
which controlled for specific community and subject variables (Region, Community Size,
Sex, Race, Hispanic, Type of School, Type of College, Education of adults, Occupational
Status of adults, and Occupation of adults in the labor force). The sample was consistent
with population norms, based on the 2010 U.S. census projections. Trained professional
examiners, who completed a 5 hour online training course, assessed students for the
normative sample. Examiners were required to achieve a minimum passing score in order
to be approved for participation, and complete three practice cases. After approval of the
three practice cases, examiners were allowed to begin recruitment and testing of norming
study participants. Additionally, paraprofessional examiners were recruited in order to
allow for additional participants. Paraprofessional examiners were required to have a
bachelor’s degree in education or a related field but were not required to have experience
in administering clinical assessments. All paraprofessional examiners completed a week
long in-person training program. Afterwards, they completed the online training program

22
with a minimal passing score on each summative quiz and submit three practice
cases for approval. After approval, all examiners were given access to the WJ-IV project
website, which allowed them to find potential norming cases by region, age, and other
characteristics. After a potential participant was identified, the examiner reserved the
case, administered the test to the participant, and submitted the protocol to Riverside. All
subjects were administered tests from both the cognitive and achievement tests (McGrew
& Woodcock, 2014).
Only participants ages 7 to 17 (M = 11.89, SD = 2.87) were chosen for the current
analyses, thus limiting the final sample size to 3,087 participants. This age group was
chosen in order to include school-aged children who would be able to read written
material. Participants were average in cognitive and academic ability. The mean Brief
Intellectual Ability score was 100.01 (SD = 15.54), and the mean score for the Brief
Achievement Score was 100.38 (SD = 15.80).
Measures
The current study used the Woodcock Johnson Cognitive and Achievement Tests,
Fourth Edition. The Woodcock Johnson series of tests is the only cognitive test designed
specifically to assess the cognitive abilities according to CHC theory. The Woodcock
Johnson is often used by neuropsychologists to understand specific narrow abilities, using
individual subtests standard battery as well as the CHC battery (Hale & Fiorello, 2004).
The WJ-IV was designed to broadly measure seven out of the eight factors from CHC
theory, with the following cognitive cluster scores: Comprehension-Knowledge, Long-
Term Retrieval, Visual-Spatial Thinking, Auditory Processing, Processing Speed, and
23
Short-term Working Memory. See Table 3.3 for the complete list of WJ-IV cognitive
subtests.
The standard battery consists of subtests one through seven, each of which
assesses a different area of cognitive functioning according to the Cattell-Horn-Carroll
(CHC) model of cognitive functioning. The CHC battery consists of 14 subtests (1-10,
12-14 and 17), with two tests assessing each cognitive area of cognitive functioning.
Reliability estimates for each subtest are reported for broad age groups and generally
found to range from .76 to .95 (see the WJ IV Technical Manual for more specific
information, McGrew & Woodcock, 2014). The Woodcock-Johnson Test of Cognitive
Abilities- Fourth Edition (WJ-COG IV) was used in order to assess the cognitive
predictors for the current study, and the Woodcock-Johnson Test of Achievement- Third
Edition (WJ-ACH IV) was used in order to assess academic abilities. The subtest scores
are standardized, with a mean of 100 and a standard deviation of 15 (McGrew &
Woodcock, 2014).
Data Analysis
For this study, the data selected from the WJ IV standardization sample was re-
analyzed using the following statistical procedures. All subtests in the WJ-IV norming
sample were counted to determine the number of cognitive weaknesses for each
participants. The subtests were selected based on the CHC factors. Some practitioners
utilize the standard battery (subtests 1-7). These subtests each test one component of
intelligence, according to CHC theory. Other practitioners may choose to use the CHC
battery (subtests 1-10, 12-14 and 17), which has two subtests for each component of

24
intelligence. Additionally, the numbers of cognitive weaknesses were counted based on
four different potential cut-off scores used by practitioners: 75, 80, 85 and 90. The
number of subtests with scores less than the specified cut-off point were counted for each
participant, and summed to total the number of scores that would be considered
weaknesses for each participant. The number of participants with one, two, three, or more
than three cognitive weaknesses were then totaled in order to create the percentage of
participants that had a specified number of cognitive weaknesses.

25
Table 3.1
WJ-IV Cognitive Subtests
Subtest Name CHC Factor
1. Oral Vocabulary Comprehension-Knowledge (Gc)
2. Number Series Fluid Reasoning
(Gf) 3. Verbal Attention Short-Term Working Memory (Gwm)
4. Letter- Pattern Matching Cognitive Processing Speed (Gs)
5. Phonological Processing Auditory Processing (Ga)
6. Story Recall Long-Term Retrieval (Glr )
7. Visualization Visual Processing (Gv)
8. General Information Comprehension-Knowledge (Gc)
9. Concept Formation Short-Term Working Memory (Gwm )
10. Numbers Reversed Cognitive Processing Speed (Gs)
12. Nonword Repitition Auditory Processing (Ga)
13. Visual-Auditory Learning Long-Term Retrieval (Glr )
14. Picture Recognition Visual Processing (Gv)
17. Pair Cancellation Cognitive Processing Speed (Gs)
26
CHAPTER FOUR:
RESULTS
Cut off Scores
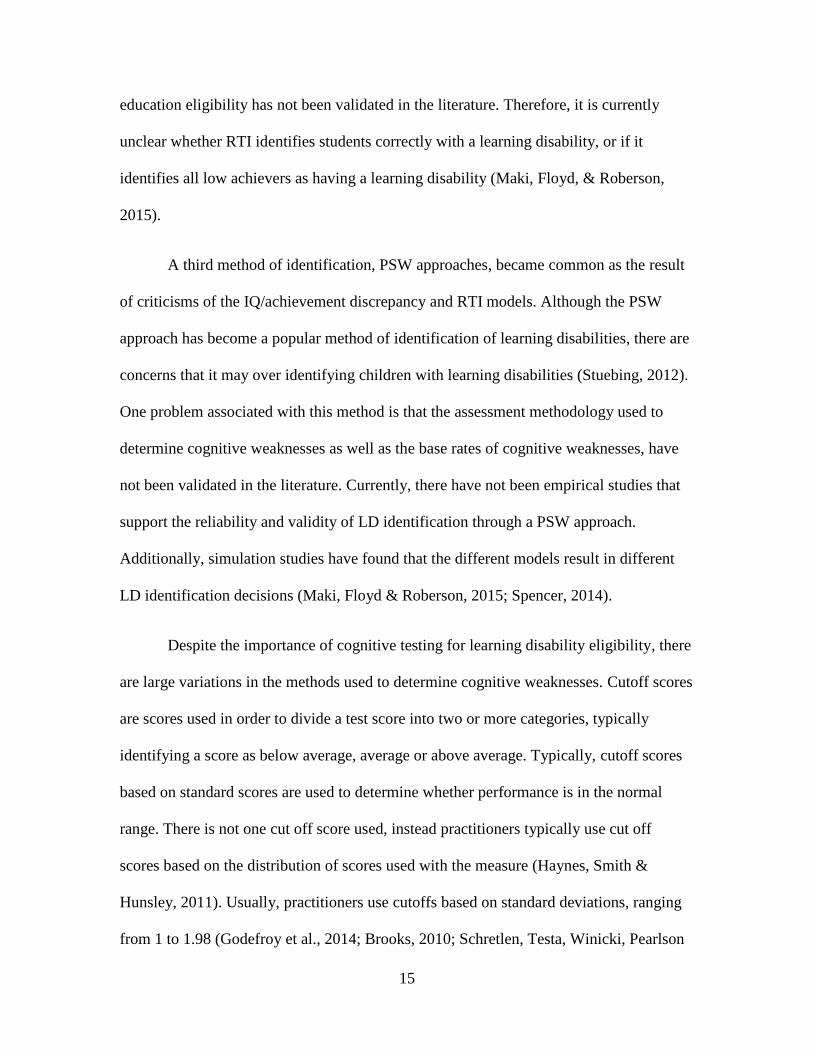
The first research question was to determine the number of students who would
be identified as having cognitive weaknesses using different cut-off scores. The cut-off
scores chosen were 90, 85, 80 and 75. These scores were chosen based on typical cut-off
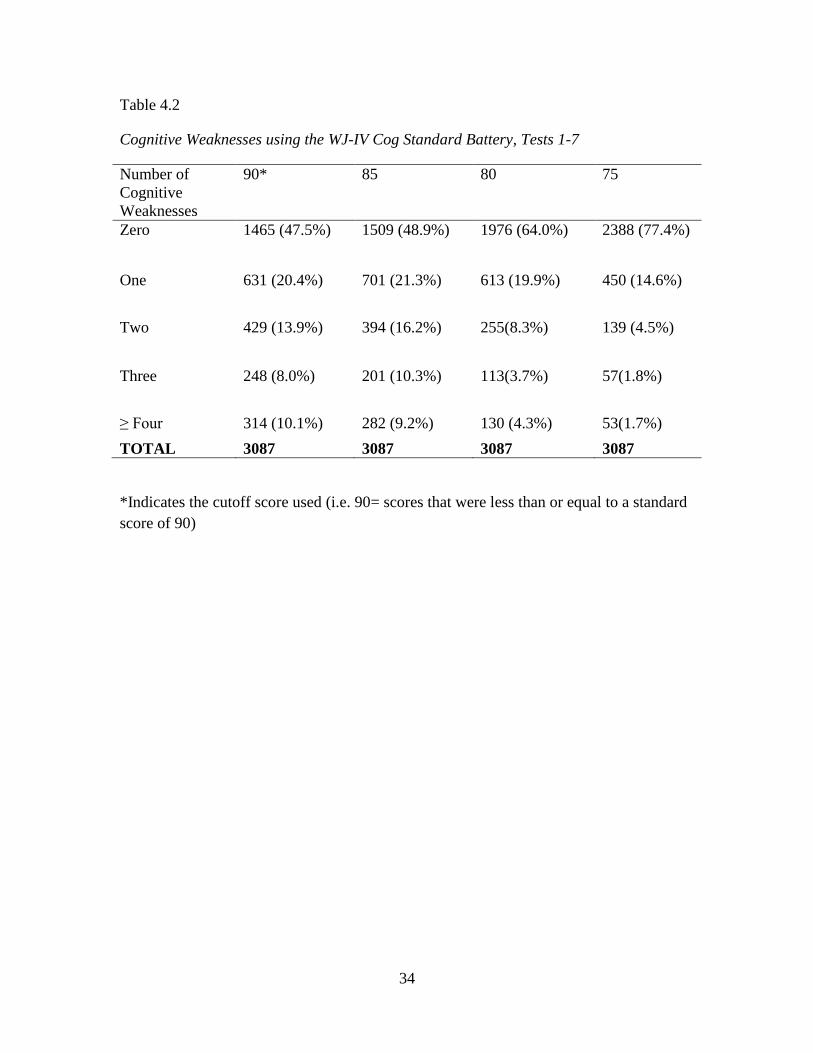
scores used in clinical practice. See Table 4.1 for the results for the standard cognitive
battery. The first analyses was conducted using the standard cognitive battery (subtests 1-
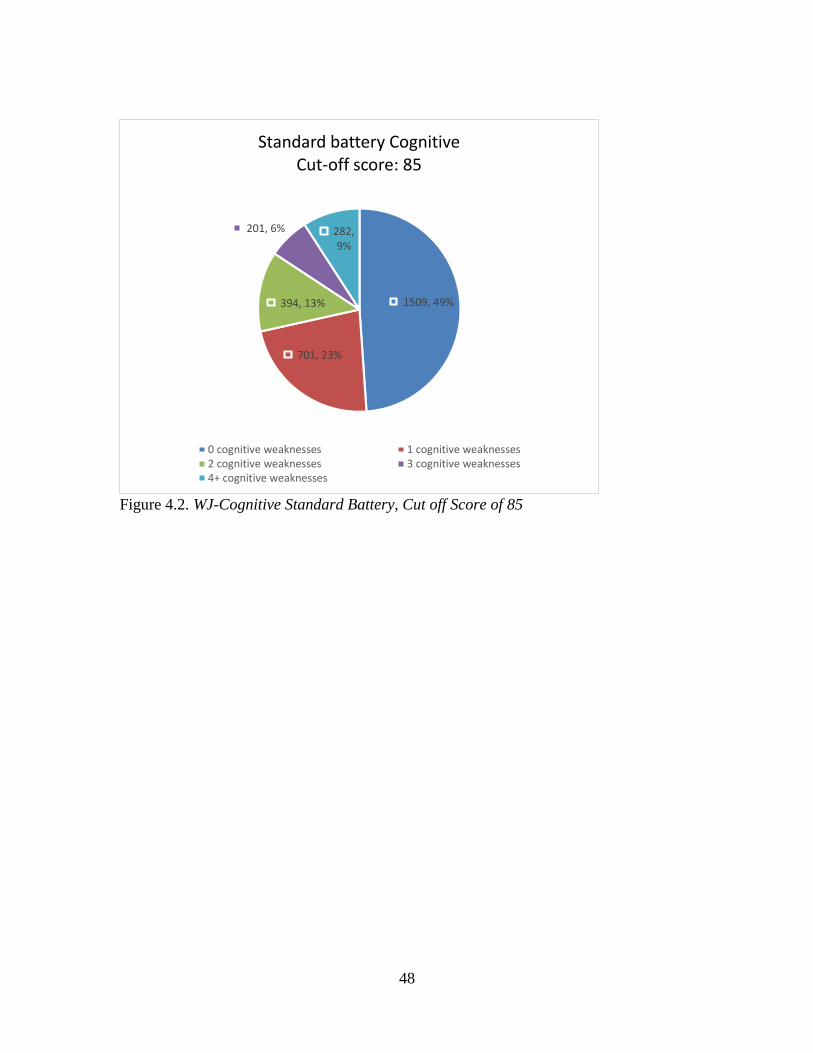
7). With a cutoff score of 90, 47.5% of participants did not have any cognitive
weaknesses, whereas 8% of participants had 3 cognitive weaknesses. For a cut-off score
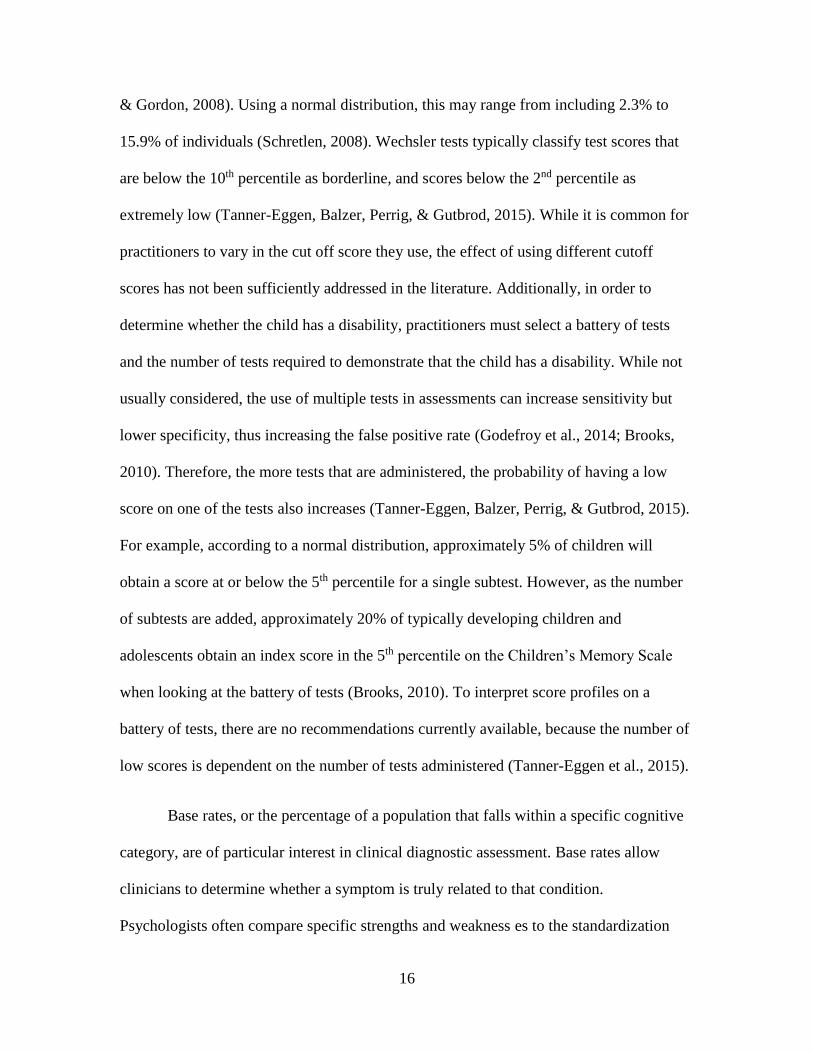
of 85, 48.9% of participants had 0 cognitive weaknesses, and 10.3% had 3 cognitive
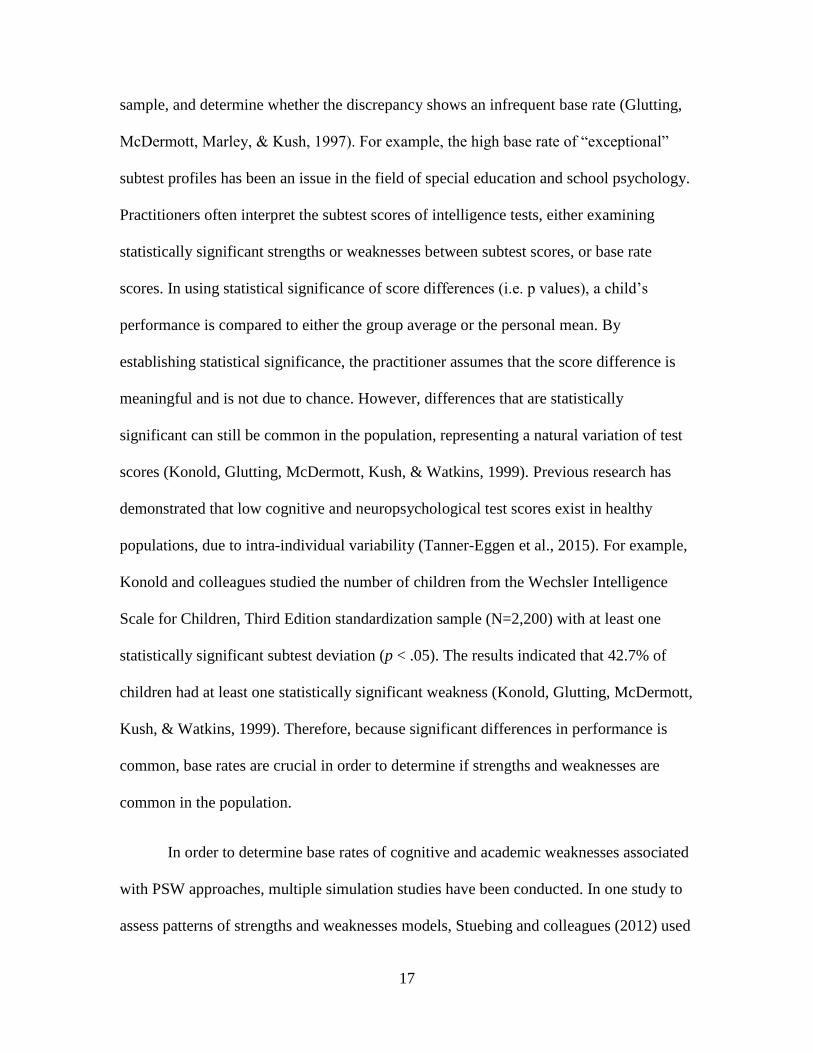
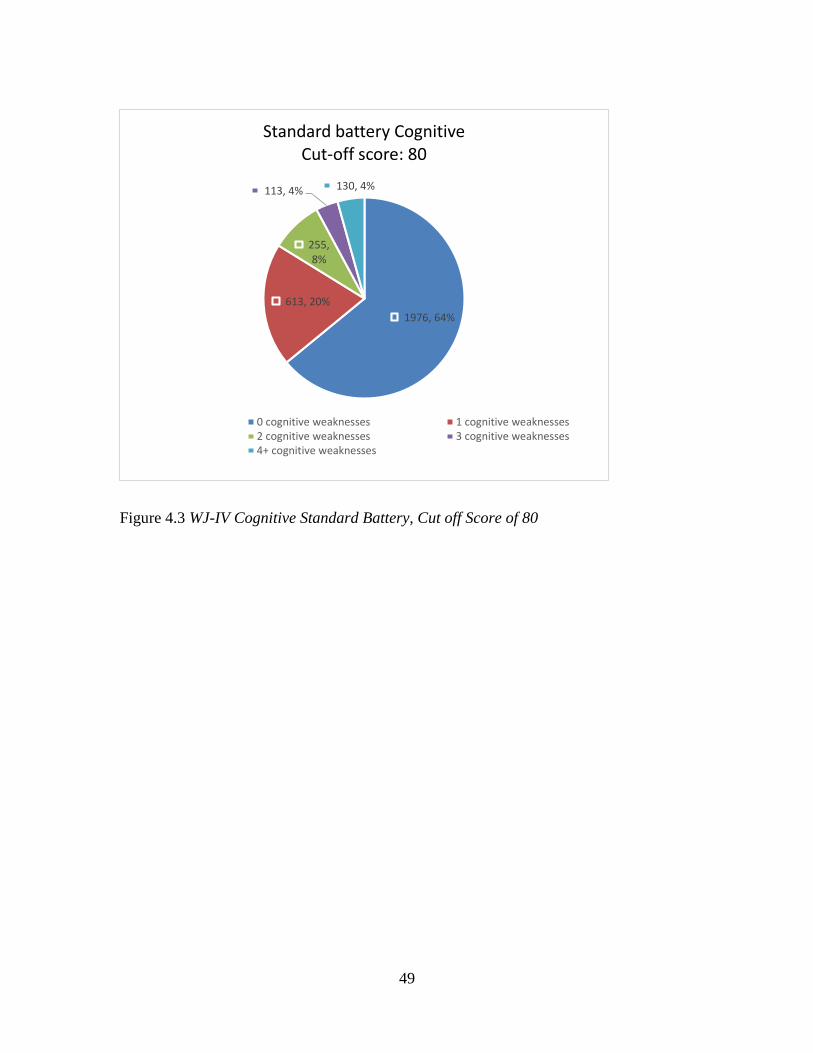
weaknesses. For a cut-off score of 80, 64% of the participants had 0 cognitive
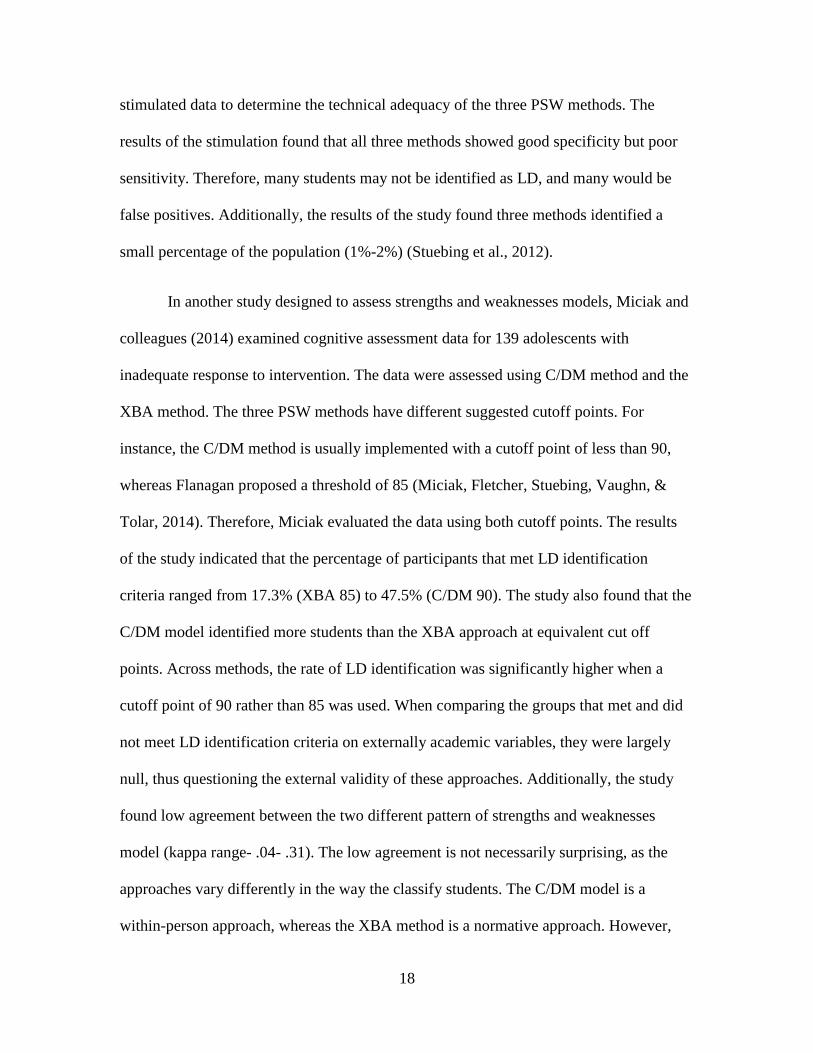
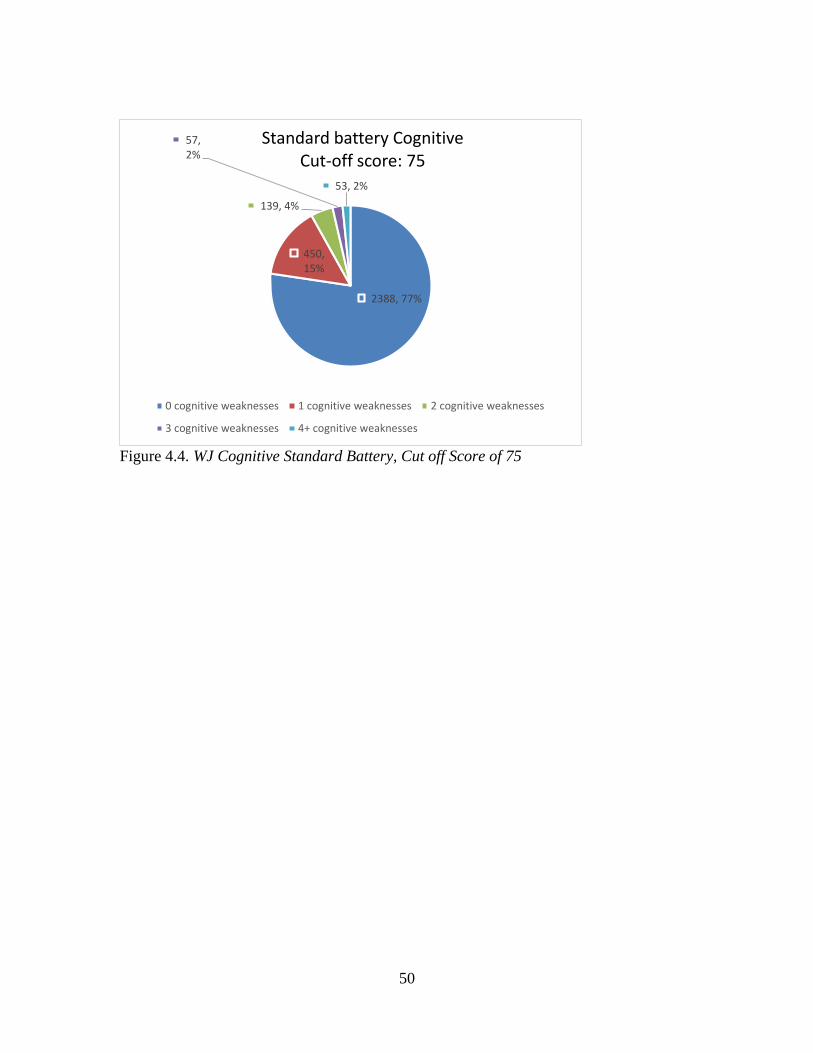
weaknesses, and 3.7% had 3 cognitive weaknesses. Finally, for a cut-off score of 75,
77.4% of the participants had 0 cognitive weaknesses and 1.8% of the participants had
three cognitive weaknesses. Across threshold scores the percentage of participants who
did not have any cognitive weaknesses ranged from 47.5% (90) to 77.4% (75).
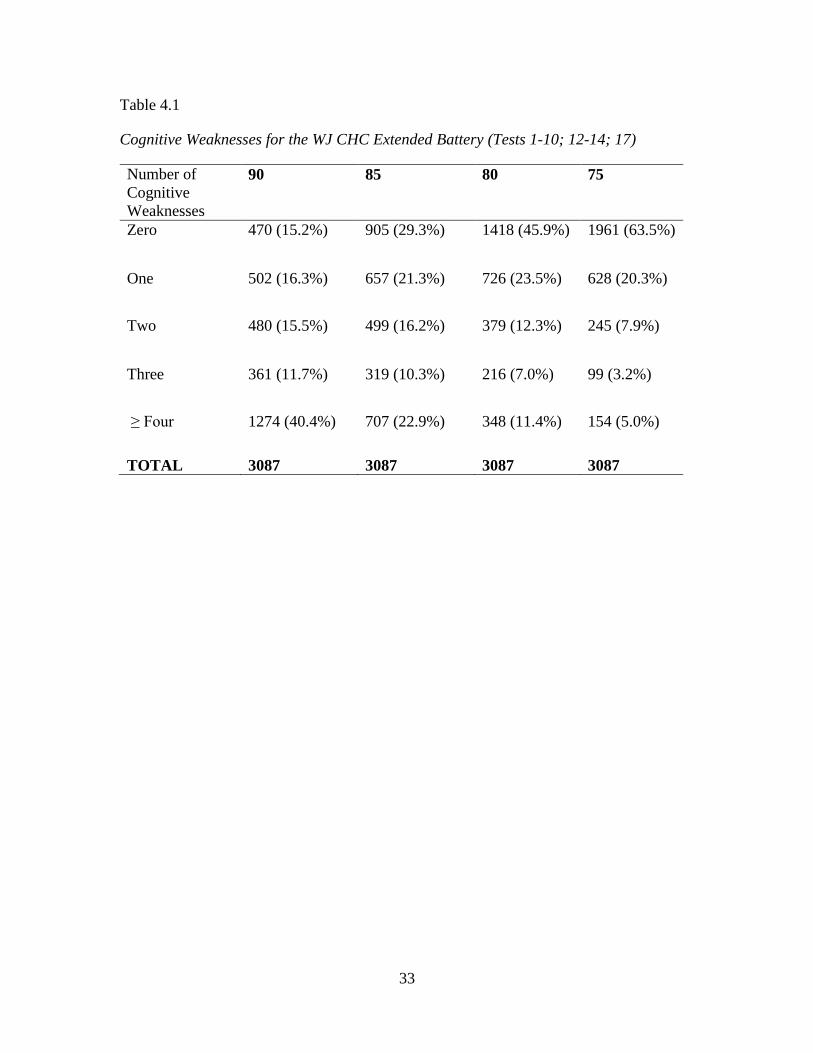
The same analyses were conducted for the CHC battery of the WJ-COG IV
(subtests 1-10, 12, 14, and 17). See Table 4.2 for the results for the CHC battery. Across

27
cutoff scores, the percentage of participants who did not have any cognitive weaknesses
ranged from 15.2% (90) to 63.5% (75). Additionally, for the achievement standard
battery (tests 1-6, 9-11), the percentage of participants who did not have any achievement
weaknesses ranged from 40.1% (90) to 79.6% (75). See Table 4.3 for the results from the
WJ ACH-IV battery.
Number of Tests
The second research question was to determine the impact of the number of
cognitive subtests administered to the participants on the prevalence rates of cognitive
weakness. The results indicated a substantial difference on the number of children
identified as having a cognitive weakness due to the number of subtests administered. See
Tables 4.1 and 4.2 for the full results. For instance, using a cut off score of 90, 47.5% had
zero cognitive weaknesses on the standard battery, whereas only 15.2% of the
participants had zero cognitive weaknesses on the CHC battery. Additionally, using a cut
off score of 75, 77.4% of participants had zero cognitive weaknesses on the standard
battery, whereas 63.5% of participants had zero cognitive weaknesses using the CHC
battery.
In order to further examine the impact on the number of tests on base rates of cognitive
weaknesses, the number of weaknesses (cut off score of 85) for administering 7-17
subtests was evaluated. See Figure 4.5 for full results. Results show that administering
additional tests greatly increases the likelihood that individuals will have at least one
cognitive weakness. For example, when administered seven subtests 64.01% of the
28
sample did not have any cognitive weaknesses. However, when administered 17 subtests,
only 43.38% of the population did not have any cognitive weaknesses
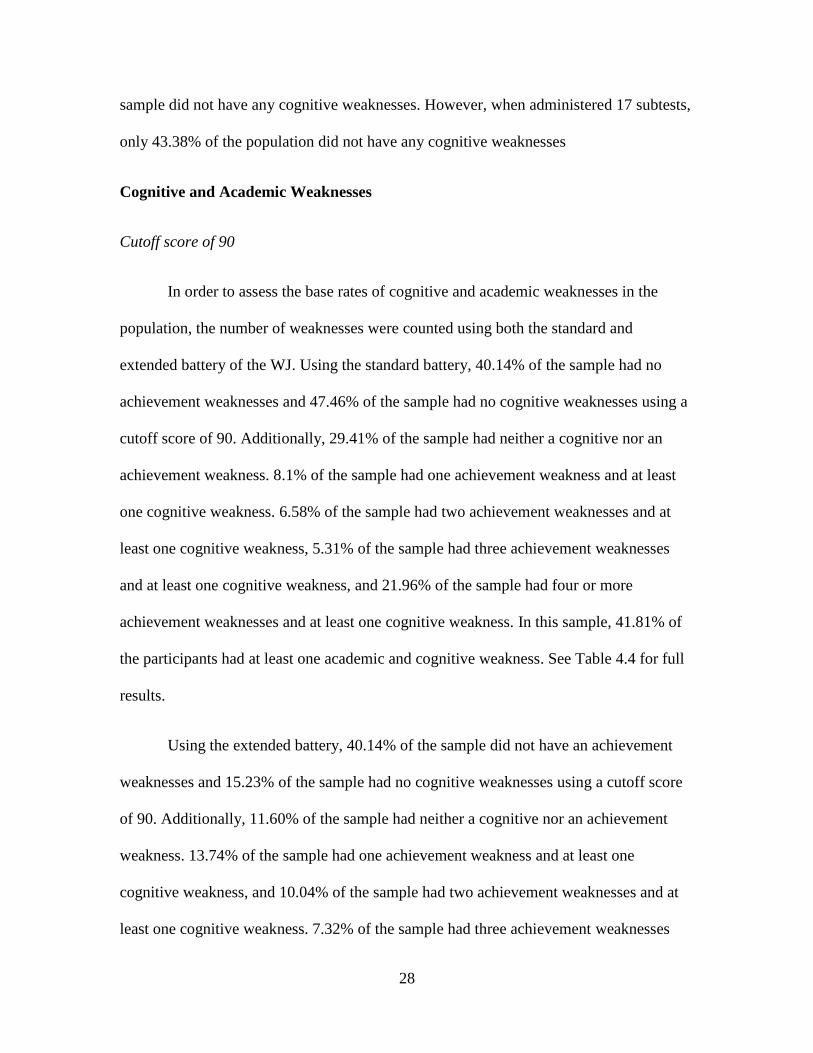
Cognitive and Academic Weaknesses
Cutoff score of 90
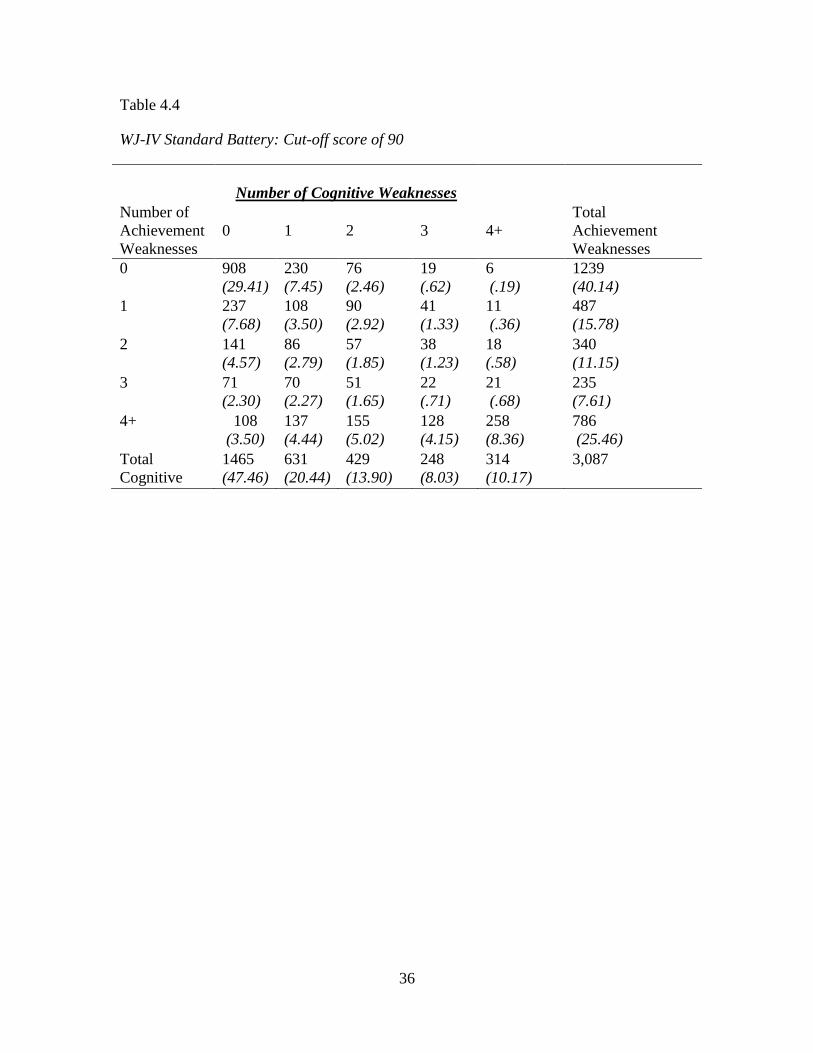
In order to assess the base rates of cognitive and academic weaknesses in the
population, the number of weaknesses were counted using both the standard and
extended battery of the WJ. Using the standard battery, 40.14% of the sample had no
achievement weaknesses and 47.46% of the sample had no cognitive weaknesses using a
cutoff score of 90. Additionally, 29.41% of the sample had neither a cognitive nor an
achievement weakness. 8.1% of the sample had one achievement weakness and at least
one cognitive weakness. 6.58% of the sample had two achievement weaknesses and at
least one cognitive weakness, 5.31% of the sample had three achievement weaknesses
and at least one cognitive weakness, and 21.96% of the sample had four or more
achievement weaknesses and at least one cognitive weakness. In this sample, 41.81% of
the participants had at least one academic and cognitive weakness. See Table 4.4 for full
results.
Using the extended battery, 40.14% of the sample did not have an achievement
weaknesses and 15.23% of the sample had no cognitive weaknesses using a cutoff score
of 90. Additionally, 11.60% of the sample had neither a cognitive nor an achievement
weakness. 13.74% of the sample had one achievement weakness and at least one
cognitive weakness, and 10.04% of the sample had two achievement weaknesses and at
least one cognitive weakness. 7.32% of the sample had three achievement weaknesses
29
and at least one cognitive weakness, and 25.14% of the sample had four or more
achievement weaknesses and at least one cognitive weakness. See Table 4.5 for full
results.
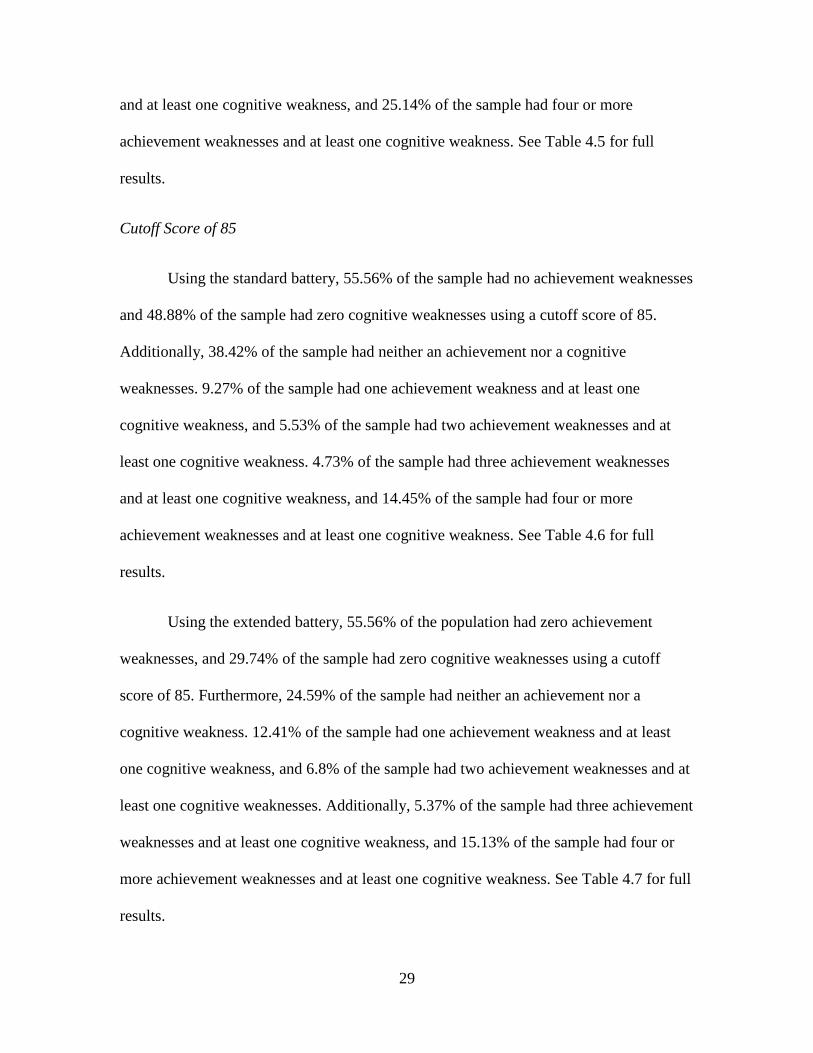
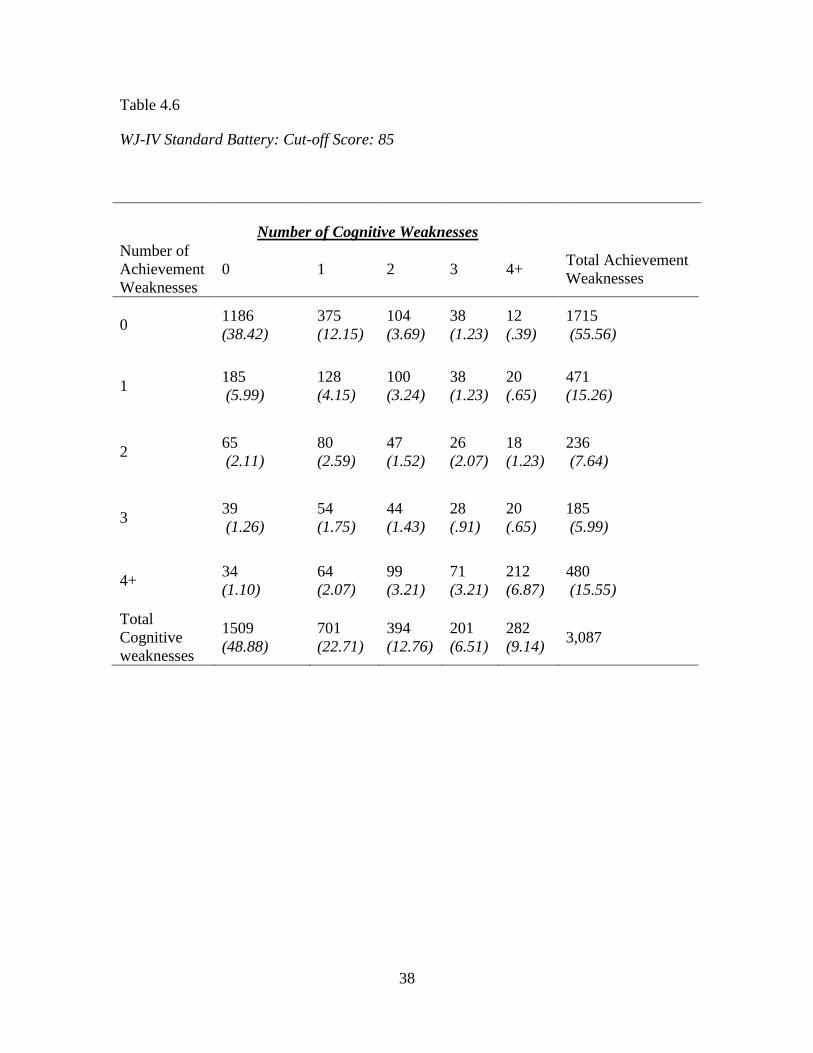
Cutoff Score of 85
Using the standard battery, 55.56% of the sample had no achievement weaknesses
and 48.88% of the sample had zero cognitive weaknesses using a cutoff score of 85.
Additionally, 38.42% of the sample had neither an achievement nor a cognitive
weaknesses. 9.27% of the sample had one achievement weakness and at least one
cognitive weakness, and 5.53% of the sample had two achievement weaknesses and at
least one cognitive weakness. 4.73% of the sample had three achievement weaknesses
and at least one cognitive weakness, and 14.45% of the sample had four or more
achievement weaknesses and at least one cognitive weakness. See Table 4.6 for full
results.
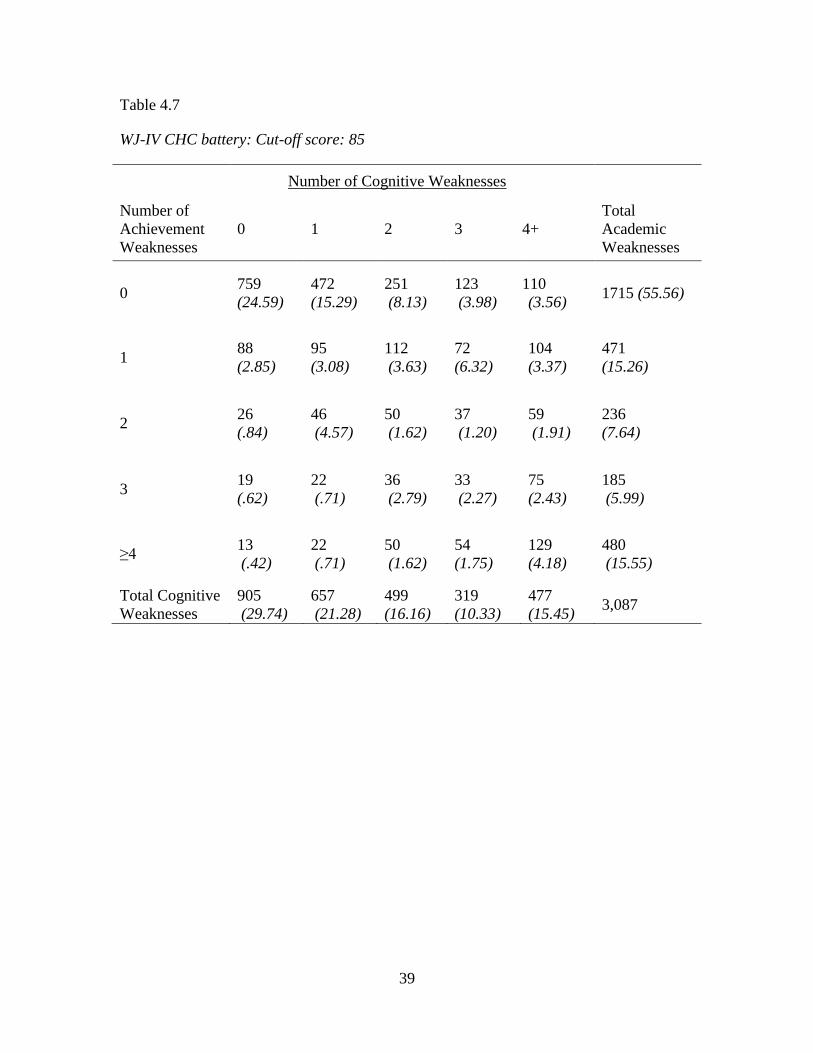
Using the extended battery, 55.56% of the population had zero achievement
weaknesses, and 29.74% of the sample had zero cognitive weaknesses using a cutoff
score of 85. Furthermore, 24.59% of the sample had neither an achievement nor a
cognitive weakness. 12.41% of the sample had one achievement weakness and at least
one cognitive weakness, and 6.8% of the sample had two achievement weaknesses and at
least one cognitive weaknesses. Additionally, 5.37% of the sample had three achievement
weaknesses and at least one cognitive weakness, and 15.13% of the sample had four or
more achievement weaknesses and at least one cognitive weakness. See Table 4.7 for full
results.
30
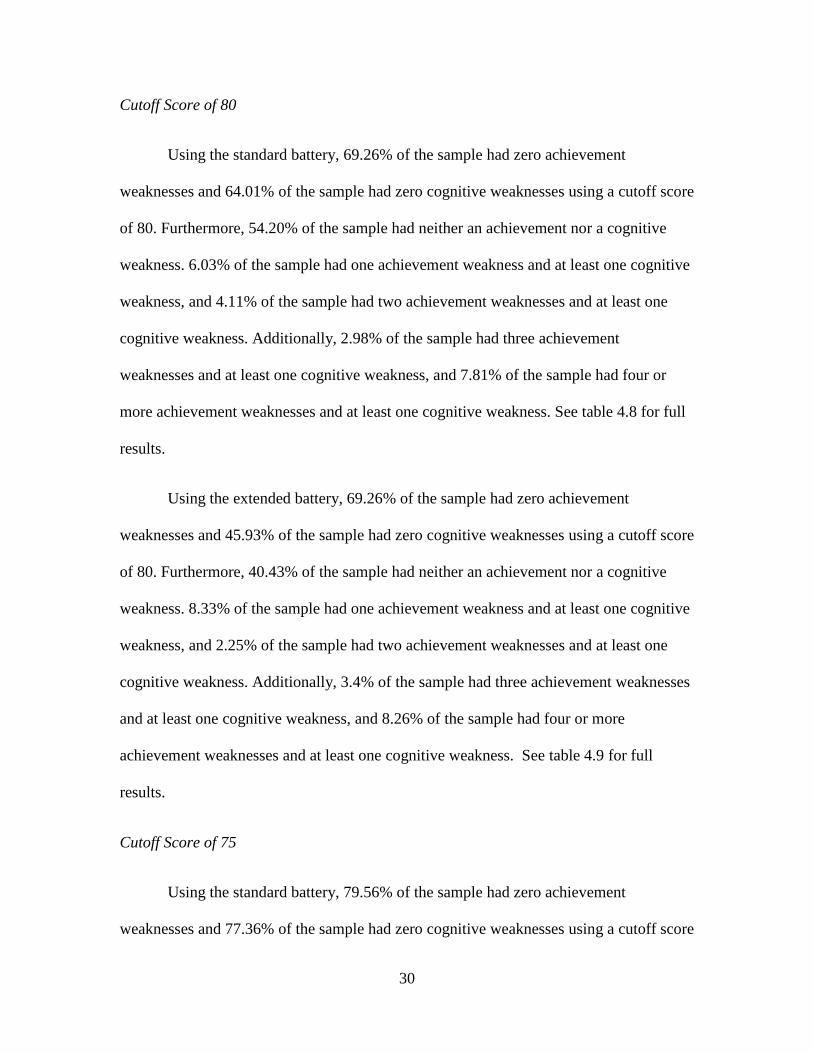
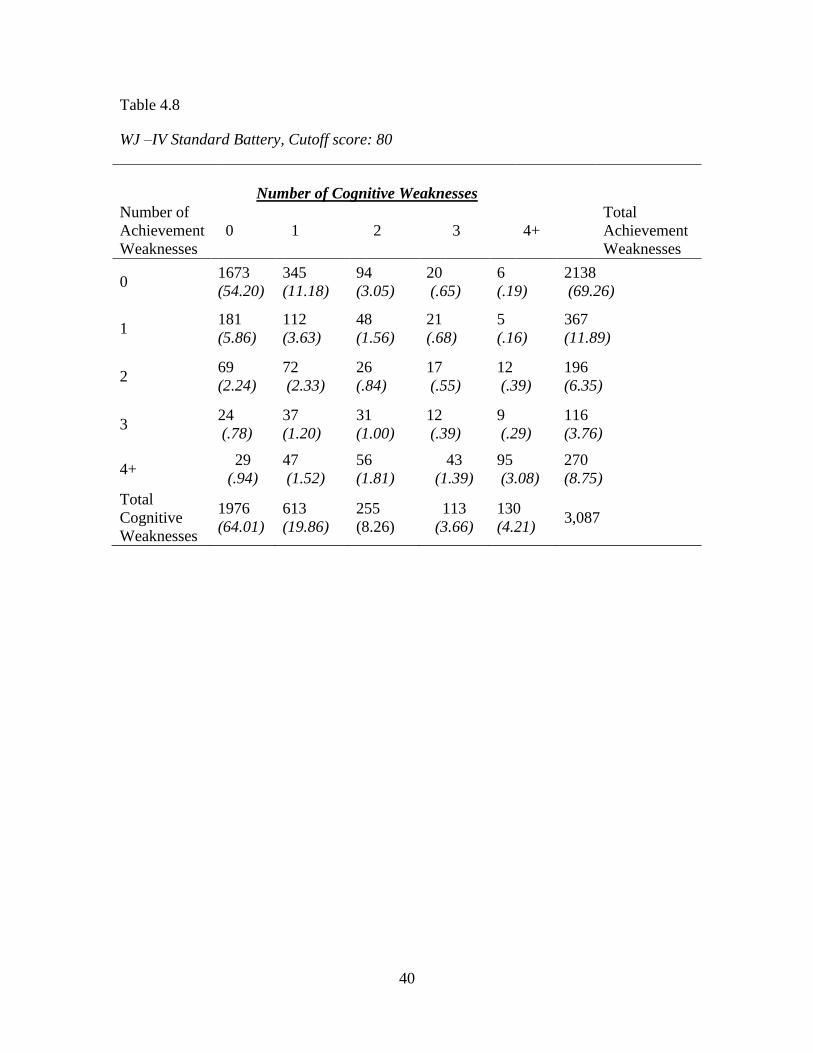
Cutoff Score of 80
Using the standard battery, 69.26% of the sample had zero achievement
weaknesses and 64.01% of the sample had zero cognitive weaknesses using a cutoff score
of 80. Furthermore, 54.20% of the sample had neither an achievement nor a cognitive
weakness. 6.03% of the sample had one achievement weakness and at least one cognitive
weakness, and 4.11% of the sample had two achievement weaknesses and at least one
cognitive weakness. Additionally, 2.98% of the sample had three achievement
weaknesses and at least one cognitive weakness, and 7.81% of the sample had four or
more achievement weaknesses and at least one cognitive weakness. See table 4.8 for full
results.
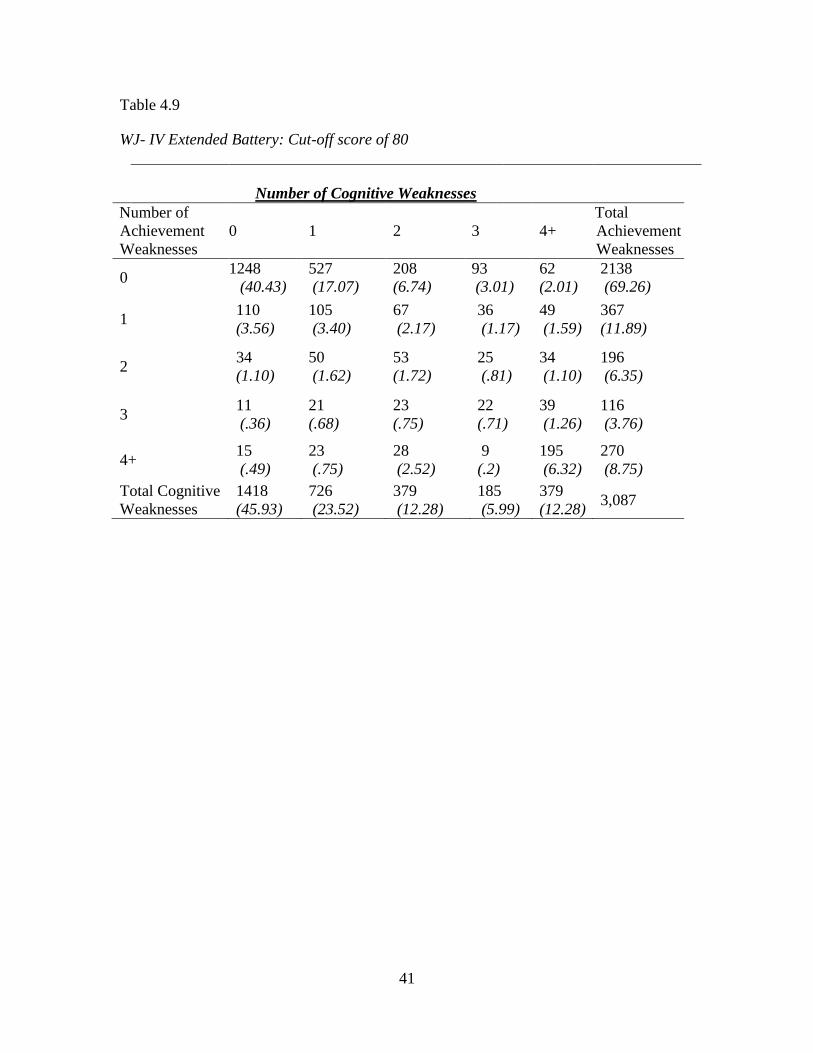
Using the extended battery, 69.26% of the sample had zero achievement
weaknesses and 45.93% of the sample had zero cognitive weaknesses using a cutoff score
of 80. Furthermore, 40.43% of the sample had neither an achievement nor a cognitive
weakness. 8.33% of the sample had one achievement weakness and at least one cognitive
weakness, and 2.25% of the sample had two achievement weaknesses and at least one
cognitive weakness. Additionally, 3.4% of the sample had three achievement weaknesses
and at least one cognitive weakness, and 8.26% of the sample had four or more
achievement weaknesses and at least one cognitive weakness. See table 4.9 for full
results.
Cutoff Score of 75
Using the standard battery, 79.56% of the sample had zero achievement
weaknesses and 77.36% of the sample had zero cognitive weaknesses using a cutoff score
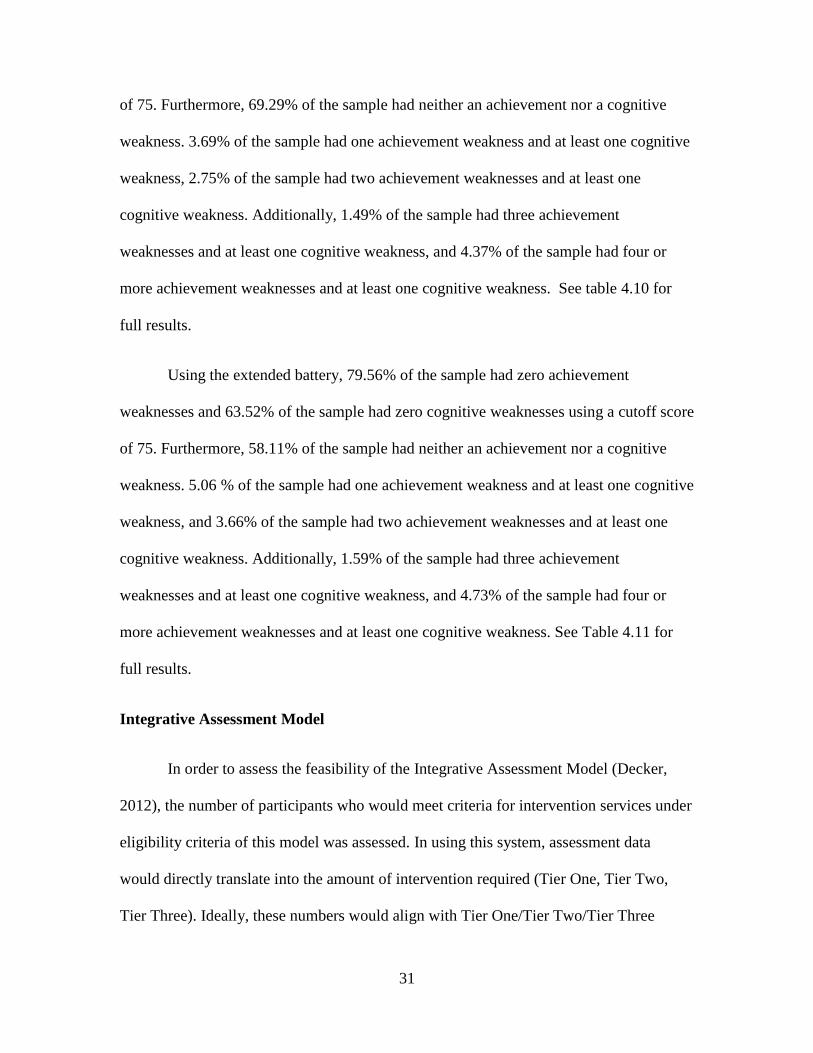
31
of 75. Furthermore, 69.29% of the sample had neither an achievement nor a cognitive
weakness. 3.69% of the sample had one achievement weakness and at least one cognitive
weakness, 2.75% of the sample had two achievement weaknesses and at least one
cognitive weakness. Additionally, 1.49% of the sample had three achievement
weaknesses and at least one cognitive weakness, and 4.37% of the sample had four or
more achievement weaknesses and at least one cognitive weakness. See table 4.10 for
full results.
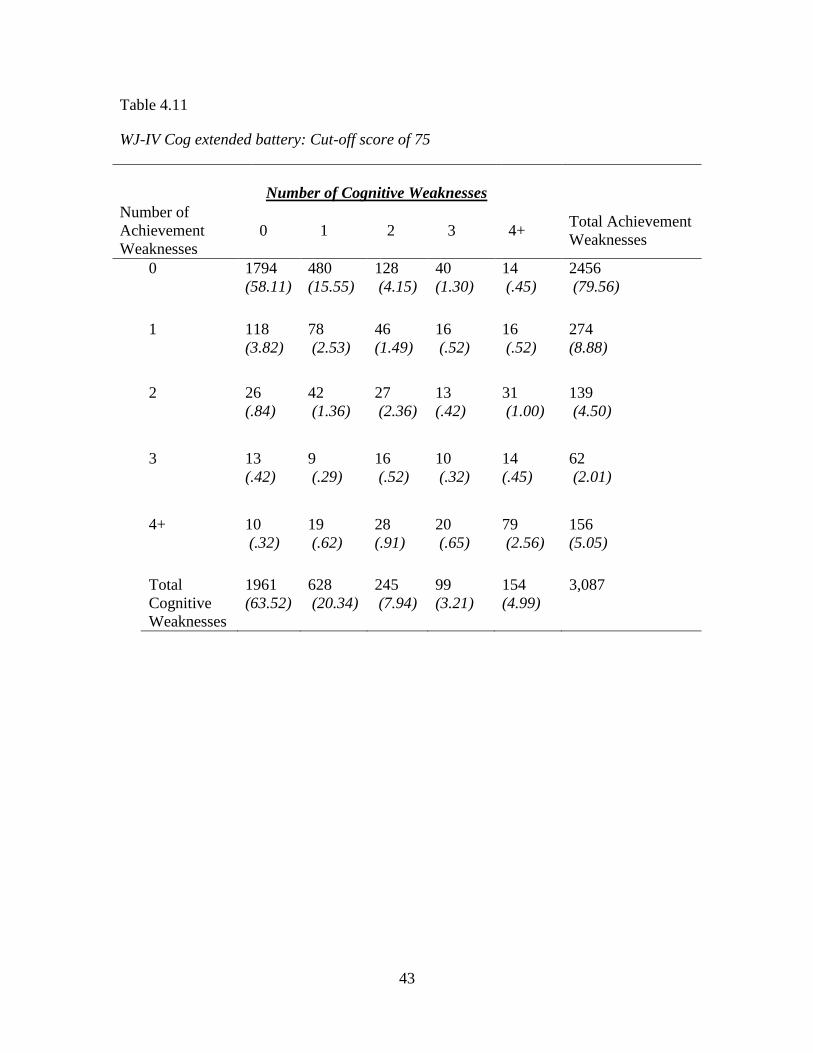
Using the extended battery, 79.56% of the sample had zero achievement
weaknesses and 63.52% of the sample had zero cognitive weaknesses using a cutoff score
of 75. Furthermore, 58.11% of the sample had neither an achievement nor a cognitive
weakness. 5.06 % of the sample had one achievement weakness and at least one cognitive
weakness, and 3.66% of the sample had two achievement weaknesses and at least one
cognitive weakness. Additionally, 1.59% of the sample had three achievement
weaknesses and at least one cognitive weakness, and 4.73% of the sample had four or
more achievement weaknesses and at least one cognitive weakness. See Table 4.11 for
full results.
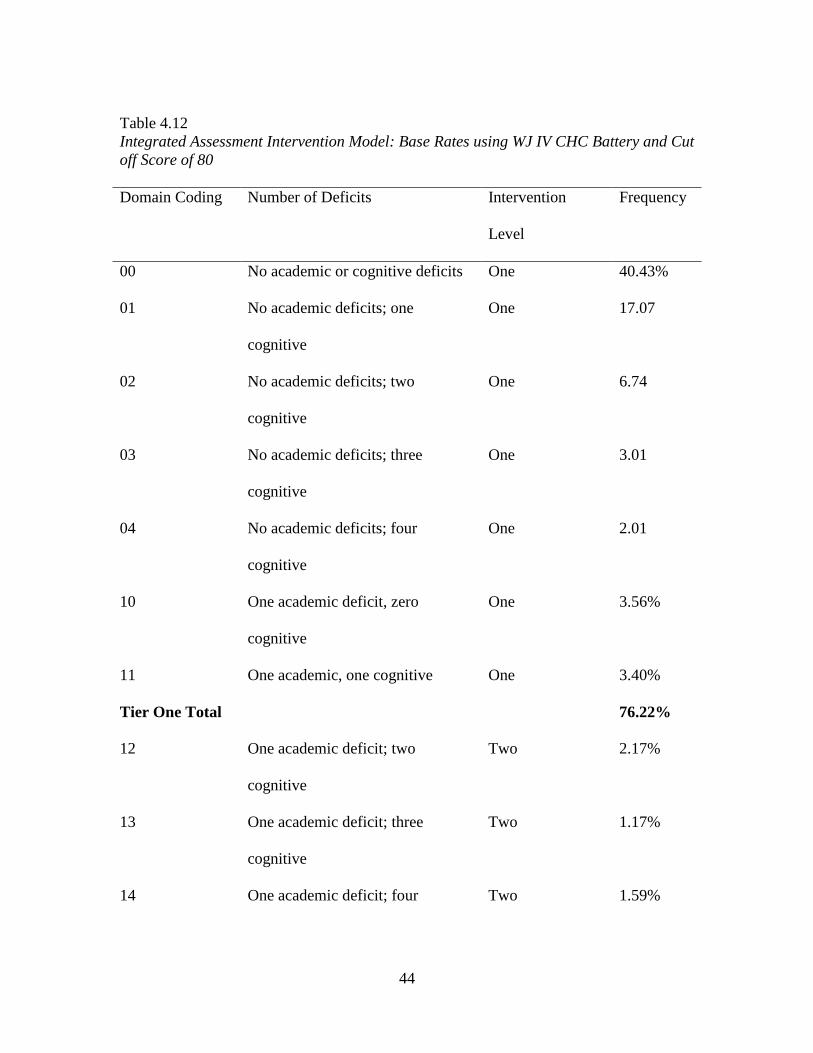
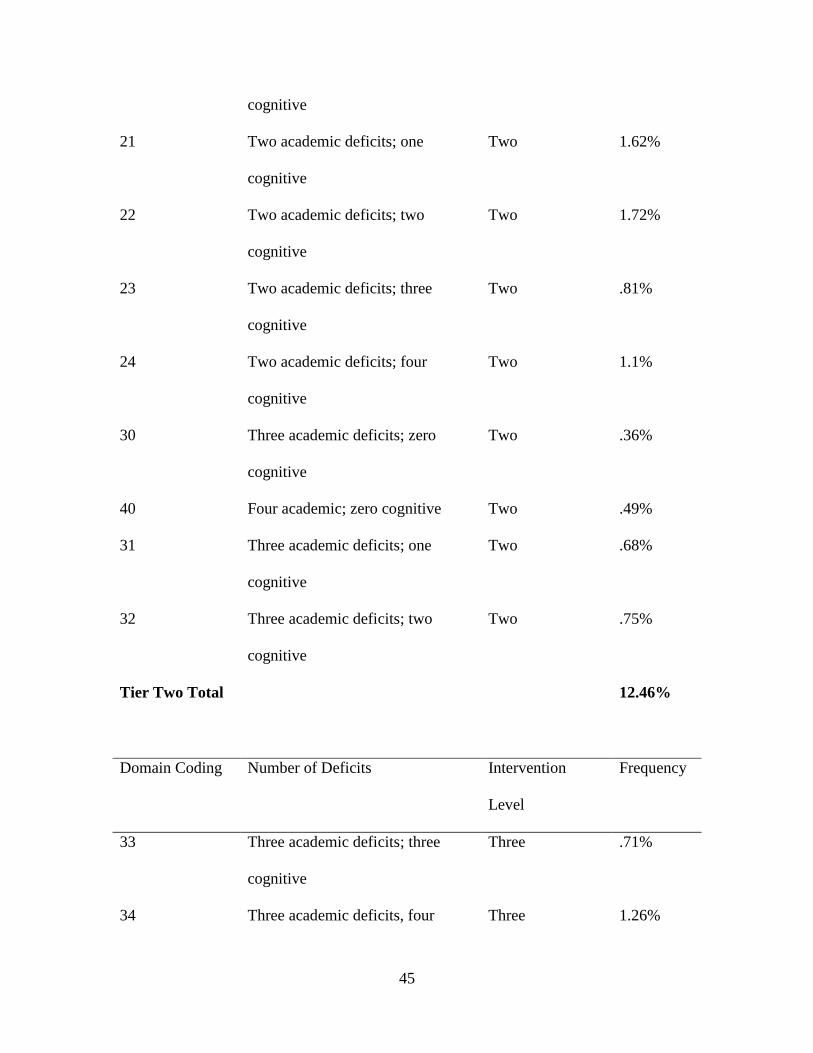
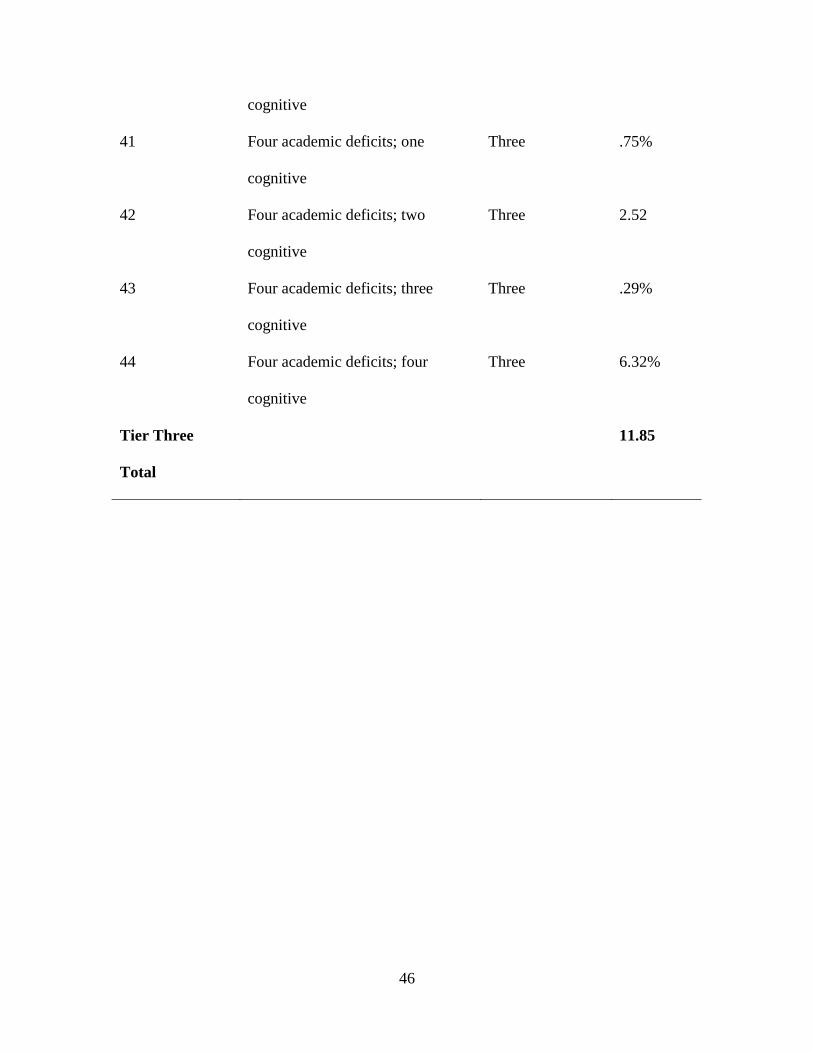
Integrative Assessment Model
In order to assess the feasibility of the Integrative Assessment Model (Decker,
2012), the number of participants who would meet criteria for intervention services under
eligibility criteria of this model was assessed. In using this system, assessment data
would directly translate into the amount of intervention required (Tier One, Tier Two,
Tier Three). Ideally, these numbers would align with Tier One/Tier Two/Tier Three

32
intervention requirements, with 80% in Tier One, 15% in Tier Two, and 5% Tier III
(Fuchs & Fuchs, 2002). The results of the current study found that using a cutoff score of
80 with the CHC Battery, there would be 76.22% of students falling in Tier One
instruction, and 12.46% of students in Tier Two, and 11.86% of students in Tier Three.
For full results, see Table 4.12.
33
Table 4.1
Cognitive Weaknesses for the WJ CHC Extended Battery (Tests 1-10; 12-14; 17)
Number of
Cognitive
Weaknesses
90 85 80 75
Zero 470 (15.2%) 905 (29.3%) 1418 (45.9%) 1961 (63.5%)
One 502 (16.3%) 657 (21.3%) 726 (23.5%) 628 (20.3%)
Two 480 (15.5%) 499 (16.2%) 379 (12.3%) 245 (7.9%)
Three 361 (11.7%) 319 (10.3%) 216 (7.0%) 99 (3.2%)
≥ Four 1274 (40.4%) 707 (22.9%) 348 (11.4%) 154 (5.0%)
TOTAL 3087 3087 3087 3087
34
Table 4.2
Cognitive Weaknesses using the WJ-IV Cog Standard Battery, Tests 1-7
Number of
Cognitive
Weaknesses
90* 85 80 75
Zero 1465 (47.5%) 1509 (48.9%) 1976 (64.0%) 2388 (77.4%)
One 631 (20.4%) 701 (21.3%) 613 (19.9%) 450 (14.6%)
Two 429 (13.9%) 394 (16.2%) 255(8.3%) 139 (4.5%)
Three 248 (8.0%) 201 (10.3%) 113(3.7%) 57(1.8%)
≥ Four 314 (10.1%) 282 (9.2%) 130 (4.3%) 53(1.7%)
TOTAL 3087 3087 3087 3087
*Indicates the cutoff score used (i.e. 90= scores that were less than or equal to a standard
score of 90)

35
Table 4.3
WJ-IV Achievement standard battery: Broad Achievement (TESTS 1-6; 9-11)
Number of
Achievement
Weaknesses
90 85 80 75
Zero 1239 (40.1%) 1715 (55.6%) 2138(69.3%) 2456 (79.6%)
One 487 (15.8%) 471 (15.3%) 367 (11.9%) 274 (8.9%)
Two 340 (11.0%) 236 (7.6%) 196 (6.3%) 139 (4.5%)
Three 235 (7.6%) 185 (6.0%) 116(3.8%) 62(2.0%)
≥ Four 786 (25.4%) 480 (15.5%) 270(8.7%) 156(5.0%)
TOTAL 3087 3087 3087 3087
36
Table 4.4
WJ-IV Standard Battery: Cut-off score of 90
Number of Cognitive Weaknesses
Number of
Achievement
Weaknesses
0 1 2 3 4+
Total
Achievement
Weaknesses
0 908
(29.41)
230
(7.45)
76
(2.46)
19
(.62)
6
(.19)
1239
(40.14)
1 237
(7.68)
108
(3.50)
90
(2.92)
41
(1.33)
11
(.36)
487
(15.78)
2 141
(4.57)
86
(2.79)
57
(1.85)
38
(1.23)
18
(.58)
340
(11.15)
3 71
(2.30)
70
(2.27)
51
(1.65)
22
(.71)
21
(.68)
235
(7.61)
4+ 108
(3.50)
137
(4.44)
155
(5.02)
128
(4.15)
258
(8.36)
786
(25.46)
Total
Cognitive
Weaknesses
1465
(47.46)
631
(20.44)
429
(13.90)
248
(8.03)
314
(10.17)
3,087

37
Table 4.5
WJ-IV Extended Battery: Cut-off Score of 90
Number of Cognitive Weaknesses
Number of
Achievement
Weaknesses
0 1 2 3 4+
Total
Achievement
Weaknesses
0 358
(11.60)
346
(11.21)
250
(8.10)
124
(4.02)
161
(5.22)
1239
(40.14)
1 63
(2.04)
79
(2.56)
92
(2.98) 85 (2.75)
168
(5.44)
487
(15.78)
2 30
(.97)
37
(1.20)
64
(2.07) 58 (1.88)
151
(4.89)
340
(11.01)
3 9
(.29)
19
(.62)
29
(.94) 40 (1.30)
138
(4.47)
235
(7.61)
4+ 10
(.32)
21
(.68)
45
(1.46) 54 (1.75)
656
(21.25)
786
(25.46)
Total
Cognitive
Weaknesses
470
(15.23)
502
(16.26)
480
(15.55)
361
(11.69)
1274
(41.27) 3,087
38
Table 4.6
WJ-IV Standard Battery: Cut-off Score: 85
Number of Cognitive Weaknesses
Number of
Achievement
Weaknesses
0 1 2 3 4+ Total Achievement
Weaknesses
0 1186
(38.42)
375
(12.15)
104
(3.69)
38
(1.23)
12
(.39)
1715
(55.56)
1 185
(5.99)
128
(4.15)
100
(3.24)
38
(1.23)
20
(.65)
471
(15.26)
2 65
(2.11)
80
(2.59)
47
(1.52)
26
(2.07)
18
(1.23)
236
(7.64)
3 39
(1.26)
54
(1.75)
44
(1.43)
28
(.91)
20
(.65)
185
(5.99)
4+ 34
(1.10)
64
(2.07)
99
(3.21)
71
(3.21)
212
(6.87)
480
(15.55)
Total
Cognitive
weaknesses
1509
(48.88)
701
(22.71)
394
(12.76)
201
(6.51)
282
(9.14) 3,087
39
Table 4.7
WJ-IV CHC battery: Cut-off score: 85
Number of Cognitive Weaknesses
Number of
Achievement
Weaknesses
0 1 2 3 4+
Total
Academic
Weaknesses
0 759
(24.59)
472
(15.29)
251
(8.13)
123
(3.98)
110
(3.56) 1715 (55.56)
1 88
(2.85)
95
(3.08)
112
(3.63)
72
(6.32)
104
(3.37)
471
(15.26)
2 26
(.84)
46
(4.57)
50
(1.62)
37
(1.20)
59
(1.91)
236
(7.64)
3 19
(.62)
22
(.71)
36
(2.79)
33
(2.27)
75
(2.43)
185
(5.99)
≥4 13
(.42)
22
(.71)
50
(1.62)
54
(1.75)
129
(4.18)
480
(15.55)
Total Cognitive
Weaknesses
905
(29.74)
657
(21.28)
499
(16.16)
319
(10.33)
477
(15.45) 3,087
40
Table 4.8
WJ –IV Standard Battery, Cutoff score: 80
Number of Cognitive Weaknesses
Number of
Achievement
Weaknesses
0 1 2 3 4+
Total
Achievement
Weaknesses
0 1673
(54.20)
345
(11.18)
94
(3.05)
20
(.65)
6
(.19)
2138
(69.26)
1 181
(5.86)
112
(3.63)
48
(1.56)
21
(.68)
5
(.16)
367
(11.89)
2 69
(2.24)
72
(2.33)
26
(.84)
17
(.55)
12
(.39)
196
(6.35)
3 24
(.78)
37
(1.20)
31
(1.00)
12
(.39)
9
(.29)
116
(3.76)
4+ 29
(.94)
47
(1.52)
56
(1.81)
43
(1.39)
95
(3.08)
270
(8.75)
Total
Cognitive
Weaknesses
1976
(64.01)
613
(19.86)
255
(8.26)
113
(3.66)
130
(4.21) 3,087
41
Table 4.9
WJ- IV Extended Battery: Cut-off score of 80
Number of Cognitive Weaknesses
Number of
Achievement
Weaknesses
0 1 2 3 4+
Total
Achievement
Weaknesses
0 1248
(40.43)
527
(17.07)
208
(6.74)
93
(3.01)
62
(2.01)
2138
(69.26)
1 110
(3.56)
105
(3.40)
67
(2.17)
36
(1.17)
49
(1.59)
367
(11.89)
2 34
(1.10)
50
(1.62)
53
(1.72)
25
(.81)
34
(1.10)
196
(6.35)
3 11
(.36)
21
(.68)
23
(.75)
22
(.71)
39
(1.26)
116
(3.76)
4+ 15
(.49)
23
(.75)
28
(2.52)
9
(.2)
195
(6.32)
270
(8.75)
Total Cognitive
Weaknesses
1418
(45.93)
726
(23.52)
379
(12.28)
185
(5.99)
379
(12.28) 3,087

42
Table 4.10
WJ-IV Standard Battery: Cut-off score 75
Number of Cognitive Weaknesses
Number of
Achievement
Weaknesses
0 1 2 3 4+
Total
Achievement
Weaknesses
0 2139
(69.29)
268
(8.68)
47
(1.52)
2
(.06)
0 2456
(79.56)
1 158
(5.19)
84
(2.72)
24
(.78)
7
(.23)
1
(.03)
274
(8.88)
2 54
(1.75)
42
(1.36)
21
(.68)
11
(.36)
11
(.36)
139
(4.50)
3 16
(.52)
20
(.65)
13
(.42)
7
(.23)
6
(.19)
62
(2.01)
4+ 21
(.68)
36
(1.17)
34
(1.10)
30
(.97)
35
(1.13)
156
(5.05)
Total
Cognitive
Weaknesses
2388
(77.36)
450
(14.58)
139
(4.50)
57
(1.85)
53
(1.72)
3,087
43
Table 4.11
WJ-IV Cog extended battery: Cut-off score of 75
Number of Cognitive Weaknesses
Number of
Achievement
Weaknesses
0 1 2 3 4+ Total Achievement
Weaknesses
0 1794
(58.11)
480
(15.55)
128
(4.15)
40
(1.30)
14
(.45)
2456
(79.56)
1 118
(3.82)
78
(2.53)
46
(1.49)
16
(.52)
16
(.52)
274
(8.88)
2 26
(.84)
42
(1.36)
27
(2.36)
13
(.42)
31
(1.00)
139
(4.50)
3 13
(.42)
9
(.29)
16
(.52)
10
(.32)
14
(.45)
62
(2.01)
4+ 10
(.32)
19
(.62)
28
(.91)
20
(.65)
79
(2.56)
156
(5.05)
Total
Cognitive
Weaknesses
1961
(63.52)
628
(20.34)
245
(7.94)
99
(3.21)
154
(4.99)
3,087
44
Table 4.12
Integrated Assessment Intervention Model: Base Rates using WJ IV CHC Battery and Cut
off Score of 80
Domain Coding Number of Deficits Intervention
Level
Frequency
00 No academic or cognitive deficits One 40.43%
01 No academic deficits; one
cognitive
One 17.07
02 No academic deficits; two
cognitive
One 6.74
03 No academic deficits; three
cognitive
One 3.01
04 No academic deficits; four
cognitive
One 2.01
10 One academic deficit, zero
cognitive
One 3.56%
11 One academic, one cognitive One 3.40%
Tier One Total 76.22%
12 One academic deficit; two
cognitive
Two 2.17%
13 One academic deficit; three
cognitive
Two 1.17%
14 One academic deficit; four Two 1.59%
45
cognitive
21 Two academic deficits; one
cognitive
Two 1.62%
22 Two academic deficits; two
cognitive
Two 1.72%
23 Two academic deficits; three
cognitive
Two .81%
24 Two academic deficits; four
cognitive
Two 1.1%
30 Three academic deficits; zero
cognitive
Two .36%
40 Four academic; zero cognitive Two .49%
31 Three academic deficits; one
cognitive
Two .68%
32 Three academic deficits; two
cognitive
Two .75%
Tier Two Total 12.46%
Domain Coding Number of Deficits Intervention
Level
Frequency
33 Three academic deficits; three
cognitive
Three .71%
34 Three academic deficits, four Three 1.26%
46
cognitive
41 Four academic deficits; one
cognitive
Three .75%
42 Four academic deficits; two
cognitive
Three 2.52
43 Four academic deficits; three
cognitive
Three .29%
44 Four academic deficits; four
cognitive
Three 6.32%
Tier Three
Total
11.85

47
Figure 4.1 WJ-IV Cognitive Standard Battery, Cut off score of 90
1465, 48%
631, 20%
429, 14%
248, 8%
314, 10%
0 cognitive weaknesses
1 cognitive weaknesses
2 cognitive weaknesses
3 cognitive weaknesses
4+ cognitive weaknesses
Standard Cognitive Battery, Cut off score: 90
48
Figure 4.2. WJ-Cognitive Standard Battery, Cut off Score of 85
1509, 49%
701, 23%
394, 13%
201, 6% 282, 9%
Standard battery CognitiveCut-off score: 85
0 cognitive weaknesses 1 cognitive weaknesses2 cognitive weaknesses 3 cognitive weaknesses4+ cognitive weaknesses
49
Figure 4.3 WJ-IV Cognitive Standard Battery, Cut off Score of 80
1976, 64%
613, 20%
255, 8%
113, 4% 130, 4%
Standard battery CognitiveCut-off score: 80
0 cognitive weaknesses 1 cognitive weaknesses2 cognitive weaknesses 3 cognitive weaknesses4+ cognitive weaknesses
50
Figure 4.4. WJ Cognitive Standard Battery, Cut off Score of 75
2388, 77%
450, 15%
139, 4%
57, 2%
53, 2%
Standard battery CognitiveCut-off score: 75
0 cognitive weaknesses 1 cognitive weaknesses 2 cognitive weaknesses
3 cognitive weaknesses 4+ cognitive weaknesses

51
Figure 4.5. Prevalence rates of cognitive weaknesses by numbers of subtests administered
0
500
1000
1500
2000
2500
Prevalence Rates of Numbers of Cognitive Weaknesses
0 cognitive weaknesses 1 cognitive weaknesses
2 cognitive weaknesses 3 cognitive weaknesses
4 cognitive weaknesses

52
CHAPTER FIVE:
DISCUSSION
The field of special education has historically struggled with determining who
truly has a disability, and how we operationally define disabilities. In 2001, the U.S.
Department of Education, wrote a manifesto reporting that special education was
overpopulated and therefore costing the government too much money. Additionally, by
providing services to students who may not need them, they were teaching these students
learned helplessness and dependency. Special education, in order to effectively help
students, must serve the students who only truly need services, as well as only serving the
number of students it can afford to help (Turnbull, 2009). Knowledge of the base rates of
disabilities can help to inform decisions based on the number of children who could
qualify for special services.
Learning disabilities, in particular, have been widely criticized by educators and
politicians for over diagnosing students (Dombrowski, Kamphaus & Reynolds, 2004;
Etscheidt, 2012). Historically, the assessment of learning disabilities has gone through
numerous changes, often to limit the number of children who receive special education
services (Etscheidt, 2012). The historical inconsistency in methods of diagnosis have
been one source of criticisms for the diagnosis of learning disabilities. The lack of federal
eligibility criteria for learning disabilities allowed each state to create its own diagnosis
model. This led to wide spread differences in eligibility requirements across states and

53
districts, where some states used a cut score of 15 points between ability and
achievement, whereas other states used 20 points. Due to the lack of consistency, a child
could qualify as having a learning disability in one state, but not the other. These
differences vary not only on the state level, but also by district or even psychologist.
Unfortunately, the differences in methodology can result in differences in base rates of
learning disabilities, thus causing problems for feasibility of special education services
from a financial and administrative perspective. (Hallahan, Keller, & Ball, 1986; Scruggs
& Mastropieri, 2002; Reschly & Hosp, 2004; Maki, Floyd & Roberson, 2015). This lack
of uniformity also affects consistency across not only eligibility but also for research
studies, where qualification criteria may vary across studies. Research based on
something that is inconsistently defined contributes to confusion in the field and a lack of
generalizable results (Dombrowski, Kamphaus & Reynolds, 2004). Therefore, in order
for learning disabilities to be an accepted construct, practitioners and researchers must be
able to agree on uniform criteria for the diagnosis of a learning disability.
A recent approach for diagnosing learning disabilities are patterns of strengths and
weaknesses approaches (Maki, Floyd & Roberson, 2012; Miciak, Taylor, Cirino,
Fletcher, Williams & Vaughn, 2015). While several different models exist, these models
generally examine cognitive strengths and weaknesses that have been shown by research
to be correlated with a learning disability in a specific area (Hale & Fiorello, 2004). This
model has a strong theoretical basis; however, the base rates of students with strengths
and weaknesses have yet to be researched. Base rates are critical for determining the
feasibility of the method of identification. The current study attempted to fill this gap in
the research by identifying the number of children who would likely be identified as
54
having a learning disability, using a strengths and weaknesses approach. Additionally, the
current study identified certain factors that may impact the base rate, such as the number
of tests administered and the cut off score used in criteria for a cognitive weakness.
Overall, the results of the study indicated that the cut off score used and the
number of subtests administered had a significant impact on the number of children
identified as having a cognitive and academic weakness. For example, the results
indicated that when using a cut off score of 85 using the standard cognitive battery,
36.78% of the sample would have at least one cognitive and academic weakness; whereas
42.15% of the sample would have a cognitive weakness using the CHC battery. However,
when using a cut off score of 80 with the standard cognitive battery, 20.82% of the
sample would have at least one cognitive and academic weakness, and 26.86% of the
sample would have at least one cognitive and two academic weaknesses with the CHC
battery. These results demonstrate that there is a natural variation of test scores among
typical children, and to be cautious when identifying cognitive weaknesses.
The current study utilized a normative sample, where we were unable to determine
whether these students would truly meet diagnostic criteria. In clinical practice,
approximately 4% of the current sample may be excluded due to receiving a diagnosis for
other conditions (e.g. blindness, deafness) (Dombrowski, Kamphaus & Reynolds, 2004).
Additionally, approximately 10% may be found to have weaknesses not related to the
academic disability or demonstrate growth in academic areas. Based upon the results of
this study, using a standardized cut score of 80 would identify approximately 6% of
children. Therefore, this statistic is in line with the current prevalence of rates of SLD
(5%) (Heward, 2006). If using the IAM model (see Table Eleven), approximately 74% of
55
students would receive Tier One services. The results of the study also indicate that when
administering a greater number of subtests, clinicians should interpret these scores with
caution. In particular, clinicians may choose more stringent criteria when interpreting
these test results or look for themes across tests.
This research exemplifies the importance of uniform methods and criteria for
identifying disabilities, specifically for learning disabilities. Variations in methods can
cause over or under identification, and lead to inconsistencies in base rates. Providing
consistency in eligibility is key in order to provide a fair determination of diagnosis
across practitioners. The cut off score that is used will change the sensitivity and
specificity of the measure. For instance, higher cutoff scores will be more likely to
identify those that have a cognitive weakness, and thus improved sensitivity. However, a
higher cutoff score is also more likely to include those that do not have any cognitive
weaknesses, thus reduced specificity (Brooks, 2009).
While the current study contributes significantly to research in this area by
providing base rates for cognitive and academic weaknesses, there are significant
methodological implications. Primarily, the study was able to identify specific
weaknesses of students, but was unable to determine if the specific cognitive weaknesses
were concordant with the student’s academic weaknesses. Additionally, the study used
normative data from the Woodcock-Johnson tests rather than testing individual students.
While this allowed for access to large amounts of data, we were unable to have any
information on possible exclusionary factors of the children included in the study.
Therefore, we do not know the number of children who would be excluded due to
exclusionary criteria. As this is data from a normative sample, individuals with specific

56
impairments or disabilities may have also been excluded from the study. Furthermore, a
comprehensive assessment of learning disabilities would not only consider test scores,
but would also consider teacher reports, classroom observations, and an academic history
(including previous interventions). Therefore, it is likely that this methodology over
identified students who may have been excluded under normal eligibility criteria.
Clinical Implications and Recommendations
Previous research has found that clinicians tend to overestimate the precision of their
conclusions (Kamphaus, Winsor, Rowe, & Kim, 2012). Clinicians often interpret low
scores on a single test as a cognitive impairment. However, the more tests that are
administered, the chances of having a low score increases above the typical rate for a
single-score. For example, according to a normal distribution, approximately 5% of
children will obtain a score at or below the 5th percentile for a single subtest. However, as
the number of subtests are added, approximately 20% of typically developing children
and adolescents obtain an index score in the 5th percentile when looking at the battery of
tests (Brooks, 2010). The current study provides further evidence that a low score is
relatively common within a normal population.
Based on this information, practitioners should challenge their theories with
alternative hypotheses in order to determine the accuracy of their conclusion. For
instance, a clinician may use discrepancy score tables from the test manual in order to
determine if the difference between the two standard scores is statistically significant, and
not attributed to chance. However, even if a difference is significant, it may not be
clinically meaningful if the difference is common in the population (Kamphaus, Winsor,

57
Rowe, & Kim, 2012). The current study found that a significant proportion of the
population may have a cognitive weakness, through natural variations of test scores. By
determining the frequency of the score difference in the population (i.e. base rate),
clinicians can determine if the personal strength or weakness is clinically significant
(Kamphaus, Winsor, Rowe, & Kim, 2012).
Kamphaus (2001) suggested an integrated method of test interpretation in order to
deal with the low reliability and validity of score profiles. Primarily, intelligence results
should be interpreted within the context of other assessment results (i.e. background
information, clinical findings, etc.). Secondly, all interpretations made should be
supported by a theory based on research. (Kamphaus, Winsor, Rowe, & Kim, 2012).
While significant differences should be analyzed at the subtest level, clinicians should
use critical thinking in order to determine why the differences occur, rather than
automatically concluding that they represent a disability. Therefore, in order to prevent
false positives, clinicians should make sure that the differences found in testing are
consistent with data from other sources. (Konold, Glutting, McDermott, Kush, &
Watkins, 1999).
Future Directions
Future research is necessary in order to further determine the base rates of
children who may be identified as having a learning disability. While utilizing normative
data has certain advantages, using real case examples could help to obtain better accuracy
for base rates. Applying similar procedures within specific school sites with real cases,
rather than normative samples, would allow researchers to better determine base rates
58
within these populations. Specifically, researchers should further determine the base rates
of patterns of strengths and weaknesses in examples where the cognitive weakness
specifically maps onto the academic weakness. Additionally, future research is needed to
compare the use of different PSW approaches. Future research should examine models of
patterns of strengths and weaknesses to determine how base rates may differ according to
various theoretical models.
59
REFERENCES
Aaron, P.G., Joshi, R. M., Gooden, R., & Bentum, K. E. (2008). Diagnosis and treatment
of reading disabilities based on the component model of reading: An alternative to
the discrepancy model of LD. Journal of Learning Disabilities, 41, 67-84.
American Psychiatric Association. (2013). Diagnostic and statistical manual of mental
disorders (5th ed.). Washington, DC: Author.
Arms, E., Bickett, J., & Graff, V. (2008). Gender bias and imbalance: Girls in US special
education. Gender and Education, 20, 349-359.
Aron, L. & Loprest, P. (2012). Disability and the education system. The Future of
Children, 22, 97-122.
Artiles, A. J., & Bal, A. (2008). The next generation of disproportionality research:
Toward a comparative model in the study of equity in ability differences. The
Journal of Special Education, 42, 4-14.
Binder, L. M., Iverson, G. L., & Brooks, B. L. (2009). To err is to human: “Abnormal”
neuropsychological scores and variability are common in healthy adults. Clinical
Neuropsychology, 24, 31-46.
60
Burns, M. K., Jacob, S., & Wagner, A. (2008). Ethical and legal issues associated with
using response-to-intervention to assess learning disabilities. Journal of School
Psychology, 46, 263-279.
Buttner, G., & Hasselhorn, M. (2011). Learning disabilities: Debates on definitions,
causes, subtypes, and responses. International Journal of Disability, Development
and Education, 58, 75-87.
Brooks, B. L., Sherman, E. M. S., Strauss, E., Iverson, G. L. (2009). Developments in
neuropsychological assessment: Refining psychometric and clinical interpretive
methods. Canadian Psychology, 50, 196-209.
Brooks, B. L. (2010). Seeing the forest for the trees: Prevalence of low scores on the
Wechsler intelligence scale for children, Fourth Edition (WISC-IV).
Psychological Assessment, 22, 650-656. N
Cavendish, W. (2013) Identification of learning disabilities: Implications of proposed
DSM-5 criteria for school-based assessment. Journal of Learning Disabilities, 46,
52-57.
Center for Disease and Control Prevention [CDC] (2005).
Chaikind, S., Danielson, L. C., & Brauen, M. L. (1993). What do we know about the cost
of special education? A special review. The Journal of Special Education, 26,
344-370.

61
Cortiello, C. & Horowitz, S. H. (2014). Learning disabilities: Facts, trends, and emerging
issues. Retrieved from http://www.ncld.org/wp-content/uploads/2014/11/2014-
State-of-LD.pdf
Dean, V. J., Burns, M. K., Grialou, T., & Varro, P. J. (2006). Comparison of ecological
validity of learning disabilities diagnostic models. Psychology in the Schools, 43,
157-168.
Decker, S.L. (2012). Dimensional integration of assessment outcomes with intervention
services for children with specific-learning disabilities. Journal of Applied School
Psychology, 28, 175-199.
Dombrowski, S. C., & Gischla, K. L. (2014). Ethical and empirical considerations in the
identification of learning disabilities. Journal of Applied School Psychology, 30, 1
Dombrowski, S.C., Kamphaus, R.W., & Reynolds, C. R. (2004). After the demise of the
discrepancy: Proposed learning disabilities diagnostic criteria. Professional
Psychology: Research and Practice, 35, 364-372.
Etscheidt, S. (2012). “Truly disabled?”: An analysis of LD eligibility issues under the
individuals with disabilities education act. Journal of Disability Policy Studies,
24, 181-192.
Flanagan, D. P. Fiorello, C.A. & Ortiz, S. O. (2010). Enhancing practice through
application of cattell-horn-carroll theory and research: A “Third method”
approach to specific learning disability identification. Psychology in the Schools,
47, 739-760.
62
Galaburda, A. M. (2005). Neurology of Learning Disabilities: What Will the Future
Bring? The Answer Comes from the Successes of the Recent Past. Learning
Disability Quarterly, 28(2), 107-109. doi:10.2307/1593605
Glutting, J. J., McDermott, P. A., Watkins, M. M., & Kush, J. C. (1997). The base rate
problem and its consequences for interpreting children’s ability profiles. School
Psychology Review, 26, 176-188.
Godefroy, O., Gibbons, L., Diouf, M., Nyenhuis, D., Roussel, M., Black, S., Bugnicourt,
J. M. (2014). Validation of an integraed method for determining cognitive ability:
Implications for routine assessments and clinical trials. Cortex, 54, 51-62.
Goldstein, S. (2013). The science of intelligence testing: Commentary on the evolving
nature of interpretations of the Wechsler scales. Journal of psychoeducational
assessment, 31, 132-137.
Gresham, F. M., & Witt, J. C. (1997). Utility of intelligence tests for treatment planning,
classification, and placement decisions: Recent empirical findings and future
directions. School Psychology Quarterly, 12, 249-267.
Hale, Kaufman, Naglieri & Kavale (2006). Implementation of IDEA: Integrating
response to intervention and cognitive assessment methods. Psychology in the
Schools, 43, 753
Hale, J. B., & Fiorello, C. A. (2004). School Neuropsychology: A practitioner’s
handbook. Guilford Press, New York: NY.
63
Hallahan, D.P. & Kauffman, J. M. (1994). Exceptional learners: An introduction to
special education. Pearson, Upper Saddle River: NJ.
Hallahan, D. P., Keller, C. E., & Ball, D. W. (1986). A comparison of prevalence rate
variability from state to state for each of the categories of special education.
Remedial and Special Education, 7, 8-14.
Haynes, S. N., Smith, G. T., & Hunsley, J. D. (2011). Scientific foundations of clinical
assessment. Taylor and Francis, New York: NY.
Heward, W. L. (2006). Exceptional children: An introduction to special education.
Prentice Hall, New York: NY.
Individuals with Disabilities Education Act [IDEA]. (2004). Public Law 108-446.
Retrieved from http://idea.ed.gov/download/statute.html.
Jones, C. T. (2002). A new era: Revitalizing special education for children and their
families. Retrieved from
ecta.center.org/~pdfs/calls/2010/earlypartc/revitalizing_special_education.pdf
Kamphaus, R. W., Winsor, A. P., Rowe, E. W., & Kim. S. (2012). A history of
intelligence test interpretation. In D. P. Flanagan and P. L. Harrison (Eds.),
Contemporary Intellectual Assessment (56-73).New York, NY: Guilford Press.
Kaufman, A. S. (2000). Intelligence tests and school psychology: Predicting the future by
studying the past. Psychology in the Schools, 37, 7-16
64
Konold, T. R., Glutting, J. J., McDermott, P. A., Kush, J. C., Watkins, M. M. (1999).
Structure and diagnostic benefits of a normative subtest taxonomy developed
from the WISC-III standardization sample. Journal of School Psychology, 37, 29-
48.
Kovas, Y., Haworth, C. A., Dale, P. S., Plomin, R., Weinberg, R. A., Thomson, J. M., &
Fischer, K. W. (2007). The genetic and environmental origins of learning abilities
and disabilities in the early school years. Monographs of the Society for Research
in Child Development, 72, 124-144.
Learning Disabilities Association [LDA] (2015). New to LD. Retrieved from
http://ldaamerica.org/support/new-to-ld/
Maki, K. E., Floyd, R. G., & Roberson, T. (2015). State learning disability eligibility
criteria: A comprehensive review. School Psychology Quarterly. Advanced
Online publication. http://dx.doi.org/10.1037/spq0000109
McGrew, K. S., & Woodcock, R. W. (2014). Technical Manual. Woodcock-
Johnson IV. Rolling Meadows, IL: Riverside Publishing.
Meyer, M. S. (2000). The ability-achievement discrepancy: Does it contribute to an
understanding of learning disabilities. Educational Psychology Review, 12, 315-
337.
Miciak, J., Fletcher, J. M., Stuebing, K. K., Vaughn, S., Tolar, T. (2014). Patterns of
cognitive strengths and weaknesses: Identification rates, agreement, and validity
for learning disabilities identification. School Psychology Quarterly, 29, 21-37.
65
Miciak, J., Taylor, W. P., Cirino, P. T., Fletcher, J. M., Williams, J. L., & Vaughn, S.
(2015). Do processing patterns of strengths and weaknesses predict differential
treatment response? Journal of Educational Psychology. Advance online
publication. http:// dx.doi.org/10.1037/edu0000096
National Education Association (NEA). (2007). Truth in labeling: Disproportionality in
Special Education. Retrieved from http://www.nea.org/assets/docs/HE/EW-
TruthInLabeling.pdf
Schretlen, D. J., Testa, S. M., Winicki, J. M., Pearlson, G. D., & Gordon, B. (2008).
Frequency and bases of abnormal performance by healthy adults on
neuropsychological testing. Journal of the International Neuropsychological
Society, 14, 436-455.
Scruggs, T. E., & Mastropieri, M. A. (2002). On babies and bathwater: Addressing the
problems of identification of learning disabilities. Learning Disabilities
Quarterly, 25, 155- 168.
Spencer, M., Wagner, R. K., Schatshcneider, C., Quinn, J. M., Lopez, D., & Petscher, Y.
(2014). Incorporating RTI in a hybrid model of reading disability. Learning
Disability Quarterly, 37, 161-171.
Stuebing, K. K., Fletcher, J. M., Branum-Martin, L., & Francis, D. J. (2012). Evaluation
of the technical adequacy of three methods for identifying specific learning
disabilities based on cognitive discrepancies. School Psychology Review, 41, 3-
22.
66
Tanner-Eggen, C., Balzer, C., Perrig, W. J., & Gutbrod, K. (2015). The
neuropsychological assessment of cognitive deficits considering measures of
performance variability. Clinical Neuropsychology, 30, 217-227.
Turnbull, H. R. (2009). Today’s policy contexts for special education and students with
specific learning disabilities. Learning Disability Quarterly, 32, 3-9.
U.S. Department of Education, National Center for Education Statistics. (2015). Digest of
Education Statistics, 2013 (NCES 2015-011), Chapter 2. Retrieved from
https://nces.ed.gov/fastfacts/display.asp?id=64.