Base Erosion and Profit Shifting (BEPS) Public Discussion ...

BASE EROSION AND PROFIT SHIFTING
IN INDONESIA
Arnaldo Purba
July 2018
A thesis submitted for the degree of
Doctor of Philosophy of
The Australian National University
© Copyright by Arnaldo Purba 2018
All Rights Reserved

i
Statement of Originality of the Thesis
I declare that this thesis is my original work of research undertaken between July 2014
and July 2018 at the Research School of Accounting, Australian National University, in
Canberra, Australia. To the best of my knowledge, all sources and material previously
published or written by any other person have been acknowledged in the text and/or in
the references of the thesis.
Signature :
Date : 20 July 2018

ii
Acknowledgements
At the end of 2013, I wrote a research proposal about cross-border profit shifting in
Indonesia and sent it to several potential PhD supervisors. In early 2014, Associate
Professor Alfred Tran expressed his willingness to be my PhD chair supervisor, which
provided an opportunity for me to take my research proposal to the next level. Since I
joined the Research School of Accounting (RSA) at the College of Business and
Economics, Australian National University (ANU), in July 2014, Alfred has provided
unfailing guidance, support and assistance through all stages in the writing of this thesis.
This thesis would not have been completed without Alfred’s expertise and invaluable
comments, and I thank him for his enthusiasm and competency. My sincere thanks also
go to my co-supervisors, Associate Professor Mark Wilson and Dr Sorin Daniliuc, for
sharing their expertise and encouraging comments. While I have benefited from my
supervisors’ guidance, I take full responsibility for the views expressed in this thesis and
the manner in which they are expressed.
I thank the Indonesian Government (Ministry of Finance) for giving me an
invaluable opportunity to undertake my PhD course, and the Australian Government
(Department of Foreign Affairs and Trade) for providing funds through the Australia
Awards Scholarships. My gratitude also goes to the Directorate General of Tax (DGT)
for allowing me to take four years of study leave during my PhD course. Thank you very
much to the people in charge at the personnel department (Bagian Kepegawaian) who
kept me up-to-date with employment affairs information and assisted me while I was on
study leave. The support of the Australia Awards Liaison Office staff at the ANU is much
appreciated.

iii
My sincere appreciation goes to the officials of the Directorate of Dissemination,
Services and Public Relations (Direktorat Penyuluhan, Pelayanan dan Hubungan
Masyarakat/Direktorat P2Humas) and the Directorate of Tax Information Technology
(Direktorat Teknologi Informasi Perpajakan/Direktorat TIP) at the DGT for allowing me
to use confidential tax return data for Indonesia. In particular, I would like to express my
special thanks to Yulli Soelistyani at the Direktorat TIP for generously donating her
precious time to collect the tax return data.
My appreciation also goes to the wonderful people at the RSA, including my
lecturers, administration staff and my fellow students in the PhD program. In particular,
I want to thank the Director of RSA, Professor Juliana Ng, and the Higher Degree by
Research (HDR) Convenor, Professor Neil Fargher, for their endless support. I also want
to thank Professor Greg Shailer for helping me to develop an understanding of the
fundamentals of research methodology, and Associate Professor Mark Wilson for guiding
me through the maze of accounting statistical mechanics.
I thank Elite Editing for their thesis editing assistance. Their academic thesis editing
service was rendered in accordance with the Australian Standards for Editing Practice.
Finally, my heartfelt thanks go to my dear wife Ing and our beloved son Kenzo, to
whom I am truly indebted for all of their sacrifices, patience, understanding and
encouragement. I dedicate this thesis to both of you.

iv
Abstract
The ownership, location and internalisation (OLI) framework introduced by
Dunning (1977) explains why multinational enterprises (MNEs) establish subsidiaries
overseas. According to the OLI framework, MNEs have advantages over companies that
operate at the domestic level, including more power, such as patent, trademark and
international reputation (ownership), more flexibility to choose locations for better access
to customers and lower tariffs (location) and, most importantly, broader opportunities to
set up intra-firm prices and processes (internalisation). While there have been strong
indications that Indonesian affiliates of foreign MNEs have been using the internalisation
aspects of the OLI framework, such as profit shifting, to avoid Indonesian corporate
income tax (CIT), there are no peer-reviewed studies on the existence of profit shifting
by MNEs in Indonesia.
When an MNE shifts profit out of a host country, it simultaneously reduces both
the taxable income and the accounting profit reported in the host country. Therefore, in
this thesis, profit is represented by two measurements: taxable income and accounting
profit before tax.
Using confidential tax return data for the period 2009–2015, this thesis investigates
the issue of profit shifting in Indonesia by conducting three related studies, which are
outlined below.
Study 1 investigates whether foreign-owned Indonesian companies (FOICs) shift
profits out of Indonesia by examining the effect of the difference in statutory corporate
tax rates (STR) between the source country of investment and Indonesia on the profit
reported by FOICs in Indonesia. The regression results show that the lower the tax rate

v
of the parent country relative to Indonesia, the lower the profit reported by FOICs,
providing empirical evidence consistent with the profit shifting occurring in Indonesia.
Study 2 further investigates whether FOICs shift profits out of Indonesia by
following an approach introduced by Hines and Rice (1994) based on the Cobb–Douglas
production function with some modifications. The regression results show that a tax rate
that is one percentage point lower in the parent country reduces the accounting profit and
taxable income reported by FOICs in their Indonesian tax returns by 2.56% and 2.89%,
respectively. These findings are consistent with the findings of Study 1 and provide
further evidence of profit shifting from Indonesia to low-tax countries.
Study 3 attempts to provide more direct evidence of the existence of cross-border
profit shifting in Indonesia by investigating whether FOICs use the two most commonly
used channels to shift profits: intra-group transfer pricing and debt financing. This is done
by matching FOICs with comparable domestic-owned Indonesian companies (DOICs)
and comparing the paired sample in terms of (1) earnings before interest and taxes scaled
by sales (to detect profit shifting using transfer pricing), and (2) long-term debt to related
parties scaled by assets (to detect profit shifting using intra-group debt financing). The
results suggest that while FOICs use both channels to shift profits, transfer pricing plays
a more significant role than debt financing.
This thesis contributes to the literature by providing empirical evidence of profit
shifting by MNEs to erode the CIT base of Indonesia.

vi
Contents
Statement of Originality of the Thesis ............................................................................... i
Acknowledgements ........................................................................................................... ii
Abstract ............................................................................................................................ iv
Contents ........................................................................................................................... vi
List of Tables.................................................................................................................... xi
List of Figures ................................................................................................................ xiii
List of Acronyms ........................................................................................................... xiv
CHAPTER 1: INTRODUCTION ............................................................................. 1
1.1 Background and Motivation .................................................................................... 1
1.2 Research Question ................................................................................................... 5
1.3 Major Findings ........................................................................................................ 6
1.4 Outline of the Thesis ................................................................................................ 8
CHAPTER 2: TAXATION IN INDONESIA ......................................................... 11
2.1 Indonesian Tax System .......................................................................................... 11
2.1.1 Company Income Tax System in Indonesia .............................................. 13
2.1.2 Definition of Foreign Direct Investment and the Foreign Income
Tax Offset in Indonesia ............................................................................. 22
2.2 Indonesian Tax Administration ............................................................................. 28
2.2.1 Tax Reforms in Indonesia ......................................................................... 30
2.2.2 Tax Revenue and Tax Compliance in Indonesia ....................................... 37
2.3 Chapter Summary .................................................................................................. 45
CHAPTER 3: PROFIT SHIFTING BY MNEs ..................................................... 48

vii
3.1 Theory of Tax Avoidance and Methods Used to Identify the Incidence of
Base Erosion and Profit Shifting ........................................................................... 49
3.1.1 Theory of Corporate Tax Avoidance ......................................................... 49
3.1.2 Definition of Multinational Enterprises and Theory of Tax
Avoidance by Multinational Enterprises ................................................... 55
3.1.3 Methods and Indicators Used to Identify the Incidence of Base
Erosion and Profit Shifting ........................................................................ 63
3.2 Profit Shifting by Multinational Enterprises in Developed Countries ................... 65
3.3 Profit Shifting by Multinational Enterprises in Developing Countries and the
Base Erosion and Profit Shifting Project ............................................................... 72
3.4 Profit Shifting by Foreign-owned Indonesian Companies and How the
Directorate General of Tax Fights It ...................................................................... 75
3.5 Chapter Summary .................................................................................................. 92
CHAPTER 4: RELATION BETWEEN TAX RATE DIFFERENCE AND
THE PROFIT REPORTED IN INDONESIA ............................................................ 95
4.1 Introduction............................................................................................................ 95
4.2 Literature Review and Hypothesis Development .................................................. 96
4.3 Research Design .................................................................................................. 101
4.3.1 Sample Selection and Period of Study .................................................... 101
4.3.2 Measurement of Variables and Regression Model .................................. 103
4.4 Empirical Results ................................................................................................. 106
4.4.1 Summary Statistics .................................................................................. 106
4.4.2 Regression Results ................................................................................... 109
4.4.3 Further Analyses ...................................................................................... 113
4.5 Chapter Summary ................................................................................................ 116

viii
CHAPTER 5: DETECTING PROFIT SHIFTING IN INDONESIA USING
THE HINES AND RICE APPROACH..................................................................... 119
5.1 Introduction.......................................................................................................... 119
5.2 Literature Review and Hypothesis Development ................................................ 120
5.2.1 Hines and Rice’s Approach to Detecting Cross-border Profit
Shifting .................................................................................................... 120
5.2.2 Empirical Evidence of Profit Shifting in Developing Countries
and Hypothesis ........................................................................................ 123
5.3 Research Design .................................................................................................. 126
5.3.1 Sample Selection and Period of Study .................................................... 126
5.3.2 Measurement of Variables and Regression Model .................................. 127
5.4 Empirical Results ................................................................................................. 130
5.4.1 Summary Statistics .................................................................................. 130
5.4.2 Regression Results ................................................................................... 133
5.5 Chapter Summary ................................................................................................ 135
CHAPTER 6: HOW DO FOREIGN-OWNED INDONESIAN COMPANIES
SHIFT PROFITS OUT OF INDONESIA? .............................................................. 137
6.1 Introduction.......................................................................................................... 137
6.2 Literature Review and Hypotheses Development ............................................... 138
6.2.1 Definitions of Transfer Pricing, Arm’s-length Principle and Debt
Financing ................................................................................................. 138
6.2.2 Prior Studies and Hypotheses Development ........................................... 141
6.3 Research Design .................................................................................................. 146
6.3.1 Sample Selection and Period of Study .................................................... 146
6.3.2 Measurement of Variables and Statistical Procedures ............................ 147

ix
6.4 Empirical Results ................................................................................................. 152
6.4.1 Summary Statistics .................................................................................. 152
6.4.2 Results of Statistical Analyses ................................................................. 156
6.5 Chapter Summary ................................................................................................ 162
CHAPTER 7: SUMMARY AND CONCLUSION .............................................. 164
7.1 Overview and Conclusions of the Thesis ............................................................ 164
7.2 Contributions of the Study ................................................................................... 169
7.3 Limitations of the Study ...................................................................................... 170
7.4 Future Research ................................................................................................... 172
7.5 Concluding Remarks ........................................................................................... 173
REFERENCES ............................................................................................................ 175
Appendix 1 Indonesian Corporate Tax Return Form .................................................... 188
Appendix 2 Tax Treaty Network of Indonesia as at 30 June 2018 ............................... 197
Appendix 3 Final Sample by Country of Parent, 2009–2015 (Study 1—TI Model) .... 200
Appendix 4 USD—IDR Exchange Rates for Tax Purposes, 2009–2015 ..................... 203
Appendix 5 Statutory Tax Rates, 2009–2015 ............................................................... 204
Appendix 6 Final Sample by Two-digit Industry Primary Group, 2009–2015 (TI
Model) ....................................................................................................... 208
Appendix 7 Variance Inflation Factor—Study 1 .......................................................... 211
Appendix 8 Regression Result for Industry Groups: Effect of Tax Rate Difference
on TI .......................................................................................................... 212
Appendix 9 Unbalanced Panel Data—Study 1 (TI Model) .......................................... 215
Appendix 10 Final Sample by Country of Parent, 2009–2015 (Study 2) ..................... 216
Appendix 11 Unbalanced Panel Data—Study 2 ........................................................... 221
Appendix 12 Variance Inflation Factor—Study 2 ........................................................ 223

x
Appendix 13 Related Parties under Indonesian Income Tax Law ................................ 224
Appendix 14 Identifying the Obligation to Lodge Annual Tax Return by Looking
at the Tax Identification Number ............................................................ 226
Appendix 15 Final Sample by Country of Parent, 2009–2015 (Study 3) ..................... 228
Appendix 16 Variance Inflation Factor—Study 3 ........................................................ 233
Appendix 17 Regression Result before the Matching Procedure for Industry
Groups: How FOICs Differ from DOICs in Terms of EBIT and
Long-term Liabilities to Related Parties ................................................. 234
Appendix 18 Regression Result after the Matching Procedure for Industry
Groups: How FOICs Differ from DOICs in Terms of EBIT and
Long-term Liabilities to Related Parties ................................................. 241

xi
List of Tables
Table 2.1 Number of DGT Offices by Type, 2009–2015 ............................................... 34
Table 2.2 Central Government Tax Revenue in Billion Rupiah Collected by the
DGT, 2009–2015 ........................................................................................... 38
Table 2.3 Tax-to-GDP Ratio in Indonesia, 2009–2015 .................................................. 41
Table 2.4 Proportion of Taxpayers Filing Tax Returns, 2009–2015 .............................. 43
Table 3.1 Transfer Pricing Cases, 2008–2009 ................................................................ 88
Table 3.2 Tax Treaty Network of Indonesia, 2009–2015 ............................................... 89
Table 4.1 Corporate Tax Rates of Indonesia, Singapore, Japan and Korea, 2009–
2015 ................................................................................................................. 99
Table 4.2 Derivation of the Final Sample of Firm-year Observations—Study 1 ......... 102
Table 4.3 Descriptive Statistics—Study 1 .................................................................... 107
Table 4.4 Pearson Correlation Matrix—Study 1 .......................................................... 108
Table 4.5 Regression Results—Effect of Tax Rate Differences on Profit Reported
by FOICs in Indonesian Tax Return—Using Clustered Standard Errors ..... 111
Table 4.6 Descriptive Statistics After Log-transforming the Dependent Variable ....... 114
Table 4.7 Regression Results—Effect of Tax Rate Differences on Profit Reported
by FOICs in Indonesian Tax Returns—Using Clustered Standard Errors
and Log-transforming the Dependent Variable ............................................ 115
Table 5.1 Derivation of the Final Sample of Firm-Year Observations—Study 2 ........ 127
Table 5.2 Descriptive Statistics—Study 2 .................................................................... 131
Table 5.3 Pearson Correlation Matrix—Study 2 .......................................................... 132
Table 5.4 Regression Results—Effect of Parent’s Tax Rate on Reported AP and TI .. 134
Table 6.1 Final Sample Size—Study 3 ......................................................................... 147

xii
Table 6.2 Descriptive Statistics—Study 3 .................................................................... 153
Table 6.3 Pearson Correlation Matrix—Study 3 .......................................................... 155
Table 6.4 Results of Regression Estimations before the Matching Procedure—
How FOICs Differ from DOICs in Terms of EBIT and Long-term
Liabilities to Related Parties ......................................................................... 157
Table 6.5 Results of Paired t-tests after the Matching Procedure—How FOICs
Differ from DOICs in Terms of EBIT and Long-term Liabilities to
Related Parties............................................................................................... 159
Table 6.6 Results of Regression Estimations after the Matching Procedure—How
FOICs Differ from DOICs in Terms of EBIT and Long-term Liabilities
to Related Parties .......................................................................................... 160

xiii
List of Figures
Figure 2.1 Registration of an FOIC in Indonesian Tax Offices ...................................... 24
Figure 2.2 Organisational Chart of the DGT Head Office .............................................. 29
Figure 2.3 Organisational Chart of the Operational Units of the DGT ........................... 36
Figure 2.4 Corporate Income Tax Revenue Contribution, 2009–2015 ........................... 40
Figure 2.5 Tax-to-GDP Ratio for Indonesia, Malaysia, the Philippines and the
OECD, 2009–2015 ........................................................................................ 42
Figure 3.1 Selling a Special-purpose Vehicle in a THC by a Foreign Company
Deemed as Selling a Resident Company under Income Tax Law ................. 84
Figure 3.2 Related Parties Based on Ownership ............................................................. 85
Figure 4.1 Indonesian GDP at Current Prices, 2009–2015 ........................................... 113
Figure 7.1 Scope of the Study ....................................................................................... 171

xiv
List of Acronyms
A Level of productivity in the local country
ABDC Australian Business Deans Council
AOI Apple Operations International
ATE Average treatment effect
AP Pre-tax accounting profit
APA Advance Pricing Agreement
AP/S AP scaled by total sales
ASEAN Association of Southeast Asian Nations
ASX Australian Securities Exchange
BBC British Broadcasting Corporation
BEPS Base erosion and profit shifting
BKPM Badan Koordinasi Penanaman Modal (Indonesian Investment
Coordinating Board)
BPS Badan Pusat Statistik (Statistics Indonesia)
BTD Book-tax difference
CapInt Capital intensity
CFC Controlled Foreign Company
CIT Corporate income tax
DGCE Directorate General of Custom and Excise
DGT Directorate General of Tax
DOIC Domestic-owned Indonesian company
EBIT Earnings before interest and taxes
EBIT/S Earnings before interest and taxes scaled by total sales

xv
EoI Exchange of information
ETR Effective tax rate
FDI Foreign direct investment
FITO Foreign income tax offset
FOIC Foreign-owned Indonesian company
FTO Foreign investment tax office
G20 Group of Twenty
GDP Gross domestic product
GMM Generalised method of moment
GPPTL General Provisions and Procedures of Taxation Law
HRA Hines and Rice approach
IDX Indonesian Stock Exchange
IDR Indonesian Rupiah
IMF International Monetary Fund
ITL Income Tax Law
K Capital
KMK Keputusan Menteri Keuangan (Finance Minister Decree)
KPMG Klynveld Peat Marwick Goerdeler (one of the Big Four auditors)
lnX Natural logarithm of X
L Labour
LTO Large taxpayer office
LTL Long-term liability
LTL_RP/TA Long-term liabilities to related parties scaled by total assets
MAP Mutual agreement procedure
MNE Multinational enterprise

xvi
MoF Ministry of Finance
MTO Medium taxpayer office
NPWP Nomor pokok wajib pajak (see TIN)
OECD Organisation for Economic Co-operation and Development
OLI Ownership, location and internalisation
OLS Ordinary least squares
PBB P2 Pajak bumi dan bangunan sektor pedesaan dan perkotaan (Rural and
urban property tax)
PBB P3 Pajak bumi dan bangunan sektor perkebunan, perhutanan dan
pertambangan (Plantation, forestry and mining property tax)
PER Peraturan Direktur Jenderal Pajak (Director General of Tax Regulation)
PLCTO Public listed company tax office
PMK Peraturan Menteri Keuangan (Finance Minister Regulation)
PSAK Pernyataan Standar Akuntansi Keuangan (Indonesian Financial
Reporting Standard)
PSM Propensity score matching
PTL Property Tax Law
PTR Parent’s tax rate
RMTO Regional medium taxpayer office
Rp Rupiah, the currency of Indonesia
SPV Special purpose vehicle
STLG Sales tax on luxury goods
STO Small taxpayer office
STR Statutory tax rate
TDDPO Taxation Data and Document Processing Office

xvii
THC Tax haven country
TI Taxable income
TIN Tax identification number
TIU Technical implementing units
TI/S TI divided by total sales
TRdiff Tax rate difference
TSDCO Tax service, dissemination, and consultation office
UN United Nations
US United States of America
USD US dollar
UU KUP Undang-undang Ketentuan Umum dan Tata Cara Perpajakan (GPPTL)
UU PBB Undang-undang Pajak Bumi dan Bangunan (PTL)
UU PPh Undang-undang Pajak Penghasilan (ITL)
UU PPN Undang-undang Pajak Pertambahan Nilai (VATL)
VAT Value-added tax
VATL Value-Added and Luxury Goods Tax Law
VIF Variance inflation factor
WB The World Bank
WIPS World Investment Prospects Survey

1
CHAPTER 1:
INTRODUCTION
1.1 Background and Motivation
The number of corporations operating across countries, known as multinational
enterprises (MNEs), has increased significantly since the 1980s (Markusen, 2002). The
relationship between MNEs and the countries in which these companies operate (host
countries) is deemed to be mutually beneficial. While MNEs seek lower production costs
by investing in host countries, host countries benefit from several advantages offered by
MNEs, including tax revenue, employment and transfer of knowledge and skills.
However, the growth of MNEs has worried many policymakers and academics, who have
identified MNEs as shifting profits to low-tax countries (Kind, Midelfart, & Schjelderup,
2005). In response, governments have taken action to fight profit shifting by MNEs. For
example, in 1998, the Organisation for Economic Co-operation and Development
(OECD) published a report entitled ‘Harmful Tax Competition: An Emerging Global
Issue’ (OECD, 1998). Larger-scale action took place in 2013, when the OECD headed
the Base Erosion and Profit Shifting (BEPS) project, which was initiated by the Group of
Twenty (G20). Since then, the project—better known as the OECD/G20 BEPS project,
or simply the BEPS project—has set the agenda for tax authorities in many countries to
jointly combat profit shifting by MNEs.
However, the incidence of profit shifting is still notable. For example, in May 2016,
the British Broadcasting Corporation (BBC) reported that 100 French tax officials and
police raided the Paris headquarters of Google, which was accused of owing €1.6 billion
in unpaid taxes as a result of international tax arrangements (BBC, 2016). Prominent
online sources such as the Financial Times (Thomson, Waters, & Houlder, 2016),

2
Associated Press (Satter & Liedtke, 2016), Guardian (Chrisafis & Garside, 2016), USA
Today (Hjelmgaard, 2016), Reuters (Rose & Labbé, 2016) and the Telegraph (Titcomb,
2016) also covered this story. For example, according to the Financial Times, Google
allegedly used complex tax avoidance to shift profits to low-tax jurisdictions.
Specifically, the Financial Times reports that Google set up its European headquarters in
Dublin, Ireland (a country that imposes the lowest corporate tax rate in Europe), and
channelled its profits through the country from all over Europe. As a result, in France in
2014, the company paid only €5 million in corporate tax out of total revenues of €225.4
million (Thomson, et al., 2016). This is a strong indication that large MNEs have been
using BEPS to avoid paying taxes in host countries.
BEPS is defined as strategies used by MNEs to exploit gaps and mismatches in tax
rules in different countries by shifting profits to low-tax locations to reduce the corporate
tax being paid (OECD, 2014a). By definition, BEPS is a tax-avoidance strategy and is
therefore legal, whereas tax evasion is illegal: ‘Although tax avoidance is mostly legal
and tax evasion is not, both result in loss of revenue to the government, and, by the
definition, both defeat the intent of the government in enacting its taxing statutes’ (United
Nations (UN), 2011, p. 437). Accordingly, many countries and prominent international
institutions, including the OECD, International Monetary Fund (IMF), World Bank (WB)
and UN, consider BEPS an essential global issue that needs to be eliminated or at least
restricted. They also agree that actions to address BEPS should involve both developed
and developing countries because cross-border tax-avoidance activities are likely to occur
in both.
Most existing studies use data from developed countries, and almost none use data
from developing countries—particularly firm-level tax return data. Some prior studies
reveal that developing countries are victims of profit shifting by MNEs and argue that

3
BEPS may disadvantage developing countries more than developed countries (e.g.
Christian Aid, 2009; Cobham, 2005; Oxfam, 2000; Baker, 2005). However, these studies
are not peer-reviewed and therefore may not provide sufficiently rigorous empirical
evidence to support their argument.
Recently, some peer-reviewed studies (e.g. Crivelli, De Mooij, & Keen, 2015;
Janský & Prats, 2015; Salihu, Annuar, & Obid, 2015) have used financial data for MNEs
to examine the incidence of BEPS in developing countries. For example, in a working
paper published by the IMF, Crivelli, et al. (2015) provide empirical evidence that
developing countries are more vulnerable to cross-border profit shifting than developed
countries because of lower tax inspection capacity and greater dependency on corporate
tax revenues. However, according to the OECD (2015a), studies that use financial data to
detect the incidence of BEPS may provide less reliable results than studies that use tax
return data. Compared with financial data, tax return data can better capture the existence
of profit shifting by MNEs because the latter can better capture the incidence of BEPS
(OECD, 2015a). Therefore, while recent peer-reviewed studies have made a significant
contribution to literature relating to BEPS in developing countries, further studies are
needed to provide more reliable empirical evidence on the incidence of BEPS in
developing countries.
This thesis pursues empirical evidence of both the existence of cross-border profit
shifting1 and the channels used to shift profits by analysing Indonesian confidential
corporate tax return data. It is important to note that the data are obtained from the
Directorate General of Tax (DGT)—the Indonesian tax authority—under a data
nondisclosure agreement. The DGT removes all identifying particulars from the data
1 Cross-border profit shifting, profit shifting and BEPS are used interchangeably throughout this thesis.

4
because of privacy protection requirements. As a result, firms are anonymised, and this
thesis only uses tax return data supplied by the DGT.
A key data item in tax returns is taxable income (TI), which is the tax base of income
tax. Thus, any reduction in TI is a direct measurement of tax base erosion. Given that
profit shifting reduces the TI reported to the tax authority, the use of TI data reported in
tax returns will capture the incidence of profit shifting and the erosion of the income tax
base better than financial data. Therefore, while this thesis measures profit in two ways—
TI and accounting profit (AP), which are both reported by foreign-owned Indonesian
companies (FOICs) in their Indonesian tax returns—the key measurement of profit used
as the dependent variable to investigate profit shifting is TI.
This thesis derives evidence for the existence of profit shifting by foreign MNEs by
examining whether the corporate tax rates of the parent companies affect the magnitude
of profits reported by FOICs (i.e., entities through which foreign MNEs operate in
Indonesia) in their Indonesian tax returns.2 Evidence for the channels used by FOICs to
shift profits out of Indonesia is identified by comparing the profitability and debts to
related parties between FOICs and matched domestic-owned Indonesian companies
(DOICs). The findings of this thesis are expected to fill the gap in the literature by
providing more reliable empirical evidence about the incidence of BEPS in a major
developing country, namely, Indonesia.
This thesis uses Indonesia as the focus of the research. As a G20 member, Indonesia
is actively involved in the BEPS project. Further, Indonesia was among the top 20 foreign
direct investment (FDI) destination countries in 2012, and it was the world’s fourth most
prospective FDI destination country in 2013–2015 (UN, 2013a).3 Therefore, in terms of
2 Appendix 1 presents the Indonesian corporate tax return form known as Form 1771. 3 This statistic is based on the World Investment Prospects Survey (WIPS) that was conducted by the UN
in 2013. According to the UN (2013b), the survey results are based on 225 validated responses, and the
survey was conducted among executives of the 5,000 largest nonfinancial MNEs, as well as professionals

5
the size of the economy and the magnitude of inbound FDI to the economy, studying
cross-border profit shifting in Indonesia is substantially valuable, and the evidence
provided will be beneficial to better understand the issue of profit shifting—particularly
from the perspective of an emerging economy.
1.2 Research Question
The central research question of this thesis is: Do FOICs shift profits out of
Indonesia to the parent’s country or other low tax countries?
This thesis defines ‘parent’s country’ as the country in which the immediate parent
of an FOIC is located—not the location of the ultimate parent. The DGT only provides
the country of the immediate parents of FOICs. In addition, this thesis defines ‘parent’s
tax rate’ as the statutory tax rate of the country in which the immediate parent is located.
For example, PT Google Indonesia is an FOIC and a subsidiary of Google Asia Pacific
Pte Ltd, which is located in Singapore. Google Asia Pacific is ultimately owned by
Alphabet Inc. in the United States (US). Here, Google Asia Pacific Pte Ltd. is the
immediate parent. Therefore, this thesis uses the Singaporean tax rate rather than the US
tax rate to examine whether PT Google Indonesia shift profits out of Indonesia.
Three studies are conducted to provide answers to the central research question.
Study 1 and Study 2 detect whether FOICs use profit shifting strategies to avoid
Indonesian corporate income tax (CIT). Study 3 identifies the channels used by FOICs to
shift profits out of Indonesia. The research questions of the three studies are presented
below.
working in 245 national and subnational investment promotion agencies. This information demonstrates
the worthiness of choosing Indonesia as the subject of the study—particularly in terms of the magnitude of
FDI.

6
Study 1: Does the tax rate difference between the country of residence of an
FOIC’s parent and Indonesia affect the TI and pre-tax AP reported by FOICs in
their Indonesian tax returns, after controlling for firm size, maturity and industry?
Study 2: Does the tax rate of the country of residence of an FOIC’s parent affect
the TI and AP reported by FOICs in their Indonesian tax returns, after controlling
for the true profit generated by capital and labour inputs?
Although the research question of Study 2 is similar to that of Study 1, Study 2 uses
a different approach to detect profit shifting. Specifically, Study 2 uses the Hines and Rice
(1994) approach (hereafter HRA), which is a widely recognised technique used to detect
the existence of cross-border profit shifting by MNEs.
Study 3: How do FOICs shift profits from Indonesia?
Study 3 attempts to find more direct evidence of the existence of BEPS in Indonesia
by identifying the channels that FOICs are likely to use to shift profits by comparing the
performance between FOICs and comparable DOICs in two indicators that are expected
to capture the two most widely used channels by MNEs to shift profits: transfer pricing
and high debt financing by related parties. The two indicators are: (1) earnings before
interest and taxes scaled by total sales (to detect profit shifting using the transfer pricing
channel) and (2) long-term debt to related parties scaled by total assets (to detect profit
shifting using the debt financing channel).
1.3 Major Findings
Study 1 uses the statutory corporate tax rate (STR) difference between countries in
which the parent companies are located and Indonesia (STRParent − STRIndonesia) as
incentives for FOICs to determine the magnitude of profits they report in their Indonesian
tax returns. The key finding is that the STR difference is positively associated with the

7
level of TI and AP reported by FOICs. That is, the lower the parent’s STR relative to the
Indonesian STR, the lower the TI and AP reported by FOICs, and vice versa. This
suggests that FOICs shift profits out of Indonesia to low-tax jurisdictions to avoid
Indonesian CIT. More precisely, the regression result shows that an STR in the parent’s
country that is one percentage point higher (lower) relative to Indonesia is associated with
a 1.68% and a 1.27% increase (decrease) in the TI and AP respectively (both scaled by
total sales) reported by FOICs in their Indonesian tax returns. This finding provides
preliminary evidence of the incidence of cross-border profit shifting in Indonesia and is
further supported by the empirical evidence from the other two studies in this thesis.
Study 2 further examines the presence of cross-border profit shifting in Indonesia
by adopting the HRA with some modifications. This approach is widely used to
investigate the incidence of profit shifting by MNEs. After analysing a final sample of
more than 3,000 firm-year observations from 2009 to 2015, this study finds that the effect
of a variation of one percentage point in the parent’s tax rate on reported AP (TI) by
FOICs to the Indonesian tax authority is 2.56% (2.89%).
Therefore, the results of Study 1 and Study 2 provide evidence that profit shifting
occurs in Indonesia. Study 3 attempts to discover how FOICs shift profits. More
specifically, it investigates whether FOICs use the two most widely used channels
(transfer pricing arrangements and high debt financing) to shift profits by comparing
profitability and debts to related parties between FOICs and DOICs. The first step of the
investigation is to generate a dataset that contains a matched DOIC for each FOIC. This
study uses the propensity score matching (PSM) technique for the matching procedure.
Next, the matched dataset obtained from the PSM procedure is analysed using paired t-
tests and ordinary least squares (OLS) regressions. The results of all tests suggest that
FOICs use both transfer pricing and debt financing to shift profits out of Indonesia.

8
Further, the regression results indicate that transfer pricing plays a more important role
than debt financing in FOICs avoiding Indonesian CIT.
1.4 Outline of the Thesis
This thesis consists of seven chapters.
Chapter 1 introduces the thesis in four sections. The first section provides the
background and motivation of the study, and it describes the incidence and contemporary
development of cross-border profit shifting around the world, as well as the importance
of providing empirical evidence from a developing country’s perspective. The second
section states the central research question of the thesis and the research question for each
study. Section 3 presents the key findings of the three studies in this thesis. Finally,
Section 4 outlines the structure of the thesis.
Chapter 2 explains taxation in Indonesia in two parts. The first part describes the
Indonesian tax system, including how companies are taxed under Indonesian tax law, how
Indonesian tax law defines FDI, how FOICs register in an Indonesia tax office and how
Indonesian tax law treats income tax paid overseas. The second part explains tax
administration in Indonesia, including the organisation structure of the DGT, how tax
reforms have affected the structure of the Indonesian tax office and the quality of tax
services and data, and the performance of tax revenue and tax compliance in Indonesia.
Chapter 3 presents a literature review of cross-border profit shifting. First, it
explains the theory of corporate tax avoidance, with an emphasis on the theory of tax
avoidance by MNEs, and methods used to identify the existence of profit shifting by
MNEs. It then provides a general review of studies that focus on tax avoidance by MNEs
in developed countries and developing countries. Finally, it discusses profits shifting
activities by FOICs and efforts undertaken by the DGT to fight profit shifting.
9
Chapter 4 presents Study 1 of the thesis. Prior studies allege that MNEs shift profits
from both developed and developing countries. However, few empirical studies have used
tax return data from developing countries. Study 1 fills this gap by investigating how the
tax rate difference between the parent country of an FOIC and Indonesia affects the profit
reported by the FOIC in its Indonesian tax return. This is the first step in identifying the
existence of profit shifting by foreign MNEs operating in Indonesia.
Chapter 5 presents Study 2 of the thesis. According to Fuest and Riedel (2012),
there is limited knowledge of profit shifting in developing countries because the findings
of most existing studies are difficult to interpret, mainly because of problems relating to
data reliability and the method used to measure profit shifting. Study 2 reinforces the
findings of Study 1, which finds that FOICs shift profits out of Indonesia, using the HRA
with some modifications. The HRA is based on the Cobb–Douglas production function
and has been widely cited in the literature of international tax avoidance—particularly in
studies that focus on detecting the occurrence of cross-border profit shifting.
Chapter 6 presents Study 3 of the thesis. Further to the findings of Study 1 and
Study 2, which suggest that FOICs use profit shifting strategies to avoid Indonesian CIT,
Study 3 attempts to provide more direct evidence of cross-border profit shifting in
Indonesia by examining the channels used by FOICs to shift profits out of Indonesia.
Most existing studies agree that MNEs use two channels to shift profits: transfer pricing
and debt financing. Using transfer pricing, MNEs arrange prices for intra-firm
transactions so they will end up paying lower income taxes than they should. Using debt
financing, MNEs use debt rather than equity to finance their business in high-tax countries
so they can claim interest expenses as a deduction, which leads to low tax liability. This
study investigates whether FOICs use the two channels by comparing FOICs and
comparable DOICs in terms of earnings before interest and taxes scaled by total sales (as

10
a proxy for profit shifting using the transfer pricing channel) and long-term debt to related
parties scaled by total assets (as a proxy for profit shifting using the debt financing
channel).
Chapter 7 concludes the thesis. It presents an overview and conclusion of the thesis,
as well as contributions and limitations of the study, suggestions for future research and
concluding remarks.

11
CHAPTER 2:
TAXATION IN INDONESIA
This chapter discusses taxation in Indonesia in two sections. Section 2.1 describes
the Indonesian tax system. In line with the topic of the thesis, this section mainly focuses
on the tax system that is applicable to company taxpayers. Section 2.2 outlines tax
administration in Indonesia, including Indonesian tax reforms, development of the
Indonesian tax office structure and nationwide network, DGT performance in terms of
tax revenue collected and the extent to which company taxpayers contribute to it, and
performance of Indonesian tax to gross domestic product (GDP) ratio and tax compliance.
2.1 Indonesian Tax System
The general rules and procedures of taxation in Indonesia are regulated under Law
No. 6/1983 (General Provisions and Procedures of Taxation Law) as lastly amended by
Law No. 16/2009 (hereafter GPPTL). Article 1 (1) of GPPTL defines tax as a compulsory
contribution to the state by individuals and entities that is enforceable by law, without
direct benefit in return and is used for the purposes of the state for the greatest prosperity
of the people. In the explanatory section, GPPTL states that the Indonesian tax system
adheres to the self-assessment system, which aims at simpler tax administration.4
The self-assessment system enables taxpayers to assess their own tax liabilities,
such as computing TI and tax liability, paying tax owed and reporting the tax liabilities
in their tax returns. Another important feature of the self-assessment system is that
4 As explained in Section 2.2, one of the most important results of the major tax reform in 1983 was that
the Indonesian tax assessment system shifted from an official assessment system to a taxpayer assessment,
or self-assessment, system.

12
taxpayers are expected to ‘comply willingly without the need for enquiries, obtrusive
investigations, reminders or the threat or application of legal or administrative sanctions’
(James & Alley, 2002, p. 30).
GPPTL Article 1 (2) defines a taxpayer as an individual or entity that possesses tax
rights and obligations pursuant to the provisions in the tax laws. Further, GPPTL Article
1 (3) refers to an entity as a group of people and/or capital that conducts business or not,
such as a company, partnership, state or local government-owned enterprise, cooperative,
pension fund, association, foundation, and social and political organisation, as well as
other forms of entity, such as collective investment contract and permanent establishment.
Therefore, entity basically includes any type of taxpayer other than individuals.
The central government imposes a range of taxes through several Indonesian tax
laws. Since the major tax reform in 1983,5 these taxes can be divided into four major
types: (1) income taxes (imposed under Income Tax Law No. 7/1983 as lastly amended
by Law No. 36/2008; hereafter ITL); (2) value-added taxes (imposed under Value Added
and Luxury Goods Tax Law No. 8/1983 as lastly amended by Law No. 42/2009; hereafter
VATL); (3) land and building taxes (imposed under Land and Building Tax Law No.
12/1985 as lastly amended by Law No. 12/1994; hereafter Property Tax Law [PTL]);6
and (4) other taxes (mainly stamp duty, which is imposed under Stamp Duty Law No.
13/1985). This thesis only focuses on the first type of tax, namely income taxes—
particularly CIT.
5 Discussed in more detail in Section 2.2.1. 6 PTL divides property taxes into two parts: (1) rural and urban property tax (known as PBB P2 in
Indonesia); and (2) plantation, forestry and mining property tax (known as PBB P3 in Indonesia). On
1 January 2014, the central government transferred the authority to manage and collect PBB P2 to local
governments. Meanwhile, PBB P3 is still managed by the central government.

13
The rest of this section is divided into two subsections as follows. Section 2.1.1
outlines the income tax system for company taxpayers as regulated in ITL and Section
2.1.2 defines FDI and outlines how Indonesian tax law treats income tax paid overseas.
2.1.1 Company Income Tax System in Indonesia
According to ITL Article 1, income tax is imposed on income received or deemed
to be received by a taxpayer in an income year. This provision contains three essential
components. The first component is ‘taxpayer’. According to ITL Article 2, whether an
entity or an individual is a resident taxpayer is determined based on residency; thus, a
resident company taxpayer is a company established or domiciled in Indonesia.7 Given
that FOICs domicile in Indonesia, they are considered resident taxpayers, similar to
DOICs. FOICs and DOICs are therefore treated equally for tax purposes. In contrast, a
non-resident company taxpayer is a company not established or domiciled in Indonesia,
but that conducts business activity or receives income other than from business activity,
either via or not via a permanent establishment such as a place of management, a branch
or a representative office. If the business activity is run through a permanent
establishment, ITL requires that the permanent establishment be treated as a resident
company taxpayer for tax purposes.8
The second component is ‘income’. ITL Article 4 (1) defines income as any
additional economic capability derived by a taxpayer from Indonesia and outside
Indonesia that can be used for consumption or to increase the wealth of the taxpayer under
any name or any form, including compensation in any form, lottery prizes, business
7 Resident individual taxpayers are individuals who reside in Indonesia, individuals who have been present
in Indonesia for more than 183 days within a 12-month period and individuals who have resided in
Indonesia within a particular taxable year and who intend to reside in Indonesia. 8 Non-resident taxpayers other than permanent establishments are not treated as resident taxpayers. For
example, they do not need to file an annual tax return as resident taxpayers and permanent establishments
do.

14
profits (including profits from sharia businesses), gain on sale of assets, tax refunds (that
have been claimed as deductions), interest income, dividend in any form, royalties, rent
income, gain on assets revaluation and insurance premiums received by insurance
companies.
The elucidation of ITL Article 4 (1) explains that ITL refers to income as a broad
meaning and that the definition shall not be limited to examples mentioned in the Article.
It further explains that the income tax shall be imposed on any increase in economic
capability received or deemed to be received9 by a taxpayer from any source that can be
used for consumption or for increasing the wealth of the taxpayer. ITL emphasises that
the income definition focuses more on the presence of additional economic capability
than the source of the income. In addition, ITL states that income can be divided into four
categories: (1) income from employment (e.g., salary) and independent work (e.g.,
income received by accountants and lawyers), (2) income from business activities, (3)
passive income (e.g., interest, dividends, royalties, gain on sales of assets) and (4) other
income (e.g., discharge of debts, prizes).
Further, ITL asserts that because the Law adopts the concept of income in a broad
meaning, all types of income received or deemed to be received in an income year shall
be combined to form the TI for that income year. Thus, if a company suffers a loss from
a business in an income year, the loss can be used to offset income from the company’s
other sources of income (i.e., horizontal compensation). However, this does not apply to
a loss incurred outside Indonesia. Moreover, income that is taxed with a final withholding
tax10 or that is exempt from income tax under ITL shall not be combined with other
income that is subject to the non-final income tax rate.
9 Gain on assets revaluation is an example of income that is deemed to be received. 10 Final tax is a special treatment in taxing income. It contains three features: (1) the party that pays income
(first party) withholds tax on the income received by another party (second party); (2) the second party
excludes the income from its TI; and (3) the second party cannot claim the tax paid (i.e., tax withheld by

15
The last component is ‘income year’. Both GPPTL (Article 1) and ITL (elucidation
of Article 1) define income year as the period of the calendar year, unless the taxpayer
uses a financial year. Most taxpayers in Indonesia adopt the calendar year as their
financial year because it simplifies the preparation of tax reports.
ITL lists not only types of income that should be taxed under the Law, but also
several types that should be excluded (exempt) from TI. Article 4(3) of the Law lists the
exempt incomes as follows: (1) donations to religious institutions that have been
authorised by the government; (2) bequeathed assets received by religious, education and
social institutions or individuals that run micro and small businesses;11 (3) inheritance;
(4) assets received by company taxpayers in exchange for shares or equity contributions;
(5) benefits in kind, unless given by non-taxpayers or given by taxpayers under final
income tax and deemed-profit schemes;12 (6) insurance claims received by individual
taxpayers;13 (7) dividend income received by resident company taxpayers if the following
two criteria are satisfied: the recipient owns at least 25% of the shares of the company
that distributes the dividends, and the company that distributes the dividends was
established and is located in Indonesia; (8) pension contribution received by pension
funds; (9) gain from investment received by pension funds in (8); (10) profit distribution
received by partners of a partnership and by members of a cooperative, foundation,
the first party) to offset against its tax payable (non-creditable). The rate of final tax varies depending on
the type of business activity. For instance, the final withholding tax rate for interest income received from
any deposits held with banks and the final withholding tax rate for prizes won in lotteries is 20% and 25%,
respectively. 11 Micro, Small and Medium Business Law No. 20 Year 2008 Article 6 states that a business is classified
as a micro or small business based on two criteria: net asset and revenue. A micro business is a business
that possesses net assets and revenue of Rp50 million or less and Rp300 million or less, respectively. A
small business is a business that possesses net assets and revenues of more than Rp50 million but not more
than Rp500 million, and more than Rp300 million but not more than Rp2.5 billion, respectively. Rp is the
symbol for Rupiah, which is the official currency of Indonesia. The currency code is IDR (Indonesian
Rupiah). Rupiah, IDR and Rp are used interchangeably throughout this thesis. 12 For instance, facilities (e.g., housing, car) received by a resident taxpayer who works for a foreign
diplomatic representative office in Jakarta are regarded as income because a diplomatic office does not
meet the definition of taxpayer under ITL. 13 As explained in elucidation of ITL Article 4(3e), this is consistent with ITL Article 9 (1d), which
disallows insurance premiums paid by individual taxpayers as deductions.

16
association and organisation, because under GPPTL Article 1 (3), all entities, including
cooperative, partnership, foundation, association and organisation, are treated as
taxpayers; (11) income generated by small, micro and medium venture capital companies
that do not trade shares in stock exchanges;14 (12) scholarship allowances; (13) existing
surplus in non-profit organisations and (14) aids or compensation paid by social
institutions.
ITL Article 6 (1) states that TI shall be derived from total assessable income less
expenses incurred to generate, collect and maintain the income.15 Therefore, taxpayers
can claim any expenses incurred for the sake of generating, collecting or maintaining
income as a deduction. According to ITL, deductible expenses include expenses that are
incurred that directly or indirectly have a nexus with assessable income. The word used
in the definition is ‘includes’ rather than ‘means’, implying that it does not really define
‘deductions’. Therefore, from the definition and wording, it can be interpreted that a
deductible expense implies a broad meaning of deductions for tax purposes, even though
the elucidation of deduction provision in ITL Article 6 (1) does not specifically mention
that the deductions are not limited to the examples listed in the following paragraph, as
in the elucidation of income provision in ITL Article 4(1).
ITL provides the following examples of deductible expenses: purchase costs of
goods, salary expenses, administrative expenses, taxes other than income tax,
depreciation and amortisation, contributions to a pension fund, losses incurred from the
sale or transfer of assets used in the business, losses on foreign exchange, research and
14 President Regulation No. 9 Year 2009 Article 1 (3) defines a venture capital company as a type of
financing company that invests capital in another company (investee company) in the form of shares,
convertible bonds or profit sharing for a certain period. Whether a venture capital is a micro, small or
medium business depends on the two criteria (net asset and revenue) as set in Micro, Small and Medium
Business Law No. 20 Year 2008 Article 6. While micro and small business criteria have been stated
previously, a medium business is a business that possesses net assets and revenues of more than Rp500
million but not more than Rp10 billion, and more than Rp2.5 billion but not more than Rp50 billion,
respectively. 15 ITL uses the term ‘expenses’ instead of ‘deductions’, which is used in countries such as Australia.
17
development (R&D) if conducted in Indonesia, scholarships, apprenticeships and training
expenses, uncollectible receivables, donations for national disasters, donations for R&D
conducted in Indonesia, costs of social infrastructure development, donations in the form
of education facilities stipulated by a government regulation, and donations for sport
enhancement. If there is a loss after subtracting the deductions from the gross income,
ITL allows the loss to be carried forward for a maximum of five succeeding years.
The Indonesian CIT rate was 30% between the enactment of ITL in 1984 until 2008.
It then decreased to 28% in 2009 and 25% in 2010.16
According to ITL, income tax is applicable to different types of income at different
rates, as follows:
1. Article 4(2)
To promote investment and saving and to simplify tax collection by the tax office
and tax reporting by taxpayers, the government made the following incomes subject
to final withholding tax: interest income from savings and bonds, lottery prizes,
dividend income received by individual taxpayers, income from selling shares and
other securities, and income from selling/renting land and buildings. The tax rates
imposed on such incomes are diverse and are regulated in specific government
regulations. For example, Government Regulation No. 19/2009 imposes 10% final
withholding tax on dividend income received by individual resident taxpayers.
2. Article 21
16 For individual taxpayers, ITL levies a progressive income tax rate of 5% to 30%, which has remained
unchanged since 2009. The progressive income tax rate structure consists of four layers: (1) 5% for TI up
to Rp50 million; (2) 10% for TI above Rp50 million to Rp250 million; (3) 25% for TI above Rp250 million
to Rp500 million; and (4) 30% for TI above Rp500 million.

18
Employers including government treasurers, pension funds and other entities are
obliged to withhold tax17 on income received by individual resident taxpayers
resulting from employment, services or any other activities performed by taxpayers.
The tax rates used are the progressive income tax rates for individual taxpayers.
3. Article 22
The finance minister is authorised to assign: (1) treasurers in government bodies to
withhold tax on income received by suppliers resulting from the supply of goods to
government bodies; (2) certain entities to withhold income tax on imports or other
activities (e.g., automotive and cement industries); and (3) certain entities to withhold
income tax on the sale of luxury goods. Luxury goods are determined based on the
type and prices of the goods. Examples include cruise ships, luxury houses, luxury
condominiums and apartments, and luxury vehicles. The tax rates imposed on such
incomes depend on the type of transaction, and the rates are regulated in specific
Finance Minister Regulations.
4. Article 23
If resident taxpayers or permanent establishments (i.e., non-resident taxpayers that
are treated equally as resident taxpayers for tax purposes) pay the following income
to other resident taxpayers, they are obliged to withhold tax on the income received
by the other taxpayers: dividend income received by company taxpayers, interest
income other than that mentioned in Article 4(2), income from royalties and prizes
(other than the lottery), awards and bonuses that are not taxed under Article 21 (the
tax rate imposed is 15%), and rent income other than that mentioned in Article 4(2)
(the tax rate imposed is 2%).
17 Withholding tax is a special treatment in taxing income other than final withholding tax. The only
difference between withholding tax and final withholding tax is that the party who receives the income can
claim the tax paid by the party who pays income to offset against its tax payable (creditable).

19
5. Article 24
This article is about foreign income tax offset and is discussed in detail in Section
2.1.2.
6. Article 25
As Articles 21–23 cover employment income and passive income, ITL Article 25
mainly refers to instalment payments of tax on income from businesses. It requires
taxpayers to pay instalments based on the difference between the previous year’s tax
payable and income taxes already paid for ITL Articles 21–24. Accordingly, the
formula to compute the monthly income tax instalment is:
Monthly income tax instalment = last year’s tax payable− tax paid for Article 21,22,23,24
12
7. Article 26
If resident taxpayers or permanent establishments pay the following income to non-
resident taxpayers other than permanent establishments,18 they are obliged to
withhold tax: dividend income, interest income other than that mentioned in Article
4(2), income from royalties, income from renting assets, salaries from employment,
delivering services, and other activities, prizes and rewards. The applicable tax rate
is 20% unless stated otherwise in a tax treaty between Indonesia and the taxpayer’s
country of domicile (Section 2.1.2 discusses the tax treaty in more detail).19
18 Other types of non-resident taxpayers are non-resident individual taxpayers and non-resident entity
taxpayers other than permanent establishments. ITL Section 4(b) defines non-resident individuals as
individuals who receive income from Indonesia but do not reside in Indonesia, or who live in Indonesia for
not more than 183 days within a 12-month period, and defines non-resident entity taxpayers other than
permanent establishments as entities that receive income from Indonesia but are not established or located
in Indonesia. 19 Based on this explanation, dividends can be taxed on three different tax rates: (1) 10% if received by
resident individual taxpayers (under Article 4(2) of ITL); (2) 15% if received by resident company
taxpayers (under Article 23 of ITL), but disregarded if received from a resident company taxpayer and the
recipient controls at least 25% of the shares of the distributing company (under Article 4(3) of ITL); and
(3) 20% if received by non-resident taxpayers, unless stated otherwise in the tax treaty between Indonesia
and the domicile country of the recipient (under Article 26 of ITL).

20
According to Article 26(5) of ITL, the tax withheld on income received by a non-
resident taxpayer is final tax unless:
a. the non-resident taxpayer is a parent company of a permanent establishment in
Indonesia and the income received by the parent company is derived from
business activities that are similar20 or effectively related21 to those of the
permanent establishment
b. the status of the non-resident taxpayer changes to a resident taxpayer in the same
income year as the period in which the income was received.
8. Article 29
ITL Article 29 requires resident taxpayers (including permanent establishments) to
compare the total tax credit with tax payable in that income year before they file their
annual income tax return. Tax credits are taxes already paid on income in a particular
income year that can be used to offset the tax payable in that income year. According
to ITL Article 28(1), tax credits are income tax paid for ITL Articles 21–25 and
26(5a,b). Tax credit Article 24 is about foreign income tax offset and is explained in
more detail in Section 2.1.2.
Total tax credit is the sum of taxes already paid for ITL Articles 21–25 and 26(5a,b).
Tax payable is TI multiplied by the CIT rate. If the tax paid is greater than the tax
payable, the taxpayer can file a request for a tax refund. In contrast, if the tax paid is
20 For example, if a parent company overseas receives income from selling products that are similar to those
sold by its permanent establishment in Indonesia, the income is deemed to be received by the permanent
establishment instead of the parent company. The tax withheld on such income is not final tax; therefore, it
can be claimed as tax credit by the resident company that withholds the tax. 21 For example, if a parent company overseas receives income from royalties and provides management
services in connection with the royalties through a permanent establishment to a resident taxpayer in
Indonesia, the income received from selling the royalties is deemed to be received by the permanent
establishment instead of the parent company because the royalties are effectively connected to the activities
of the permanent establishment. The tax withheld on such income is not final tax; therefore, it can be
claimed as tax credit by the resident company that withholds the tax.

21
lower than the tax payable, the taxpayer is required to pay the shortage under Article
29 before submitting their annual income tax return.
No ITL articles allow the CIT paid on company profit to be attached to the
dividends and claimed by shareholders as a tax credit. This implies that Indonesia adopts
the classical system of company taxation (as in the US) rather than the dividend
imputation system (as in Australia). In the classical system of company taxation, income
tax paid by a company cannot be passed on to its shareholders, whereas the dividend
imputation system allows this to occur. Tran (2015, p. 575) explains the Australian
dividend imputation system as follows: ‘Under the imputation system, income tax paid
by companies can be passed on to resident equity-holders as tax credits when profits are
distributed as dividends’. He adds: ‘consequently, corporate tax is not necessarily a real
cost, and publicly owned Australian firms with predominantly domestic ownership may
have less incentives to manipulate taxable income to avoid tax’. As Indonesia adopts a
classical system that taxes company profit and shareholders’ dividend income separately,
Indonesian companies have incentive to avoid CIT to maximise shareholders’ wealth.
Further, Tax avoidance literature suggests that foreign-owned companies avoid paying
taxes in the countries where they run their business by shifting profits to lower-tax
jurisdictions. This reasoning applies to FOICs.
In Indonesia, consolidation only applies to financial reporting and is not adopted
for tax purposes. As a result, all intra-group transactions, including transfer pricing and
debt financing, are eliminated only in consolidated financial reports, but remain reflected
in corporate tax returns. This institutional arrangement allows the investigation of intra-
group transactions using tax return data in Study 3 which examines whether FOICs use
intra-group transfer pricing and/or debt financing to shift profits out of Indonesia.

22
2.1.2 Definition of Foreign Direct Investment and the Foreign Income Tax Offset
in Indonesia
To understand and appreciate international tax planning by MNEs, one must have
a basic knowledge of the elements of international commerce foundation within a country
(Scholes, Wolfson, Erickson, Maydew, & Shevlin, 2009). However, before discussing
this knowledge, this section will define FDI under Indonesian law and then outline the
registration procedures of an FOIC in an Indonesian tax office to lay the foundation for
an explanation of how a foreign affiliate becomes a taxpayer in the country.
An MNE consists of a group of companies operating in different countries under
the control of a parent company. Foreign MNEs are foreign companies that operate in
Indonesia via direct investment, known as ‘FDI firms’ (DGT, 2011, p. 62)22 or, more
popularly, FOICs (DGT, 2015a). That is, an FOIC is a company that is established or
acquired by an MNE to conduct business in Indonesia; therefore, it is part of a foreign
MNE. Given that many of the FOICs included in the dataset used in this thesis were
established many decades ago, it is important to trace back the FDI regulations imposed
by the government in the first place.
On 10 January 1967, the President of Indonesia signed Foreign Direct Investment
Law No. 1/1967.23 According to Article 1 of the Law, FDI encompasses foreign
investments in the form of conducting business in Indonesia whereby foreign investors
22 This is consistent with tax literature (e.g. Markusen, 1995, as discussed in Subsection 3.1.2), which uses
the terms MNEs and FDI firms interchangeably. 23 Laws and Regulations Establishment Law No. 12 Year 2011 regulates the process of a bill becoming law
in Indonesia (previously regulated under Law No. 10 Year 2004 and Law No. 2 Year 1950). Basically, a
bill can be filed either by the parliament or the president (Article 43). The bill proposed by the president is
prepared by the minister or the head of non-ministerial government in accordance with the scope of duties
and responsibilities (Article 47). The bill is then sent to the head of the parliament (Article 50 (1)). If a bill
is prepared by the parliament, the head of the parliament is required to send the bill to the president (Article
47 (1)). The parliament or the president (represented by a relevant minister) is required to start discussing
the bill within a maximum period of 60 days from the receipt of the bill (Article 49 (2) or Article 50 (3),
respectively). If the parliament and the government jointly approve the bill, the head of the parliament is
required to send the bill to the president for enactment (Article 72 (1)). Subsequently, the president is
required to sign the bill within a maximum period of 30 days from the day the bill was approved (Article
73 (1)). This marks the entry into force of the law.

23
directly bear the risk of the investments. However, neither the Law nor the lower-level
regulations (i.e., government regulation, presidential regulation and presidential decree)
specified any ownership limitations. On 16 April 1992, the government issued
Government Regulation No. 17/199224 regarding the ownership requirement for FDIs.
Some important features of the regulation are: (1) the investment should not be less than
USD250,000; (2) domestic investors should possess at least 5% of the total shares at the
time the company is established; and (3) domestic investor shares should increase to at
least 20% in 10 years and 51% in 20 years. On 19 May 1994, the government revoked
Government Regulation No. 17/1992 by imposing Government Regulation No. 20/1994.
A key change made in the new regulation was that the government kept feature (2) above
and removed features (1) and (3), suggesting that the government relaxed the investment
requirements to boost FDI inflow to Indonesia. On 20 July 2000, Presidential Decree No.
96/2000 regarding FDI was made. The new decree differentiated business sectors closed
to FDI from sectors open to FDI. The business sectors that are open to FDI were divided
into two categories based on maximum ownership by foreign direct investors (i.e., 49%
and 95%).
On 26 April 2007, the government and the parliament revoked Law No. 1/1967 and
signed new Law No. 25/2007. Article 1 of the new Law redefines FDI as capital
investment activity in the form of business in Indonesia by foreign investors either fully
using foreign capital or partly using domestic capital. The enforcement of the new Law
was followed by several other government regulations (i.e., No. 77/2007, 111/2007,
36/2010 and 39/2014).25 Although these regulations contain broader sectors and a wider
24 Government Regulation No. 17/1992 Article 12 revokes all previous decrees of the head of the Indonesian
Investment Coordinating Board (BKPM) regarding FDI, suggesting that until the early 1990s, the
ownership limitation had been regulated under decrees of the head of BKPM, which are relatively low-
level regulations in the Indonesian law structure (even compared with a government regulation). 25 The latter government regulation revoked the previous one (i.e., Government Regulation No. 111/2007
revoked Presidential Decree No. 77/2007, Government Regulation No. 36/2010 revoked Government

24
range of ownership limit, they basically follow the two principles in Presidential Decree
No. 96/2000: (1) they differentiate sectors that are open for FDI from those that are not;
and (2) the ownership limit is more diverse, but still in the range of 49%–95%.
As explained in Section 2.2.1, DOICs and FOICs are resident-company taxpayers
and are therefore equally treated for tax purposes in Indonesia. However, there is a minor
difference regarding their registration in a tax office because of the presence of foreign
investment tax offices (FTOs). Figure 2.1 illustrates the tax registration procedures of an
FOIC in Indonesian tax offices.
Figure 2.1
Registration of an FOIC in Indonesian Tax Offices
FOIC
No Yes
An FOIC is registered in a small taxpayer office (STO) for the first time. The
company’s registration status can be changed to either a regional medium taxpayer office
Regulation No. 111/2007 and Government Regulation No. 39/2014 revoked Government Regulation No.
36/2010), which means that Government Regulation No. 39/2014 is still in force today. Government
Regulation No. 39/2014 significantly changes the previous regulations by broadening the ownership range
to 30%–100%. However, as the latter regulation came into force on 24 April 2014 and all FOICs included
in this thesis were established before that date, the regulation is not relevant to this thesis. Therefore, this
thesis uses Government Regulation No. 36/2010.
STO Go Public?
RMTO/FTO
PLCTO
LTO

25
(RMTO) or an FTO by a decree of the Director General of Tax. If the company is listed
on the stock market (very few are), the Director General of Tax issues another decree to
declare the registration change of the company to a public-listed company tax office
(PLCTO). FOICs with certain revenue, total assets and total tax paid may be transferred
to a large taxpayer office (LTO) by a decree of the Director General of Tax.
According to Scholes, et al. (2009), there are three elements of international
commerce foundation. The first element is the ways in which foreign income is taxed.
The tax literature groups countries by taxation of foreign income into two broad
categories: territorial and worldwide systems (Markle, 2015). Countries that adopt the
territorial system exempt foreign income from income tax calculations. In contrast,
countries that adopt the worldwide system tax foreign income at their domestic rates and
allow credits for tax paid on foreign income to avoid double taxation. As discussed in
Section 2.2.1, ITL Article 4 (1) states that all income from Indonesia and outside
Indonesia are subject to Indonesian income tax, suggesting that the country has adopted
the worldwide income system.
Markle (2015) finds that, on average, MNEs subject to territorial tax systems shift
more profits than those subject to worldwide tax systems when the parent country is
involved, and the two groups appear to shift equally among their foreign affiliates.
Different from Markle (2015), Scholes et al. (2009) suggest that MNEs in countries that
impose worldwide tax systems may have incentive to shift profits as those in countries
that impose territorial tax regimes. The reason for this is that, while most countries with
worldwide tax systems allow resident taxpayers to claim tax paid in foreign countries as
an offset against their domestic tax liability, in some cases the full amount of tax paid
overseas cannot be claimed because of the tax offset limit imposed by the government.

26
Indonesian foreign income tax offset policy is discussed in more detail at the end of this
section.
The second element is the ways in which foreign operations can be structured by
MNEs. As Scholes et al. (2009) suggest, MNEs can choose to operate their foreign
affiliate as a branch, a partnership or a subsidiary company because most countries
impose income tax on branches, partnerships and subsidiaries differently. This is also true
in the case of Indonesia. For example, profit distribution received by partners in a
partnership is exempted from income tax. In contrast, income distributed to shareholders
in a subsidiary will be taxed as dividend income. Under ITL Article 2(5), MNE branches
are categorised as permanent establishments. Further, ITL Article 2(1a) states that
permanent establishments are treated as resident company taxpayers for tax purposes. For
instance, permanent establishments are required to lodge an annual tax return, similarly
to domestic companies. Nonetheless, permanent establishments are different from
subsidiaries because permanent establishments are required to report income derived
from Indonesia only. In contrast, subsidiaries are required to report worldwide income in
their Indonesian annual tax returns.
The focus of this thesis is foreign MNEs that operate their affiliates in Indonesia in
the form of subsidiaries (i.e., FOICs). There are several reasons for focusing on
subsidiaries: (1) subsidiaries are usually larger: they have larger capacity in terms of
production, sales and technology; (2) FDI inflow to Indonesia mostly takes the form of
establishing or acquiring subsidiaries; and (3) more importantly, subsidiaries as separate
legal entities are more suitable for complex transactions designed to shift profits.
The third and most important element of international commerce foundation is how
foreign tax credits can be structured by MNEs. As explained earlier, Indonesia has
adopted the worldwide tax system. This means that all income received from Indonesia
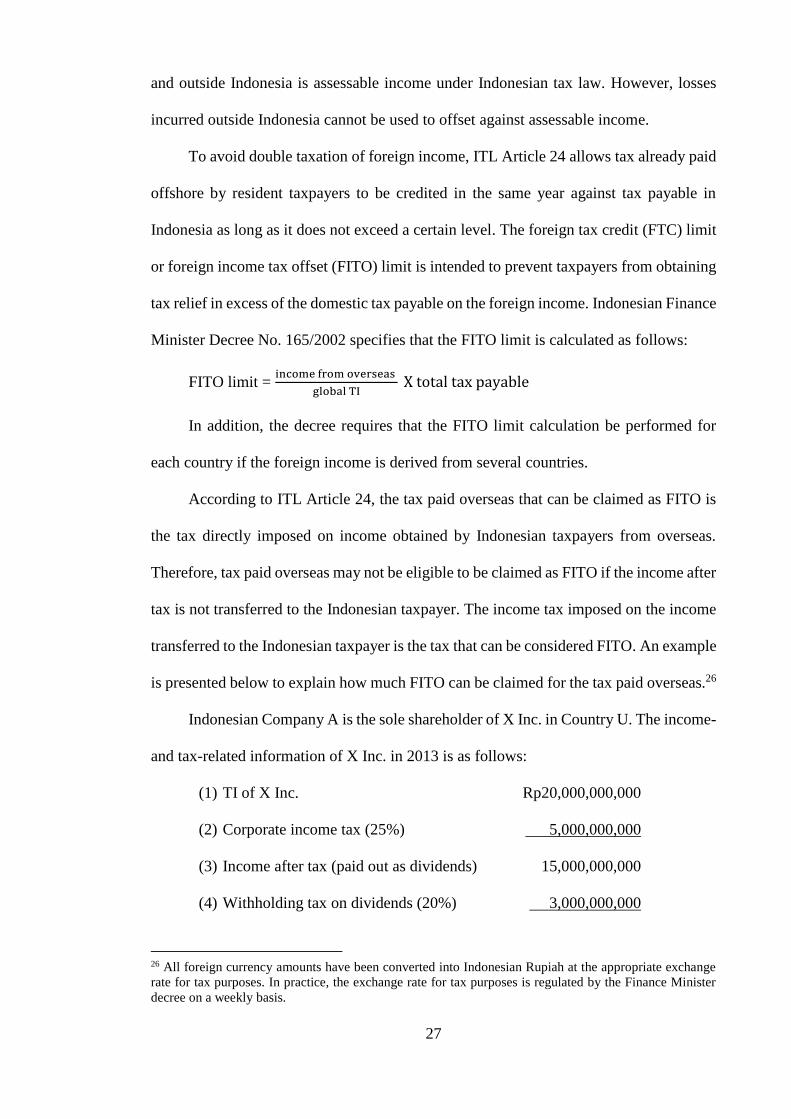
27
and outside Indonesia is assessable income under Indonesian tax law. However, losses
incurred outside Indonesia cannot be used to offset against assessable income.
To avoid double taxation of foreign income, ITL Article 24 allows tax already paid
offshore by resident taxpayers to be credited in the same year against tax payable in
Indonesia as long as it does not exceed a certain level. The foreign tax credit (FTC) limit
or foreign income tax offset (FITO) limit is intended to prevent taxpayers from obtaining
tax relief in excess of the domestic tax payable on the foreign income. Indonesian Finance
Minister Decree No. 165/2002 specifies that the FITO limit is calculated as follows:
FITO limit = income from overseas
global TI X total tax payable
In addition, the decree requires that the FITO limit calculation be performed for
each country if the foreign income is derived from several countries.
According to ITL Article 24, the tax paid overseas that can be claimed as FITO is
the tax directly imposed on income obtained by Indonesian taxpayers from overseas.
Therefore, tax paid overseas may not be eligible to be claimed as FITO if the income after
tax is not transferred to the Indonesian taxpayer. The income tax imposed on the income
transferred to the Indonesian taxpayer is the tax that can be considered FITO. An example
is presented below to explain how much FITO can be claimed for the tax paid overseas.26
Indonesian Company A is the sole shareholder of X Inc. in Country U. The income-
and tax-related information of X Inc. in 2013 is as follows:
(1) TI of X Inc. Rp20,000,000,000
(2) Corporate income tax (25%) 5,000,000,000
(3) Income after tax (paid out as dividends) 15,000,000,000
(4) Withholding tax on dividends (20%) 3,000,000,000
26 All foreign currency amounts have been converted into Indonesian Rupiah at the appropriate exchange
rate for tax purposes. In practice, the exchange rate for tax purposes is regulated by the Finance Minister
decree on a weekly basis.

28
(5) Dividends received by Company A 12,000,000,000
Suppose that the TI of Company A’s Indonesia operations in 2013 is
Rp50,000,000,000. The tax payable is computed as follows:
(6) TI from Indonesia operations Rp50,000,000,000
(7) Dividends (before withholding tax) 15,000,000,000
(8) Total TI 65,000,000,000
(9) Tax payable (25%) 16,250,000,000
FITO limit = 15,000,000,000
65,000,000,000 × 16,250,000,000 = Rp3,750,000,000
Given that the amount of withholding tax paid in Country U (Rp3,000,000,000) is
less than the FITO limit (Rp3,750,000,000), Company A can claim the withholding tax
Rp3,000,000,000 on the dividends received as FITO. Therefore, in 2013, Company A’s
final tax liability (liability after including FITO) is Rp16,250,000,000 − Rp3,000,000,000
= Rp13,250,000,000.
2.2 Indonesian Tax Administration
The DGT is a single directorate within the Indonesian Ministry of Finance (OECD,
2013a).27 The DGT’s head office is led by the Director General of Tax, an Echelon 1
structural position within the Ministry of Finance.28
Figure 2.2 depicts the organisational structure of the DGT head office.
27
The OECD (2013a) classifies four broad categories of institutional setups for conducting tax
administration: a single directorate within the Ministry of Finance (MoF); multiple directorates within the
MoF; unified semi-autonomous body in which the head of the tax authority reports to a government
minister; and a unified semi-autonomous body with a board, in which the head of the tax authority reports
to a government minister and an external official oversees the board. 28 The Indonesian MoF is headed by the Finance Minister. There are five structural levels under the
minister’s supervision: Echelon 1, 2, 3, 4 and staff (non-echelon). The lower the number of the echelon, the
higher the position in the ministry. For example, within the DGT, the Director General, a Director, a Deputy
Director and a Head of Section are Echelon 1, 2, 3 and 4, respectively.

29
Figure 2.2
Organisational Chart of the DGT Head Office29
Source: Directorate General of Tax (2015b)
In the head office, the Director General of Tax is assisted by one secretary, four
senior advisors and 12 directors. The vision of the DGT is ‘to become the best state tax
29 This chart is valid to 20 December 2015. On 21 December 2015, the Indonesian Finance Minister signed
Regulation No. 234/PMK.01/2015, which set up three new directorates within the DGT: Directorate of Law
Enforcement, Directorate of International Taxation and Directorate of Tax Intelligence. The Directorate of
Tax Intelligence and the Directorate of Law Enforcement were formerly a single directorate called the
Directorate of Intelligence and Investigation.
Director General
Secretary of the Directorate
General
Director of Taxation Regulations I (General Provision, VAT, Land and Building)
Director of Taxation Regulations II (Income Tax and International Taxation)
Director of Tax Audit and
Collections
Director of Tax Intelligence and
Investigation
Director of Tax Extensification and
Valuation
Director of Tax Objection and
Appeals
Director of Tax Potency,
Compliance and Revenue
Director of Tax Dissemination,
Services and Public Relations
Director of Tax Information
Technology
Director of Internal Compliance
and Apparatus Transformation
Director of Information and
Technology Transformation
Director of Business Process
Transformation
Senior Advisors

30
administrator’. The missions of the DGT are to (1) collect tax revenue based on high
voluntary tax compliance and fair law enforcement; (2) improve tax compliance through
modern technology-based services; (3) equip tax officials with integrity, competency and
professionalism; and (4) set up compensation for employees based on a performance
management system (DGT, 2015b, p. 40). Indonesian tax offices throughout the country
are expected to efficiently deliver tax services, disseminate tax information and monitor
taxpayers, which boils down to the desire to have a higher level of tax compliance and
therefore a greater collection of revenue from taxes.
The rest of this section is organised as follows. Section 2.2.1 lays the foundation of
tax administration in Indonesia by summarising tax reform history in the country and its
effect on the structure of the Indonesian tax office. Section 2.2.2 discusses the
performance of Indonesian tax revenue and tax compliance during the study period of this
thesis (2009–2015).
2.2.1 Tax Reforms in Indonesia
Efforts to improve the DGT’s capacity to become an efficient tax collection
institution began many years ago. In January 1981, the Indonesian Finance Minister
received support from the Indonesian Planning Agency to initiate a major tax reform.
According to Asher (1997), the main reason behind the government initiating the tax
reform was the inefficiency of the tax system rather than pressure to increase tax revenue,
because the government was receiving substantial revenue from oil at that time as a result
of high oil prices. Subsequently, the minister asked the Harvard Institute of International
Development to conduct technical studies and draft tax reform regulation for Indonesia
(Asher, 1997). As a result, a technical expatriate team led by Professor Malcolm Gillis
was formed in 1981. The team consisted of 28 experts in various areas (i.e., economists,

31
lawyers, tax administrators, accountants and computer scientists) from eight different
countries—mostly the US. They worked on a major project known as the Indonesian tax
reform project (hereafter the 1983 tax reform) under the Indonesian government’s
financing plan during 1981–1984 (Gillis, 1985).
In late 1983, the Indonesian government officially adopted the major tax reform
recommended by the team. The recommendations included introducing the following
legislations and tax information system:
1. General Provisions and Procedures of Taxation Law No. 6 Year 1983 (or GPPTL,
known as ‘Undang-undang Ketentuan Umum dan Tata Cara Perpajakan’ or ‘UU
KUP’ in Indonesia), entered into force on 1 January 1984.
2. Income Tax Law No. 7 Year 1983 (or ITL, known as ‘Undang-undang Pajak
Penghasilan’ or ‘UU PPh’ in Indonesia), entered into force on 1 January 1984,
replacing income tax laws enacted decades earlier by the former Dutch colonial
administration.
3. Value Added and Luxury Goods Tax Law No. 8 Year 1983 (or VATL, known as
‘Undang-undang Pajak Pertambahan Nilai’ or ‘UU PPN’ in Indonesia), entered into
force on 1 July 1984,30 replacing Sales Tax Law enacted in 1951.
4. Land and Building Tax Law No. 12 Year 1985 (or PTL, known as ‘Undang-undang
Pajak Bumi dan Bangunan’ or ‘UU PBB’ in Indonesia), entered into force on 1
January 1986.
5. Stamp Duty Law No. 13 Year 1985 (known as ‘Undang-undang Bea Meterai’ in
Indonesia), entered into force on 1 January 1986.
6. A new computerised tax information system.
30 However, the government postponed the VATL’s effective date until no later than 1 January 1986.
According to Gillis (1985), the reason for the postponement was that the Indonesian tax authority needed
more time to prepare the new tax forms required by the newly enacted tax law.

32
According to Gillis (1985), the new laws and information system proposed by his
team contained two essential changes that were vital to achieve the objectives. The first
change was a major simplification of the tax structure, which was achieved by unifying
the tax rates, broadening the tax base and discontinuing ineffective tax incentives. The
second change was depersonalisation of tax administration, which aimed to minimise
interactions between tax officials and taxpayers by relying more on withholding methods,
electronic data processing of tax information and a shift from the official assessment
system to a taxpayer assessment or self-assessment system. This shift changed the culture
of taxation in Indonesia. Therefore, the changes proposed by the tax reform team were
considered revolutionary.
The 1983 tax reform has arguably significantly improved the capability of the
Indonesian tax administration. However, many things still need to be done to achieve the
central objectives of the tax reform. Asher (1997, p. 163) summarises the challenges that
the DGT is likely to encounter after completing the major tax reform:
While the Indonesian tax reform represents a substantial improvement over the pre-
reform situation… there is however a need to ensure that the tax environment
remains internationally competitive. The key problems that remain to be solved are
improving the technical capabilities of the tax administration, improving equity and
putting into practice new techniques to improve enforcement and compliance.
Following the importance of improving tax administration capabilities, coupled
with the need to respond to the 1997 Asian economic crisis (Widihartanto, 2014), the
Indonesian Finance Minister launched the DGT Tax Administrative Reform Phase I
(better known as ‘Modernisasi’ (modernisation) in Indonesia) in July 2002. ‘Modernisasi’
was aimed at ‘promoting voluntary compliance among taxpayers, enhancing the
efficiency of administration and restoring taxpayers’ trust in the tax administration
system’ (OECD, 2010, pp. 42–43). As a result, the DGT claimed that the tax
administration reform equipped its tax office units nationwide with a ‘more efficient,

33
simplified and transparent business process, more advanced system and information
technology, better human resources, improved good governance and more efficient
structure of organisation’ (DGT, 2009, p. 38).
The Tax Administrative Reform Phase I was completed at the end of 2008. The
completion of the project was marked by the implementation of a new system (called
‘SAPM—Sistem Administrasi Perpajakan Modern’ or ‘Modern Tax Administration
System’) throughout the DGT office network and the establishment of a new tax office
structure nationwide. The DGT claimed that the SAPM promotes ‘effectiveness and
efficiency by improving the business processes and developing data processing units and
a call centre’ (DGT, 2009, p. 17). Within the new system, the DGT introduced standard
operating procedures (SOP) as a guide for employees to perform their tasks consistently,
and as a manual for taxpayers to become familiar with the service procedures (DGT,
2009). Since 2009, all employees have been equipped with the national tax service
standards. Therefore, all tax officials and work units within the DGT have been expected
to be ‘modernised’ because all employees have had knowledge of the novel SOP; thus,
they have been expected to maintain high-quality performance in all tax offices
nationwide. As a result, the quality of data has been much more reliable since 2009. For
this reason, the study period in this thesis begins in 2009.
The tax administration reform has also changed the structure of the Indonesian tax
office. Table 2.1 shows the composition of the Indonesian tax office during 2009–2015.

34
Table 2.1
Number of DGT Offices by Type, 2009–2015
Type of Office
Year
2009 2010 2011 2012 2013 2014 2015
Regional taxpayer office (RTO) 31 31 31 31 31 31 33
Large taxpayer office (LTO) 4 4 4 4 4 4 4
Medium taxpayer office (MTO) 28 28 28 28 28 28 28
Small taxpayer office (STO) 299 299 299 299 299 299 309
Tax service, dissemination and
consultation office (TSDCO) 207 207 207 207 207 207 207
Technical implementing unit (TIU) 1 1 3 5 5 5 5
Total 570 570 572 574 574 574 586
Source: DGT annual reports, various years.
Before the modernisation, the Indonesian operational tax offices had been divided
into three types based on the functions of the office: (1) tax service office (to administer
general tax services and perform small-scale tax auditing for taxes other than property
taxes); (2) land and building tax service office (to administer property tax services and
perform small-scale property tax auditing); and (3) tax audit office (to perform
comprehensive tax auditing for all taxes).
After the tax administration reform, the DGT unified all existing operational office
types and established a new tax office structure based on the following taxpayer
segmentations: (1) LTO to administer and perform tax auditing for the largest company
taxpayers; (2) MTO to administer and perform tax auditing for medium company
taxpayers; and (3) STO to administer and perform tax auditing for individual taxpayers
and small company taxpayers (including start-up FOICs).

35
As Table 2.1 illustrates, the DGT changed its vertical units at least three times
between 2009 and 2015. First, two new TIUs were set up in 2011: a Taxation Data and
Document Processing Office (TDDPO) in Makassar and an External Data Processing
Office in Jakarta. Second, two more TIUs were established in 2012: a TDDPO in Jambi
and an Information and Complaint Service Unit in Jakarta. Finally, the DGT established
two regional offices (South Jakarta II and West Java III) and 10 STOs (four in Jakarta,
four in Java and two in Sumatra) in 2015 as a result of increased workload and the
growing number of taxpayers (DGT, 2015b).
As shown in Figure 2.1, a company taxpayer is registered in either an LTO, an MTO
or an STO. These three types of office are known as the operational units of the DGT.
Therefore, the remainder of this section focuses on these three types of Indonesian tax
office. The DGT completed the Tax Administration Reform Phase I in 2008. As a result,
the numbers of LTOs and MTOs remained the same during the period 2009–2015. The
number of STOs increased from 299 in 2014 to 309 in 2015, but this change does not
affect this thesis because none of the final samples used in the studies in this thesis are
obtained from the 10 newly established STOs. This is another reason why this thesis uses
data from 2009.
Figure 2.3 illustrates the structure of the operational office of the DGT.

36
Figure 2.3
Organisational Chart of the Operational Units of the DGT31
Source: Pakpahan (2012, February)
The study period (2009–2015) includes four LTOs (all located in the capital of
Jakarta), 28 MTOs and 299 STOs (309 STOs nationwide in 2015). The 28 MTOs consist
of 19 RMTOs (located in big cities nationwide, with five in Jakarta) and nine special
MTOs (SMTOs, all located in Jakarta).
31 This chart is valid to 2014. On 10 December 2014, the government enacted Finance Minister Regulation
No. 206.2/PMK.01/2014 concerning the DGT organisation structure, which was in effect for income year
2015 and beyond. The regulation has changed the number of Regional Offices, STOs and TSDCOs to 34,
303 and 206, respectively. The numbers of the other operational offices remained the same. However, the
changes do not affect the structure of samples used in this thesis. TIUs are excluded from the chart because
they do not perform direct tax services to taxpayers.
HEAD OFFICE
1 Large Taxpayer
Regional Office
R
29 Regional
Offices
1 Jakarta Special
Regional Office
R 4 Large Taxpayer
Offices
R
6 Foreign Investment
Tax Offices
Office
R 1 Public Listed Company
Tax Office
R 1 Permanent Establishment
and Expatriate Tax Office
R
1 Oil and Gas Company
Tax Office
R
19 Medium Taxpayer
Tax Offices
Office
R 299 Small Taxpayer
Tax Offices
Office
R 207 Tax Service,
Dissemination and
Consultation Offices

37
The nine SMTOs consist of six FTOs,32 one PLCTO, one permanent establishment
and expatriate tax office, and one oil and gas company tax office. In terms of the number
of tax offices, STOs outnumber the other two office types. However, in terms of tax
revenue contributions, STOs contribute a smaller amount. For example, contributions to
the 2013 national tax revenue were 35.9%, 39.3% and 24.8% for LTOs, MTOs and STOs,
respectively (IMF, 2014a).
In June 2009, Tax Administrative Reform Phase II was launched. It focused on two
aspects: human resources and information and communication technology (DGT, 2010).
Through the tax reform, the DGT conducted more training and renewed information and
technology equipment in its offices nationwide. Unlike Tax Administrative Reform Phase
I, which significantly changed the structure of the DGT’s operational unit and improved
the quality of the national tax database, Tax Administrative Reform Phase II is more like
a minor or routine improvement to the organisation; therefore, it has an insignificant
effect on the selection of the period of study in this thesis.
2.2.2 Tax Revenue and Tax Compliance in Indonesia
Tax revenue in Indonesia is still considered low despite the fact that the tax
administration has been substantially upgraded since 2002 (OECD, 2012). Table 2.2
shows the composition of tax revenue collected by the DGT. All numbers are rounded to
the nearest billion Rupiah. As shown in the table, CIT revenue (Article 25/29—
Corporate) has been second only to domestic value-added tax (domestic VAT), except
for 2014, where CIT revenue came in third place after domestic VAT and import VAT.
32 To avoid confusion with the acronym ‘FITO’, which is a globally accepted acronym for foreign income
tax offset, this thesis uses ‘FTO’ as the acronym for foreign investment tax offices of Indonesia.

38
Table 2.2
Central Government Tax Revenue in Billion Rupiah Collected by the DGT, 2009–
2015
Type of Tax
Year
2009 2010 2011 2012 2013 2014 2015
Non-oil and gas income tax 267,571 297,860 358,013 381,605 417,691 459,085 552,222
Article 4(2)
Final income tax
33,847 40,116 50,813 60,386 71,570 87,318 119,666
Article 21
Income tax on salary
52,073 55,178 66,748 79,595 90,163 105,625 114,044
Article 22
Income tax on payment by the
government
4,369 4,738 4,946 5,507 6,837 7,256 8,478
Article 22
Income tax on import
19,203 23,600 28,292 31,610 36,331 39,454 40,249
Article 23
Income tax on passive income
16,033 16,315 18,703 20,304 22,206 25,535 27,882
Articles 25 and 29
Business income tax—
Individual
3,347 2,935 3,287 3,763 4,383 4,704 8,258
Articles 25 and 29
Business income tax—
Corporate
120,313 131,951 154,603 152,132 154,292 148,719 182,274
Article 26
Income tax on passive income
paid by non-resident taxpayers
18,365 22,985 27,239 24,611 27,985 34,728 43,002
Other* 23 32 41 31 37 89 189
Borne by the Government** 3,339 3,665 3,886 5,655 8,180
VAT and STLG 193,068 230,580 277,792 337,583 384,718 408,830 423,710
Domestic VAT 126,812 131,016 157,370 192,097 226,896 240,938 280,203
Import VAT 66,256 84,164 107,000 126,609 138,990 152,313 130,132

39
Domestic STLG 7,609 8,049 10,453 11,550 10,243 9,367
Import STLG 4,791 5,374 8,423 7,281 5,336 4,008
Land and building tax 30,735 36,607 29,892 28,968 25,305 23,476 29,251
Stamp duty 3,116 3,968 3,928 4,211 4,937 6,293 5,568
Oil and gas income tax 50,044 58,873 73,096 83,461 88,747 87,446 50,109
Total 544,533 627,888 742,720 835,828 921,398 985,130 1,060,860
* An example of other non-oil and gas income tax is income tax on asset revaluation. ITL Article 19
authorises the finance minister to set the regulation on income tax on asset revaluation. Under Finance
Minister Regulation No. 79/PMK.03/2008, a company taxpayer can revalue its depreciating assets after
being authorised by the Director General of Tax. The excess of the fair market value over the carrying value
will be taxed at 10%.
** There are several types of income for which the income tax is borne by the government, including
income tax on salary received by civil servants, members of Indonesian armed forces and pensioners.
Although this income brings no actual flow of money, it has been included as an item under non-oil and
gas income tax for many years for reporting purposes. See Section 2.1.1 of this chapter for explanations of
the type of taxes.
Sources: 2009 is from Tax Revenue (Indonesian Ministry of Finance, 2010, pp. 162-165); 2010 is from
2010 Tax Revenue (Indonesian Ministry of Finance, 2011, pp. 66-67); 2011 and 2012 are from Net Tax
Revenue 2012–2011 (DGT, 2013, p. 129); 2013 and 2014 are from Tax Revenue (DGT, 2015b, pp. 94-95)
and 2015 is from Revenue Performance by Type of Tax (DGT, 2016a, p. 107).
Indonesian CIT revenue (bold in Table 2.2) consists of two articles: (1) Article 25,
which is monthly income tax instalments; and (2) Article 29, which is underpaid income
tax paid by taxpayers at the end of the income year. The CIT revenue contribution is
relatively low considering Indonesia is a developing country in which corporate tax
revenue is expected to contribute a more significant percentage. The Indonesian CIT
revenue contribution is even lower than that of a developed country such as Australia,
with corporate tax revenue accounting for 22.6% of the total tax revenue in the income
year of 2012–2013.33
While CIT revenue collected has steadily increased, the contribution to the total tax
revenue collected by the DGT decreased from 22.09% in 2009 to 15.1% in 2014. It then
increased in 2015 but is still below the 2012 level. The Indonesian CIT rate decreased
33 http://www.treasury.gov.au/Policy-Topics/Taxation/Pocket-Guide-to-the-Australian-Tax-System/Pock-
et-Guide-to-the-Australian-Tax-System/Part-2 accessed 4 January 2016.

40
from 28% in 2009 to 25% in 2010 and remained the same afterwards. This suggests that
the downwards trend of the CIT revenue contribution is not caused by a decrease in CIT
rates. Figure 2.4 illustrates the contribution of corporate income to the tax revenue of
Indonesia over the period 2009–2015.
Figure 2.4
Corporate Income Tax Revenue Contribution, 2009–2015
Central government tax revenue (i.e., the sum of tax revenue collected by the DGT,
and customs and excise revenue collected by the Indonesian Directorate General of
Custom and Excise (DGCE)) has never been less than 60% of the total central government
revenue from year to year and is therefore the main source of revenue in the national
budget.34 However, the country’s tax-to-GDP ratio (the ratio of tax revenue to GDP in a
particular year) is considered low. Table 2.3 illustrates the tax-to-GDP ratio performance
in Indonesia during 2009–2015.
34 Revenue collected by the DGT and DGCE constantly contributes approximately 85%–90% and 10%–
15%, respectively, of the state revenue every year.
22.09%21.02% 20.82%
18.20%16.75%
15.10%
17.18%
0.00%
5.00%
10.00%
15.00%
20.00%
25.00%
0
200,000
400,000
600,000
800,000
1,000,000
1,200,000
2009 2010 2011 2012 2013 2014 2015
CIT (Corporate income tax revenue)
TR (Total tax revenue collected by DGT)
Ratio of CIT to TR

41
Table 2.3
Tax-to-GDP Ratio in Indonesia, 2009–2015
Description
Year
2009 2010 2011 2012 2013 2014 2015
GDP (at current price) 5,606 6,864 7,832 8,616 9,546 10,570 11,532
Central tax revenue (A) 620 723 874 981 1,077 1,147 1,240
Local tax revenue (B) 38 47 63 73 87 103 108
Nat. resources revenue (C) 139 169 214 226 226 241 101
Tax-to-GDP ratio (%)
A+B+C to GDP 14.22 13.68 14.70 14.86 14.56 14.11 12.57
A+B to GDP 11.74 11.22 11.96 12.23 12.19 11.83 11.69
A to GDP 11.06 10.53 11.16 11.39 11.28 10.85 10.75
Sources: GDP 2009, 2010–2011 and 2012–2015 are from BPS (2013; 2015 and; 2017a , respectively).
Central tax revenue and natural resources revenue are from Statistics Indonesia/Badan Pusat Statistik (BPS)
(https://www.bps.go.id/linkTabelStatis/view/id/1286; local tax revenue is from https://www.bps.go.id/
linkTabelStatis/view/id/1288). GDP and revenues are in trillion Rupiah (rounded).
Indonesia’s low tax-to-GDP ratio has been noted by prominent international
institutions such as the OECD and the WB. Their reports (e.g. OECD, 2012; WB, 2014)
show that the nation’s tax-to-GDP ratio was much lower than that of other countries in
the Association of Southeast Asian Nations (ASEAN). For example, Malaysia and the
Philippines consistently reached a tax-to-GDP ratio of more than 15%. The gap is much
greater when compared with the OECD average of 33.8% (OECD, 2012). The WB (2014)
notes that Indonesia’s tax-to-GDP ratio of 11.39% in 2012 was below the average of low-
income countries’ tax-to-GDP ratio of 12.8% and was one of the lowest in the G20
economies. Figure 2.5 illustrates the performance of the Indonesian tax-to-GDP ratio
compared with Malaysia, the Philippines and the OECD from 2009 to 2015.

42
Figure 2.5
Tax-to-GDP Ratio for Indonesia, Malaysia, the Philippines and the OECD,
2009–2015
Note: Tax-to-GDP ratios are in percentages.
Source: Table 3.1, Total tax revenue as percentage of GDP, 1990–2015 (OECD, 2017).
However, it should be noted that Indonesia’s tax-to-GDP ratio excludes tax revenue
collected by local governments and revenue from natural resources. For example, in 2013,
the tax-to-GDP ratio increased to 12.23% when the total revenue included tax revenue
collected by local governments throughout Indonesia. Further, the ratio increased to
14.86% when the total revenue included tax revenue collected by local governments and
revenue from natural resources. The performance of the Indonesian tax-to-GDP ratio is
not as good as that of its peers, even after including other revenues in the tax-to-GDP
ratio calculation. To some extent, the relatively low tax-to-GDP ratio likely results from
the low level of tax compliance in the country. Table 2.4 presents the proportion of
taxpayers filing tax returns in Indonesia during 2009–2015.
0
5
10
15
20
25
30
35
40
2009 2010 2011 2012 2013 2014 2015
Indonesia Malaysia The Philippines OECD

43
Table 2.4
Proportion of Taxpayers Filing Tax Returns, 2009–2015
Description
Year
2009 2010 2011 2012 2013 2014 2015
No. of taxpayers 9,996,620 14,101,933 17,694,317 17,659,278 17,731,736 18,357,833 18,159,840
Corporate 1,373,383 1,534,933 1,590,154 1,026,388 1,141,797 1,166,036 1,184,816
Individual 8,623,237 12,567,000 16,104,163 16,632,890 16,589,939 17,191,797 16,975,024
Tax return filed 5,413,114 8,202,309 9,332,626 9,482,480 10,781,103 10,807,624 10,972,529
Corporate 559,791 501,348 520,375 547,659 592,373 548,676 681,331
Individual 4,853,323 7,700,961 8,812,251 8,934,821 10,188,730 10,258,948 10,291,198
Compliance ratio 54.15% 58.16% 52.74% 53.70% 60.80% 58.87% 60.42%
Corporate 40.76% 32.66% 32.72% 53.36% 51.88% 47.05% 58.00%
Individual 56.28% 61.28% 54.72% 53.72% 61.72% 59.67% 60.63%
Note: No. of taxpayers is the number of taxpayers obliged to file a tax return (i.e., the number of taxpayers
obliged to submit an annual income tax return as of 1 January of the income year).
Sources: 2009–2012 are from ‘Annual Income Tax Return—Filing Compliance Ratio, 2008–2012’ (DGT,
2013, p. 178), 2013 and 2014 are from ‘Compliance Ratio of Annual Income Tax Return Filing, 2010–
2014’ (DGT, 2015b, p. 133) and 2015 is from ‘Ratio of Annual Income Tax Return Submission Compliance
2011–2015’ (DGT, 2016a, p. 141).
As shown, the level of compliance for company taxpayers was below 50% before
2011.35 Afterwards, it increased to more than 50%, except in 2014. The level of tax return
filing compliance reached the highest level of 58% in 2015. Although major efforts were
made by the office, such as conducting a tax census in 2011 and 2012,36 the compliance
level is still far from what the DGT expected. A low level of compliance can also be found
among LTOs, which is surprising given that taxpayers are well managed and tax officials
35 See Rosid, Evans, and Tran-Nam (2016) for a discussion of the level of compliance for individual
taxpayers. Overall, they find that the high levels of perceived corruption in Indonesia have significantly
undermined tax compliance behaviour. 36 The tax census (known as ‘sensus pajak’ in Indonesia) is a national tax program that was run by the DGT
in 2011 and 2012. The program enabled tax officials to visit taxpayers, ask questions and directly observe
business activities at the taxpayers’ premises. It was aimed at broadening the tax base by exploring tax
potency and reinforcing tax fairness by directly reminding taxpayers to fulfil their tax obligations (DGT,
2013).

44
are well trained compared with other types of taxpayers and tax offices. For example,
over the period 2009–2013, while taxpayers registered in LTOs and SMTOs showed
considerably higher filing rates than those in RMTOs and STOs, there was a high
incidence of not only late filing, but also non-filing of annual tax returns by LTO
taxpayers (IMF, 2014a).37
Another important point that can be drawn from Table 2.4 is that the corporate level
of compliance was always below the individual level of compliance over the period 2009–
2015. According to the IMF (2014a), the fact that corporations have worse filing
compliance than individuals is troublesome and may be a major factor in the nation’s
small income tax revenue relative to its regional peers. In line with the IMF’s report, the
OECD (2015b) confirms that the low compliance level has resulted in low tax-to-GDP
ratios for the past decade and has contributed to a small government budget compared
with peer countries.
The OECD (2015c, p. 10) summarises the tax administration reform and future
challenges in Indonesia as follows:
The work undertaken to date in modernising aspects of the tax administration,
including HR Management, IT systems and audit and filing processes has resulted
in significant growth in the tax revenue collected. Despite this however, Indonesia
faces the challenge of addressing low rates of registration and voluntary
compliance, and high rates of tax evasion. Strengthening enforcement activities and
improving performance in the collection of tax arrears remain priority areas for the
administration.
In addition to the challenges listed by the OECD (2015c) above, another major issue
that Indonesia may face is the lack of capacity of its tax authority to tackle cross-border
profit shifting by MNEs that conduct business through their subsidiaries in the country.
The OECD (2012, p. 73) recommends that ‘further increasing the authorities’ capacity to
37 The late filing and no-filing rates are as follows: large taxpayer offices 18.0 percent and 4.6 percent,
respectively; special tax office: 13.5 percent and 3.1 percent, respectively; medium taxpayer offices 13.9
percent and 14.6 percent, respectively, and small taxpayer offices 48.6 percent and 3.7 percent, respectively
(IMF, 2014a p. 26).

45
avoid profit-shifting and transfer pricing in the case of multinational enterprises would be
useful’. Chapter 3 elaborates more on the issue of cross-border profit shifting by MNEs
in general.
2.3 Chapter Summary
This chapter describes the tax system in Indonesia in two parts. First, it describes
how the tax system in general, and income tax system in particular, works under
Indonesian tax law. In the case of company income tax, Indonesia adopts the classical tax
system, so company profit and shareholders’ dividend income are taxed separately.
Indonesia has not adopted consolidation for tax purposes, so companies in a group are
taxed separately. Indonesia adopts the worldwide income system: all income derived by
a taxpayer worldwide is subject to Indonesian income tax. To avoid double taxation,
Indonesian tax law allows taxpayers to claim taxes paid overseas as tax credits. However,
according to ITL, the amount of taxes paid overseas that can be claimed as tax credits is
limited to the amount of tax payable on the foreign income under ITL.
Second, this chapter describes the Indonesian tax administration. The 1983 tax
reform brought about fundamental changes to the Indonesian tax system and
administration. For example, after adopting the new tax laws recommended by the tax
reform team, Indonesia introduced a self-assessment system to replace the official
assessment system. The tax reform also led to simpler but more modernised tax
administration in Indonesia. The five tax laws produced by the tax reform are still
operational today.
In the early 2000s, Indonesia undertook another tax reform, known as the Tax
Administration Reform Phase I, which aimed to reform tax administration and provide
cleaner and more transparent and reliable tax services. This reform changed the face of

46
tax offices nationwide by focusing on how to better serve taxpayers. The DGT’s
employees were better trained and information technology was drastically upgraded. The
DGT claims that it is now a more trustworthy tax authority. The reform was completed
nationwide in 2008; thus, the DGT began its new operations in 2009—the year used in
this thesis as the start of the period of study. The Tax Administration Reform Phase II has
changed neither the tax system nor tax administration; rather, it was more like a routine
improvement of an institution.
Nevertheless, despite the tax reforms, the DGT does not appear to have become as
effective as expected. The tax revenue collected from company taxpayers by the DGT is
relatively low and is reflected in the tax-to-GDP ratio, which has been lower than that of
its ASEAN peers for many years. The low level of tax compliance is considered the cause.
One would normally expect the compliance ratio of company taxpayers—calculated as
the ratio of the number of taxpayers who file an annual tax return to the number of
taxpayers obliged to file an annual tax return—is higher than that of individual taxpayers.
However, it is the opposite in the case of Indonesia. Further, LTOs, which are a type of
tax office that administers the largest taxpayers in the country, suffer from a low level of
tax compliance because the number of large taxpayers that fail to file their annual tax
return is still significant.
Institutionally, the DGT is deemed to have relatively few resources to tackle
international tax avoidance. With only two small units in charge of defending the country
from all cross-border tax misbehaviour, Indonesia is likely to lose tax revenue because of
international tax avoidance strategies. Unfortunately, as a single directorate under the
Indonesian Ministry of Finance, the DGT has little independence and no power to change
the structure of the organisation.

47
In summary, the Indonesian tax system and tax administration may have given
FOICs more opportunities to avoid Indonesian CIT by using cross-border tax avoidance
schemes such as profit shifting strategies.

48
CHAPTER 3:
PROFIT SHIFTING BY MNEs
This chapter discusses theories that are applicable to corporate tax avoidance and
presents a general review of previous studies relating to profit shifting by MNEs in
developed countries, developing countries and Indonesia. With regard to the country
classifications, this thesis follows the WB’s (2016) income group classification,38 which
divides the world economies into four groups: low, lower–middle, upper–middle and
high. The WB refers to low- and middle-income economies as developing economies.
While the country classifications may change over time because they are determined once
a year (i.e., on 1 July each year), Indonesia was consistently classified as a lower–middle-
income country over the period 2009–2015. Following the WB classifications, Indonesia
is categorised as a developing country for the purpose of the studies in this thesis.
This chapter consists of four sections and is organised as follows. The first section
discusses the theories of tax evasion and tax avoidance, with an emphasis on the theory
of tax avoidance by MNEs. In addition, it briefly discusses the methods used by previous
studies and this thesis to identify profit shifting by MNEs. The second section reviews
prior studies that focus on MNEs’ profit shifting in developed countries, while the third
section does the same for developing countries. The last section deals with the issue of
profit shifting by MNEs in Indonesia, including the DGT’s efforts to fight profit shifting.
38 Other than by income group, the WB also categorises all 188 WB member countries plus 26 other
economies with populations of more than 30,000 by geographic region and by operational lending. For
more detail, see https://datahelpdesk.worldbank.org/knowledgebase/articles/378834-how-does-the-world-
bank-classify-countries.

49
3.1 Theory of Tax Avoidance and Methods Used to Identify the Incidence of
Base Erosion and Profit Shifting
3.1.1 Theory of Corporate Tax Avoidance
According to Hanlon and Heitzman (2010, p. 137), one challenge for researchers in
the area of tax avoidance is that ‘there are no universally accepted definitions of, or
constructs for, tax avoidance or tax aggressiveness; the terms means different thing to
different people’. Therefore, before discussing the theory of corporate tax avoidance and
indicators of profit shifting by MNEs, this section will briefly define tax avoidance,
explain how it differs from tax evasion and outline the definition of tax avoidance used
in this thesis.
Tresch (2015, p. 265) defines tax avoidance and tax evasion as follows:
Tax avoidance refers to taxpayers taking advantage of the provisions of the tax laws
to reduce their tax liability, such as arranging to take income in the form of lightly
taxed capital gains or untaxed fringe benefits rather than as fully taxed wages and
salaries. Avoiding taxes is legal and its consequences are certain.
Tax evasion refers to hiding sources of taxable income from the tax authorities to
reduce one's tax liability, such as not reporting gambling winnings or failing to file
a tax return when required to do so. Evading taxes is illegal and its consequences
are uncertain; they depend on the probability of the taxpayer being caught.
These definitions provide a clear line between tax avoidance and tax evasion: tax
avoidance is legal and tax evasion is illegal. Consistent with such definitions, Sandmo
(2005) argues that, unlike a taxpayer that commits tax evasion (a tax evader) and should
worry about the risk of being detected by the tax authority, a taxpayer that commits tax
avoidance (a tax avoider) can be much less concerned about the possibility of being
noticed by the authority because their actions simply exploit loopholes in the tax law;
therefore, they are within the legal framework of the law. However, Sandmo (2005) also
contends that from a moral point of view, distinguishing between tax avoidance and tax
evasion is not an important issue because tax avoiders and tax evaders are likely to behave
indifferently. After all, Sandmo (2005, p. 646) mentions that ‘the borderline between what

50
seems morally right and wrong does not always coincide with the border between what
is legal and illegal’, suggesting that there is no line that clearly separates the two.
Therefore, it is not surprising that several studies that focus on corporate tax
avoidance (but not specifically tax avoidance by MNEs) do not distinguish between tax
avoidance and tax evasion. This is because there are difficulties in determining the
legality of the behaviour surrounding the transactions and a clear-cut differentiation
between tax avoidance and tax evasion is over-simplified (e.g. Hanlon & Heitzman, 2010;
Dyreng, Hanlon, & Maydew, 2008; Weisbach, 2003). Some studies avoid using the two
terms and choose another expression to represent the tax-reporting misbehaviour. For
example, Slemrod (2004, p. 878) uses the word ‘selfishness’ ‘to avoid getting bogged
down trying to distinguish between what technically is (illegal) tax evasion and what is
(legal) tax avoidance’.
As explained in Section 1.1, BEPS is defined as strategies used by MNEs to exploit
gaps and mismatches of tax rules in different countries by shifting profits to locations
where tax rates are low to reduce the overall corporate tax being paid (OECD, 2014a).
The fact that BEPS is legal and yet defeats the intent of tax law means that it is not an
exaggeration to say that BEPS is a tax misbehaviour. Nonetheless, unlike other tax
misbehaviours that cannot be clearly categorised as tax avoidance or tax evasion, BEPS
is relatively easier to classify. Following Tresch (2015) abovementioned definitions of
tax avoidance and tax evasion, BEPS can be categorised as a tax avoidance strategy. In
the Indonesian context, BEPS is defined as a cross-border profit shifting strategy used by
FOICs without breaking Indonesian tax rules. The next paragraph provides examples that
may clarify the concept.
BEPS arrangements include suppressing selling prices for goods and services sold
to affiliates overseas and inflating the costs of goods sold, royalty payments, management

51
fees and interest paid to affiliates overseas. For example, an FOIC owned by a
Singaporean company exploits the Indonesian transfer pricing rules gap by lowering the
export sales price to the parent in Singapore. In another typical example, the parent
finances the FOIC’s (the subsidiary’s) operation in Indonesia with debt rather than equity
to suppress profits reported by the FOIC in Indonesia. By doing so, the FOIC can claim
more deductions because interest expense is a deduction under ITL. Although interest
income earned by the parent might be TI under Singaporean tax law, MNEs are better off
overall because the Singaporean corporate tax rate is considerably lower than the
Indonesian corporate tax rate. For the FOIC, cross-border profit shifting reduces both TI
and book (accounting) income at the same time. The effect of simultaneously reducing
TI and book income makes BEPS a book-tax conforming tax avoidance strategy (Hanlon
& Heitzman, 2010).39
A number of theoretical papers analyse the theory of tax avoidance and tax evasion
by individuals. For example, a seminal paper by Stiglitz (1986) presents a general theory
of income tax avoidance by individuals. Another example is a widely cited paper by
Allingham and Sandmo (1972) that theoretically analyses the extent to which an
individual taxpayer decides to evade taxes by intentionally underreporting income. The
latter paper is extended by Slemrod and Yitzhaki (2002), who present theoretical models
that integrate tax avoidance and tax evasion into the overall decision problem encountered
39 Another form of tax avoidance is book-tax nonconforming tax avoidance. This strategy reduces TI
without lowering book income by exploiting the differences between tax law and financial reporting rules,
causing book-tax differences (BTDs). In general, BTDs can be divided into two categories: (1) temporary
BTDs are generated from differences in the timing of recognition between accounting income and TI, which
will therefore reverse over time. For example, a firm may use the straight-line depreciation method for
accounting purposes and the accelerated depreciation method for tax purposes to depreciate machinery; (2)
permanent BTDs result from non-taxable revenues and/or non-deductible expenses provided in tax rules,
and the BTDs will therefore never reverse. A typical example in the US is non-taxable government bond
interest. Many studies examine the relationship between BTDs and tax avoidance—for example Blaylock,
Shevlin, and Wilson (2011) examine the relationship between temporary BTDs and tax avoidance, and
Frank, Lynch, and Rego (2009) examine the relationship between permanent BTDs and tax reporting
aggressiveness.

52
by individuals. Another paper by Sandmo (2005) extends Allingham and Sandmo (1972)
work by reviewing the existing theory of tax evasion by individuals and connecting it
with other central issues in the theory of public finance.40
Many studies discuss the theory of tax evasion by corporations. For example, Chen
and Chu (2005) model income tax evasion by corporations, and Crocker and Slemrod
(2005) develop an economic theory of corporate tax evasion. Both studies connect the tax
evasion strategy used by managers with the aim of gaining the wealth of the owners or
shareholders. Both studies define tax evasion as an illegal tax avoidance strategy.
However, few theoretical studies have specifically discussed the theory of tax
evasion by large international corporations. According to Gordon and Hines (2002),
unlike individual taxpayers, it is uncommon for large corporations to commit tax evasion
(e.g., deliberately underreporting income to tax authorities). Further, Gordon and Hines
(2002, p. 1970) conclude that ‘very little is known about the determinants or magnitude
of international tax evasion, since the self-reported data that serve as the basis of analysis
not surprisingly reveal nothing about it’. To a large extent, this conclusion suggests that
MNEs use international tax avoidance rather than international tax evasion as an
alternative to lessen their income tax liability.
In contrast, a number of studies discuss the theory of tax avoidance by corporations.
In a review of tax research, Hanlon and Heitzman (2010) briefly discuss the theory of
corporate tax avoidance by citing four papers that ‘provide theory and predictions about
the relationships and incentives of the various parties (i.e., insiders, outside shareholders,
40 While theoretical papers about tax evasion by individuals are relatively abundant, empirical evidence on
this issue is limited. According to Houston and Tran (2001), the reason is that most empirical evidence that
describes evasion behaviour is based on surveys because directly observing such behaviour is almost
impossible. Further, the authors explain that because tax evasion is a sensitive topic, individuals are less
likely to take part in the survey (i.e., non-response bias), and even if they take part, they may not tell the
truth (i.e., response bias). As a result, such biases undermine the validity and reliability of the study
(Houston & Tran, 2001).

53
and the state) in corporate tax avoidance settings’. According to Hanlon and Heitzman
(2010), three of the four papers (i.e. Slemrod, 2004; Chen & Chu, 2005; Crocker &
Slemrod, 2005) lay a theoretical foundation for understanding corporate tax avoidance in
connection with agency framework, and one paper (i.e. Desai, Dyck, & Zingales, 2007)
introduces another perspective to the literature. However, only Slemrod (2004) and Desai,
et al. (2007) are relevant to the discussion of the theory of tax avoidance by corporations.41
Some other relevant studies are included in the discussion to clarify the idea introduced
by the two papers.
Slemrod (2004) suggests that ownership–control separation means that a different
conceptual framework is required to understand tax noncompliance of large firms (i.e.,
tax evasion and abusive tax avoidance). In a large firm, managers rather than owners
make operational decisions, including tax-related decisions. Therefore, a manager’s
personal views on paying taxes as a civic duty affect their corporation’s aggressiveness
in avoiding taxes (Slemrod, 2004). However, some studies state that managers are likely
to focus on maximising profits as the owners expected. In an extensively cited statement,
Friedman (2007, pp. 173-174) writes that:
In a free-enterprise, private-property system, a corporate executive is an employee
of the owners of the business. He has direct responsibility to his employers. That
responsibility is to conduct the business in accordance with their desires, which
generally will be to make as much money as possible while conforming to the basic
rules of the society, both those embodied in law and those embodied in ethical
custom.
According to Slemrod (2004), while Friedman’s statement suggests that managers
should not engage in corporate tax evasion, it encourages managers to perform tax
41 While Hanlon and Heitzman (2010) suggest that Chen and Chu (2005) examine corporate tax avoidance
under the agency model, Chen and Chu (2005) and Crocker and Slemrod (2005) merely discuss the
theoretical model of CIT evasion. As discussed previously in this section, both studies clearly define that
tax evasion is illegal. Therefore, the tax avoidance–tax evasion definition bias is unlikely to be an issue in
the two studies. For this reason, this thesis considers that these two papers lack a connection with the theory
of corporation tax avoidance discussed in this thesis; therefore, they are excluded from further discussion.

54
avoidance. However, managers should be less aggressive if the behaviour endangers the
value of the corporation (Slemrod, 2004). Accordingly, Slemrod (2004) suggests that the
owners (i.e., shareholders) of the corporation need to clearly define the acceptable level
of tax aggressiveness so that managers can make appropriate decisions to achieve the
owners’ desired level of wealth.
In a widely cited study, Jensen and Meckling (1976) develop the agency
relationship theory, which theorises that the equilibrium contractual form (positive
aspects) rather than the structure of the contractual relation, such as compensation
incentives (normative aspects), between the manager and the owner should be the focus
aspects of an agency relationship. Positive aspects include ‘incentives faced by each of
the parties and the elements entering into the determination of the equilibrium contractual
form characterising the relationship between the manager and the owners’ (Jensen &
Meckling, 1976, p. 310). This theory implies that a compensation incentive is not the
most important factor in the manager–owner relationship. In the context of tax avoidance,
the equilibrium contractual form between the manager and owner regarding the level of
tax aggressiveness may be a key positive aspect in the relationship. That is, the manager
and the owner should sit together to determine the level of tax aggressiveness that will
maximise both parties’ interests (tax-aggressiveness equilibrium).
Desai, et al. (2007) propose a new perspective to the literature on corporate
governance and corporate taxation by including two variables that they believed had been
omitted in previous studies. The first omitted variable is the state. In addition to the
manager and the outside shareholders, the state should be part of the standard analysis of
corporate governance. The second factor that is allegedly omitted in previous studies is
the effect of corporate governance on the functioning of the corporate tax system.

55
Desai et al. (2007) integrate the analysis of corporate governance and corporate
taxation by analysing the interaction between three parties, i.e., state, manager and
owners. They theorise that corporate governance (i.e., the relationship between the
manager and shareholders) and the corporate tax system (i.e., how the state designs and
enforces corporate taxes, or how tax revenue responds to changes in tax rates) influence
one another. Specifically, their theoretical and empirical analysis provides two new
insights. First, higher tax rates deteriorate corporate governance, but strong tax
enforcement can strengthen it. Second, good (bad) corporate governance positively
(negatively) affects the sensitivity of tax revenue to tax rate changes. Desai and
Dharmapala (2009) extend the work of Desai, et al. (2007) and posit that including
corporate governance as an important determinant of corporate tax avoidance strategies
provides a more nuanced prediction as opposed to the traditional view of corporate tax
avoidance, suggesting that tax avoidance increases the wealth of owners (shareholders)
only in the presence of good corporate governance.
The theory of corporate tax avoidance discussed in this section applies to
corporations in general, which could be multinational enterprises or domestic enterprises.
The next section discusses the theory that underlies tax avoidance by MNEs according to
existing literature.
3.1.2 Definition of Multinational Enterprises and Theory of Tax Avoidance by
Multinational Enterprises
Before discussing the theory that underlies tax avoidance by MNEs based on some
relevant theoretical papers, this section begins by defining MNEs and identifying the
reasons why MNEs make foreign direct investment and establish foreign affiliates.

56
Markusen (1995, p. 170) defines MNEs as ‘firms that engage in direct foreign
investment, defined as investments in which the firm acquires a substantial controlling
interest in a foreign firm or sets up a subsidiary in a foreign country.’ He proposes that
the fundamental reasons why investors may choose to establish an affiliate overseas is
that MNEs are different from domestic companies: ‘If foreign multinational enterprises
are exactly identical to domestic firms, they will not find it profitable to enter the domestic
market’ (Markusen, 1995, p. 173). Further, he suggests several inherent disadvantages
and advantages that MNEs commonly encounter. The disadvantages include higher costs
of doing business in a different country (e.g., higher communication and transportation
costs, higher costs of posting personnel abroad) and adapting to the new environment
(e.g., unfamiliarity with language and customs, and being outside their domestic business
and government networks).
The inherent advantages that MNEs have are superior technology and lower costs
resulting from economies of scale (Markusen, 1995). In addition, Markusen (1995) refers
to the ownership, location and internalisation (OLI) framework proposed by Dunning
(1977). The framework posits that the advantages of OLI must be present for MNEs to
undertake FDI. The two paragraphs below describe the three conditions according to
Markusen (1995) explanation.
First, ownership is any advantage that represents valuable market power that other
firms do not possess, including a patent, blueprint, trade secret, trademark or reputation
for quality. Second, location refers to the advantage that an MNE can obtain by producing
goods in a foreign country. Lower tariffs, quotas, cheaper transport costs and factor prices,
and better access to customers are some advantages of a location for MNEs.
The third and probably the most decisive advantage is internalisation. For some
MNEs, possessing the first two advantages (i.e., ownership and location) may be

57
insufficient to set up a foreign affiliate because they have alternative options such as
giving a licence to a domestic firm in the foreign country to produce goods or use their
production method. In doing so, the parent company can simply sell the blueprints to a
domestic firm in the target foreign country rather than setting up an affiliate in that
country and facing costly and difficult processes. The advantage of internalisation
encourages MNEs to set up affiliates in foreign countries. Internalisation is defined as an
opportunity to exploit a product or process internally among companies within the same
ownership. That is, internalisation gives MNEs affiliates located in different countries the
opportunities to arrange internal prices and processes for products that are traded within
the same group of companies. This explains why internalisation is the most decisive
advantage for some MNEs setting up a foreign subsidiary. Citing Rugman (1986),
Markusen (1995, p. 174) writes that ‘internalisation is really the only thing that matters
to understanding the multinational’.
Gordon and Hines (2002) extensively discuss theories that underlie the tax
avoidance behaviour of MNEs. They state two theories of MNE behaviour: (1) MNEs as
financial intermediaries; and (2) MNEs as corporate tax avoiders. In the first, or initial,
theory, setting up a foreign affiliate is considered an investment alternative overseas for
resident taxpayers. It assumes that MNEs do not possess the three advantages in the OLI
framework. The theoretical analysis reveals that under the initial theory, all MNEs would
be indifferent to the countries of foreign affiliates, and they should be indifferent to tax-
rate differences between domestic and foreign countries. However, they also reveal that
the results of existing studies oppose this theory, that existing studies demonstrate that
tax rates in host countries are negatively related to FDI inflow to countries, and that

58
reported profits by MNEs are negatively related to tax rates (or higher profits reported by
MNEs in low-tax jurisdictions and tax havens).42
The second theory in Gordon and Hines’s (2002) paper states that MNEs are
corporate tax avoiders. They start by emphasising the significant difference between a
closed economy and an open economy and posit that the growing cross-border trade in
goods and services increases the contributions of MNEs to the economy. Further, they
argue that the more integrated capital market worldwide has forced researchers to modify
the existing work on tax policy by considering several factors that are unique to an open
economy setting.
Further, Gordon and Hines (2002) theorise that a much broader complication that
has been excluded in a closed economy setting needs to be considered in an open economy
setting. According to the authors, this complication exists because of tax rate differences
between countries that influence the behaviour of MNEs both operationally and
financially. This behaviour includes the preference of where to locate affiliates overseas,
the decision to determine the optimal scale of affiliates’ operations, and decisions
regarding the preference of locating debt, research activity and exports (Gordon & Hines,
2002). Lastly, consistent with internalisation in the OLI framework, a unique
characteristic of an open economy setting is that MNEs possess flexibility to choose
certain prices to be used in transactions among their affiliated group members, which
allows them to report an overall lower income tax burden (Gordon & Hines, 2002).
42 The definition of tax havens in this thesis follows that of Scholes, et al. (2009). They describe that, in
addition to the low tax rates that attract people and companies interested in legal tax avoidance, tax havens
offer ‘strong bank secrecy laws and limited tax information-sharing agreement’. The authors posit that
‘strong privacy laws increase the attractiveness of tax havens to those laundering illegal income and those
interested in evading taxes on their legal income’ (Scholes, et al., 2009, p. 329).

59
In analysing the behaviour of MNEs, Gordon and Hines (2002) review some
evidence provided by the existing literature.43 First, the existing literature confirms that
debt financing is more attractive for affiliates in high-tax jurisdictions and that equity
financing is more attractive for affiliates in low-tax jurisdictions. Second, the literature
confirms that MNEs use transfer prices regardless of the requirement of the OECD for
MNEs to use an arm’s-length principle.44 Based on the evidence provided by the existing
literature, Gordon and Hines (2002) conclude that while MNEs contribute a significant
payment in taxes each year, they successfully avoid income taxes by means of profit
shifting.
Gordon and Hines (2002) then reconcile the evidence provided by prior studies with
the evidence from their own theoretical framework using the theory of MNEs as corporate
tax avoiders. They find that while some aspects of MNEs’ behaviour are consistent with
the theory, others are not. Rather, they are consistent to the extent that MNEs’ behaviour
in reallocating income explains the low profits reported in high-tax jurisdictions and the
high profits reported in low-tax jurisdictions.45
Theoretical papers, mostly in economic literature, discuss the economic behaviour
of MNEs—particularly because transfer prices have been constrained by tax regulations
43 Other strategies that can be used by MNEs to lower tax obligations are to adjust the timing to repatriate
dividends (as in some countries, including the US and Indonesia, income from foreign affiliates are taxed
only when the income is repatriated as dividends), by choosing the form of business organisation that offers
higher tax incentives and by conducting more R&D activity in affiliates with excess foreign tax credits
(Gordon & Hines, 2002). 44 In general, the arm’s-length principle is the market price of a similar transaction between independent
parties. This principle is described in more detail in Chapter 6 of this thesis. 45 Gordon and Hines (2002) also explain that a further complication in regard to MNEs is that firms can
avoid taxes not only on their capital income, but also on other income. For example, entrepreneurs (owners
who are also managers) leave their wage payments in the firm so it is corporate income rather than personal
income. According to Gordon and Hines (2002), through such income reallocation, entrepreneurs may end
up with a tax rate on earnings that is as low as one available in a tax haven. Although they do not explicitly
suggest that this complication is a motivation for MNEs to set up a foreign affiliate in a high-tax country,
they presume that it is likely. To some extent, this may explain why MNEs tend to invest more significantly
in both low- and high-tax countries. For example, Chari, Chen, and Dominguez (2012) find a significant
increase in FDI by emerging markets (particularly China and India) in the US over the period 1980–2006.

60
for decades. Brief summaries of five of these papers—including four theoretical studies
in economics and one theoretical study in accounting—are presented below.
Horst (1971) posits that one of the distinguishing characteristics of MNEs is that
they use ‘optimal transfer price’ rather than ‘open market’ prices to value intra-firm
transactions, consistent with the internalisation advantage in the OLI framework. Further,
his theoretical analysis reveals that MNEs’ decisions to produce, sell and set the transfer
prices in Country A or B largely depend on the marginal costs of production and
differences in tariffs and tax rates between the two countries. Assuming that the firm is
burdened by tariffs on its imports and taxes on its profits in addition to production costs,
Horst (1971) also finds that MNEs minimise their global tax liability by always choosing
either the lowest or highest possible transfer prices. For example, to maximise its global
after-tax earnings, an MNE will choose the lowest possible transfer price if the relative
tax rate difference between the importing and exporting countries is lower than the tariff
rate in the importing country.
Copithorne (1971) posits that MNEs have greater opportunities to mobilise capital
and profits than smaller national companies. He argues that while transfer prices cannot
be used to maximise global before-tax earnings, they are commonly used by MNEs to
shift profits from one company to another, depending on the preference of management
to show more of the profits in a particular affiliate than in others. The degree of profit
shifting is larger when corporations ship a larger number of products to their subsidiaries
because they have greater freedom in setting the prices used in intra-firm transactions.
Two other conclusions from Copithorne (1971) theoretical analysis are: (1) that
international corporations do not change the levels of prices and outputs if corporation
taxes remain unchanged; and (2) that MNEs are likely to shift profits out of a country

61
(and are likely to pay less CIT in a country) in which marginal tax rates are high, currency
is weak or capital movements are controlled.
Eden (1983) notes that existing literature (including Horst 1971, discussed above)
uses the tax differential–tariff rate relationship to show how MNEs set the optimal transfer
price. She argues that the existing literature assumes that MNEs are free to set transfer
prices, but in fact they are not. According to Eden (1983), transfer pricing settings depend
on customs and tax regulations; therefore, they are restricted by legislation in most OECD
countries. Subsequently, she theoretically examines the effects of regulation restrictions
on resource allocation decisions by MNEs in Canada and finds that customs valuation
methods affect transfer prices, which eventually affect MNEs’ output, sales and trade
flows.
The last example of the studies in economic literature that theoretically discuss tax
avoidance by MNEs is that of Grubert and Slemrod (1998), who posit that parent
corporations in high-tax countries tend to shift profits to their affiliates in low-tax
countries. Specifically, they theorise that tax rate differences between countries affect the
choice of locating real activity by MNEs, which will in turn affect the location in which
the profit is reported. Thus, in addition to the theory of tax avoidance by MNEs (i.e.,
MNEs are international tax avoiders), Grubert and Slemrod (1998) theorise that the tax
structure (i.e., tax rates and tax systems) affects MNEs’ decision to locate investment and
the decision to shift profits. They complement their theoretical analyses with empirical
analysis by examining micro-level data for 1987 relating to US corporations and their
investments in Puerto Rico. Consistent with their theory, the empirical results show that
a large proportion of the investment of US MNEs in Puerto Rico results from
opportunities to shift profits, suggesting that the advantages of income-shifting activity
are the predominant reason why US MNEs invest in Puerto Rico.

62
In accounting literature, Merville and Petty (1978) theoretically examine transfer
prices as the tool for achieving MNEs’ goals. They posit that MNEs benefit from tax rate
differences in different countries because it allows them to locate profits in the lowest tax
countries. They argue that transfer prices can be used by MNEs not only to minimise
costs, but also to optimise financial resources and shift assets to have a more favourable
business prospect. However, they realise that MNEs cannot set a transfer pricing
mechanism to achieve all of these goals simultaneously. Therefore, they design two
approaches to analyse the role of the transfer pricing mechanism. In the first approach,
the mechanism is assessed as a tool to maximise profits in the lowest tax rate jurisdiction
(single-objective approach). In the second approach, they treat the transfer pricing
mechanism as a tool to accomplish three main goals that an MNE can achieve through
transfer prices (multiple-objective approach): (1) maximising worldwide profits; (2)
achieving subsidiary profits goals; and (3) maintaining pricing bounds. In addition to
proposing the mathematical models, Merville and Petty (1978) provide numerical
examples (using US MNEs as parent firms) to facilitate an understanding of the proposed
models.46 They find that the multiple-objective approach offers a significantly more
robust outcome in combining the profit-maximising goal with other prospective goals.
According to the OLI framework, internalisation is the most decisive factor that
MNEs possess in setting up foreign affiliates. Moreover, studies that analyse tax
avoidance by MNEs provide evidence consistent with the theory of MNEs as tax avoiders.
In conclusion, the theory of tax avoidance by MNEs and the relevant theoretical studies
suggest that MNEs use tax avoidance strategies by exploiting opportunities to shift profits
between affiliates within the same group.
46 In the numerical example analysis, the authors use hypothetical parameter estimates and acknowledge
that it would be preferable to use actual firm data because the parameters should be unique to each firm.
However, as they admit, this is impossible for confidentiality reasons.

63
3.1.3 Methods and Indicators Used to Identify the Incidence of Base Erosion and
Profit Shifting
Existing literature that reviews studies on tax avoidance by MNEs (e.g. Fuest &
Riedel, 2010; Gravelle, 2010) identifies two major groups of empirical studies that focus
on the issue of tax avoidance by MNEs. In the first group, researchers observe the
association between reported profitability and tax rate differences across countries (e.g.
Weichenrieder, 2009; Clausing, 2016). In the second group, researchers examine the
different channels used by MNEs to shift profits (e.g. Clausing, 2003 investigates transfer
pricing; Huizinga, Laeven, & Nicodeme, 2008 study income shifting through debt).
However, some studies examine both. For instance, Mills and Newberry (2004) not only
examine whether the tax rate differences between the US and the parent countries of
foreign MNEs affect income reporting by foreign-controlled companies in the US, but
also whether those MNEs use debt financing as the channel for shifting profits from the
US.
The OECD (2015a) suggests that six indicators exhibit the incidence of BEPS and
its magnitude. The following points summarise the descriptions of the six indicators and
how they indicate that BEPS is occurring:47
1. Concentration of FDI relative to GDP
This is a macroeconomic indicator that measures real economic activity. A
significantly high ratio of FDI to GDP may indicate the occurrence of BEPS.
2. High profit rates of low-tax affiliates of top global MNEs
This indicator compares the profit rate (i.e., profits/assets) with the effective tax
rate (ETR i.e., tax expense/profit) of MNE affiliates for top global MNEs. For
each affiliate, a profit rate differential (the difference between the affiliate’s profit
47 The summary is based on the OECD (2015a, pp. 49-64).

64
rate and its MNE group’s worldwide profit rate) is compared with the affiliate’s
ETR differential (the difference between the affiliate’s ETR and its MNE group’s
worldwide ETR). A positive profit rate differential and a negative ETR
differential infer the incidence of BEPS.
3. High profit rates of MNE affiliates in lower-tax locations
This indicator compares the profit rate (i.e., profits/assets) of top global MNE
affiliates in low-tax jurisdictions with the MNEs’ worldwide profit rate. A higher
number indicates that stronger profit shifting into low-tax jurisdictions is
occurring.
4. Effective tax rates of large MNE affiliates relative to non-MNE entities with
similar characteristics
This indicator compares the ETRs of large MNE affiliates with local companies
with similar characteristics. A lower ETR of the MNE’s affiliates compared with
the ETR of local companies may indicate the incidence of BEPS.
5. Concentration of royalty receipts relative to R&D spending
The indicator compares the average ratio of royalties received with R&D
expenditure for a group of high-ratio countries to the average ratio for the other
countries in the sample. A higher indicator suggests a greater possibility of the
incidence of BEPS.
6. Interest expense to income ratios of MNE affiliates in countries with above
average statutory tax rates
The OECD (2015a) believes that debt allocation is one of the BEPS strategies
used by MNEs to decrease their worldwide tax liability. Substantial interest paid
by affiliates in countries with STRs above the weighted average indicates the
incidence of BEPS.

65
The OECD (2015a, p. 16) also emphasises that the six BEPS indicators confirm the
conclusions of existing studies that ‘profit shifting is occurring, is significant in scale, is
likely to increase, and creates adverse economic distortions’. As discussed below, even
though evidence from a developing country’s perspective on the incidence of BEPS is
still rare, it is likely that developing countries also suffer from cross-border profit shifting
strategies. The next two sections of this chapter discuss studies that have been conducted
regarding profit shifting by MNEs in developed countries and developing countries.
3.2 Profit Shifting by Multinational Enterprises in Developed Countries
Empirical studies that focus on tax avoidance strategies by MNEs using data from
developed countries are relatively well documented. They encompass a wide range of
strategies used by MNEs to shift profits from high-tax to low-tax jurisdictions using intra-
firm transfer mispricing, high corporate debt financing and the strategic location of assets
and overhead costs (Janský & Kokeš, 2015). The increasing availability of data in
developed countries plays an important role in conducting empirical studies. Early studies
on profit shifting in developed countries used country-level data or industry-group data.
Empirical studies then used MNEs’ firm-level financial reporting data. Recently, the
development of research that uses the tax return data of MNEs in developed countries has
become fairly advanced, as shown in Christian and Schultz (2005), Dowd, Landefeld, and
Moore (2017) and Grubert (2012).
Empirical studies on profit shifting by MNEs in developed countries began in the
1970s, when oil and gas companies expanded their operations overseas. It is therefore not
surprising that the studies mainly focus on examining whether oil and gas MNEs adopt
profit shifting strategies to minimise their overall CIT. Most of the studies focus on the
US and have identical findings, that is, MNEs exploit cross-border profit shifting

66
strategies to reduce their overall tax burden. For instance, Jenkins and Wright (1975) use
US petroleum corporation data during 1969–1972 to provide evidence that multinational
petroleum companies use international operations arrangements to minimise their tax
obligations. In another study, Bernard and Weiner (1990) use data from the US petroleum
industry during 1973–1984 and find little evidence to support the claim that multinational
petroleum companies shift profits because of differences in average effective CIT rates
between importing and exporting countries.
The availability of data—both in terms of quantity and quality—allows the study
of profit shifting in developed countries to improve over time. Weakness and limitations
of previous studies are often improved by subsequent studies. For example, Klassen,
Lang, and Wolfson (1993) examine geographic income shifting by 191 US MNEs in
response to changes in tax rates in four regions: the US, Europe, Canada and Others
during 1984–1990. After controlling for changes in the underlying profitability of MNEs
(i.e., using a control sample of US and non-US firms, geographic area, size and multi-
nationality), they find that US MNEs shift profits to the country in which the tax rate
decreased from the country in which the tax rate increased. For instance, in 1985, they
find that MNEs shifted profits to the US from Canada, where the tax rates increased in
that year. In 1986, they find that the MNEs shifted profits from the US to Europe, where
tax rates decreased in that year.
However, according to Jacob (1996), the incidence of profit shifting found by
Klassen, et al. (1993) may result from two mechanisms: (1) MNEs use transfer pricing
schemes; and (2) MNEs deliberately change their business methods (e.g., locating more
profitable operations in low-tax jurisdictions) in response to tax rates changes. However,
Klassen, et al. (1993) do not clearly express which one has been used by US MNEs to
shift profits (Jacob, 1996). Using data on the volume of intra-firm international trades as

67
a proxy for profit shifting occurrences, Jacob (1996) improves Klassen, et al. (1993) by
investigating how US MNEs shift their profits. He finds that they used transfer prices to
shift profits both before and after the US Tax Reform Law in 1986.
In terms of the magnitude of the revenue loss caused by profit shifting activities,
the existing literature also provides robust and ample evidence that the size of revenue
loss caused by profit shifting in advanced economies is substantial. For example, Pak and
Zdanowicz (2002) evaluate US MNEs and US subsidiaries of foreign parents and estimate
that the US Government experienced revenue losses of USD53 billion from the transfer
pricing of exports and imports of goods in 2001. In a study that covers US multinational
firms and their foreign affiliates, Clausing (2009) empirically estimates that USD180
billion profit from corporations is shifted out of the US, leading to more than USD60
billion in revenue losses in 2004. Several years later, Clausing updated this work and
found a revenue loss of around USD90 billion (around 30% of the country’s corporate
tax revenue) resulting from income shifting by US affiliates of foreign MNEs in 2008
(Clausing, 2011).
More current research shows that the findings from the earlier studies remain valid.
For example, using a unique panel dataset48 of US tax returns during 2002–2012, Dowd,
et al. (2017) examine the effect of profit shifting behaviour of US MNEs on profits
reported by their affiliates abroad. While they find that the reported profits significantly
depend on whether the foreign countries have a low or high tax rate, under linear
specification, they provide evidence that a one percentage point reduction in the tax rate
will result in a 1.4% increase in reported profits, regardless of whether the original tax
rate is low or high. Beuselinck, Deloof, and Vanstraelen (2015) scrutinise the effect of
tax enforcement and public listing status on income shifting by European MNEs during
48 Panel data (also called longitudinal data) refers to data for n different entities observed at T different
periods: (𝑋𝑖𝑡, 𝑌𝑖𝑡), i = 1, …, n and t = 1, …, T (Stock & Watson, 2015, p. 397).

68
1998–2009. They find that European MNEs shift profits from high-tax countries to low-
tax countries, and they provide evidence that income shifting is greater when local tax
enforcement is weak.
Theoretical research in corporate tax avoidance is discussed mostly in economic
literature, as shown in Section 3.1. In contrast, empirical studies on corporate tax avoidance
have been conducted for decades in many disciplines, including economics, accounting,
finance and law.49 However, empirical studies mostly focus on developed countries.
The issue of profit shifting by MNEs in developed economies has been discussed
in economic and accounting literature for many years. Most studies focus on profit
shifting by means of transfer pricing. Transfer pricing tax issues were previously
extensively discussed in economic literature, but not in accounting literature (Halperin &
Srinidhi, 1987). However, recently, the number of studies in accounting literature has
been steadily increasing. The following paragraphs discuss the development of the profit
shifting–tax avoidance issue by MNEs in economic literature and accounting literature.
As discussed in Section 3.1.2, studies that theoretically model the profit shifting
behaviour of MNEs have existed since the early 1970s. However, it was not until the
works of Grubert and Mutti (1991) and Hines and Rice (1994) that empirical evidence of
profit shifting by MNEs was quantitatively provided. According to Dharmapala (2014a,
p. 424), the methods introduced by the two papers are the primary approach to the
empirical estimation of BEPS in the economic literature. They are early pioneering
research on multinational income shifting and are important because they establish a
49 Hanlon and Heitzman (2010, p. 127) summarise how the multidisciplinary nature of tax research gives rise to
research difficulties in the tax area as follows: ‘The multidisciplinary nature of tax research is what makes tax
research exciting (yes, exciting), yet difficult. Tax research can be difficult not only because one has to follow tax
studies in accounting, finance, economics, and law (through academic institutions, governmental agencies, and
policy think tanks), but also because different disciplines often use different languages and have different
perspectives.’ Therefore, to avoid complexity, this thesis bases its discussion on economic and accounting
literature only.

69
conceptual framework that continues to be highly influential. In addition, the two studies
are among the most widely cited papers in tax avoidance research and have inspired
subsequent studies in economic literature (e.g. Desai, Foley & Hines, 2006; Hong &
Smart, 2010; Julio & Yook, 2016) and accounting literature (e.g. Lisowsky, 2010; Sikka
& Willmott, 2010; De Simone, 2016). Therefore, brief summaries of the two seminal
economic papers are provided below.
Using 1982 data on a cross-section of 33 countries, Grubert and Mutti (1991, p.
285) examine three related aspects of US MNEs’ activity: (1) the ability to shift profits
from high-tax countries to low-tax countries; (2) the effect of host country taxes and
tariffs on the distribution of real capital; and (3) the influence of tax and tariff policies on
international trade patterns of the US and host countries. To examine whether companies
shift profits to low-tax jurisdictions, they regress profitability (using two measures: the
ratio of book income to sales and the ratio of book income to equity) on tax rate (both
statutory marginal corporate tax rate and average ETR; the latter is measured as a ratio of
foreign taxes paid to book income of US-controlled corporations with positive profits)
and growth in the US’s GDP as an indicator of economy-wide profitability. As companies
may disproportionally shift profits to the lowest-tax jurisdiction, they also include the
inverse of the two tax rates in their empirical estimates to allow for the effect that is
concentrated in the lowest-tax countries. They find that, in all cases, the reported profits
are negatively correlated to tax rates, suggesting that the companies shift profits to lower-
tax jurisdictions.
Hines and Rice (1994) posit that MNEs have the ability to shift not only profits, but
also the use of productive factors (e.g., employment) to low-tax jurisdictions. They
examine this premise by evaluating the 1982 data on the use of 41 tax haven countries
70
(THCs)50 by US MNEs in reported profit–tax incentive regressions. Hines and Rice
(1994) identify the pre-tax income of an affiliate as the sum of ‘true’ income and ‘shifted’
income (Dharmapala, 2014a, p. 424). True income is generated by means of capital and
labour inputs. To predict the level of the true income, they include measures of capital
inputs (e.g., fixed tangible assets) and labour inputs (e.g., employment compensation) in
the estimation model. In contrast, shifted income is determined by tax incentives (i.e., tax
rate difference between the parent and the affiliate) to shift income in or out of the
affiliate. They find that, even though US MNEs place a substantial amount of activities
in THCs, the profits reported by affiliates in the THCs seem to be too high, suggesting
that the level of reported profits is significantly influenced by lower tax rates in the
THCs.51
Tax research in accounting literature that includes tax avoidance shares the same
research questions as tax research in economics and finance literature. Nonetheless,
according to Hanlon and Heitzman (2010), accounting literature offers three comparative
advantages. Two of the comparative advantages that are relevant to this thesis are as
follows.52 First, tax research in accounting uses specific knowledge of financial
accounting rules and an understanding of the institutional details of tax and financial
reporting to identify and examine research questions. Second, in regard to tax avoidance
research, accounting researchers benefit from understanding tax return data and income
tax data in financial reports to derive measures of firms’ tax avoidance activities and address
50 Hines and Rice (1994, p. 175) argue that the four common attributes of tax havens (low corporate or
personal tax rates, legislation that supports banking and business secrecy, advanced communications
facilities and self-promotion as an offshore financial centre) are vague characterisations that make the
process of classifying tax haven countries somewhat arbitrary. They then set up their own approach to
identify the 41 tax haven countries. See Hines and Rice (1994) for more detail. 51 Study 2 of this thesis (presented in Chapter 5) detects the incidence of cross-border profit shifting in
Indonesia by adopting the approach introduced by Hines and Rice (1994) with some modifications.
Therefore, a more detailed explanation of the HRA can be found in Chapter 5. 52 The third comparative advantage is that accountants benefit by studying asymmetry problems (Hanlon &
Heitzman, 2010). This advantage is less relevant to this thesis and therefore is not discussed further.

71
important questions about the determinants and consequences of tax avoidance. A brief
summary is presented below of three papers in the accounting literature that empirically
examine the issue of profit shifting by MNEs in developed countries.
Halperin and Srinidhi (1987) examine the effect of the two most commonly used
transfer pricing rules by MNEs for tax purposes in the US (i.e., resale price method and
cost plus method)53 on resource allocation decisions by MNEs when the tax rate abroad
is lower than in the US. Assuming that the tax rate abroad is lower than in the US, they
document that both transfer pricing rules distort resource allocation, which results in
lower overall pre-tax profits for the firm. They also document that MNEs in the US
intentionally change the level of resource allocation to shift taxes to affiliates in lower-
tax jurisdictions.
Collins, Kemsley, and Lang (1998) extend previous studies and suggest that they
contain limitations because of data constraints (as in Harris, Morck, & Slemrod, 1993),
period constraints (as in Klassen, et al., 1993; Harris, 1993) and differences in sample
composition across countries that cannot be controlled because foreign subsidiary data in
a given country are aggregated (as in Hines & Rice, 1994; Grubert & Mutti, 1991). Using
a larger dataset on US MNEs’ manufacturing companies and including a longer period of
study (1984–1992), the authors examine the cross-sectional relation between firm-level
foreign profit margins and average foreign tax rates. They find that an affiliate located in
a higher-tax jurisdiction will shift around USD25–USD30 million income to the US each
year.
53 According to Halperin and Srinidhi (1987), under the US Tax Regulations Section 1.482-2(e) of the
Internal Revenue Code, there are three methods for determining the appropriate transfer price: (1)
comparable uncontrolled price method (i.e., the transfer price is the market price of the intermediate
product); (2) resale price method (i.e., the applicable transfer price is the selling price of the final product
minus an appropriate mark-up on the sale); and (3) cost plus method (i.e., the transfer price is the
intermediate product’s cost plus an appropriate mark-up on the cost).

72
Klassen, Lisowsky, and Mescall (2016) use a survey of tax executives from MNEs
to investigate the differences in their transfer pricing strategies in an effort to minimise
the tax burden of MNEs. They set two categories of transfer pricing strategies: avoiding
disputes with tax authorities (indicative of the tax compliance transfer pricing strategy)
and avoiding cash taxes paid (indicative of the tax minimisation transfer pricing strategy).
After analysing the responses of 219 tax directors regarding their transfer pricing
strategies and practices, they document that more corporations choose to avoid disputes
with tax authorities (49%) rather than avoid cash taxes paid (41%). Their analysis shows
that MNEs that choose the tax minimisation transfer pricing strategy use tax avoidance
schemes significantly more often than those that choose the tax compliance transfer
pricing strategy. On average, MNEs using the tax minimisation strategy report lower
effective tax rate of 6.6% (implying tax savings of USD43 million) through transfer prices
compared with MNEs that use the tax compliance transfer pricing strategy.
In sum, there are numerous empirical studies of cross-border profit shifting by
MNEs in developed countries, especially the United States and the European Union, using
country-level data, industry-level data, firm-level financial reporting data and tax return
data. Prior studies find evidence of profit shifting in response to tax rate differences
between countries and identify intra-group transfer pricing and debt financing as the main
channels used to shift profits across country borders.
3.3 Profit Shifting by Multinational Enterprises in Developing Countries and the
Base Erosion and Profit Shifting Project
The studies discussed in the previous section focus on developed countries and
confirm that MNEs shift profits. However, MNEs operate not only in developed
countries, but also in developing countries. As a result, when MNEs commit profit

73
shifting strategies, both developed and developing countries are likely to be affected. This
makes BEPS a global issue, and developed countries alone cannot sufficiently address it.
Unfortunately, while empirical studies on developed countries are abundant, few studies
have focused on developing countries. This section discusses some studies that have
developing countries as their focus. It also examines why there are limited empirical
studies in developing countries.
Profit shifting within MNEs has been an issue in developed countries for decades.
However, it has only recently come to the attention of policymakers in developing
countries (Janský & Kokeš, 2015). To a large extent, reports of some international
institutions and empirical studies that suggest and argue that developing countries may
suffer from BEPS strategies by MNEs have considerably contributed to the attention. For
example, the OECD (2013b) argues that MNEs are being accused of avoiding taxes
worldwide—particularly in developing countries, where tax revenue is critical to promote
sustainable development.
In line with the OECD’s report, Dharmapala (2014b) claims that developed
countries do not rely on corporate tax revenues and therefore do not consider BEPS
activity by MNEs a major determining factor to their overall level of tax revenue. In
contrast, developing countries rely on corporate tax revenue because it contributes a
significant proportion of their total tax revenue, and they may find it difficult to switch to
other forms of taxation (Dharmapala, 2014b). As a result, ‘developing countries are
especially vulnerable to BEPS activity’ (Dharmapala, 2014b, p. 10). This statement is
consistent with the OECD’s (2014b) view that some of the lowest-income countries rely
on income tax from the operations of foreign MNEs.
Indonesia is not an exception. From economic surveys on Indonesia, the OECD
(2012, 2015b) finds that the nation’s budget relies heavily on revenue from corporate tax.

74
Another international institution that finds that developing countries rely on corporate tax
revenue is the IMF, which estimates that the global annual corporate tax revenue loss
caused by BEPS is approximately 5% of the total CIT revenue (IMF, 2014b). Moreover,
the IMF estimates that the loss is as high as 13% in developing countries, confirming the
high vulnerability of developing countries to profit shifting.
In 2012, the G20 initiated a global project to tackle profit shifting by MNEs and
asked the OECD to undertake the project. The OECD agreed and launched the project,
called Base Erosion and Profit Shifting, in February 2013. The G20 countries which are
not OECD members (e.g., Indonesia) became associates that have equal footing with
OECD members in the project and agreed to adopt an Action Plan54 to address BEPS in
September 2013 (OECD, 2013c). Since its launch, the project has received consistent
support from the G20 and is known as the OECD/G20 BEPS project or the BEPS project.
The OECD continues to encourage developing countries to be involved in the project. For
example, in its ‘Economics Surveys: Indonesia 2015’ report (OECD, 2015b, p. 15), the
OECD recommends that Indonesia ‘continue to be actively engaged in the OECD’s Base
Erosion and Profit Shifting (BEPS) Project’ because the OECD believes that the project
is an efficient tool to ‘facilitate and improve corporate taxation for multinationals which
should benefit Indonesia’s tax collection’ (OECD, 2016, p. 100).
The main purpose of the BEPS project is to provide an internationally coordinated
approach that facilitates and reinforces domestic actions to protect tax bases and provide
comprehensive international solutions to address the issue (OECD, 2014a). The reason is
that, although most BEPS strategies are legal, according to the OECD (2014a), it
generates several undesirable consequences. First, BEPS distorts competition because
MNEs may gain competitive advantages from BEPS opportunities that domestic
54 See the OECD’s report entitled ‘Action Plan on Base Erosion and Profit Shifting’ for details of the 15-
point action plan proposed by the OECD (2013c).
75
companies do not have. Second, it may cause the inefficient allocation of resources by
distorting investment decisions towards activities that have lower pre-tax rates of return,
but higher after-tax returns. Finally, it discourages voluntary compliance of most
taxpayers because they observe that MNEs legally avoid income tax. The three potential
distortions are compounded by the fact that most developing countries heavily rely on
CIT revenue and have positioned studies on BEPS—particularly studies that focus on
developing countries—as significantly important.
3.4 Profit Shifting by Foreign-owned Indonesian Companies and How the
Directorate General of Tax Fights It
As discussed in Chapter 2, the two completed tax reforms in Indonesia have
changed the nation’s taxation system. The 1983 tax reform has introduced novel
approaches, such as allowing taxpayers to calculate, pay and report their tax liabilities
(self-assessment system), and it has introduced technology to replace the previous paper-
based system. The tax administration reform that commenced in 2002 and was completed
in 2008 has also significantly improved taxation in Indonesia—particularly in upgrading
the face of the country’s tax services. For instance, tax data recordings have been more
reliable, tax officials have been more professional and the structure of the DGT
organisation has been simplified.
However, the success of the two major tax reforms was not followed by satisfactory
revenues collected from CIT. While the CIT amount collected has increased from year to
year, the percentages of the CIT in total revenue collected consistently decreased from
2009 to 2014 and slightly increased in 2015. Moreover, the tax-to-GDP ratio of Indonesia
has been lower than that of other ASEAN countries. In fact, the level of tax compliance

76
ratio (the ratio of corporate taxpayers that file a tax return to the number of corporate
taxpayers that must file a tax return) were below 60% during 2009–2015.
As in other developing countries, taxation in Indonesia suffers from substantial tax
evasion and tax avoidance. Further, until very recently, the Indonesian tax system is
characterised by the absence of anti-avoidance provisions—particularly effective transfer
pricing and debt financing (thin capitalisation) provisions. The lack of provisions to curb
cross-border profit shifting along with the lack of power and flexibility of the DGT has
made Indonesia vulnerable to international tax avoidance. Consequently, FOICs—the
Indonesian affiliates of foreign MNEs—have an opportunity to avoid Indonesian CIT by
using cross-border profit shifting strategies.
Based on data provided by the Indonesian Investment Coordinating Board (BKPM),
there were 22,000 FOICs in 2014 (DGT, 2015a). These FOICs contributed more than
25% of the corporate tax revenue in 2014 (Indonesian Ministry of Finance, 2015).
Despite this significant contribution, Indonesian government officers have
expressed concern that FOICs may have shifted profits out of Indonesia. For example, in
2013, Agus DW Martowardojo, Indonesian Finance Minister, stated that at least 4,000
FOICs have not paid CIT over the last seven years by claiming losses during that period
(Jefriando, 2013). Two years later, his successor, Bambang PS Brodjonegoro, revealed
that thousands of foreign-owned companies in Indonesia had never paid CIT since
commencing their businesses in the country. The finance minister argued that the
companies have used transfer pricing and debt financing to avoid taxes (Jefriando, 2015).
The fact that numerous FOICs have avoided Indonesian CIT by allegedly using profit
shifting schemes indicates that the 1983 tax reform and the 2002 tax administration
reform have not been sufficient to support the DGT to fight cross-border profit shifting.
However, there is almost no empirical evidence to support such claims. While some peer-

77
reviewed papers55 have specifically discussed tax avoidance in Indonesia, they do not
demonstrate sufficient empirical evidence regarding whether FOICs use profit shifting
strategies to minimise their tax liability. The remainder of this section summarises two
peer-reviewed papers that focus on the tax avoidance issue in Indonesia,56 presents a tax
avoidance provision to mitigate the incidence of BEPS in Indonesia and discusses some
issues related to BEPS encountered by the DGT.
Lerche (1980), a peer-reviewed study on tax avoidance in Indonesia, does not
specifically investigate tax avoidance—in particular, using profit shifting strategies—by
foreign MNEs in Indonesia. However, it pioneers the empirical study of tax misbehaviour
in Indonesia. By comparing the legal potential (i.e., the amount of tax revenue raised if
all taxpayers pay taxes according to Indonesian tax law) and the real amount of tax
revenue collected between 1969 and 1979, Lerche evaluates the efficiency and equity of
the Indonesian tax system. He finds that Indonesia had suffered from low tax revenue for
three main reasons: tax avoidance, tax evasion and tax collection inefficiency.
Specifically, using a hypothetical calculation (i.e., not based on real-world data), he posits
that, of an ideal tax revenue of USD1,500, the government can only collect USD250
(16.67%). The remaining USD1,250 (83.33%) is the potential revenue lost and is
dispersed in three taxation gaps: USD500 (33.33%) caused by tax avoidance, USD550
(36.67%) caused by tax evasion and USD200 (13.33%) caused by inefficient tax
collection procedures. While this finding is based on a hypothetical calculation, it
indicates that tax avoidance strategies have been a major option for taxpayers in Indonesia
to lower their tax burden.
55 This thesis bases the criteria on the Australian Business Deans Council (ABDC) Journal Quality List
2013: http://www.abdc.edu.au/pages/abdc-journal-quality-list-2013.html. 56 In fact, the two peer-reviewed papers discussed here are the only peer-reviewed papers that could be
found in the literature on tax avoidance in Indonesia.

78
An empirical study that focuses on tax avoidance by foreign MNEs in Indonesia is
that of Gramlich and Wheeler (2003). However, unlike this thesis which investigates
whether FOICs avoid Indonesian CIT, Gramlich and Wheeler examine how Indonesian
affiliates of US MNEs are used by their parent companies to avoid US CIT. Specifically,
they study how two giant oil MNEs—Chevron and Texaco, collectively known as
Caltex—used their Indonesian subsidiaries to avoid US CIT from 1964 to 2002. They
find that the parent companies of Chevron and Texaco in the US suppressed their US CIT
for decades by asking their subsidiaries in the US to pay higher market prices for
Indonesian crude oil exported from Indonesian subsidiaries. The higher market price
increased the cost of goods sold, which eventually reduced the parents’ income taxes in
the US. The authors also find that, as a result of the overpricing of oil exported to the US,
the high income of Caltex—the subsidiary in Indonesia—is further distributed to the
parents (Chevron and Texaco) in the US in the form of a higher dividend income along
with foreign tax credit paid for the dividend in Indonesia. While it appeared that the
Indonesian government collected higher income taxes because of the overpricing,
Gramlich and Wheeler (2003) document that the Indonesian government granted Caltex
extra oil to compensate for the extra taxes received. Although the study is less relevant to
the issue of whether FOICs shift profits to avoid Indonesian income taxes, the study
suggests that Indonesian affiliates are used by their parents in a profit shifting scheme to
avoid the overall, or group, CIT.
Although there is little supporting empirical evidence, the DGT is aware that the
incidence of international tax avoidance has increased because of the borderless economy.
The following statement depicts the DGT’s concern about tax avoidance by FOICs—
particularly by means of transfer pricing arrangements (DGT, 2010, p. 80):
Under the current globalisation, the intensity and magnitude of transnational
transactions are more dominant in the economy either by related parties or

79
independent parties. This brings different tax implications and should receive
serious concerns. Transfer pricing is closely related to transactions between
affiliated parties, which must be strictly supervised since it can be used to reduce
the tax that must be paid (tax avoidance).
The concern of the government can also be observed in the ITL amendments that
have been passed by the legislature to date. The government has amended the ITL four
times since it came into force on 1 January 1984. In the amendments, ITL Article 18
regarding international tax issues has been included three times. The tax avoidance
provisions—especially those related to company tax avoidance—according to ITL
Article 18 and its elucidation, as lastly amended in 2008 and took effect on 1 January
2009, are outlined below:
(1) The finance minister is authorised to issue a decree on the debt-to-equity ratio for
tax purposes.
More debt generates higher interest expense. Given that interest is a deduction
under ITL, a higher interest expense results in lower tax payable. Thus, companies
have incentives to use debt rather than equity to finance their business activities.
ITL Article 18(1) is therefore intended to restrict companies from treating equity as
debt. ITL refers to equity as defined in the Indonesian accounting standards.
Following the authority mandated by ITL Article 18(1), the finance minister
enacted Finance Minister Regulation (PMK) number 169/PMK.03/2015 (PMK
169/2015) about Debt to Equity Ratio for Income Tax Computation Purposes in
2015. The regulation came into effect on 9 September 2015 and was implemented
in 2016. It is known as the Indonesian anti-thin capitalisation provisions and is
intended to restrict the practice of profit shifting by means of high debt financing
by FOICs. Under the regulation, taxpayers can claim the maximum debt-to-equity
ratio of four to one for tax purposes. PMK 169/2015 replaced Finance Minister
Decree (KMK) number 1002/KMK.04/1984 (KMK 1002/1984). Under KMK

80
1002/1984, the maximum debt-to-equity ratio is three to one. Although KMK
1002/1984 should have come into effect on 8 October 1984, but on 8 March 1985,
the finance minister released a decree (254/KMK.01/1985) to postpone the
implementation of 1002/KMK.04/1984 until an unspecified time.
(2) The finance minister is authorised to determine when a resident taxpayer is deemed
to receive dividends from a non-listed foreign company provided that the taxpayer
(or together with other resident taxpayers) controls at least 50% of the shares of the
foreign company.
This provision is known as the Controlled Foreign Company (CFC) rules in
Indonesia.57 As explained in Section 2.2.2, under ITL Article 24, foreign income is
included in the TI of a resident taxpayer only when foreign income is received by
the resident taxpayer. The purpose of Article 18(2) is therefore to minimise tax
avoidance by resident taxpayers that invest in non-listed foreign companies, but not
to distribute or repatriate dividend income to the resident taxpayers. The following
is an example of the implementation of the CFC rule according to the elucidation
of ITL Article 18(2):
Company A and Company B, both are resident taxpayers, own shares of 40 percent
and 20 percent respectively in X Ltd., a non-listed company domiciled in country
Q. X Ltd. had generated profits after tax in the last few years but had not distributed
dividends to its shareholders. In this case, Finance Minister has full authority to
determine the time and the amount the dividends deemed to be received by Company
A and Company B.
57 According to the UN (2013c, p. 23), ‘CFC rules are designed to prevent tax being deferred or avoided by
taxpayers using foreign corporations in which they hold a controlling shareholding in low-tax jurisdictions
and “parking” income there. CFC rules treat this income as though it has been repatriated and it is therefore
taxable prior to actual repatriation’.

81
Following the authority given by ITL, the finance minister issued Finance Minister
Regulation No. 158/2008 in 2008 (PMK 158/2008). It states that the dividends are
deemed to be received either in the fourth month after the deadline of tax return
submissions in the host country (the country in which the foreign income is
generated) or in the seventh month if the tax law in the host country does not require
the submission of tax returns. The amount the dividend deemed to be received
should refer to the ownership interests. Using the example of the implementation
of the CFC above, if X Ltd made an income after tax of Rp1 billion in 2009 and the
finance minister decided that Company A and Company B should receive a
dividend from X Ltd, both companies should include an income of Rp400 million
(40% ownership interest in X Ltd multiplied by X Ltd’s profit after tax of one
billion Rupiah) and Rp200 million (20% ownership interest in X Ltd multiplied by
X Ltd’s profit after tax of one billion Rupiah) respectively in their TI.
(3) The Director General of Tax is authorised to re-determine income and deductions
and to reclassify debt as equity for TI computation purposes for transactions
between related parties using several methods that are internationally recognised,
such as the price comparison method between independent parties (known as the
comparable uncontrolled price method), resale price method and the cost-plus
method.58
The government understands that transactions between related parties tend to result
in a lower TI. The purpose of this provision is to prevent tax avoidance by
deliberately suppressing income or boosting deductions from transactions between
related parties. Similarly, the government notices that company taxpayers may
report equity as debt. This provision allows the Director General of Tax to reclassify
58 Elucidation of ITL Article 3 defines uncontrolled price method, resale price method, cost-plus method as
defined by Halperin and Srinidhi (1987). See Section 3.2 for brief definitions of the three terms.

82
the debt as equity in accordance with ITL Article 18 and the related Finance
Minister Regulation. ITL also authorises the DGT to make the reclassification by
comparing the debt-to-equity ratio of the related parties with that of non-related
parties. Therefore, the party that pays the interest on the debt may or may not claim
the outgoing, or part of the outgoing, as a deduction. Accordingly, the party that
receives the interest may or may not be taxed as if they receive a dividend income.
Following the authority mandated by ITL Article 18, the Director General of Tax
issues the Director General of Tax Regulation PER-43/PJ/2010 about the
Implementation of Arm’s Length Principle for Transactions with Related Parties,
in 2010 and was in effect on 6 September 2010. On 11 November 2011, the DGT
amended PER-43/PJ/2010 by issuing PER-32/PJ/2011. PER-32/PJ/2011 is the
current Indonesian transfer pricing provisions and is intended to ensure that related
parties apply a fair market price in their business transactions. Among other things,
PER-32/PJ/2011 requires related parties to provide detailed transfer pricing
documentation regarding their pricing and profiting procedures.
(3a) The Director General of Tax is authorised to conclude an agreement with a taxpayer
and collaborate with tax authorities from other countries to determine pricing for
transactions between related parties.
A pricing agreement (known as an Advance Pricing Agreement or APA) is a deal
between a taxpayer and the Director General of Tax regarding fair selling prices for
taxpayers’ products before taxpayers sell their products to their related parties. ITL
specifically mentions that the objective of the agreement is to reduce the practice
of transfer mispricing by MNEs.
An APA is considered advantageous for both taxpayers and tax authorities. It is
beneficial for taxpayers because it provides legal certainty as well as simpler tax

83
computation documentation. For tax authorities, an APA is advantageous because
it reduces the need to perform tax audits and subsequent corrections and
adjustments. According to ITL, an APA can be a unilateral agreement or a bilateral
agreement. If the parties involved are the Director General of Tax and a taxpayer,
the agreement is called a unilateral APA. If the parties involved are the Director
General of Tax and the tax authority of another country, it is called a bilateral
agreement.
(3b) Taxpayers that buy shares or assets of other companies through a special-purpose
company can be considered the actual party that purchases the shares or assets,
provided that the taxpayers and the special-purpose company are related parties and
the price of the transaction does not satisfy the arm’s-length principle.
This provision is intended to prevent resident taxpayers from avoiding taxes by
purchasing shares/equity of another resident company taxpayer using a foreign
company that was established specifically for that purpose, known as a special-
purpose company (in tax literature, a special-purpose company is also known as a
special-purpose vehicle (SPV), a conduit company or a shell company).
(3c) The sale or transfer of shares of a special-purpose company that was established or
domiciled in a THC and is a related party of a resident taxpayer could be deemed
as the sale or transfer of shares of the resident company taxpayer. Figure 3.1
provides an example of this provision based on the elucidation of ITL Article 18
(3c).

84
Figure 3.1
Selling a Special-purpose Vehicle in a THC by a Foreign Company Deemed as
Selling a Resident Company under Income Tax Law
Country B
100% Money
Country A
(THC)
95%
100%
Indonesia
As shown in Figure 3.1, X Ltd is a company that was incorporated and domiciled
in Country A, a THC. It controls 95% of the shares of Company Z, a resident
company taxpayer. X Ltd is wholly owned by Y Co., a company domiciled in
Country B and established as a conduit company to obtain the majority shares of
Company Z in Indonesia. If Y Co. sells all of its shares in X Ltd to Company W,
another Indonesian resident company taxpayer, the transaction is legally a transfer
of shares of a foreign company by a foreign taxpayer. However, according to ITL
Article 18 (3), the essence of this transaction is the transfer of shares of a resident
company taxpayer by a foreign taxpayer. The reason is that, by acquiring X Ltd,
Company W, which is an Indonesian resident company taxpayer, will
simultaneously acquire Company Z, which is also an Indonesian resident company
taxpayer. Consequently, any gain from the sale by Y Co. is subject to Indonesian
income tax.
(4) ITL refers to two or more taxpayers that are connected by at least one of the
following situations as related parties:
Y Co.
X Ltd.
Company Z Company W

85
a. Ownership. This includes directly or indirectly owning at least 25% of the equity of
other taxpayers or a relationship among taxpayers through ownership of at least
25% of the equity. Figure 3.2 illustrates related parties based on ownership
according to the elucidation of ITL Article 18 (4a).
Figure 3.2
Related Parties Based on Ownership
50% 25%
50%
As shown, Company A directly owns 50% of the shares of Company B. If Company
B owns 50% of the shares of Company C, Company A indirectly has ownership of
25% of the shares in Company C. Further, Company A also owns 25% of the shares
of Company D. In this case, the four companies are considered related parties. For
example, Company A and Company B are related parties because of direct
ownership. Company A and Company C are related parties because of indirect
ownership, and Company C and Company D are related parties because of the
common ownership by Company A.
b. Control of management or technology. Two or more companies are considered
related parties if they are under the same control of management or technology. This
provision implies that to be considered related parties, companies do not have to
have ownership. The presence of control of management and technology in one
Company A
Company B
Company C
Company D

86
company by another company can also indicate that the two companies are related
parties for tax purposes.
The amendments of ITL Article 18 above are the major provisions in combating tax
avoidance by MNEs in Indonesia. These new provisions came into force on 1 January
2009 and have not been further amended. That is, the cross-border tax avoidance
provisions remained unchanged from 2009 to 2015. This is another reason for the study
period in this thesis to begin in 2009 and end in 2015.
Although ITL Article (18) contains relatively complete international tax avoidance
provisions, it leaves some potential problems that arise because of the delay in issuing the
operating regulations by the minister of finance and the Director of General Taxes as
mandated by ITL Article 18(1) and (3), respectively. First, since the finance minister only
issued 169/PMK.03/2015, which was effectively enacted on 9 September 2015, Indonesia
did not have a specific thin capitalisation provision until that date. While the provision
was in effect in September 2015, it is arguable that the new provision was not effectively
in force until 2016 or even 2017 because taxpayers may need more time to become
familiar with it. Therefore, practically thin capitalisation provisions did not exist during
2009–2015. Second, since the transfer pricing provision was in effect on 6 September
2010, it can be assumed that company taxpayers effectively began applying the new
provision in 2011. Therefore, during the period of study of this thesis (2009–2015),
Indonesia effectively did not possess transfer pricing provisions until 2011.
Previous studies find that transfer pricing rules effectively increase the use of the
‘arm’s-length principle’ on intra-firm trade (e.g. Halperin & Srinidhi, 1987; Schjelderup
& Weichenrieder, 1999)59 and that thin capitalisation rules effectively lessen the incentive
59 However, some studies find that transfer pricing rules may lower the income tax paid by MNEs in
countries where transfer pricing rules are enacted. For example, Halperin and Srinidhi (1987) find that the
US transfer pricing rules result in less taxes paid in the country because the firm’s overall pre-tax profit
would be lower under the rules than in an unconstrained situation. They also find that such restrictions

87
to use internal loans for tax avoidance (e.g. Buettner, Overesch, Schreiber, & Wamser,
2012; Buslei & Simmler, 2012). Therefore, the absence of such rules may have increased
the opportunities for FOICs to shift profits out of Indonesia.
Another potential problem encountered by the DGT that is likely to affect its
efficiency in combating alleged cross-border profit shifting is that the Indonesian tax
authority is deemed to have insufficient resources to handle international tax issues. The
DGT once had the Directorate of International Taxation Relations (an Echelon II unit),
which exclusively dealt with issues of international taxation. The directorate was
established in 1993, but it only existed for around one decade. Afterwards, while the DGT
acknowledged that international tax avoidance was the main issue to overcome, it had
only two relatively small units that watched international tax matters. One is the Sub
Directorate of International Tax Treaty and Cooperation. This unit is an Echelon III unit
under the Directorate of Tax Regulation II and focuses on drafting regulations on
international taxation and the exchange of information with other tax authorities.60 The
other unit is the Sub Directorate of Special Transaction Audit, which is an Echelon III
unit under the Directorate of Tax Audit and Collection. The total tax officials in both units
numbered less than 50. The structure of the units that handle international tax cases
remained the same until 2015.61
The small numbers of tax units and tax officials in charge of monitoring cross-
border transactions has affected the number of cross-border tax cases detected. For
example, only one transfer pricing case was handled by the DGT in 2008. As discussed
prompt MNEs to shift taxes from the US to lower-taxed affiliates overseas by changing the level of resource
allocation. 60 See Figure 2.2 for the structure of the head office of the DGT. 61 In 2016, the DGT restructured the organisation and established three new directorates—one of which is
the Directorate of International Taxation. This directorate is in charge of several fields in international
taxation issues, such as formulating and implementing international tax policies, drafting the exchange of
information, advance pricing agreements and mutual agreement procedures norms, standards, procedures
and criteria, and providing mentoring, monitoring, control and evaluation of international tax policies
(DGT, 2016b).

88
in Section 2.2, the DGT is a single directorate under the Indonesian Ministry of Finance.
As a result, it does not have the authority to expand its own institution. Therefore, the
DGT must optimise existing resources to tackle the progressive development of
international tax avoidance. For instance, under the supervision of the Sub Directorate of
Special Transaction Audit, the DGT conducted a transfer pricing management program
in 2009. As part of the program, 1,000 tax officials (in particular, tax auditors) were
trained in transfer pricing topics (Directorate General of Tax, 2010). As a result, transfer
pricing cases handled by the Sub Directorate significantly increased in 2009 compared
with the previous years. Table 3.1 shows the transfer pricing cases handled by the DGT
in 2008 and 2009.
The significant increase that occurred after the training program indicates that
transfer pricing is probably a common strategy used by FOICs to shift profits. It also
explains the small number of transfer pricing cases detected in 2008. Indonesian tax
auditors/officials did not have sufficient knowledge to understand that international
transfer pricing was occurring.
Table 3.1
Transfer Pricing Cases, 2008–2009
Type of Case 2008
Semester 1
2008
Semester 2
2009
Semester 1
2009
Semester 2
Supervision 0 1 11 32
Audit 1 3 8 12
Objection 0 2 2 3
Appeal 0 2 5 10
Total 1 8 26 57
Source: DGT (2010, p. 81)

89
International tax disputes, such as transfer pricing cases between taxpayers and the
DGT, are solved mainly by using provisions as stated in tax treaties between Indonesia
(the host country—i.e., the source country of the business income) and the home country
(i.e., the source country of the investment, sometimes called the domicile country of the
income earner, or simply domicile country). A tax treaty is an agreement between two
contracting states: a host country and a home country. It is designed to avoid double
taxation or double non-taxation on certain incomes. Double taxation means that the same
TI is taxed by both the home country and the host country. Double non-taxation refers to
an income that is not taxed by both countries. For example, when a transfer pricing dispute
occurs and it involves a related party domiciled in a country that is a tax treaty partner of
Indonesia, the parties involved in the dispute can request tax relief according to the
procedures agreed in the tax treaty. In Indonesia, a tax treaty is established based on ITL
Article 32A and International Agreement Law No. 24 Year 2000. Table 3.2 shows the
development of the Indonesian tax treaty network during 2009–2015.
Table 3.2
Tax Treaty Network of Indonesia, 2009–2015
Description
Year
2009 2010 2011 2012 2013 2014 2015
Total 59 59 60 60 63 65 65
Newly signed - - Iran - Croatia
Morocco
Hong Kong
Suriname
Papua New-
Guinea*
-
Revoked - - - - - - -
Note: *The effective date of the tax treaty with Papua New Guinea was 1 January 2015.
Source: DGT (2015b). See Appendix 2 for a list of Indonesia’s tax treaty partners as at 30 June 2018.

90
In general, three key tax avoidance provisions are included in a tax treaty between
Indonesia and its partner countries. The three provisions are considered important and
relevant to the issue discussed in this thesis because they are the three mechanisms that
can be used to curb cross-border profit shifting by FOICs. The first mechanism is the
exchange of information (EoI). By agreeing to include an EoI article on the tax treaty, the
designated representatives from the governments of the two contracting states (i.e., the
competent authorities) agree to exchange data on taxes by request, automatically or both.
Data collected from the partner tax authority can be used as supporting evidence (in some
cases as the main evidence) to resolve the ongoing dispute. Therefore, the EoI is
considered an effective tool for solving cross-border tax disputes such as transfer pricing.
In many cases, the information received from another tax authority may be useful and
may be the key to preventing tax disputes. In a recent development in the EoI, Indonesia
joined the agreement for Automatic EoI under the OECD Common Reporting Standard
in 2015, which will be in effect by 2018 (OECD, 2016). According to the OECD (2016,
p. 99), the critical objective of the agreement is ‘to improve the management of cross-
border activities through cooperation of tax administrations in today’s globalised
economy’. The EoI for tax purposes is regulated under Government Regulation No. 74
Year 2011 Article 56.
The second feature is the mutual agreement procedure (MAP). According to the
OECD (2007, p. 8), the MAP provision in tax treaties ‘allows the competent authorities62
to interact with the intent to resolve international tax disputes. These disputes involve
cases of double taxation (juridical and economic) as well as inconsistencies in the
62 According to the Minister of Finance Decree Number 188/KMK.01/2013, there are two competent tax
authorities for the purposes of establishing and/or renegotiating a tax agreement between Indonesia and
other countries: (1) Head of Fiscal Policy Office as the competent authority for establishing and/or
renegotiating a Tax Treaty Agreement; and (2) Director General of Tax as the competent authority for
establishing and/or renegotiating MAP and EoI. Like the DGT, the Fiscal Policy Office is an Echelon I unit
under the Indonesian Ministry of Finance.

91
interpretation and application of a convention’.63 A tax treaty usually contains at least one
article that specifically regulates MAP procedures, which allows competent authorities
from both contracting states to solve any cross-border tax disputes. In Indonesia, a MAP
plays an important role because it ‘provides opportunity for taxpayers in resolving tax
disputes and is considered an alternative to settle the disputes other than objection and
appeal’ (DGT, 2015b, p. 78). Thus, a MAP is a tool that can be used to solve international
tax disputes, and it is therefore only useful after a dispute arises. In Indonesia, the legal
basis for establishing a MAP is ITL Articles 55–59.
The third feature is the APA. As explained earlier in this section, an APA is an
agreement between the DGT and the taxpayer (or tax authority) regarding arm’s-length
prices for transactions between related parties. Therefore, an APA is a tool that can be
used to avoid disputes because the prices are agreed before the transactions occur.
Indonesia regularly performs APA, EoI and MAP with several contracting states every
year—particularly with countries that have a large number of companies in Indonesia,
such as Singapore, Japan and the US. The legal foundation of forming an APA is ITL
Article 18 (3a).
As the Indonesian tax authority, the DGT is aware of the situation relating to
international tax avoidance:
DGT biggest challenges in the context of tax administration are transfer pricing, tax
avoidance, and tax evasion. To overcome these challenges, in the coming years
DGT will put more focus on tax intensification policy, improvement of taxpayers’
compliance, and improvement of human resource capacity building. (DGT, 2013,
p. 26)
Moreover, Arnold (2012) examines the performance of Indonesia’s tax system and
suggests that although the DGT has managed to make some progress, it needs to improve
its capacity in the area of MNEs’ profit shifting and transfer pricing, consistent with the
63 However, although the MAP article requires the competent authorities to reach an agreement, it does not
compel them to reach an agreement and resolve their tax disputes (OECD, 2007).

92
DGT’s awareness. To date, it appears that the DGT is not sufficiently capable of tackling
profit shifting, which magnifies the opportunity for FOICs to shift profits out of
Indonesia.
3.5 Chapter Summary
This chapter outlines the contextual literature of profit shifting by MNEs. It begins
by elaborating the theories that explain tax avoidance by MNEs. Internalisation, which is
defined as an opportunity to exploit products or processes internally among companies
within the same ownership, is believed to be central in giving MNEs opportunities to
avoid tax liability using their worldwide affiliates. They have opportunities to deploy
certain prices for products they sell (buy) to (from) different companies but within the
same ownership to supress the overall tax burden. Prior studies show that the main trigger
for cross-border tax avoidance has been tax rate differences between countries.
This chapter then analyses prior studies that examine the incidence of profit shifting
in developed countries. Although there are ample studies both in terms of quantity and
the variety of approaches used, they mostly focus on developed countries. Prior studies
can be divided into two groups. The first group of studies detects the incidence of profit
shifting by MNEs. Overall, they conclude that tax rate differences between countries
create an incentive for MNEs to shift profits to low-tax jurisdictions to suppress their tax
liability. The second group of studies identifies the channels used by MNEs to shift their
profits. Most empirical studies find that the two channels that MNEs use the most to shift
profits are transfer pricing and high debt financing.
Some prior studies suggest that developing countries also suffer from profit shifting
by MNEs. While this suggestion is based on indirect indicators rather than actual data
from developing countries, the occurrence of profit shifting by MNEs appears to be

93
genuine. As prior studies explain, the fact that developing countries heavily rely on
revenue from corporate tax places them in a more vulnerable position compared with
developed countries.
Finally, Indonesia is also aware of the development of international tax avoidance.
While there is little empirical evidence on profit shifting by FOICs, there is a strong
indication of its existence. Therefore, ITL amendments always include some articles that
strengthen international tax provisions. However, despite the country’s continuous
efforts, Indonesia still appears to suffer from international corporate tax avoidance
strategies. The most likely causes are insufficient anti-avoidance provisions and a lack of
capability, both institutional arrangements and human resources, to tackle cross-border
tax avoidance.
To date, there is little empirical evidence regarding the existence of profit shifting
by MNEs in Indonesia, which is a major developing nation that is actively involved in the
OECD/G20 BEPS project. Therefore, it is important to find empirical evidence of cross-
border profit shifting in the country. This finding will support the statements made by two
Indonesian ministers of finance and the suggestions made by prior studies and reports.
Thus, this thesis presents three studies to fill the gap in the literature. Using Indonesian
confidential tax return data obtained from the DGT, the three studies attempt to detect the
incidence of profit shifting in Indonesia and identify how FOICs shift profits out of the
country, as summarised below.
Study 1, presented in Chapter 4, examines how tax rate differences between the
parent country of an FOIC and Indonesia relates to profits reported by the FOIC in its
Indonesian tax return. This is the first step needed to identify the existence of profit
shifting by MNEs operating in Indonesia. The results of Study 1 lay the foundation for
the other two studies of this thesis.

94
Study 2, presented in Chapter 5, reinforces the findings of Study 1 by using the
Hines and Rice Approach (HRA), which is a well-recognised and widely used research
method to detect the presence of profit shifting activities by MNEs.
Study 3, presented in Chapter 6, attempts to determine how FOICs shift profits out
of Indonesia by examining the channels they use for cross-border tax avoidance strategies.
As explained in Section 3.1.1, transfer pricing arrangements and high debt financing are
the two channels mostly used by MNEs to shift profits. Study 3 examines whether FOICs
use these two intra-group profit shifting channels to shift profits out of Indonesia.

95
CHAPTER 4:
RELATION BETWEEN TAX RATE DIFFERENCE AND
THE PROFIT REPORTED IN INDONESIA
4.1 Introduction
This chapter presents Study 1 of this thesis. It attempts to provide preliminary
evidence of the existence of cross-border profit shifting in Indonesia which is a major
developing economy. Study 1 empirically examines the relation between the tax rate
difference between the parent’s country of FOICs and Indonesia and the profit that FOICs
report in their Indonesia annual tax return. Tax rate difference (defined as the corporate
tax rate of the parent’s country of an FOIC minus the Indonesian corporate tax rate)
motivates FOICs to shift profits out of Indonesia.
After analysing a sample of around 6,000 firm-year observations over the period
2009–2015, multivariate regressions find a positive relation between the tax rate
difference and the profit reported in Indonesia, suggesting that FOICs shift profits out of
Indonesia to lower tax countries. This finding provides preliminary empirical evidence of
the incidence of profit shifting from a developing country’s perspective using confidential
tax return data. This preliminary evidence leads to the next two related studies of this
thesis.
The remainder of this chapter is organised as follows. Section 4.2 presents the
literature review and develops the hypothesis. Section 4.3 describes the research design
of the study, including the sample selection procedure and the measurement of variables.
Section 4.4 reports the empirical results of the study. Finally, Section 4.5 summarises the
chapter.

96
4.2 Literature Review and Hypothesis Development
A number of studies have empirically examined the effect of tax rate differences on
BEPS activities and have provided empirical evidence of profit shifting towards countries
with lower tax rates (e.g. Hines & Rice, 1994; Collins, et al., 1998; Huizinga & Laeven,
2008; Newberry & Dhaliwal, 2001). Recent studies (e.g., Clausing, 2016) find that TI is
sensitive to corporate tax rates, which is consistent with the findings in previous studies.
Therefore, as Beer and Loeprick (2015) conclude, the finding that MNEs shift profits to
lower-tax jurisdictions appears to hold over different periods in the past two decades,
even though the studies use different public and private databases at the national, regional
and global levels. However, previous studies show that the incidence of BEPS may
depend on the type of tax rate difference that has been used in the study. The following
paragraphs briefly discuss two types of tax rate differences that are most commonly used
in previous international tax avoidance studies and provide the reasons for the type of tax
rate difference used in this study.
The most important trigger used to detect profit shifting is the tax rate difference
between the source country of the investment (home country) and the source country of
the business income (host country). Based on existing literature, studies of profit shifting
motivated by tax rate differences may use either statutory tax rate (STR) or effective tax
rate (ETR) to compute tax rate differences to proxy for tax incentives to shift profits.
Before discussing how the two tax rate differences are used in the profit shifting literature,
it is necessary to define STR and ETR.
The OECD (2013b, p. 19) defines corporate STR as ‘the rate specified in a country’s
tax law that is applied to a corporation’s TI to determine the amount of the taxpayer’s tax
liability’. However, this type of tax rate does not capture the real tax burden because it
does not include several important factors, such as tax allowances deducted against the

97
tax base, timing issues (e.g., choice of depreciation method) and tax planning strategies
that may be used to achieve a desired level of actual tax paid (OECD, 2013b). In contrast,
ETR is defined as ‘the ratio of corporate income tax to a pre-tax measure of corporate
profit over a given period of time… being based on measures of actual taxes paid, and
therefore capturing the range of factors affecting actual tax liability (statutory provisions
as well as tax planning)’ (OECD, 2013b, p. 19).
The use of either STR or ETR difference is a topic of debate in the central issue of
profit shifting. For example, Dowd, et al. (2017) suggest that using STR rather than ETR
is a common practice in the profit shifting literature. In contrast, some researchers (e.g.
Clausing, 2016; Grubert, 2012; Clausing, 2009; Grubert & Mutti, 1991; Grubert, 2003)
argue that ETR is considered a more appropriate measure than STR. Some studies (e.g.,
Clausing, 2003; Dowd et al., 2017; Mills and Newberry, 2004) use both STR and ETR in
their analyses. Although studies that use both STR and ETR in their analysis confirm the
mainstream findings that MNEs shift profits to low-tax jurisdictions, some studies find
mixed results. The next paragraph summarises these studies.
Clausing (2003) obtains similar results using both STR and ETR to examine profit
shifting by MNEs. Using US intra-firm international transaction data during 1997–1999,
she finds that US MNEs use lower export prices and higher import prices for intra-firm
transactions than for non-intra-firm trade transactions when the tax rate in the other
country is lower than the US tax rate. The results are consistent either using STR or ETR.
An example of a study that uses both STR and ETR and obtains slightly different results
is that of Dowd, et al. (2017). In their log-linear model, they find that the semi-elasticity
of the reported profit to the tax rate is 1.44 for STR and 1.08 for ETR. They conclude that
the difference is insignificant. An example of a study that uses both STR and ETR and
obtains completely different results is that of Mills and Newberry (2004). Using financial

98
data and confidential tax return data of foreign-controlled US corporations during 1987–
1996, they find that tax incentives affect foreign MNEs’ income reporting in their US
subsidiaries when they define tax incentives as the difference between US STR and
foreign parent ETR. In contrast, they do not find any tax incentive effects when they
measure tax incentives as the difference between US STR and foreign parent STR.
The OECD (2013b) compares STR with ETR regarding their capability in capturing
the incidence of BEPS. According to the OECD (2013b), although ETR is a better
measure of actual tax paid than STR, the use of ETR has the following issues. First, a low
ETR does not necessarily mean aggressive tax planning strategies. It may result from a
special tax provision introduced by the government as an incentive to promote certain
policies. Second, the data needed to appropriately compute ETR (i.e., tax paid data as the
numerator and pre-tax profit data as the denominator) are limited. As a result, the ETR
derived from such limited data may be insufficient to indicate the existence of BEPS.
Third, researchers tend to use different methods to calculate ETRs. Accordingly, similar
studies may have different or even contradictory results. Given the flexibility in
computing ETRs, some studies intentionally use certain ETR computation procedures to
confirm the desired conclusion (OECD, 2013b).
In a paper that reviews the literature of tax avoidance by MNEs, Dharmapala
(2014a) finds that the corporate tax rate difference between the parent’s country and the
affiliate’s country remain the foremost incentive for investigating the occurrence of profit
shifting into or out of the affiliate. Further, he suggests that STR is a typical choice for
computing the tax rate difference because unlike ETR, which can be influenced by a firm
and hence is endogenous to the firm’s choice, STR is set by the government and hence is
exogenous to the taxpayer’s choice. Therefore, STR provides a more reliable source of
identification despite the fact that it does not completely capture the actual tax burden

99
(Dharmapala, 2014a). A number of studies confirm that the STR discrepancy between
countries is a major incentive for MNEs to shift profits (e.g. Bartelsman & Beetsma, 2003;
Egger, Eggert, & Winner, 2010). Following Dharmapala’s suggestion and the OECD’s
explanation above, this study chooses STR difference as the proxy for tax incentives for
foreign MNEs operating in Indonesia through FOICs to shift profits out of Indonesia.
Based on the findings from prior studies, and following the suggestion that
developing countries also suffer from the BEPS strategy (e.g. Crivelli, et al., 2015;
OECD, 2013b), FOICs are therefore predicted to shift profits from Indonesia to their
parent’s country when the parent country’s STR is lower than the Indonesian STR. Table
4.1 presents the tax rates of Indonesia and three major source countries of investment,
namely, Singapore, Japan and South Korea for 2009–2015.
Table 4.1
Corporate Tax Rates of Indonesia, Singapore, Japan and Korea, 2009–2015
Country
Corporate Tax Rate (%)
2009 2010 2011 2012 2013 2014 2015
Indonesia 28 25 25 25 25 25 25
Japan 40.69 40.69 40.69 38.01 38.01 35.64 33.06
Korea 24.2 24.2 22 24.2 24.2 24.2 24.2
Singapore 18 17 17 17 17 17 17
Japan and Singapore are two main origin countries of inflow FDI to Indonesia
(Bank Indonesia, 2016). The two countries and South Korea head the list of parent
countries in the sample used in this study. During 2009–2015, the Indonesian STR
decreased from 28% in 2009 to 25% in 2010 and remained unchanged until 2015. During

100
the same period, corporate tax rates ranged from 33.06% to 40.69% in Japan (i.e.,
consistently significantly higher than the STR of Indonesia), 22%–24.2% in South Korea
(i.e., consistently similar to the STR of Indonesia) and 17%–18% in Singapore (i.e.,
consistently lower than the STR of Indonesia). Consequently, it is predicted that
Japanese-owned Indonesian companies do not have incentives to shift profits, Korean-
owned Indonesian companies have weak incentives to shift profits and Singaporean-
owned Indonesian companies have strong incentives to shift profits out of Indonesia.
As mentioned in Section 1.1 and briefly discussed in Section 3.1.1, cross-border
profit shifting is a book-tax conforming tax avoidance strategy that reduces TI and AP
simultaneously. Therefore, profit in this study is represented by two measurements. In
addition to TI as the main measurement of profit based on tax law reported by FOICs in
their Indonesian tax returns, this thesis uses accounting profit before tax based on
financial reporting standards (AP), which is also reported by FOICs in their Indonesian
tax returns. If FOICs shift profits out of Indonesia to low tax countries, there should be a
significantly positive relation between the tax rate difference and the two profit
measurements reported by FOICs to the Indonesian tax authority. That is, the lower the
corporate tax rate of the parent’s country, the lower the TI and AP reported by the FOIC
in its Indonesian tax return. This prediction leads to the following two hypotheses, which
are stated in the alternative form:
H1: TI reported by FOICs is positively related to STR differences between the residence
countries of the parents and Indonesia (STRParent − STRIndonesia) after controlling for
firm size, maturity and industry.
H2: AP reported by FOICs is positively related to STR differences between the
residence countries of the parents and Indonesia (STRParent − STRIndonesia) after
controlling for firm size, maturity and industry.

101
4.3 Research Design
4.3.1 Sample Selection and Period of Study
The final sample consists of FOICs registered in tax offices in Indonesia—most of
them (72.62%) are registered in tax offices on the island of Java. All data are based on
the Indonesian annual tax returns (Form 1771) reported by FOICs to the DGT and are
confidential under the Indonesian tax law. The data were obtained under a data
nondisclosure agreement. Firms are anonymised for privacy protection.
The period of the study is 2009–2015. There are two important reasons for starting
the study from 2009. First, as discussed in Chapter 2, the DGT started a tax administrative
reform, better known as ‘modernisasi’ (modernisation) in Indonesia in July 2002. The
reform was aimed at ‘promoting voluntary compliance among taxpayers, enhancing the
efficiency of administration and restoring taxpayers’ trust in the tax administration
system’ (OECD, 2010, pp. 42–43). The reform was completed at the end of 2008. The
DGT claimed that the tax administration reform had equipped its tax office units
nationwide with ‘more efficient, simplified and transparent business process, more
advanced system and information technology, better human resources, improved good
governance and more efficient structure of organisation’ (DGT, 2009, p. 38). That is,
since 2009, the recording of tax return data has been more accurate, which in turn provides
a more reliable database for research purposes. Second, according to De Boyrie, Pak, and
Zdanowicz (2005), factors such as inflation, risk of default obligation, political risk and
stability can erode a country’s tax base by means of capital flight. Indonesia managed to
control these aspects during 2009–2015. The reason for ending the period of study in
2015 is simply because that is the latest year for which data are available from the DGT
when this study is conducted.
Table 4.2 shows how the final sample of firm-year observations is derived.

102
Table 4.2
Derivation of the Final Sample of Firm-year Observations—Study 1
TI AP
Number of firm-years between 2009–2015 for which the
dependent variable can be calculated
11,281
11,281
Less:
Number of firm-years with TI or AP less than zero
3,351
4,514
Number of firm-years with TI/S or AP/S greater than one 1,957 1,393
Number of firm-years with missing industry group 24 18
Final sample of firm-year observations 5,949 5,356
The distribution of countries in which the parents of FOICs are located can be found
in Appendix 3. As part of the sample selection procedure, this study eliminates FOICs
that reported losses in their tax return (i.e., if TI divided by total sales, TI/S, is less than
zero or if AP divided by total sales, AP/S, is less than zero). The main reason is that this
study aims to identify profit shifting activities by FOICs, and FOICs will not have profits
to shift if they do not make profits. Although in some cases the losses reported in tax
returns may be the result of profit shifting activities, it is impossible to distinguish
artificial losses resulting from BEPS activities from genuine losses. Therefore, all
observations with losses are excluded from the sample.64 Observations with TI or AP
greater than sales (TI/S > 1 or AP/S > 1) are excluded because it is likely that either the
sales figures are erroneous, or the profit includes a gain from the sale of a business or a
64 For different reasons, some previous studies exclude observations with losses from their final samples.
For example, Mills and Newberry (2004, p. 96) exclude MNEs with losses from their sample because the
losses ‘drive the average effective tax rate above 100 percent’.

103
major capital asset and the proceeds are not included in the sales revenue (including these
extreme values would distort the regression results).
There are 659 and 1,022 observations in the final sample of TI and AP, respectively,
that use US dollar (USD) instead of Indonesian Rupiah (IDR) as the reporting currency
in their Indonesian tax returns. For consistency, all values with USD are converted to IDR
using the exchange rates for tax purposes set by the Indonesian finance minister’s decrees.
Appendix 4 shows the exchange rates and the corresponding finance minister’s decree
numbers.
4.3.2 Measurement of Variables and Regression Model
The key dependent variable is TI, which is reported by FOICs in their Indonesian
tax returns, deflated by sales (TI/S). TI is a key feature of tax returns that may not be
found in financial statements. Income tax liability is calculated based on TI (i.e., income
tax liability = TI × CIT rate). Therefore, if companies want to avoid income tax, they need
to supress the TI reported on their tax returns. In most cases, TI reported by FOICs in
their tax returns is different from the AP they report in their income statements because
of some adjustments required by ITL. In short, TI is AP plus positive adjustments minus
negative adjustments.65 Company taxpayers report both AP and TI in their tax returns.
Therefore, in addition to the key dependent variable TI/S, this thesis also uses AP scaled
by sales (AP/S) as a dependent variable to find further evidence regarding whether FOICs
successfully shift profits out of Indonesia. Nonetheless, this thesis does not discuss AP/S
model in detail as TI/S model to avoid duplication.
The independent variable is the tax rate difference (TRdiff) measured by the
difference between the STR of the parent’s country of an FOIC and the Indonesia STR.
65 See Appendix 1, 1771—Corporate Annual Income Tax Return: Attachment I for the details of positive
and negative adjustments according to ITL.

104
Focusing on the tax rate difference between the parent’s country and Indonesia can
address potential confounding effects of STR (Dharmapala & Riedel, 2013).66 TRdiff is
expected to capture the incentives for FOICs to shift profits out of Indonesia by means of
several profit shifting channels, such as intra-group transfer pricing for goods and
services, including licence fees for the use of intangible assets and management fees, and
debt financing.67 The STRs for different parent countries over the study period can be
found in Appendix 5. Consistent with hypothesis H1 that FOICs shift profits to lower tax
countries, the sign of the regression coefficient for TRdiff is predicted to be positive.
Four control variables are used in this study. First, total sales are used to proxy for
the size of firms. Total sales are in a natural logarithmic form (lnSales) to transform a
most likely skewed variable—total sales—into a more approximately normal variable.
An advantage of using sales rather than assets as a proxy for the size of firms is that sales
might capture the size of firms better than assets when there are companies that have large
sales but only a small quantity of assets. Given the inconsistent findings in the literature,
following prior studies (e.g. Mills & Newberry, 2004), no sign is predicted for lnSales.
Second, Age is used as a proxy for maturity of firms and is the number of years
between an FOIC registering with a tax office and lodging its tax return. Prior studies
(e.g. Mills & Newberry, 2004; Grubert, 1998) provide evidence of the so-called
maturation effect, which theorises that mature companies report higher levels of income.
Accordingly, the relation between profit (TI/S or AP/S) and Age is predicted to be positive.
66 Dharmapala and Riedel (2013, pp. 95-96) explain that: ‘While statutory corporate tax rate changes are
likely to be exogenous with respect to firms' behaviour, interpreting the estimated effect of corporate tax
rate changes may not be straightforward for a number of reasons. Corporate tax rate changes impose a
common shock to all firms in a country, and so may potentially be correlated with unobserved variables
that also determine the profitability, transfer prices, and financing choices of MNEs. In addition, changes
in the corporate tax rate may not only affect the MNE's incentive to engage in profit shifting, but may also
affect other decision margins. A rise in the corporate tax rate may, for example, dampen incentives to exert
effort and consequently lower corporate profitability’. 67 Chapter 6 of this thesis focuses on the channels used by FOICs to shift profits out of Indonesia.
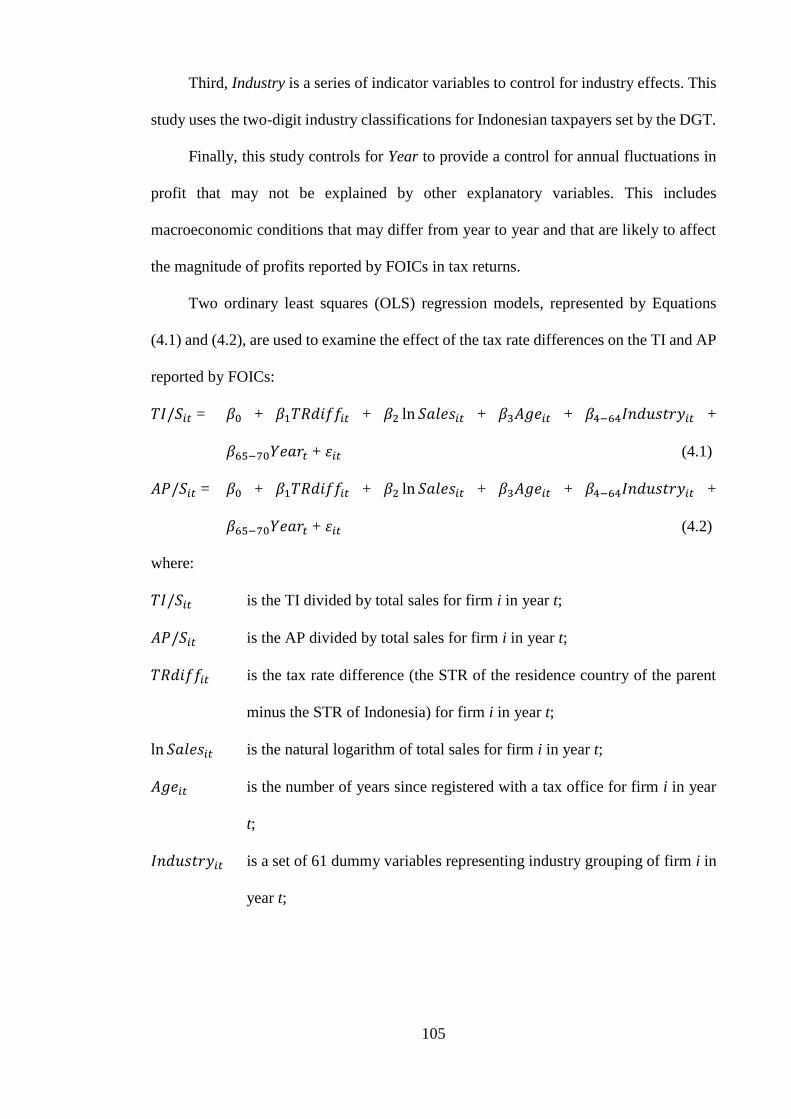
105
Third, Industry is a series of indicator variables to control for industry effects. This
study uses the two-digit industry classifications for Indonesian taxpayers set by the DGT.
Finally, this study controls for Year to provide a control for annual fluctuations in
profit that may not be explained by other explanatory variables. This includes
macroeconomic conditions that may differ from year to year and that are likely to affect
the magnitude of profits reported by FOICs in tax returns.
Two ordinary least squares (OLS) regression models, represented by Equations
(4.1) and (4.2), are used to examine the effect of the tax rate differences on the TI and AP
reported by FOICs:
𝑇𝐼/𝑆𝑖𝑡 = 𝛽0 + 𝛽1𝑇𝑅𝑑𝑖𝑓𝑓𝑖𝑡 + 𝛽2 ln 𝑆𝑎𝑙𝑒𝑠𝑖𝑡 + 𝛽3𝐴𝑔𝑒𝑖𝑡 + 𝛽4−64𝐼𝑛𝑑𝑢𝑠𝑡𝑟𝑦𝑖𝑡 +
𝛽65−70𝑌𝑒𝑎𝑟𝑡 + 𝜀𝑖𝑡 (4.1)
𝐴𝑃/𝑆𝑖𝑡 = 𝛽0 + 𝛽1𝑇𝑅𝑑𝑖𝑓𝑓𝑖𝑡 + 𝛽2 ln 𝑆𝑎𝑙𝑒𝑠𝑖𝑡 + 𝛽3𝐴𝑔𝑒𝑖𝑡 + 𝛽4−64𝐼𝑛𝑑𝑢𝑠𝑡𝑟𝑦𝑖𝑡 +
𝛽65−70𝑌𝑒𝑎𝑟𝑡 + 𝜀𝑖𝑡 (4.2)
where:
𝑇𝐼/𝑆𝑖𝑡 is the TI divided by total sales for firm i in year t;
𝐴𝑃/𝑆𝑖𝑡 is the AP divided by total sales for firm i in year t;
𝑇𝑅𝑑𝑖𝑓𝑓𝑖𝑡 is the tax rate difference (the STR of the residence country of the parent
minus the STR of Indonesia) for firm i in year t;
ln 𝑆𝑎𝑙𝑒𝑠𝑖𝑡 is the natural logarithm of total sales for firm i in year t;
𝐴𝑔𝑒𝑖𝑡 is the number of years since registered with a tax office for firm i in year
t;
𝐼𝑛𝑑𝑢𝑠𝑡𝑟𝑦𝑖𝑡 is a set of 61 dummy variables representing industry grouping of firm i in
year t;

106
𝑌𝑒𝑎𝑟𝑡 is a set of six dummy variables that is expected to account for annual
fluctuations in TI/S or AP/S (the dependent variable) that were not caused
by TRdiff (the independent variable) or any of the control variables;
𝜀𝑖𝑡 is the error term.
4.4 Empirical Results
4.4.1 Summary Statistics
Descriptive statistics on the key variables are provided in Table 4.3. Panel A of
Table 4.3 shows that the mean of TI/S is 0.085, indicating that, on average, FOICs in the
sample reported TI of 8.5% of their sales. The mean of TRdiff is 0.013, indicating that, on
average, the tax rate in the parent’s country is 1.3 percentage points higher than that of
Indonesia. The distribution of the final sample by industry groups for the TI/S regression
model can be found in Appendix 6.
Panel B of Table 4.3 shows that AP/S has a mean of 0.109, indicating that, on
average, FOICs in the sample reported AP of nearly 11% of their sales, which is
2.4 percentage points higher than TI/S. Similar to the TI/S regression model, the mean of
TRdiff is 0.015, indicating that, on average, the tax rate in the parent’s country is
1.5 percentage points higher than that of Indonesia.

107
Table 4.3
Descriptive Statistics—Study 1
A. TI
Variable No. Mean Median
Standard
Deviation Minimum Maximum
TI/S 5,949 0.085 0.050 0.107 0 1
TRdiff 5,949 0.013 0 0.090 −0.28 0.3
lnSales 5,949 24.431 24.732 2.571 13.479 31.9
Age 5,949 10.275 8 8.645 0 40
Notes: TI/S is taxable income (before loss carried forward) deflated by sales reported in Indonesian tax
returns (TI and sales are obtained from Indonesian tax return 1771 Sections A1 and I1a, respectively).
TRdiff is the tax rate difference between the FOIC parent country’s STR and Indonesia’s STR (e.g., for
Company A, whose parent’s country is located in Singapore, the TRdiff in 2009 is 18% − 28% = −10%).
See Appendix 5 for the STRs of countries over the study period. lnSales is the natural log of sales. Age
measures the maturity of the FOIC. It is obtained by subtracting the year in which the FOIC was
incorporated and registered with a tax office in Indonesia from the year of observation.
B. AP
Variable No. Mean Median
Standard
Deviation Minimum Maximum
AP/S 5,356 0.109 0.067 0.134 0 1
TRdiff 5,356 0.015 0 0.092 −0.28 0.3
lnSales 5,356 24.806 25.071 2.365 14.576 31.9
Age 5,356 11.036 9 8.752 0 40
Notes: AP/S is the pre-tax accounting profit reported by FOICs in their Indonesian tax returns (total of
commercial net income in the Indonesian tax return 1771-I Section 3 plus Income tax in the Indonesian tax
return 1771-I Section 5f) deflated by sales. See Panel A for definitions of other variables.
Overall, the summary statistics show that, on average, FOICs report higher AP than
TI in their Indonesian tax returns. This seems to be plausible given (a) book-tax
differences and (b) that the average parent’s tax rate in the AP/S regression model is

108
slightly higher than that in the TI/S regression model. The distribution of the final sample
by industry groups for the AP/S regression model is similar to that for the TI/S regression
model in Appendix 6, so it is not separately tabulated.
Table 4.4 presents the Pearson correlation between variables.
Table 4.4
Pearson Correlation Matrix—Study 1
A. TI
TI/S TRdiff lnSales Age
TI/S 1
TRdiff 0.0955 *** 1
lnSales 0.1032 *** 0.1248 *** 1
Age 0.1207 *** 0.1432 *** 0.5854 *** 1
B. AP
AP/S TRdiff lnSales Age
AP/S 1
TRdiff 0.0443 *** 1
lnSales −0.1151 *** 0.1141 *** 1
Age 0.0025 0.1425 *** 0.5640 *** 1
Note: *, ** and *** indicate significance at the 1%, 5% and 10% levels in a two-tailed test, respectively.
As shown in Panel A, the tax rate difference between the FOIC’s parent’s country
and Indonesia (TRdiff) is positively correlated with TI/S reported by FOICs in their tax
returns and is significant at the 1% level. The Pearson correlation also indicates a
significant positive association between FOICs’ maturity (Age) and TI/S, consistent with
the prediction.

109
Panel B shows that TRdiff is positively correlated with AP/S reported by FOICs in
their Indonesian tax returns and is significant at the 1% level. However, unlike with TI,
lnSales is negatively correlated with AP. In addition, Age is not significantly correlated
with AP.
To examine whether there is a harmful correlation between independent variables,
this study conducts a test of collinearity. Perfect multicollinearity occurs when one of the
regressors is a perfect linear function of another regressor. This makes it impossible to
compute the OLS estimator. In an OLS regression analysis, the level of multicollinearity
can be quantified by the variance inflation factor (VIF). Basically, it is an index that shows
how collinearity increases the variance of an estimated regression coefficient. The general
rule is that a VIF of greater than 10 indicates that the variable is a linear combination of
other independent variables. As shown in Appendix 7, the VIFs are in the range of 1.17–
5.66 and 1.18–4.79 for TI/S and AP/S regression models, respectively, which is lower
than the general tolerance value of 10, indicating that both regression models are not
adversely affected by multicollinearity.
4.4.2 Regression Results
Regression analyses in this study are analyses of pooled cross-sectional data. Panel
data analyses such as fixed-effects models are not used for the following reasons. First,
the data in this study are unbalanced panel data, as reported in Appendix 9,68 and the
missing years in the dataset result from losses reported by companies, so the missing years
are more systemic than random. Second, and more importantly, the statutory tax rates of
most parents’ countries did not vary over the study period (see Appendix 5). This means
that the within-firm variation in TRdiff, which is the key explanatory variable, is mostly
68 Appendix 9 reports only the unbalanced panel data for the TI/S regression model because the unbalanced
panel data for the AP/S regression shows a similar pattern.

110
zero. As the fixed-effects estimator requires a within-firm variation of the independent
variable, which is absent in this study, fixed-effects models are not appropriate.
Unlike cross-sectional data,69 regression models that use pooled cross-sectional
data may violate the independent error assumption of the OLS regression. To adjust for
the potential correlation of errors within clusters of data (firms), this study runs
regressions by clustering the errors by firm for both TI/S and AP/S models.70 Table 4.5
presents the results of the regressions with cluster-robust standard errors.
The tax rate difference between the parent’s country and Indonesia is found to be
positively associated with the level of TI/S and AP/S reported by FOICs. The findings
support hypotheses H1 and H2. The estimates of the coefficient for TRdiff are 0.099 and
0.087 for the TI and AP models, respectively, and both are significant at the 1% level.
Thus, a parent’s STR that is one percentage point lower than the Indonesian tax rate is
associated with a nearly 0.1 (0.09) percentage point decrease in the TI (AP) to sales ratio
reported by FOICs in their Indonesian tax returns. These results provide evidence
consistent with FOICs shifting profit out of Indonesia to low-tax countries.
The coefficient of lnSales is insignificant in the TI model, suggesting that firm size
does not affect the magnitude of TI reported by the company. The coefficient of lnSales
is negatively significant at the 1% level in the AP model, suggesting that the larger the
firm size, the lower the AP as a ratio of sales that the company reports.
The coefficients of Age are positively significant at the 5% level in both models,
suggesting that the more mature the company, the higher TI/S and AP/S they report.
69 Cross-sectional data is defined as data consisting of different entities in a single period. 70 This thesis uses STATA14 as the statistical data analysis software. In STATA, the standard error
estimates are robust to disturbance being heteroscedastic and autocorrelated when the option ‘cluster ()’ is
used (Hoechle, 2007).

111
Table 4.5
Regression Results—Effect of Tax Rate Differences on Profit Reported by FOICs
in Indonesian Tax Return—Using Clustered Standard Errors
𝑇𝐼/𝑆𝑖𝑡 or 𝐴𝑃/𝑆𝑖𝑡 = 𝛽0 + 𝛽1𝑇𝑅𝑑𝑖𝑓𝑓𝑖𝑡 + 𝛽2 ln 𝑆𝑎𝑙𝑒𝑠𝑖𝑡 + 𝛽3𝐴𝑔𝑒𝑖𝑡 + 𝛽4−64𝐼𝑛𝑑𝑢𝑠𝑡𝑟𝑦𝑖𝑡 + 𝛽65−70𝑌𝑒𝑎𝑟𝑡 + 𝜀𝑖𝑡
Expected
sign
Dependent variable:
TI/S
Dependent variable:
AP/S
TRdiff
+ 0.099
(3.57)
*** 0.087
(2.67)
***
lnSales
? 0.002
(1.39)
−0.010
(−3.50)
***
Age
+ 0.001
(2.23)
** 0.001
(2.36)
**
Industry#
?
Year
2010 ? −0.009
(−2.24)
** −0.008
(−1.81)
*
2011 ? −0.013
(−3.33)
*** −0.013
(−2.81)
***
2012 ? −0.011
(−2.53)
** −0.013
(−2.48)
**
2013 ? −0.016
(−3.47)
*** −0.000
(−0.07)
2014 ? −0.033
(−7.23)
*** 0.005
(0.82)
2015 ? −0.043
(−9.25)
*** −0.003
(−0.40)
Constant 0.062
(1.93)
0.350
(4.74)
R² 0.153 0.156
n 5,949 5,356
Notes: t-statistics appear in parentheses. *, ** and *** indicate significance at the 1%, 5% and 10% levels
in a two-tailed test, respectively. See Table 4.3 for variables definitions.
# Regression result for Industry for the TI/S regression is presented in Appendix 8.
The regression results for the industry indicators can be found in Appendix 8. There
are 62 industry groups in the final sample. Industry group 10 (food manufacturing
industry) is the base industry. Of the 61 industry groups represented by indicators or

112
dummy variables, there are 17 and 13 industry groups with significantly negative and
positive coefficients, respectively. The coefficients of the remaining 31 industry groups
are insignificantly different from zero.
In the regression models, 2009 is used as the base year to compare with other years.
The coefficients for Year from 2010 to 2015 are negative and significant at the 1% and
5% levels, suggesting that FOICs reported a lower TI/S ratio during 2010–2015 than what
they reported in 2009, and the magnitude of the gaps between 2009 and later years shows
an increasing trend. The coefficients for Year in the AP model are mostly insignificant
and do not show similar patterns.
As mentioned in Section 4.3.2, Year is expected to control for annual fluctuations
in profit that may not be explained by any of the explanatory variables other than Year,
including macroeconomic conditions that may differ from year to year. Figure 4.1 shows
that Indonesian GDP was consistently increasing at a double-digit rate during the period
2009–2015. The increasing trend of GDP cannot explain the decreasing trend of TI
reported by FOICs in the same period.
Further, as explained in Chapter 2, there have been no significant changes in the
Indonesian tax system since the DGT completed the tax administration reform in 2008.
Therefore, changes in the tax system also cannot explain the decreasing trend in the
magnitude of TI reported by FOICs during 2010–2015 compared with the base year of
2009.
As shown in Figure 2.4 (Chapter 2, p.40), the contribution of CIT revenue to the
total tax revenue collected by DGT decreased from 22.09% in 2009 to 15.1% in 2014.
The decreasing trend of CIT revenue contribution is consistent with FOICs reported lower
and lower TI/S in 2010–2015 compared with 2009, and may indicate a general rise in tax
avoidance and/or tax evasion in the Indonesian corporate sector during this period.

113
Figure 4.1
Indonesian GDP at Current Prices, 2009–2015
Source: Key Statistics, 2007–2016 (Badan Pusat Statistik, 2017b)
As foreign MNEs can legally avoid Indonesian CIT by shifting profits, it is less
likely that they engage in illegal tax evasion activities. A rise in tax avoidance by FOICs
as indicated by the coefficients of the year dummies means that foreign MNEs might
expand their profit shifting activities in Indonesia during the study period. As a member
of the G20 countries, Indonesia took part in the OECD/G20 BEPS project. However, up
to 2015, the Indonesian government did not take sufficient effective action to fight BEPS,
so FOICs might increase their profit shifting activities as a result.
4.4.3 Further Analyses
The descriptive statistics of the main variables presented in Table 4.3 indicate that
the distributions of the dependent variables (TI/S or AP/S) are likely skewed. To address
this issue, the dependent variables are log-transformed. Table 4.6 shows the descriptive
statistics of the main variables after the log-transformation procedure.
5,606
6,864 7,832
8,616 9,546
10,570 11,532
0
2,000
4,000
6,000
8,000
10,000
12,000
2009 2010 2011 2012 2013 2014 2015
GDP (in trillion Rupiah)

114
Table 4.6
Descriptive Statistics After Log-transforming the Dependent Variable
A. TI
Variable No. Mean Median
Standard
Deviation Minimum Maximum
lnTI/S 5,007 −2.9 −2.707 1.37 −21.154 0
TRdiff 5,007 0.015 0 0.093 −0.28 0.3
lnSales 5,007 24.942 25.158 2.25 14.576 31.9
Age 5,007 11.363 9 8.602 0 40
B. AP
Variable No. Mean Median
Standard
Deviation Minimum Maximum
lnAP/S 5,347 −2.851 −2.696 1.276 −11.004 0
TRdiff 5, 347 0.015 0 0.092 −0.28 0.3
lnSales 5, 347 24.814 25.077 2.358 14.576 31.9
Age 5, 347 11.05 9 8.753 0 40
Note: lnTI/S is the natural log of TI/S. lnAP/S is the natural log of AP/S. See Table 4.3 for definitions of
other variables.
The difference between the means and medians is now much smaller than before,
indicating that the dependent variables are more normally distributed. The number of final
samples is further reduced because of firms that have zero dependent variables (942 and
nine for TI/S and AP/S, respectively). The results after log-transforming the dependent
variables (and clustering the errors by firm) are shown in Table 4.7.
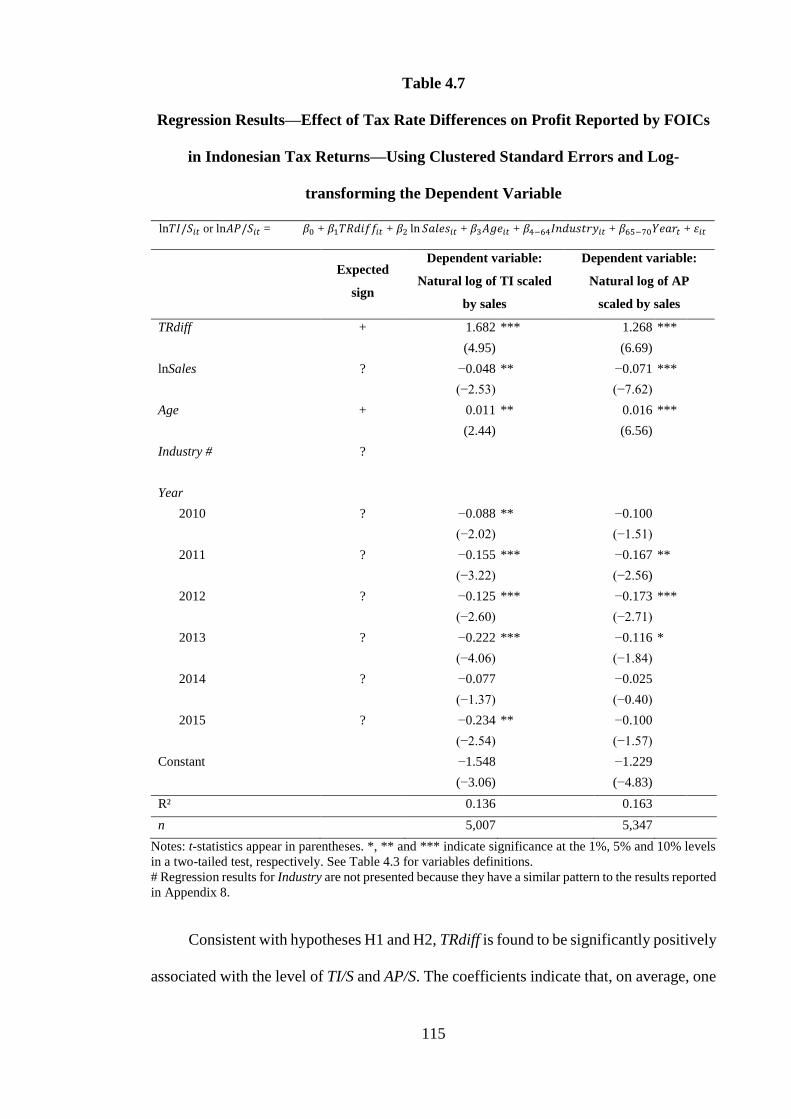
115
Table 4.7
Regression Results—Effect of Tax Rate Differences on Profit Reported by FOICs
in Indonesian Tax Returns—Using Clustered Standard Errors and Log-
transforming the Dependent Variable
ln𝑇𝐼/𝑆𝑖𝑡 or ln𝐴𝑃/𝑆𝑖𝑡 = 𝛽0 + 𝛽1𝑇𝑅𝑑𝑖𝑓𝑓𝑖𝑡 + 𝛽2 ln 𝑆𝑎𝑙𝑒𝑠𝑖𝑡 + 𝛽3𝐴𝑔𝑒𝑖𝑡 + 𝛽4−64𝐼𝑛𝑑𝑢𝑠𝑡𝑟𝑦𝑖𝑡 + 𝛽65−70𝑌𝑒𝑎𝑟𝑡 + 𝜀𝑖𝑡
Expected
sign
Dependent variable:
Natural log of TI scaled
by sales
Dependent variable:
Natural log of AP
scaled by sales
TRdiff
+ 1.682
(4.95)
*** 1.268
(6.69)
***
lnSales
? −0.048
(−2.53)
** −0.071
(−7.62)
***
Age
+ 0.011
(2.44)
** 0.016
(6.56)
***
Industry #
?
Year
2010 ? −0.088
(−2.02)
** −0.100
(−1.51)
2011 ? −0.155
(−3.22)
*** −0.167
(−2.56)
**
2012 ? −0.125
(−2.60)
*** −0.173
(−2.71)
***
2013 ? −0.222
(−4.06)
*** −0.116
(−1.84)
*
2014 ? −0.077
(−1.37)
−0.025
(−0.40)
2015 ? −0.234
(−2.54)
** −0.100
(−1.57)
Constant −1.548
(−3.06)
−1.229
(−4.83)
R² 0.136 0.163
n 5,007 5,347
Notes: t-statistics appear in parentheses. *, ** and *** indicate significance at the 1%, 5% and 10% levels
in a two-tailed test, respectively. See Table 4.3 for variables definitions.
# Regression results for Industry are not presented because they have a similar pattern to the results reported
in Appendix 8.
Consistent with hypotheses H1 and H2, TRdiff is found to be significantly positively
associated with the level of TI/S and AP/S. The coefficients indicate that, on average, one

116
percentage point lower tax rate of the parent’s country relative to Indonesia is associated
with a 1.68% (1.27%) decrease in the TI (AP) scaled by sales reported by FOICs. This
result is consistent with the findings reported in Table 4.5.
The coefficients of lnsales are now negative in both models and significant at the
5% and 1% levels for TI and AP models, respectively. The coefficients of Age remain
positive and are significant at the 5% level in the TI model but are now significant at the
1% level for the AP model.
The coefficients for the Year dummy variables in the TI model are similar to those
before log-transforming TI/S, except in 2014. For 2014, the coefficient of Year is negative
but insignificant. The results suggest that FOICs report a lower TI/S ratio for most later
years compared with 2009 (the base year). Similarly to the results reported in Table 4.5,
the magnitudes of the gaps between 2009 and later years show an increasing trend.
Another test of collinearity is conducted to detect whether, after log-transforming
the dependent variables and clustering the standard errors, the regression models contain
any significant collinearity among the regressors. The results of the test (as shown in
Appendix 7) indicate no harmful collinearity.
4.5 Chapter Summary
Developing countries heavily rely on revenue from CIT. Therefore, developing
countries will be hit more severely than developed countries if MNEs shift profits out of
the country. Prior studies and international organisations suggest that developing
countries also suffer from profit shifting strategies by MNEs. However, these studies base
their suggestions on observations rather than analysing data that are directly collected
from the developing countries. In short, few empirical studies have investigated the

117
presence of cross-border profit shifting in developing countries using data collected from
developing countries—particularly tax return data.
This study fills the gap in the literature by providing empirical evidence of cross-
border profit shifting from the perspective of a developing country. It uses confidential
Indonesian tax return data of FOICs during 2009–2015 to investigate the relation between
tax rate difference (i.e., FOIC’s parent country’s STR – Indonesian STR) and TI/S (AP/S)
reported by Indonesian affiliates of foreign MNEs. If the relation is found to be positive,
that is, a negative tax rate difference (i.e., when the corporate tax rate of the parent’s
country is lower than the Indonesian corporate tax rate) is associated with lower TI and
AP reported by FOICs, then the evidence is consistent with cross-border profit shifting
by MNEs out of Indonesia.
After controlling for the size of firms, the age of firms, industry groups and years,
the regression results show that the relation between profit and tax rate difference is strong
and positive, providing evidence consistent with BEPS occurring in Indonesia. FOICs are
likely to shift profits out of Indonesia when the tax rates in the parent’s country are lower
than the tax rate in Indonesia.
The regression results for the Year dummy variables are consistent with the
decreasing trend of CIT revenue contribution to total tax revenue and suggest an increase
in the level of tax avoidance and/or tax evasion in the corporate sector in general. FOICs
might have increased profit shifting from Indonesia because of the lack of regulations and
resources to tackle BEPS in Indonesia even though the BEPS program was introduced in
2013 by the OECD and the G20. Log-transforming the independent variables prove that
the results of the OLS estimates are robust.
Overall, the results of Study 1 of this thesis indicate the presence of cross-border
profit shifting in Indonesia. Arguably, this is the first study that focuses on profit shifting

118
from a developing country using tax return data. Therefore, further studies are needed to
test the robustness of the evidence provided in this chapter. Chapter 5 further examines
the existence of profit shifting in Indonesia by adopting the HRA, which is a widely
accepted approach for detecting the occurrence of cross-border profit shifting.

119
CHAPTER 5:
DETECTING PROFIT SHIFTING IN INDONESIA USING
THE HINES AND RICE APPROACH
5.1 Introduction
The incidence of profit shifting by MNEs in developed countries has been
confirmed by many empirical studies over several decades. In contrast, similar studies
that focus on developing countries have only emerged in the past few years. Fuest and
Riedel (2012) argue that the reason why knowledge on profit shifting in developing
countries is limited is because the data and method used to measure profit shifting are not
reliable.
This chapter extends Chapter 4 and investigates whether FOICs shift profits out of
Indonesia using the HRA, which is an approach introduced by Hines and Rice (1994)
with some modifications. Hines and Rice (1994) pioneer study on profit shifting by MNEs
‘established a conceptual framework that continues to be highly influential’ (Dharmapala,
2014a, p. 424).71 Dowd, Landefeld, and Moore (2017) suggest that the HRA has become
a standard in the literature.
As in Chapter 4, this chapter measures profit in two ways: (1) TI based on tax law
and (2) AP based on financial reporting rules. However, unlike Chapter 4, this chapter
reports AP first because the study in this chapter adopts Hines and Rice (1994), which
uses AP as the dependent variable. However, both AP and TI will be discussed equally
given that TI is the key feature in this thesis because it directly reflects the loss of tax
revenue (CIT is based on TI).
71 As reviewed in Chapter 3, Grubert and Mutti (1991) also published a widely cited study.

120
Despite the fact that the results in studies that adopt the HRA vary, they are
consistent with the hypothesis that there is a negative relation between the level of CIT
rates in the host countries and the magnitude of profits reported by MNEs in different
host countries. However, few studies have adopted the HRA to measure the extent to
which the tax rate of the parent’s country of a foreign-owned company operating in a
developing country influences the profits reported by the foreign-owned company. This
study is one of the early studies that uses the HRA to examine the existence of profit
shifting by MNEs in a developing country using tax return data.
The rest of this chapter is organised as follows. The next section briefly describes
the HRA, reviews some prior studies that use the HRA and develops the hypothesis to be
tested in this study. Section 5.3 describes the research design of the study. Section 5.4
reports the empirical results. Section 5.5 summarises the chapter.
5.2 Literature Review and Hypothesis Development
5.2.1 Hines and Rice’s Approach to Detecting Cross-border Profit Shifting
According to the basic tax competition model, governments commit to a tax system
and capital owners choose where to invest their capital (Wilson, 1999). However, once
location decisions are made, firms or capital become partially immobile. Some firms may
leave a region after the initial tax break has expired and choose to seek tax breaks in other
regions (Wilson, 1999). From an international tax avoidance perspective, moving to other
regions may not be necessary if MNEs have an opportunity to reallocate TI from countries
with high tax rates to countries with low tax rates (Hines Jr, 1999). This international tax
avoidance strategy is known as profit shifting.
In their seminal paper, Hines and Rice (1994) develop an economic approach to
investigate the effect of tax rate variation on profits reported by MNEs. As Dharmapala

121
(2014a) explains, the basic premise of the HRA is that pre-tax income consists of two
elements: (1) ‘true’ income (i.e., income produced using capital and labour inputs); and
(2) ‘shifted’ income (i.e., income shifted across borders because of a tax incentive in the
form of a tax rate difference between the parent and the affiliate). Equation (5.1)
represents the original HRA:
log𝜋𝑖 = 𝛽0 + 𝛽1𝜏𝑖 + 𝛽2 log 𝐾𝑖 + 𝛽3log𝐿𝑖 + 𝛽4log𝐴 + 𝜀𝑖 (5.1)
where:
log𝜋𝑖 the dependent variable, is the logarithm of the pre-tax income of all US MNEs’
foreign affiliates in host country i calculated based on confidential US Department
of Commerce survey data;
𝜏𝑖 the independent variable, is the average tax rate in host country i; the HRA bases
the average tax rate on the effective tax rate or the statutory tax rate whichever is
lower. The effective tax rate is CIT paid by all US affiliates in the local country i
divided by their total net income before tax;
𝐾𝑖 is the capital input in host country i;
𝐿𝑖 is the labour input in host country i;
A is the level of productivity in host country i (proxied by income per capita);
𝜀𝑖 is the error term.
Using country-level aggregate data on US-owned MNE affiliates operating in 59
countries in 1982, Hines and Rice (1994) use Equation (5.1) to estimate the effect of tax
rate variation in the host countries on the reported profits by MNEs in those countries. In
calculating 𝐾𝑖, the HRA includes real/economic capital and excludes financial capital.
For 𝜋𝑖, the HRA removes financial earnings (i.e., interest received and interest paid) from
reported profits because available financial data are not as reliable or as comprehensive
as the data used to estimate 𝐾𝑖 (Hines & Rice, 1994, p. 161). Hines and Rice (1994) find

122
a negative effect of tax rates of host countries on measures of the profitability of US
MNEs’ affiliates. The effect is considerably large—that is, a tax rate in a host country
that is one percentage point higher is associated with a 2.83% reduction in the before-tax
profitability reported in that host country.
The HRA has been widely adopted by numerous subsequent studies that examine
the existence of profit shifting activities by MNEs. Despite the results showing some
deviations from the original study, the subsequent studies prove that the HRA is a
vigorous method for investigating how tax rate disparities can influence MNEs’
behaviour in reporting profits in different countries. Three studies that adopt the HRA are
reviewed below.
Swenson (2001) studies how import tariff variations across products give other
countries’ MNEs operating in the US an incentive to shift profits by means of transfer
pricing (i.e., by deliberately underpricing or overpricing affiliated firm transactions) over
the period 1981–1988. The source countries of the investments are Canada, France,
Germany, Japan and the UK. Swenson (2001) adopts some existing approaches—one of
which is the HRA—to build a model of transfer pricing incentives with some
modifications. While she finds significant evidence that the tariff variation creates
incentives for underpricing or overpricing affiliated firm transactions, she concludes that
the manipulation of product transfer prices is not the main channel used to shift profits.
Using micro-level data relating to the operations of Europe-based MNEs in many
European countries, Huizinga and Laeven (2008) adopt the HRA to investigate the
opportunities and incentives created by cross-border profit shifting. They find that the
effect of a tax rate variation of one percentage point higher on pre-tax profit is 1.08%,
which is much lower than the 2.83% obtained by Hines and Rice (1994). They argue that
the much higher percentage found by Hines and Rice (1994) is because they included

123
THCs outside Europe that presumably do not have effective cross-border profit shifting
regulations.
A recent study by Dowd, et al. (2017) not only adopts the HRA, but also states that
the semi-log specification introduced by Hines and Rice (1994) has become a standard in
the literature. Using a panel dataset of US tax returns, Dowd et al. (2017) scrutinise the
profit shifting behaviour of US MNEs over the period 2002–2012 and suggest the
consideration of a nonlinear relation between the tax rate and reported profits.
5.2.2 Empirical Evidence of Profit Shifting in Developing Countries and
Hypothesis
In contrast to the considerable empirical evidence available from developed
countries, there is limited empirical evidence from developing countries regarding the
extent to which multinational tax evasion and tax avoidance cause tax revenue losses
(Fuest & Riedel, 2009; Crivelli, et al., 2015). The limited empirical evidence of profit
shifting strategies used by MNEs in developing countries is extensively discussed by
Fuest and Riedel (2012), who review the literature on income shifting in developing
countries and conclude that while developing countries suffer from profit shifting
strategies, there is inadequate knowledge regarding the extent of the revenue losses. The
outcomes of most of the existing studies are difficult to interpret, mainly because of
problems regarding the reliability of the data and method used to measure income shifting
(Fuest & Riedel, 2012). This argument is reasonable given that the extant literature on
developing countries mostly consists of unrefereed reports that have not been exposed to
critical peer review (e.g. Christian Aid, 2009; Oxfam, 2000; Baker, 2005).72 In addition,
72 For example, Cobham (2005) estimates that developing countries lose USD50 billion per year because
the corporate sector shifts profits to lower-tax jurisdictions. However, as Fuest and Riedel (2009) suggest,
this claim is not based on rigorous empirical analysis. Cobham (2005) based his estimation on an Oxfam
(2000) report that contains several issues. A major drawback is that its estimation is based on an average

124
poor data availability—both in terms of quality and quantity—has led to limited empirical
research into profit shifting in developing countries (OECD, 2015a).
In the past few years, the number of empirical studies that focus on finding evidence
of profit shifting by MNEs in developing countries has increased. However, none of these
studies have adopted the HRA, despite the fact that the HRA has been identified as a
primary approach to the empirical estimation of cross-border profit shifting (Dharmapala,
2014a).
A study that includes developing countries in its analysis is that of Crivelli, et al.
(2015), who use panel data for 173 developed and developing countries to determine
whether profit shifting is an important issue for developing countries. The results of the
study suggest that profit shifting disadvantages developing countries at least as much as
it disadvantages developed countries. However, the authors acknowledge that the
conclusion may not be robust to some extent because there is scarce firm-level data for
developing countries. This suggests that recent research that focuses on developing
countries still encounters data-related issues.
Johannesen, Tørsløv, and Wier (2016) use a global dataset of 102 countries and find
that less developed economies are more sensitive to profit shifting by MNEs than more
developed economies. A brief summary is presented below of two recent studies that
attempt to find evidence of profit shifting by MNEs in a particular developing country.
Janský and Prats (2015) examine whether more than 1,500 MNEs operating in
India73 shifted profits in 2010 and find that MNEs associated with THCs reported lower
profits and paid less Indian income taxes than MNEs with no such association. The
corporate tax rate of 30%, while in fact many developing countries offer low or zero tax rates as incentives
for corporate investment (Fuest & Riedel, 2009). As Oxfam’s (2000) estimation ignores the incentives, its
claim on the magnitude of the tax losses due to profit shifting in developing countries is likely to be
overestimated (Fuest & Riedel, 2009). 73 According to the WB’s economy classifications (as explained in Section 3.1.1), similar to Indonesia,
India and Malaysia have consistently been categorised as developing countries.

125
authors conclude that MNEs have incentives to shift profits to THCs because of lower tax
rates and the secrecy provisions offered by those countries.
Using financial data for 100 Malaysian-listed corporations for 2009–2011, Salihu,
et al. (2015) examine the relationships between foreign investors’ interests and tax
avoidance by means of profit shifting in Malaysia. Using a generalised method of moment
(GMM) estimator, they demonstrate that the relationship between foreign investors’
interests and tax avoidance is significantly positive among large Malaysian corporations.
Despite differences in the quantity and quality of the evidence, the four studies
discussed above demonstrate that MNE affiliates operating in developing countries that
have a parent country with a lower tax rate tend to shift profits. This suggests that MNEs
in developing countries shift profits similarly to developed countries. Applying the
findings of the prior studies to the case of Indonesia, it is likely that FOICs with parents
located in countries with higher tax rates will report higher profits in their Indonesian tax
returns than FOICs that have parents located in countries with lower tax rates. This leads
to the following hypothesis stated in the alternative form:
H1: The parent’s tax rate of an FOIC is positively associated with the FOICs’ reported
AP in their Indonesian tax returns after controlling for capital and labour inputs.
As mentioned earlier, profit shifting is a book-tax conforming tax avoidance
strategy: profit shifting lowers AP as well as TI. Therefore, if FOICs report lower AP,
they should also report lower TI in their Indonesian tax returns. As in Study 1, profit in
this study is represented by both TI and AP. This leads to another hypothesis stated in the
alternative form:
H2: The parent’s tax rate of an FOIC is positively associated with the FOICs’ reported
TI in their Indonesian tax returns after controlling for capital and labour inputs.

126
5.3 Research Design
5.3.1 Sample Selection and Period of Study
This study uses a sample that includes all foreign-owned Indonesian companies
with tax return data supplied by the DGT under a data nondisclosure agreement. For
privacy protection, firms are anonymised. The study period covers the seven years from
2009 to 2015. The final sample consists of 3,361 (3,188) observations for the regression
model using AP (TI) as the dependent variable—most of which (about 73% for both
models) are registered in tax offices located on the island of Java. Table 5.1 presents the
final sample derivation for both dependent variables.
As in Study 1, Study 2 excludes FOICs that reported a loss in their tax returns.
Although losses reported in tax returns may have resulted from profit shifting activities,
it is impossible to distinguish a genuine business loss from a loss caused by profit shifting.
Moreover, it is a common practice in the literature to exclude loss-making firms from the
sample (Dharmapala, 2014a). There is a significant number of missing data (or zero) for
the calculations of the natural logarithm of capital and labour and, to a lesser extent, for
the calculations of the natural logarithm of the two profit measurements.
The reason for starting the study from 2009 is because the DGT’s data recording
and administration have been more reliable since 2009, after the completion of a thorough
tax administration reform in Indonesia in 2008 (DGT, 2009). The reason for ending the
period of study in 2015 is simply because that is the latest year for which data are available
from the DGT when this study is conducted. The distribution of countries in which the
parents of FOICs are located can be found in Appendix 10.

127
Table 5.1
Derivation of the Final Sample of Firm-Year Observations—Study 2
AP TI
Number of firm-years between 2009–2015 for which the
dependent variable is available
11,281
11,281
Less:
Number of firm-years that report loss (AP < 0 or TI < 0) 4,514 3,351
Number of firm-years of which natural log of capital
cannot be calculated (i.e., zero or missing)
2,193
2,596
Number of firm-years of which natural log of labour
cannot be calculated
1,175
1,285
Number of firm-years of which natural log of AP or TI
cannot be calculated
9
861
Final sample of firm-year observations 3,390 3,188
5.3.2 Measurement of Variables and Regression Model
This study investigates whether FOICs shift profits out of Indonesia in response to
variations in their parents’ tax rates (see Appendix 5 for STRs of the countries in which
the parents of FOICs are located over the study period). This study examines whether
MNEs from various countries operating in Indonesia shift profits out of Indonesia to low-
tax jurisdictions. It is different from the study of Hines and Rice (1994) which examines
whether US MNEs operating in various host countries shift profits to low-tax
jurisdictions. The HRA is suitable for this study for the following reasons.74 First, the
74 In fact, the HRA is likely to be more suitable for examining profit shifting by MNEs based in different
countries that have affiliates operating in a single country because a single-country study does not need to
consider the real price of capital and labour, which may differ between countries. This is one concern of
the HRA (Hines & Rice, 1994).

128
model of Hines and Rice (1994) is based on the Cobb–Douglas production function,
which represents the relationship between output (in terms of income or profit) and input
(mainly in terms of capital and labour). Therefore, the HRA is suitable for both firm- and
country-level studies. Second, the basic premise of the HRA is that the observed profit
consists of two components: the ‘true’ profit and the ‘shifted’ profit. This premise is
applicable to all MNE affiliates, either in many countries or in a single country.
However, this study modifies the original HRA in Equation (5.1) in several ways.
The first modification is related to the dependent variable. This study uses pre-tax profit
(both AP and TI)75 rather than pre-tax nonfinancial income (i.e., earnings before interest
and taxes (EBIT)) as the dependent variable because it focuses on finding indirect
evidence of cross-border profit shifting in Indonesia by investigating the effect of the
parents’ tax rate variation on the profits reported by FOICs in their Indonesian tax returns.
The estimated effect is expected to capture potential cross-border profit shifting activities
through all possible channels, including transfer pricing and high debt financing.
Employing earnings before interest and taxes is likely to be necessary when one tries to
disentangle the transfer pricing and debt shifting channels (Dharmapala & Riedel,
2013).76 Therefore, as in prior studies (e.g. Markle, 2015; Huizinga & Laeven, 2008;
Dharmapala & Riedel, 2013), this study uses pre-tax profit as the dependent variable to
detect the existence of cross-border profit shifting in Indonesia.
The second modification is related to the independent variable. This study uses the
parent’s tax rate (PTR) rather than the average tax rate in the host country (τ in Equation
75 The explanation in Section 4.3.2 of the usage of both TI and AP to measure profit in Study 1 of this thesis
applies to the current study. In their seminal paper, Hines and Rice (1994) use reported EBIT (i.e., an
accounting profit measure) as the dependent variable. Therefore, unlike Study 1 of this thesis, in the current
study, AP comes before TI, and both AP and TI are discussed equally. Nevertheless, as in Study 1 of this
thesis, the current study considers TI as the most important measure of profit because, as mentioned in
Section 1.1, any reduction in TI is a direct measurement of income tax base erosion. 76 As mentioned in Section 5.2.1, Hines and Rice (1994) exclude interest because they do not have reliable
data.

129
(5.1)) as the independent variable because this study focuses on incoming investment as
opposed to Hines and Rice’s study, which focuses on outgoing investment. Using PTR as
the independent variable is expected to provide evidence of the effect of the parent’s tax
rate on the AP and TI reported by FOICs in their Indonesian tax returns. This study
predicts that the coefficient of PTR is positive—that is, the higher (lower) the tax rate of
the parent’s country, the higher (lower) the AP and TI reported in Indonesia. This study
uses STR instead of ETR as the PTR. As discussed in Section 4.2, while there has been a
debate regarding which one is a better proxy for tax incentives to shift profits, STR may
act as a better proxy for an incentive to shift profits because it is set by the government
and is therefore exogenous to firms’ choice (Dharmapala, 2014a).
The third modification concerns the control variables for the level of productivity
in the local country (A), which is excluded from this study. This variable is excluded
because the data used in this study are about MNE affiliates in only one host country (i.e.,
Indonesia) as opposed to affiliates in multiple host countries as in the study by Hines and
Rice (1994).
These modifications lead to the two regression models presented in Equations (5.2)
and (5.3), which this study uses to examine the effect of the parent’s tax rate variation on
AP and TI, respectively, reported by the FOICs in their Indonesian tax returns.
ln𝐴𝑃𝑖𝑡 = 𝛽0 + 𝛽1𝑃𝑇𝑅𝑖𝑡 + 𝛽2 ln 𝐾𝑖𝑡 + 𝛽3ln𝐿𝑖𝑡 + 𝛽4−9𝑌𝑒𝑎𝑟𝑡 + 𝜀𝑖𝑡 (5.2)
ln𝑇𝐼𝑖𝑡 = 𝛽0 + 𝛽1𝑃𝑇𝑅𝑖𝑡 + 𝛽2 ln 𝐾𝑖𝑡 + 𝛽3ln𝐿𝑖𝑡 + 𝛽4−9𝑌𝑒𝑎𝑟𝑡 + 𝜀𝑖𝑡 (5.3)
where:
𝐴𝑃𝑖𝑡 is the pre-tax AP reported by FOIC i for year t;
𝑇𝐼𝑖𝑡 is the TI reported by FOIC i for year t;
𝑃𝑇𝑅𝑖𝑡 is the parent’s STR of FOIC i for year t;
𝐾𝑖𝑡 is the capital input of FOIC i in year t, proxied by fixed tangible assets;

130
𝐿𝑖𝑡 is the labour input of FOIC i in year t, proxied by employment
compensation;
𝑌𝑒𝑎𝑟𝑡 is a set of six dummy variables that is expected to account for annual
fluctuations in lnAP or lnTI (the dependent variable) that were not caused
by PTR (the independent variable) and K and L (the control variables);
𝜀𝑖 is the error term.
As discussed in Section 4.4.3, pooled OLS regressions may contain a bias because
of the heterogeneity issue. Unfortunately, as in Study 1 presented in Chapter 4, the panel
data for Study 2 in this chapter are also highly unbalanced.77 For example, only 61 firms
of 1,229 (about 5%) have data for all seven years and the missing years may not be
random. More importantly, the key independent variable, PTR, tends to be constant over
the study period. Therefore, panel data analysis may not be appropriate.
As Section 4.4.3 explains, regressions of pooled cross-sectional data should be run
by clustering the errors by firm to allow the regression errors to have heteroscedasticity
across firms and correlation within a firm. Therefore, as in Study 1, this study reports
regressions that include adjustments for errors clustered by firms.78 Year dummies are
again included to control for changes in profitability reported by FOICs across years (e.g.
general macroeconomic conditions) that are not covered by other explanatory variables.
5.4 Empirical Results
5.4.1 Summary Statistics
Table 5.2 presents descriptive statistics for the sample used in this study.
77 See Appendix 11 for a summary of the distribution of the unbalanced panel data for Study 2 of this thesis. 78 In STATA software, using the option ‘cluster ()’ will generate standard error estimates that are robust to
disturbances being heteroskedastic and autocorrelated (Hoechle, 2007).

131
Table 5.2
Descriptive Statistics—Study 2
A. AP
Variable No. Mean Median
Standard
Deviation Minimum Maximum
lnAP 3,390 22.073 22.123 2.566 11.967 29.948
PTR 3,390 0.267 0.25 0.092 0 0.55
lnK 3,390 23.498 23.807 2.651 9.821 30.359
lnL 3,390 22.669 22.885 2.008 13.160 28.438
Notes: lnAP is the natural log of AP reported by FOICs in Indonesian tax returns (total of commercial net
income in the Indonesian tax return 1771-I Section 3 plus Income tax in the Indonesian tax return 1771-I
Section 5f). PTR is the parent’s STR. lnK is the natural log of tangible fixed assets reported in Indonesian
tax returns (Indonesian tax return 1771, Special attachment, Transcript of elements citation of financial
statement Sections I13—land and buildings and I14—other fixed assets). lnL is the natural log of
compensation reported in Indonesian tax returns (Indonesian tax return 1771 Section II2.6—total salaries,
wages, bonuses, gratifications, honorariums and other compensations).
B. TI
Variable No. Mean Median
Standard
Deviation Minimum Maximum
lnTI 3,188 22.095 22.132 2.620 0 33.170
PTR 3,188 0.267 0.25 0.092 0 0.55
lnK 3,188 23.599 23.868 2.551 9.821 30.359
lnL 3,188 22.750 22.960 1.947 13.160 28.438
Notes: lnTI is the natural log of TI reported in Indonesian tax returns (Indonesian tax return 1771 Section
A1—fiscal net income. Fiscal net income is TI before loss carried forward). See Panel A for definitions of
other variables.
The mean value of lnAP (lnTI) is 22.073 (22.095), suggesting that the sample of
FOICs reported AP (TI) of almost Rp4 billion, which is equivalent to approximately
USD300,000 using 2015 exchange rates for tax purposes. The PTR ranges from zero to
55%. Examples of countries in the sample that have zero STR are the British Virgin

132
Islands, Cayman Islands, Channel Islands and Marshall Islands. A country in the sample
that has STR of 55% is the United Arab Emirates.
Table 5.3 shows the Pearson correlation between variables. Parent’s tax rate (PTR)
is positively correlated with both the natural log of AP (lnAP) and the natural log of TI
(lnTI) and is significant at the 1% level, consistent with the prediction.
Table 5.3
Pearson Correlation Matrix—Study 2
A. AP
lnAP PTR lnK lnL
lnAP 1
PTR 0.192 *** 1
lnK 0.726 *** 0.098 *** 1
lnL 0.761 *** 0.134 *** 0.773 *** 1
B. TI
lnTI PTR lnK lnL
lnTI 1
PTR 0.211 *** 1
lnK 0.709 *** 0.121 *** 1
lnL 0.746 *** 0.138 *** 0.777 *** 1
Note: *, ** and *** indicate significance at the 1%, 5% and 10% levels in a two-tailed test, respectively.
A test of collinearity is conducted by regressing both dependent variables on all of
the independent variables and calculating the VIFs for each variable. Appendix 12 shows
the VIFs when using both AP and TI as the dependent variables. The result shows that

133
VIFs are in the range of 1.02–2.59, which is much lower than the general tolerance value
of 10, suggesting the absence of the multicollinearity issue (i.e., no variable is considered
a linear combination of other variables). In conclusion, all VIFs are fine for both AP and
TI regression models.
5.4.2 Regression Results
After controlling for capital and labour inputs, the regressions display a positive
relationship between the parent’s tax rate and both AP and TI, consistent with the
hypotheses H1 and H2. The regression results are presented in Table 5.4.

134
Table 5.4
Regression Results—Effect of Parent’s Tax Rate on Reported AP and TI
ln𝐴𝑃𝑖𝑡/ln𝑇𝐼𝑖𝑡= 𝛽0 + 𝛽1𝑃𝑇𝑅𝑖𝑡 + 𝛽2 ln 𝐾𝑖𝑡 + 𝛽3ln𝐿𝑖𝑡 + 𝛽4−9𝑌𝑒𝑎𝑟𝑡 + 𝜀𝑖𝑡
Expected
sign
Dependent variable:
Natural log of AP
Dependent variable:
Natural log of TI
PTR (parent’s tax rate)
+ 2.555
(4.97)
*** 2.894
(5.80)
***
lnK (nat. log of capital)
+ 0.329
(11.00)
*** 0.326
(10.11)
***
lnL (nat. log of labour)
+ 0.615
(14.76)
*** 0.651
(14.30)
***
Year
2010 ? −0.158
(−2.14)
** −0.104
(−1.47)
2011 ? −0.214
(−2.79)
*** −0.153
(−2.16)
**
2012 ? −0.281
(−3.33)
*** −0.234
(−2.94)
***
2013 ? −0.062
(−0.60)
−0.102
(−1.00)
2014 ? −0.110
(−1.16)
−0.092
(−0.97)
2015 ? −0.345
(−3.77)
*** −0.471
(−3.74)
***
Constant −0.090
(−0.17)
−1.005
(−1.70)
R² 0.637 0.612
n 3,390 3,188
Notes: t-statistics appear in parentheses. *, ** and *** indicate significance at the 1%, 5% and 10% levels
in a two-tailed test, respectively. See Table 5.2 for definitions of variables.
The coefficients of PTR are significant at the 1% level in both regressions,
suggesting that the parent’s tax rate is a significant incentive for FOICs to report a higher
or lower profit in their Indonesian tax returns. The estimated coefficients indicate that one
percentage point lower tax rate of the parent’s country is associated with 2.56% (2.89%)
decrease in the AP (TI) reported by FOICs in their Indonesian tax returns. This figure is
similar to Hines and Rice’s finding that the tax rate of the host country that is one

135
percentage point higher is associated with a 2.83% decrease in reported profits by US
MNEs in that host country.
The results are consistent with the hypotheses H1 and H2 which predict that the
parent’s tax rate of an FOIC is positively associated with the profit reported by the FOIC
in its Indonesian tax return. The empirical results are consistent with, and reinforce, the
findings from Study 1.
The coefficients of lnK and lnL are both positive and significant at the 1% level.
Moreover, the regression model represented by Equations (5.2) and (5.3) have an adjusted
R-squared of 63.7% and 61.2%, respectively. The high explanatory power of the
regression models is consistent with the notion that capital and labour are the inputs to
generate the ‘true’ profits, and tax incentives determine the direction and magnitude of
profit shifting.
All coefficients for the Year dummy variables are negative, but only the coefficients
for the years 2010 (for AP model only), 2011, 2012 and 2015 are significantly different
from zero at the 1% or 5% level, suggesting that FOICs report significantly lower AP and
TI in the said years compared with 2009 which is the base year. With the exception of
2013 and 2014, the increasing magnitudes of the year fixed effects in Study 2 are similar
to the pattern of year fixed effect found in the TI model of Study 1 which has been
discussed in detail in subsection 4.4.2, so the interpretation is not repeated here.
5.5 Chapter Summary
Profit shifting by MNEs is a global concern because many large MNEs are accused
of using profit shifting strategies to avoid taxes worldwide. This chapter examines the
existence of profit shifting by foreign MNEs in Indonesia. In particular, it uses the HRA
with some modifications to examine the effect of the parent’s tax rate variation on the AP
136
and TI reported by FOICs from 2009 to 2015. The HRA is adopted because it is one of
the most-recognised approaches for detecting the presence of tax-motivated profit
shifting. This study uses the AP and TI reported by FOICs in their confidential Indonesian
tax returns rather than the financial statement data.
The regression results indicate that one percentage point lower tax rate of the
parent’s country reduces the AP and TI reported by FOICs in their Indonesian tax returns
by 2.56% and 2.89%, respectively. The findings are similar to that of Hines and Rice
(1994). The coefficients for the Year dummies seem suggest that before the OECD
introduced the BEPS project in 2013, FOICs demonstrated an increasing trend of shifting
profits out of the country. However, once Indonesia joined the BEPS project, the
magnitude of profit shifting was held back for two years, 2013 and 2014. In 2015, the
size of profit shifting resumed its upwards trajectory. This phenomenon might be due to
the lack of effective actions taken by the Indonesian government to fight profit shifting
by foreign MNEs after joining the BEPS project.
Overall, the results of this study reinforce the empirical evidence found in Study 1
by providing more evidence to show that profit shifting is occurring in Indonesia.
Therefore, it is expected that the two studies reported in Chapters 4 and 5 have provided
sufficient empirical evidence indicating that FOICs use profit shifting strategies to avoid
Indonesian CIT, consistent with the suggestion in prior studies that developing countries
also suffer from profit shifting by MNEs. The next question is: How do FOICs—the
Indonesian affiliates of foreign MNEs—shift profits? Study 3 reported in the following
chapter is conducted to address this question.

137
CHAPTER 6:
HOW DO FOREIGN-OWNED INDONESIAN COMPANIES
SHIFT PROFITS OUT OF INDONESIA?
6.1 Introduction
The empirical identification of the existence and magnitude of cross-border profit
shifting is inherently characterised by difficulty (Dharmapala & Riedel, 2013). As a
result, most existing studies focus on finding an indirect identification strategy that
measures the effect of corporate tax rate differences on the profitability reported by
subsidiaries of MNEs in different countries, and only a small number of studies attempt
to find more direct evidence, such as the channels used by MNEs to shift profits.
MNEs can use several channels to shift profits to lower their income tax liabilities.
The two most common channels used are cross-border transfer pricing arrangements and
high debt financing. Most prior studies (e.g. Clausing, 2003; Swenson, 2001; Buettner &
Wamser, 2007, 2013; Vicard, 2015) investigate profit shifting channels used by MNEs
by relying on corporate tax rate variations between the country in which the parent
company is located and the country in which the subsidiary operates. Moreover, most
prior studies use data from developed countries to examine profit shifting channels used
by MNEs. Few studies use data from developing countries.
This chapter investigates whether FOICs (i.e., Indonesian affiliates of foreign
MNEs) use intra-firm transfer pricing and/or debt financing by related parties to shift
profits out of Indonesia—a major developing country—using a different approach. The
analysis includes comparisons between FOICs and comparable DOICs in terms of two
indicators that are expected to capture the two profit shifting channels. Specifically, this

138
study compares earnings before interest and taxes scaled by total sales (EBIT/S) and long-
term liabilities with related parties79 scaled by total assets (LTL_RP/TA) to capture the
transfer pricing and high debt financing channels, respectively.
This study uses tax return data provided by the DGT, which is the tax authority of
Indonesia, rather than data from financial reports.80 Analysis using paired t-tests and OLS
regressions on the matched samples of FOICs and DOICs obtained from the PSM
procedure find that FOICs shift profits out of Indonesia primarily by means of transfer
pricing and, to a lesser extent, debt financing.
The remainder of this chapter is organised as follows. Section 6.2 discusses prior
research and develops the hypotheses. Section 6.3 describes the research design, while
Section 6.4 reports the empirical results. Section 6.5 presents some concluding remarks.
6.2 Literature Review and Hypotheses Development
6.2.1 Definitions of Transfer Pricing, Arm’s-length Principle and Debt Financing
As discussed in Section 3.1.2, internalisation is the most decisive factor for many
MNEs to establish foreign subsidiaries in different host countries. Cross-border profit
shifting is a good example of the benefits of internalisation. MNEs can use various
channels to shift profits from one subsidiary to others that are located in different tax
jurisdictions. Two profit shifting channels are extensively studied in the literature. The
first channel is intra-group transfer pricing, whereby MNEs set the prices for cross-border
transactions between affiliates within the same group to shift profits to avoid taxes. Given
that MNEs often misuse transfer prices by setting prices that do not satisfy the ‘arm’s-
79 See Appendix 13 for definitions of related parties according to Indonesian Income Tax Law. 80 Unlike countries such as Australia, in which a dividend imputation system is adopted to integrate CIT
and personal income tax, Indonesia adopts a classical tax system whereby income tax is payable on both
corporate profits and the dividend income of shareholders. Further, consolidation only applies to financial
reporting and is not adopted for tax purposes in Indonesia. Appendix 14 describe the way of identifying
whether a business entity needs to lodge a tax return in practice.

139
length principle’ to lower the tax liability, a number of studies refer to it as transfer
mispricing (e.g. Spencer, 2012; Bastin, 2014), abusive transfer pricing (e.g. Schindler &
Schjelderup, 2013; Wickham, 1991) or transfer price management (e.g. Jacob, 1996;
Pendse, 2012, October). The widely accepted definitions of ‘transfer pricing’ and ‘arm’s-
length principle’ are presented below:
‘Transfer pricing’ is the general term for the pricing of cross-border, intra-firm
transactions between related parties. Transfer pricing therefore refers to the setting
of prices for transactions between associated enterprises involving the transfer of
property or services. These transactions are also referred to as ‘controlled’
transactions, as distinct from ‘uncontrolled’ transactions between companies that
are not associated and can be assumed to operate independently (‘on an arm’s length
basis’) in setting terms for such transactions. (UN, 2013c, p. 2)
Based on the above definition, transfer pricing appears to have negative
associations: MNEs are likely to use transfer pricing as a strategy to avoid income taxes
by arranging the prices used for intra-firm cross-border transactions.
The ‘arm’s-length principle’ refers to prices used for transactions between
independent or non-related parties. Tax convention models such as the OECD Model Tax
Convention on Income and on Capital (OECD Model) and the UN Model Double
Taxation Convention between Developed and Developing Countries (UN Model) require
MNEs to use the ‘arm’s-length principle’ for pricing intra-firm transactions (UN,
2013c).81 Both tax conventions place the authoritative statement about the arm’s-length
principle in paragraph 1 of Article 9 in relation to ‘Associated Enterprises’, as follows:
Where:
(a) an enterprise of a Contracting State participates directly or indirectly in the
management, control or capital of an enterprise of the other Contracting
State, or
81 The UN Model and the OECD Model are the two tax convention models that are adopted by most
countries in the world. Thus, they have a profound influence on international tax treaty practice. Both
models define the ‘arm’s-length principle’ in a similar way. Indeed, other similarities can be found in most
articles of the two models. According to the UN (2011, p. vi), ‘the similarities between these two leading
Models reflect the importance of achieving consistency where possible.’

140
(b) the same persons participate directly or indirectly in the management,
control or capital of an enterprise of a Contracting State and an enterprise of
the other Contracting State,
and in either case conditions are made or imposed between the two enterprises in
their commercial or financial relations which differ from those which would be
made between independent enterprises, then any profits which would, but for those
conditions, have accrued to one of the enterprises, but, by reason of those
conditions, have not so accrued, may be included in the profits of that enterprise
and taxed accordingly (UN, 2011; OECD, 2014c).
The ‘arm’s-length principle’ treats the members of an MNE group ‘as separate
entities rather than as inseparable parts of a single unified business’ (OECD, 2009, p. 33)
and it ‘essentially is an approximation of market-based pricing’ (UN, 2013c, p. iii). That
is, the arm’s-length principle requires MNEs to use market prices for intra-firm
transactions rather than arranging or managing the transfer prices to avoid income taxes
in high-tax jurisdictions. However, in the real world, there are difficulties in applying the
arm’s-length principle, especially in situations where the goods or services involved are
unique and where market-based prices in transactions between independent parties are
absent.
The second channel that MNEs use to shift profits is high debt financing, especially
financing by loans from related parties.82 A company may deliberately finance its
business activities by debt rather than by equity. For instance, companies may deliberately
restructure their financing arrangement of capital so it is recognised as debt under the tax
rules. This is often referred to as ‘thin capitalisation’ in the tax literature. From a taxation
point of view, the reason why companies tend to do so is that debt financing (also known
as leveraging) is more beneficial than equity financing because the payment of interest
82 From the viewpoint of the country from which profit is shifted away (e.g., Indonesia), the practice is high
debt financing. From the viewpoint of the MNE headquarters, the practice is debt shifting within the group
or debt management (i.e., high debt financing for affiliates in high-tax countries and low debt financing or
even acting as lenders for affiliates in low-tax countries), as can be found in some studies that focus on the
viewpoint of MNE headquarters (e.g. Riedel, 2014; Schindler & Schjelderup, 2012).

141
on debt is deductible for tax purposes, whereas the payment of dividends on equity is not
(UN, 2013c).
Both FOICs and DOICs can use transfer pricing and debt financing as the channels
to shift profits between related parties. However, when DOICs shift profits between
related parties, the group as a whole will likely end up with indifferent tax liability
because the members of the group are taxed under Indonesian tax rules. In contrast,
FOICs can shift profits out of Indonesia because their parent and affiliates are located in
different tax jurisdictions. For example, an FOIC that requires substantial capital to
finance its operations, such as a mining FOIC, has incentives to be financed by intra-
group debts from its parent or an affiliate located in a low-tax jurisdiction. Accordingly,
the interest expense paid on the intra-group debt by the FOIC will lead to higher tax
benefits in Indonesia83 than the tax cost associated with the interest income in the low-tax
country where the lender is located. Cross-border profit shifting out of Indonesia by
foreign MNEs—either by transfer pricing or debt financing—can lower the total tax
payable by the group as a whole.
6.2.2 Prior Studies and Hypotheses Development
Some prior studies focus on transfer pricing arrangements, some focus on debt
financing and some examine both. This section presents three examples of studies that
focus on transfer pricing. Bartelsman and Beetsma (2003) examine whether MNEs shifted
profits among OECD countries during the period 1979–1997. Unlike prior studies that
examine income shifting from developed countries to low-tax jurisdictions, the authors
focus on profit shifting by MNEs among OECD countries and base their empirical
analysis solely on the manufacturing sector. They control for the effects of taxes and
83 This study covers the period 2009–2015. During this period, the statutory CIT rate in Indonesia was 28%
in 2009, decreased to 25% in 2010, and remains unchanged ever since.

142
unobserved productivity on the scale of real economic activity by regressing the ratio of
total value added to wage payments on tax rate differences and claim that this novel
method can isolate the pure effects of income shifting. They find significant tax-motivated
transfer price arrangements by MNEs. Specifically, they find that a unilateral tax increase
decreases the reported income tax base, and they estimate that the decrease is more than
65% of the additional revenue expected from the unilateral tax increase.
Bernard, Jensen, and Schott (2006) examine how US-based MNEs set prices that
differ across related and unrelated party buyers. Using US international trade transaction
data provided by the US Census Bureau and the US Customs Bureau between 1992 and
2000, the authors find that US exporters set substantially higher prices for their arm’s-
length customers than for related parties. These differences exist even for the same
transaction characteristics (i.e., same product, same exporter, same time of shipping and
same mode of shipment). This finding suggests that US-based MNEs have used transfer
pricing arrangements as a channel for shifting profits out of the US.
Using firm-level trade data for France in 2008, Vicard (2015) examines whether
MNEs in France avoid French income tax by means of transfer pricing in trade with
related parties, as well as documents that the MNEs use to manipulate their transfer prices
to shift profits to affiliates located in low-tax jurisdictions to reduce their tax expenses.
The author finds that if France has a corporate tax rate that is one percentage point higher
than that of its trade partner, intra-firm export prices reduce by 0.22% and intra-firm
import prices increase by 0.24%. Therefore, consistent with the findings of the previous
studies, French-based MNEs also use the transfer pricing strategy.
The next three studies examine whether MNEs shift profits by means of debt
financing. Mills and Newberry (2004) investigate how tax rate differences affect income
reporting by MNEs and examine whether tax incentives affect the debt policy of foreign

143
MNEs. They use two different measures of foreign tax incentives. First, they define tax
incentives as the difference between the US STR and the foreign MNE parent’s ETR.
Second, they refer to tax incentives as the difference between the US STR and the foreign
MNE parent’s STR. They find that the use of debts in US affiliates is higher for foreign
MNEs with lower foreign tax rates than for foreign MNEs with higher foreign tax rates
for both measures of tax incentives, suggesting that MNEs finance their US affiliates with
higher debt only when the parent’s country of the US affiliate has a lower income tax rate
than that of the US.
Huizinga, et al. (2008) use firm-level data for European MNEs and their affiliates
over the period 1994–2003 to examine whether MNEs’ indebtedness in a country depends
on tax rate differences. They find that a subsidiary increases debt financing by 2.4% in
response to a 10% increase in the tax rate in that country, relative to a subsidiary that does
not experience a tax increase. This finding suggests that European MNEs use high debt
financing to shift profits out of high-tax host countries.
Buettner and Wamser (2013) confirm that MNEs use debt financing to shift profits.
Using panel data on German MNEs, they examine whether tax rate differences in 145
countries have been used to facilitate internal debt financing by MNEs to shift profits to
low-tax jurisdictions during 1996–2005. They find that a foreign affiliate tends to use
more internal debt financing if (1) the parent controls another affiliate that operates in a
low-tax jurisdiction and (2) if the tax rate difference between the foreign affiliate and the
affiliate with the lowest tax rate within the group is significant. While the effect is small
(partly, they find, because of the German CFC rules), this result suggests that German
MNEs shift profits out of high-tax countries by means of intra-group debt financing.
The studies mentioned above investigate the channels (either transfer pricing or
high debt financing) used by MNEs to shift profits by relying on the effect of tax rate

144
differences. In a different study, Egger, et al. (2010) examine both channels by comparing
foreign-owned companies with comparable domestic-owned companies. Specifically, the
authors use data on more than 500,000 plants in 31 European economies between 1999
and 2004 to identify causal effects of foreign ownership on profit tax savings compared
with domestic firms. Egger, et al. (2010) argue that comparing foreign-owned
corporations with comparable domestic-owned corporations will not only help them to
estimate tax savings through foreign ownership, but will also enable them to appropriately
identify the important channels used by foreign-owned corporations to avoid income
taxes. Two such channels that they explore are ‘the direct shifting of profits from high-
tax to low-tax countries (e.g., by transfer pricing, royalty and license fee payments, and
other measures) and the indirect shifting of the tax base by shifting debt to countries where
corporate tax rates are relatively high’ (Egger, et al., 2010, p. 100). The authors find that
profit shifting through transfer pricing or royalty and license payments is much more
significant and is therefore more important than that of debt shifting in European
economies.
While all prior studies discussed in this section focus on channels used by MNEs
to shift profits from the perspective of a developed country, cross-border profit shifting
by means of transfer pricing and debt financing is also likely to occur in Indonesia—a
developing country—for the following two reasons. First, FOICs have a competitive
advantage over DOICs because, as explained in Section 2.1, FOICs are affiliates of
foreign MNEs and therefore can use the international network of affiliates (the
internalisation factor) to avoid Indonesian CIT. Second, prior studies (e.g. Crivelli, et al.,
2015; Fuest & Riedel, 2010; OECD, 2013b) allege that developing countries also suffer
from profit shifting by MNEs. While these studies do not specifically investigate how
MNEs shift profits out of developing countries, the allegation appears to be plausible. In

145
the case of Indonesia, as discussed in Section 3.4, two statements from two different
finance ministers indicate that thousands of FOICs have not paid CIT for many years, and
that companies have used transfer pricing and intra-group debt financing to avoid
Indonesian CIT. While the two statements are not empirical evidence of the existence of
cross-border profit shifting in Indonesia per se, they are statements made by authoritative
persons.
This study attempts to provide empirical evidence of the channels used by FOICs
to shift profits out of Indonesia by comparing FOICs and DOICs. Specifically, this study
uses two measures to detect the channels used by FOICs to shift profits out of Indonesia.
First, earnings before interest and taxes (EBIT) to sales ratio (EBIT/S) is expected to
capture profit shifting through transfer pricing arrangements. If foreign MNEs arrange
FOICs to artificially suppress selling prices, inflate purchase costs, management fees,
royalties and licence fees paid to affiliates overseas, their EBIT/S will be lower than
comparable DOICs (in terms of industry sector, firm size and maturity). Thus, the lower
EBIT/S of FOICs relative to comparable DOICs indicates the incidence of profit shifting
by means of transfer mispricing of goods and services.
Second, long-term liability to related parties to total assets ratio (LTL_RP/TA) is
expected to capture profit shifting through intra-group debt financing. The higher
LTL_RP/TA of FOICs relative to comparable DOICs indicates the incidence of profit
shifting by means of intra-group debt financing. Transfer pricing and debt financing can
be complementary to, or a substitute for, each other as channels to shift profits (Saunders-
Scott, 2015).
Therefore, this study predicts a negative relation between FOIC (an indicator
variable that takes the value of ‘1’ if the Indonesian company is an FOIC, and ‘0’ for a

146
DOIC) and EBIT/S, and a positive relation between FOIC and LTL_RP/TA. These lead to
the two hypotheses stated in the alternative form as follows:
H1: FOICs report lower EBIT/S than comparable DOICs.
H2: FOICs report higher LTL_RP/TA than comparable DOICs.
6.3 Research Design
6.3.1 Sample Selection and Period of Study
This study uses confidential tax return data obtained from the DGT under a data
nondisclosure agreement. However, the DGT only supplies tax return data for DOICs
registered in the Jakarta tax offices. Given the variation in the quality of tax return data
processed by the Jakarta tax offices and regional tax offices, this study only includes
companies (FOICs and DOICs) registered in Jakarta tax offices to ensure a consistent
quality of data. This study uses data reported in company tax returns because, according
to the OECD (2015a), tax return data can better capture the existence of profit shifting by
MNEs compared with financial data. As in Study 1 and Study 2, all firms in the current
study are anonymised for privacy protection.
The period of the study is 2009–2015. A key reason for starting the study from 2009
is related to the Indonesian tax administrative reform, better known as ‘modernisasi’
(modernisation), which began in July 2002. Completed at the end of 2008, the reform
claimed to equip Indonesian tax office units nationwide with ‘more efficient, simplified
and transparent business process, more advanced system and information technology,
better human resources, improved good governance and more efficient structure of
organisation’ (DGT, 2009, p. 38). As a result, the tax return data recording is expected to
be more accurate than before, which will in turn provide more reliable data for research
purposes from 2009. The reason for ending the period of study in 2015 is simply because

147
that is the latest year for which data are available from the DGT when this study is
conducted.
Table 6.1 presents the derivation of the final samples used in this study for the two
dependent variables.
Table 6.1
Final Sample Size—Study 3
EBIT/S LTL_RP/TA
Number of firm-years between 2009–2015 with data
available for propensity score matching (PSM) procedure
31,596
33,099
Number of firm-years between 2009–2015 in the matched
sample available for paired t-tests and OLS regressions
Consisting of:84
FOICs
DOICs
5,272
2,636
2,636
7,458
3,729
3,729
The top five parent’s countries of FOICs in both samples are Japan, Republic of
Korea, Singapore, Malaysia and the US. The distribution of countries in which the parents
of FOICs are located can be found in Appendix 15.
6.3.2 Measurement of Variables and Statistical Procedures
This study examines whether FOICs use transfer pricing and debt financing to shift
profits out of Indonesia by comparing their profitability and the extent of intra-group debt
financing with those of comparable DOICs. Following Egger et al. (2010), it is important
84 As a result of the PSM procedure, the final samples have equal numbers of FOICs and DOICs.

148
to compare foreign-owned companies (as the treatment group) with comparable
domestic-owned companies (as the control group) to identify the channels used to shift
profits. This is done in two stages, as outlined below.
Stage 1
In the first stage, OLS regressions are used to investigate whether FOICs reported
significantly lower EBIT/S and significantly higher LTL_RP than DOICs. More precisely,
the two profit shifting channel indicators used in this study are:
1. EBIT/S (earnings before interest and taxes scaled by total sales) to detect profit
shifting by transfer pricing. The difference between the EBIT/S of FOICs and
comparable DOICs captures suppressed selling prices, inflated purchase prices and
inflated rent, royalties and management fees paid to associates overseas.
2. LTR_RP/TA (long-term liabilities to related parties scaled by total assets) to detect
profit shifting by intra-group debt financing.
Equations (6.1) and (6.2) are the two OLS regression models used to analyse the
differences between FOICs and comparable DOICs in terms of the two intra-group profit
shifting indicators:
𝐸𝐵𝐼𝑇/𝑆𝑖𝑡 = 𝛽0 + 𝛽1𝐹𝑂𝐼𝐶𝑖𝑡 + 𝛽2 ln 𝑆𝑎𝑙𝑒𝑠𝑖𝑡 + 𝛽3𝐴𝑔𝑒𝑖𝑡 + 𝛽4−76𝐼𝑛𝑑𝑢𝑠𝑡𝑟𝑦𝑖𝑡 +
𝛽77−82𝑌𝑒𝑎𝑟𝑡 + 𝜀𝑖𝑡 (6.1)
𝐿𝑇𝐿_𝑅𝑃/𝑇𝐴𝑖𝑡 = 𝛽0 + 𝛽1𝐹𝑂𝐼𝐶𝑖𝑡 + 𝛽2 ln 𝑆𝑎𝑙𝑒𝑠𝑖𝑡 + 𝛽3𝐶𝑎𝑝𝐼𝑛𝑡𝑖𝑡 + 𝛽4𝐴𝑔𝑒𝑖𝑡 +
𝛽5−77𝐼𝑛𝑑𝑢𝑠𝑡𝑟𝑦𝑖𝑡 + 𝛽78−83𝑌𝑒𝑎𝑟𝑡 + 𝜀𝑖𝑡 (6.2)
where:
𝐸𝐵𝐼𝑇/𝑆𝑖𝑡 is earnings before interest and taxes divided by sales for firm i and year t;
𝐿𝑇𝐿_𝑅𝑃/𝑇𝐴𝑖𝑡 is long-term liability to related parties divided by total assets for firm i and
year t;

149
𝐹𝑂𝐼𝐶 is a dummy variable that equals 1 if the company in the sample is an FOIC,
or 0 if the company in the sample is a DOIC;
ln 𝑆𝑎𝑙𝑒𝑠𝑖𝑡 is the natural logarithm of total sales for firm i in year t;
𝐶𝑎𝑝𝐼𝑛𝑡𝑖𝑡 is capital intensity, measured by net property, plant and equipment scaled
by total assets for firm i and year t;
𝐴𝑔𝑒𝑖𝑡 is the number of years the company has been registered in an Indonesian
tax office for firm i and year t;
𝐼𝑛𝑑𝑢𝑠𝑡𝑟𝑦𝑖𝑡 is a set of 61 dummy variables indicating the DGT industry classification
of firm i and year t;
𝑌𝑒𝑎𝑟𝑡 is a set of six dummy variables that is expected to account for annual
fluctuations in EBIT/S or LTL_RP/TA (the dependent variable) that were
not because of FOIC (the independent variable) and any of the above
control variables;
𝜀𝑖 is the error term.
Equations (6.1) and (6.2) control for firm size by using total sales as a proxy. Total
sales are in a natural logarithmic form (lnSales) to transform total sales that are likely
skewed into a more approximately normal variable. An advantage of using sales rather
than assets as a proxy for firm size is that sales might capture firm size better than assets
for companies that have large sales but only a small quantity of assets. Firm size effects
reported in the literature are not consistent; thus, following prior studies (e.g., Mills &
Newberry, 2004), no sign is predicted for lnSales.
Another control variable, Age, is the number of years since a taxpayer registered in
a tax office in Indonesia until it lodges its tax return for the respective year in the study
period. Prior studies (e.g., Mills & Newberry, 2004; Grubert, 1998) provide evidence of
the so-called maturation effect, which theorises that mature companies report higher

150
levels of income. Accordingly, this study predicts a positive relation between EBIT/S and
Age, but it does not predict any relation between LTL_RP/TA and Age.
Equations (6.1) and (6.2) also control for Industry and Year. Industry is a series of
indicator variables to control for industry effects. This study uses the two-digit industry
classifications for Indonesian taxpayers set by the DGT. The Year dummy variables are
included to provide a control for annual variations in the magnitude of EBIT and LTL_RP
reported by company taxpayers due to factors other than FOIC and the other control
variables, such as macroeconomic conditions, that may differ from year to year.
This study follows prior studies (e.g. Mills & Newberry, 2004; Myers, 1977) and
includes capital intensity (CapInt) as a control variable when examining whether FOICs
shift profits by means of intra-group debt financing in Equation (6.2). As explained by
Mills and Newberry (2004, p. 98), ‘capital structure theory suggests that debt usage is
higher when firms have more assets–in–place (capital intensity)’. Consistent with the two
prior studies, this study predicts a positive sign of the coefficient of CapInt.
A company is defined as an FOIC if more than 50% of the equity in the company
is held by non-residents for tax purposes. Conversely, a company in which the majority
shares are owned by residents for tax purposes is defined as a DOIC. Consistent with
hypotheses H1 and H2, the coefficients of FOIC for the EBIT/S and LTL_RP/TA models
are predicted to be negative and positive, respectively.
Stage 2
In the second stage, the PSM technique is used to ensure that FOICs and DOICs are
comparable in terms of firm size (proxied by lnSales), maturity (proxied by Age), industry
(using the DGT two-digit industry classification) and year. For the debt financing model,
in addition to the four variables mentioned above, this study also includes capital intensity

151
(CapInt, proxied by net property, plant and equipment scaled by total assets) as one of
the matching criteria. Using the above matching criteria as the independent variables to
compute the propensity scores, an FOIC is matched to a DOIC with the nearest propensity
score for comparison. This study follows the PSM procedure presented below (using the
Stata statistical package) to match an FOIC to a DOIC before running paired t-tests and
OLS regressions again:
1. Run a regression with EBIT/S (LTL_RP/TA) as the dependent variable, and FOIC,
lnSales, Age, Industry indicators, Year indicators (and CapInt when LTL_RP/TA is
the dependent variable) as independent variables to set the e(sample).
2. Use pstest to test the differences in means between the independent variables across
the treatment group (FOICs) and the control group (DOICs).
3. Use psmatch2 and logit regression to compute propensity scores using FOIC as the
dependent variable, lnSales, Age, Industry indicators, Year indicators (and CapInt)
as the independent variables, and match each FOIC to the DOIC with the nearest
propensity score, without replacement.
4. Use pstest to test the differences in terms of firm size, age (and capital intensity)
between FOICs and the matched DOICs. If there is any significant difference
between the two groups, specify a caliper (see Step 5).
5. Set a caliper initially as 0.25 of the standard deviation of the generated propensity
scores.
6. Run psmatch2 to match treatment firms to their nearest neighbour control firms
subject to the requirement that the propensity scores of the matched pairs are within
the specified caliper, without replacement.
7. Use pstest again to examine whether there remain any significant differences in terms
of firm size, age (and capital intensity) between the two groups. If so, reduce the
152
caliper and repeat Step 6 until no significant differences in terms of firm size, age
(and capital intensity) are found between the two groups.
8. Run paired t-tests and the OLS regressions on the propensity score-matched sample.
The matched samples obtained from the PSM techniques ensure that the FOICs and
the DOICs are comparable in firm size, maturity, capital intensity, industry affiliation and
year. Paired t-tests are run to examine whether the two groups (FOICs and the matched
DOICs) are significantly different from each other in terms of the two outcome variables,
EBIT/S and LTL_RP/TA. OLS regression models are run again on the matched sample to
further investigate the channels used by FOICs to avoid Indonesian CIT.
As in Study 1 and Study 2 (presented in Chapters 4 and 5, respectively), the current
study runs all regressions by clustering the errors by firms to allow for heteroscedasticity
and autocorrelation within a firm. A set of Year dummy variables is also included to
capture some of the annual variations that cannot be controlled by the other explanatory
variables. As in the previous two studies of this thesis, panel data analyses are not
appropriate. For the current study, the main reason is simply because FOIC—the test
variable—is an indicator variable (i.e., equals 1 if the firm is a foreign-owned Indonesian
company, and 0 otherwise) and therefore does not vary across years for a firm.
6.4 Empirical Results
6.4.1 Summary Statistics
Table 6.2 shows the descriptive statistics of the key variables for the EBIT/S and
LTL_RP/TA models in Panels A and B, respectively, after the matching procedure.

153
Table 6.2
Descriptive Statistics—Study 3
A. EBIT/S
Variable No. Mean Median
Standard
Deviation Minimum Maximum
EBIT/S 5,272 0.068 0.058 0.208 −0.997 1
lnSales 5,272 24.902 25.022 2.130 13.996 31.901
Age 5,272 12.231 10 8.436 0 40
Notes: EBIT/S is earnings before interests and taxes scaled by total sales reported by firms in their
Indonesian tax returns. Specifically, from the Indonesian annual tax return (form 1771), EBIT is derived
from net book income domestic (1771-I 1.h) + income tax (1771-I 5.f) + interest expense (1771-II 6.6).
lnSales is a natural log of the total sales reported in Indonesian tax returns (Indonesian tax return Form
1771-I 1.a: Gross Income). Age is the number of years from the year the company is registered to the year
of the observation.
B. LTL_RP/TA
Variable No. Mean Median
Standard
Deviation Minimum Maximum
LTL_RP/TA 7,458 0.027 0 0.115 0 0.999
lnSales 7,458 25.074 25.228 2.258 9.955 31.901
CapInt 7,458 0.254 0.195 0.230 0 0.999
Age 7,458 13.353 11 8.572 0 40
Notes: LTL_RP/TA is long-term liabilities to related parties scaled by total assets reported by firms in their
Indonesian tax returns. CapInt is capital intensity proxied by net property, plant and equipment (PPE) scaled
by total assets. Specifically, from the Indonesian annual tax return (Form 1771), PPE is derived from Land
and Buildings (1771 Transcript of Financial Statement I.13) + other fixed assets (1771 Transcript of
Financial Statement I.14) – accumulated depreciation (1771 Transcript of Financial Statement I.15). See
Panel A for definitions of other variables.
Panel A shows that EBIT/S has a mean of 0.068, suggesting that, on average,
companies in the sample report an EBIT of 6.8% of their total sales. The mean of lnSales
is 24.9, indicating that, on average, the companies in the sample report have annual sales

154
of around Rp75 billion, which is equivalent to approximately USD4.8 million using the
31 December 2015 exchange rate for tax purposes.85 The age of companies in the final
sample ranges from 0 (companies that are registered in the same year as the year of
observation) to 40 years. The average Age is 12 years, indicating that, on average,
companies in the sample are relatively mature.
From Panel B, LTL_RP/TA has a mean of 0.027, suggesting that, on average,
companies in the sample recorded long-term liability to related parties of 2.7% of their
total assets. The mean of lnSales is 25.1, similar to that of EBIT/S. The age of companies
in the LTL_RP/TA final sample shows a similar level of maturity as for EBIT/S. The mean
of CapInt is 0.25, indicating that, on average, companies in the sample have 25% of their
assets in the form of net PPE. CapInt ranges from zero to nearly one, demonstrating that
some companies in the final sample have negligible PPE in their assets, and some have
total assets almost entirely consisting of PPE.
Table 6.3 shows the Pearson correlation between the main variables in this study.
FOICs are negatively (positively) correlated EBIT/S (LTL_RP/TA) and are significant at
the 1% level, which is consistent with the prediction. Firm size is positively correlated
with EBIT/S but is not significantly correlated with LTL_RP/TA. Age has a significantly
positive (negative) correlation with EBIT/S (LTL_RP/TA). As predicted, capital intensity
is positively correlated with long-term liabilities to related parties.
85 As shown in Appendix 4, for 31 December 2015, the exchange rate for USD1 is Rp13,640.

155
Table 6.3
Pearson Correlation Matrix—Study 3
A. EBIT/S
FOIC EBIT/S lnSales Age
FOIC 1
EBIT/S −0.065 *** 1
lnSales −0.008 0.132 *** 1
Age −0.009 0.088 *** 0.331 *** 1
B. LTL_RP/TA
FOIC LTL_RP/TA lnSales CapInt Age
FOIC 1
LTL_RP/TA 0.043 *** 1
lnSales 0.004 0.008 1
CapInt −0.013 0.122 *** 0.133 *** 1
Age −0.014 −0.035 *** 0.321 *** 0.044 *** 1
Note: ***, ** and * indicate significance at 1%, 5% and 10% levels in a two-tailed test, respectively.
As in Study 1 and Study 2, the current study runs a test of collinearity that calculates
the VIFs for each variable to examine whether one of the regressors is a perfect linear
function of another regressor. Appendix 16 shows that the VIFs are in the range of 1.01–
3.59 and 1.01–4.14 for the EBIT/S model and the LTL_RP/TA model, respectively. The
VIFs are lower than the general tolerance value of 10, indicating the absence of
collinearity issue in both models.

156
6.4.2 Results of Statistical Analyses
Table 6.4 shows the key regression results for both profit shifting indicators of Stage
1 (i.e., using the available dataset before matching an FOIC with a DOIC).
The results show that FOICs report EBIT/S of around 4.4 percentage points lower
and LTL_RP/TA of 1.6 percentage points higher than those of DOICs. The directions of
both coefficients are consistent with the prediction and are significant at the 1% level,
suggesting that the results support hypotheses H1 and H2.
The coefficient for lnSales is positively significant at the 1% level in the EBIT/S
regression model but is negatively insignificant in the LTL_RP/TA regression model,
suggesting that firm size is significantly associated with profitability, but not long-term
liability to related parties.
The coefficient for CapInt is positive and significant at the 1% level, suggesting
that the more capital-intensive the company, the higher the level of long-term borrowings
from related parties.
The coefficient for Age is insignificant in the EBIT/S regression model, and only
significant at the 10% level in the LTL_RP/TA regression model, indicating that the
maturity level of the companies is not associated with the magnitude of the profitability
they report and the level of long-term borrowings from related parties.
The coefficients of Year for the EBIT/S model suggest that Indonesian companies
reported significantly less profits (before interest and tax) for 2011 to 2015 compared
with 2009. The magnitude of the gaps between 2009 and later years show an increasing
trend except 2014. The coefficients of Year for the LTL_RP/TA model do not show similar
pattern.
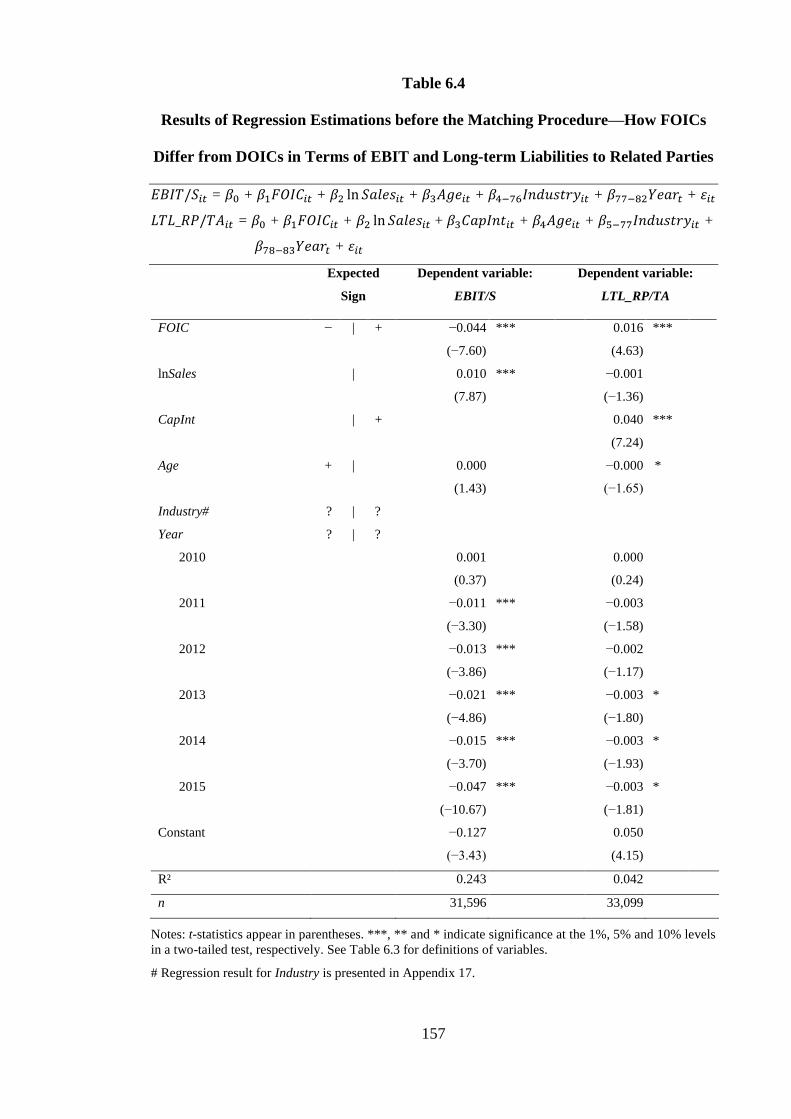
157
Table 6.4
Results of Regression Estimations before the Matching Procedure—How FOICs
Differ from DOICs in Terms of EBIT and Long-term Liabilities to Related Parties
𝐸𝐵𝐼𝑇/𝑆𝑖𝑡 = 𝛽0 + 𝛽1𝐹𝑂𝐼𝐶𝑖𝑡 + 𝛽2 ln 𝑆𝑎𝑙𝑒𝑠𝑖𝑡 + 𝛽3𝐴𝑔𝑒𝑖𝑡 + 𝛽4−76𝐼𝑛𝑑𝑢𝑠𝑡𝑟𝑦𝑖𝑡 + 𝛽77−82𝑌𝑒𝑎𝑟𝑡 + 𝜀𝑖𝑡
𝐿𝑇𝐿_𝑅𝑃/𝑇𝐴𝑖𝑡 = 𝛽0 + 𝛽1𝐹𝑂𝐼𝐶𝑖𝑡 + 𝛽2 ln 𝑆𝑎𝑙𝑒𝑠𝑖𝑡 + 𝛽3𝐶𝑎𝑝𝐼𝑛𝑡𝑖𝑡 + 𝛽4𝐴𝑔𝑒𝑖𝑡 + 𝛽5−77𝐼𝑛𝑑𝑢𝑠𝑡𝑟𝑦𝑖𝑡 +
𝛽78−83𝑌𝑒𝑎𝑟𝑡 + 𝜀𝑖𝑡
Expected
Sign
Dependent variable:
EBIT/S
Dependent variable:
LTL_RP/TA
FOIC
− | + −0.044
(−7.60)
*** 0.016
(4.63)
***
lnSales
| 0.010
(7.87)
*** −0.001
(−1.36)
CapInt
| + 0.040
(7.24)
***
Age
+ | 0.000
(1.43)
−0.000
(−1.65)
*
Industry# ? | ?
Year
2010
? | ?
0.001
(0.37)
0.000
(0.24)
2011 −0.011
(−3.30)
*** −0.003
(−1.58)
2012 −0.013
(−3.86)
*** −0.002
(−1.17)
2013 −0.021
(−4.86)
*** −0.003
(−1.80)
*
2014 −0.015
(−3.70)
*** −0.003
(−1.93)
*
2015 −0.047
(−10.67)
*** −0.003
(−1.81)
*
Constant −0.127
(−3.43)
0.050
(4.15)
R² 0.243 0.042
n 31,596 33,099
Notes: t-statistics appear in parentheses. ***, ** and * indicate significance at the 1%, 5% and 10% levels
in a two-tailed test, respectively. See Table 6.3 for definitions of variables.
# Regression result for Industry is presented in Appendix 17.

158
The regression results for the industry dummy variables can be found in Appendix
17. There are 74 industry groups in the final sample of both regression models. Industry
group 10 (food manufacturing industry) is the base industry. Of the 73 industry groups
represented by indicators or dummy variables, there are 35 (54) and 12 (1) industry groups
with significantly negative and positive coefficients, respectively for EBIT/S
(LTL_RP/TA) model. The coefficients of the remaining 26 (18) industry groups are
insignificantly different from zero.
Before the matching procedure, FOICs may concentrate in some industries, while
DOICs may concentrate in other industries. Different industries may have different
EBIT/S and different levels of capital intensity hence different degrees of reliance on
debts. Also, FOICs and DOICs may have different firm sizes and ages. Even though the
regression models before the matching procedure control for the effect of industry, firm
size and age, the coefficients for FOIC in the two regression models may still not be
reliable. Therefore, in Stage 2, the matching procedure described on pages 151 to 152 is
carried out to match an FOIC with a DOIC to derive a final sample of FOICs and DOICs
that are comparable in terms of industry, firm size, age (for both models) and capital
intensity (for the LTL_RP/TA model only) for paired t-tests and further regression
analyses.
Table 6.5 presents the key results of Stage 2 (i.e. after the matching procedure)
using the paired t-tests for both the EBIT/S and LTL_RP/TA models.

159
Table 6.5
Results of Paired t-tests after the Matching Procedure—How FOICs Differ from
DOICs in Terms of EBIT and Long-term Liabilities to Related Parties
Expected
Sign
Dependent variable:
EBIT/S
Dependent variable:
LTL_RP/TA
ATE—FOIC (1 vs 0) − | + −0.022 *** 0.009 ***
n: FOICs (treatment) 2,636 3,729
n: DOICs (control) 2,636 3,729
Notes: ***, ** and * indicate significance at the 1%, 5% and 10% levels in a two-tailed test, respectively.
ATE is the average treatment effect.
The paired t-tests compare 2,636 FOICs with 2,636 matched DOICs and show that
FOICs significantly report lower EBIT/S, which is consistent with hypothesis H1. The
result of the paired t-test for LTL_RP/TA also confirms that FOICs use greater long-
term liabilities to related parties after comparing 3,729 FOICs with 3,729 matched
DOICs, which is consistent with hypothesis H2. All results are significant at the 1%
level.
Table 6.6 presents the key results of the OLS regressions for both the EBIT/S and
LTL_RP/TA models after the matching procedure.

160
Table 6.6
Results of Regression Estimations after the Matching Procedure—How FOICs
Differ from DOICs in Terms of EBIT and Long-term Liabilities to Related
Parties
𝐸𝐵𝐼𝑇/𝑆𝑖𝑡 = 𝛽0 + 𝛽1𝐹𝑂𝐼𝐶𝑖𝑡 + 𝛽2 ln 𝑆𝑎𝑙𝑒𝑠𝑖𝑡 + 𝛽3𝐴𝑔𝑒𝑖𝑡 + 𝛽4−53𝐼𝑛𝑑𝑢𝑠𝑡𝑟𝑦𝑖𝑡 + 𝛽54−59𝑌𝑒𝑎𝑟𝑡+ 𝜀𝑖𝑡
𝐿𝑇𝐿_𝑅𝑃/𝑇𝐴𝑖𝑡 = 𝛽0 + 𝛽1𝐹𝑂𝐼𝐶𝑖𝑡 + 𝛽2 ln 𝑆𝑎𝑙𝑒𝑠𝑖𝑡 + 𝛽2𝐶𝑎𝑝𝐼𝑛𝑡𝑖𝑡 + 𝛽4𝐴𝑔𝑒𝑖𝑡 + 𝛽5−61𝐼𝑛𝑑𝑢𝑠𝑡𝑟𝑦𝑖𝑡
+ 𝛽62−67𝑌𝑒𝑎𝑟𝑡 + 𝜀𝑖𝑡
FOIC
− | + −0.027
(−3.85)
*** 0.009
(2.27)
**
lnSales
| 0.012
(4.97)
*** 0.000
(0.41)
CapInt
| + 0.054
(4.99)
***
Age
+ | 0.002
(3.16)
*** −0.000
(−1.48)
Industry# ? | ?
Year
2010
? | ?
−0.020
(−2.23)
**
−0.002
(−0.52)
2011 −0.024
(−2.91)
*** −0.003
(−0.69)
2012 −0.027
(−2.91)
*** −0.004
(−0.93)
2013 −0.023
(−2.29)
** −0.005
(−0.94)
2014 −0.031
(−3.23)
*** −0.005
(−1.06)
2015 −0.062
(−5.92)
*** −0.004
(−0.86)
Constant −0.184
(−2.76)
0.047
(1.72)
R² 0.085 0.050
n 5,272 7,458
Notes: t-statistics appear in parentheses. ***, ** and * indicate significance at the 1%, 5% and 10% levels
in a two-tailed test, respectively. See Table 6.3 for definitions of variables.
# Regression result for Industry is presented in Appendix 18.

161
The coefficients for FOIC after the PSM procedure are relatively consistent with
those before the PSM procedure. After the matching procedure, the coefficients indicate
that FOICs report EBIT/S of around 2.7 percentage points lower and LTL_RP/TA of nearly
one percentage point higher than those of their matched DOICs. The negative relationship
between FOIC and EBIT/S and the positive relationship between FOIC and LTL_RP/TA
indicate that FOICs use both transfer pricing and debt financing strategies to shift profits
out of Indonesia, which is consistent with the hypotheses and the results of Stage 1.
The coefficients of FOIC are significant at the 1% level and the 5% level for the
EBIT/S model and the LTL_RP/TA model, respectively. The fact that the significance
level of the EBIT/S model is higher than that of the LTL_RP/TA model suggests that
FOICs use transfer pricing more than debt financing as the main channel to shift profits
from Indonesia.
The coefficient for lnSales is positively significant at the 1% level in the EBIT/S
regression model but is insignificant in the LTL_RP/TA regression model, suggesting that
firm size is significantly associated with profitability, but not long-term liability to related
parties.
The coefficient for CapInt is positive and significant at the 1% level, which is
consistent with the prediction that the more capital-intensive the company, the higher the
level of long-term borrowings from related parties.
Consistent with the prediction, the coefficient for Age is positive and significant at
the 1% level in the EBIT/S regression model, indicating that more mature companies tend
to report higher profitability. The coefficient for Age is insignificant in the LTL_RP/TA
regression model, suggesting that the level of maturity is not associated with the level of
long-term borrowings from related parties.

162
After the matching procedure, there are 51 (58) industry groups in the final sample
of EBIT/S (LTL_RP/TA) model. Industry group 10 (food manufacturing industry) is the
base industry. Of the 50 (57) industry groups represented by indicators or dummy
variables, there are 21 (38) and 5 (0) industry groups with significantly negative and
positive coefficients, respectively for EBIT/S (LTL_RP/TA) model. The coefficients of
the remaining 24 (19) industry groups are insignificantly different from zero.
Finally, the coefficients of Year for the EBIT/S model suggest that Indonesian
companies reported less profits (before interest and tax) in later years compared with
2009, and the gaps between 2009 and the later years show an increasing trend except
2013. These results are consistent with the results of the previous two studies of this thesis
as well as the decreasing trend of CIT contribution to total tax revenue depicted in Figure
2.4. As discussed in subsection 4.4.2, in the case of FOICs, decreasing EBIT to sales ratio
may indicate increasing profit shifting by transfer pricing. These results provide further
evidence that a lack of effective action taken by the Indonesian government after joining
the BEPS project in 2013 may have led to an escalation of transfer pricing activities by
FOICs.
The coefficients of Year for the LTL_RP/TA model do not show similar pattern.
6.5 Chapter Summary
In an attempt to identify the channels used by FOICs (i.e., Indonesian affiliates of
foreign MNEs) to shift profits, this study compares the FOICs with comparable DOICs
in terms of two indicators. First, it uses EBIT/S to examine whether FOICs use transfer
pricing to shift profits from Indonesia resulting in a lower EBIT to sales ratio compared
to DOICs. By using EBIT/S as the proxy, this study examines transfer pricing in a broad
sense to cover not only purchases and sales of goods, but also services (e.g., management
163
services and technical advice) and the right or licence to use associates’ properties (e.g.,
land and building—rent, intellectual properties—royalties). Second, it uses LTL_RP/TA
to assess whether FOICs use intra-group debt financing to shift profits out of Indonesia.
Restricting long-term liabilities to related parties only is in line with this study’s aim to
investigate profit shifting by Indonesian affiliates of foreign MNEs.
Using the PSM technique to generate a sample that contains a matched DOIC for
each FOIC, this study conducts paired t-tests and OLS regressions and finds that FOICs
report significantly lower EBIT/S and significantly higher LTL_RP/TA relative to
comparable DOICs, indicating that FOICs use both transfer pricing and debt financing as
their profit shifting strategies to avoid Indonesian income tax. The results also indicate
that FOICs use transfer pricing as the primary strategy rather than debt financing to avoid
Indonesian CIT, similarly to the findings of Egger, et al. (2010).
This study is arguably the first study to use information reported by Indonesian
companies in their tax returns to investigate profit shifting channels used by MNEs
operating in Indonesia—a developing country—using domestic-owned companies as a
control group. Therefore, the results of this study not only corroborate the suggestion of
prior studies that developing countries may suffer from profit shifting strategies adopted
by foreign MNEs, but they also fill a gap in the literature by providing empirical evidence
of how MNEs shift profits out of a developing country.
The results of this study indicate that the Indonesian government may need to
improve its transfer pricing and debt financing regulations to curtail the profit shifting
activities of FOICs that have been ongoing since the completion of the Indonesian tax
administration reform in 2009.

164
CHAPTER 7:
SUMMARY AND CONCLUSION
7.1 Overview and Conclusions of the Thesis
The more globally integrated economy, aggravated by the escalating expertise of
tax planners in recognising and exploiting legal arbitrage opportunities and boundaries of
acceptable tax planning, gives MNEs more confidence in taking aggressive tax positions
(OECD, 2013c). Tax rules that do not keep pace with today’s business environment
exacerbate the circumstances. In particular, MNEs are alleged to avoid taxes by shifting
their profits to low-tax jurisdictions. For example, in the past few years, media around the
world have alleged that giant MNEs such as Google, Starbucks, McDonalds, Amazon and
Apple have used cross-border profit shifting strategies to reduce their tax burdens. These
tax avoidance strategies are known as BEPS.
The issue of profit shifting to low-tax jurisdictions by MNEs has been discussed in
profit shifting literature for decades. In particular, in the past few years, the issue has
attracted considerable global attention. Financial media, tax authorities, international
institutions—notably the OECD—and global forums—notably the G20—have expressed
their concerns about tax avoidance strategies used by MNEs as a means of shifting profits
(Kelley, Koontz, & Kadet, 2016). According to Beuselinck, et al. (2015), the reason
behind these concerns is that people now better understand that MNEs operate
internationally and that cross-border business operations allow them to exploit tax system
differences between countries to decrease their overall corporate tax burden.
A theory that explains why MNEs establish subsidiaries overseas is the OLI
framework introduced by Dunning (1977). According to the OLI framework, MNEs have
advantages over companies that operate at the domestic level because MNEs have more

165
power, such as patents, trademarks, international reputation (ownership), more flexibility
to choose locations for better access to customers, lower tariffs (location) and, most
importantly, more opportunities to set up intra-firm prices and processes (internalisation).
Many empirical studies have discussed the cross-border profit shifting phenomenon
from the perspective of developed countries. Most of these studies find that MNEs avoid
income tax in the host country by shifting their profits to low-tax jurisdictions. Some
studies have focused on finding the ways in which MNEs shift their profits. These studies
have identified two main channels that are most commonly used: transfer pricing and debt
financing. Profit shifting by means of transfer pricing and debt financing are two good
examples of internalisation of the OLI framework.
Transfer pricing is a tax avoidance strategy that allows MNEs to suppress revenue
and/or inflate expenses in a high-tax country by setting certain prices for intra-firm
transactions. Debt financing is another tax avoidance strategy that allows MNEs to record
high interest expense in a high-tax country by financing their business activities using
debt rather than equity. The final goal of these cross-border tax avoidance strategies is to
reduce the MNEs’ global tax liability.
Indonesia has undertaken two major tax reforms. First, the 1983 tax reform
successfully transformed the taxation system in Indonesia from a complicated and old-
fashioned structure into a simpler, technology-based system. Second, the 2002 tax
administration reform drastically improved the taxation business process from slow and
error-prone tax file recording and inefficient human resources into more reliable data
provisions and more professional tax officials. Nevertheless, taxation in Indonesia has
still been overshadowed by a low tax-to-GDP ratio (i.e., the proportion of GDP collected
by the government as tax revenue) and low tax compliance (i.e., many people do not
follow the law). Moreover, Indonesian tax law does not have effective provisions for

166
dealing with international taxation—particularly transfer pricing and debt financing
provisions.
The fact that the Indonesian taxation system appears to suffer from a lack of
capability—both institutionally and legally—makes the country vulnerable to tax
avoidance attacks, including cross-border profit shifting strategies. In fact, there is a
strong indication that Indonesia is suffering from MNEs’ profit shifting strategies. For
example, two Indonesian finance ministers stated that thousands of FOICs (i.e., entities
through which foreign MNEs operate in Indonesia) have not paid income tax for many
years and that those companies have used transfer pricing to avoid paying tax.
However, only a few empirical studies on profit shifting by MNEs have used data
from developing countries. Moreover, existing studies that focus on developing countries
are deemed to have a doubtful quality because they are not peer-reviewed. In the case of
Indonesia, while there have been strong allegations that Indonesian affiliates of foreign
MNEs have been using cross-border profit shifting strategies to avoid Indonesian CIT for
many years, there are no peer-reviewed studies about the existence of profit shifting by
MNEs in the country.
This thesis attempts to fill this gap in the literature by choosing Indonesia as the
focus of the study. In addition to the strong allegations that FOICs shift profits out of
Indonesia, the fact that Indonesia is a major developing economy makes it suitable to be
the focus of this thesis. Further, none of the few existing studies that focus on developing
countries have used tax return data which is deemed to help tax researchers provide more
reliable evidence of the presence of BEPS. This thesis uses confidential income tax return
data for the period 2009–2015 from the DGT (the Indonesian tax authority) to investigate
the issue of profit shifting in Indonesia.

167
Through BEPS, MNEs reduce their TI and book/accounting income
simultaneously, which makes BEPS a book-tax conforming tax avoidance strategy
(Hanlon & Heitzman, 2010). Therefore, profit in this thesis is represented by two
measurements. In addition to TI as the main measurement of profit based on tax law
reported by FOICs in their Indonesian tax returns, this thesis uses AP based on financial
reporting standards, which is also reported by FOICs in their Indonesian tax returns.
The empirical evidence provided by this thesis is expected to fill the gap in the
literature. Specifically, this thesis attempts to detect the existence of profit shifting by
FOICs and identify how FOICs shift their profits out of Indonesia by conducting three
related studies.
Study 1 tests whether FOICs shift profits out of Indonesia by examining the effect
of the difference in STR between the source country of investment and Indonesia (i.e.,
the STR of the parent’s country of the FOIC minus Indonesian STR) on TI and AP (both
scaled by total sales) reported by FOICs in their Indonesian tax returns. The regression
results show that the lower the parent’s STR, the lower the TI and AP reported by FOICs.
This provides evidence that is consistent with FOICs shifting profits to low-tax countries.
This empirical result is consistent with profit shifting occurring in Indonesia.
Study 2 further investigates whether FOICs shift profits out of the country by
following an approach introduced by Hines and Rice (1994) based on the Cobb–Douglas
production function with some modifications. The HRA has been widely used by studies
that focus on detecting the presence of cross-border profit shifting by MNEs. Again, this
study uses both AP and TI reported by FOICs in their Indonesian confidential tax return
data supplied by the Indonesian tax authority. After analysing a final sample of more than
3,000 firm-year observations, this study finds that one percentage point lower tax rate of

168
the parent’s country is associated with a 2.56% decrease in the AP and a 2.89% decrease
in the TI reported by FOICs to the Indonesian tax authority.
Study 3 attempts to provide more direct evidence of the existence of cross-border
profit shifting in Indonesia by investigating whether FOICs use the two most commonly
used channels to shift profits: transfer pricing and intra-group debt financing. This can be
done by comparing FOICs with comparable DOICs using two profit shifting indicators:
(1) EBIT scaled by total sales as the proxy to capture profit shifting using the transfer
pricing channel; and (2) long-term debt to related parties scaled by total assets as the
proxy to capture profit shifting using the intra-group debt financing channel. Study 3 uses
the PSM technique to match a DOIC to an FOIC. The final sample that contains the
matched FOICs and DOICs is then analysed using paired t-tests and OLS regressions.
The results show that while FOICs use both channels to shift profits, transfer pricing plays
a more significant role than that of debt financing.
The results for the year fixed effects that are included in the regression models of
the three studies in this thesis suggest some changes in the behaviour of FOICs in
reporting their TI to the Indonesian tax authority during the study period. Compared with
2009, FOICs reported significantly less TI up to 2012, similar TI in 2013 and 2014, and
the lowest TI in 2015. In the absence of any downturn of macroeconomic conditions and
significant changes in the tax system during 2009–2015, a possible explanation for the
changes in the behaviour of FOICs is because Indonesia, as one of the G20 countries,
took part in the OECD/G20 BEPS project from 2013, so in 2013 and 2014 FOICs held
back their trend of reporting less and less TI. FOICs resumed their trend of reporting less
TI in Indonesia in 2015 because the Indonesian government did not take effective action
after joining the BEPS project in 2013.

169
In conclusion, this thesis provides empirical evidence consistent with the profit
shifting occurring in Indonesia. Moreover, this thesis finds that FOICs use transfer pricing
and, to a lesser extent, debt financing as the channels to shift profits out of Indonesia.
Therefore, Indonesia needs to take effective action to fight profit shifting by FOICs to
reduce the revenue erosion from the CIT sector.
7.2 Contributions of the Study
This thesis is one of the first empirical studies to examine the incidence of profit
shifting in a developing country by analysing the corporate tax return data obtained from
the tax authority of Indonesia. The empirical results provided by this thesis are therefore
expected to contribute to the knowledge of international tax avoidance and tax
administration practice. Specifically, this thesis is expected to fill the gap in the BEPS
literature in at least two ways. First, this thesis is one of the first studies to use firm-level
data to examine the existence of profit shifting tax avoidance strategies by MNEs in a
developing economy. Dharmapala (2014a) argues that using a firm-year dataset rather
than an aggregate country-level dataset enhances the credibility of BEPS estimation.
Consistent with Dharmapala (2014a), the Organisation for Economic Co-operation and
Development (2015a, p. 28) states that using firm-level data is important because ‘firm-
level data is needed for the best analysis of BEPS’. Therefore, this thesis not only fills the
gap in the literature, but is also expected to provide more reliable evidence of BEPS from
the perspective of Indonesia.
Second, this thesis uses Indonesian confidential tax return data supplied by the
DGT. The OECD (2015a) states that, unlike publicly available financial databases that
can only capture the presence of BEPS indirectly, tax return data can provide more

170
reliable information about the incidence of BEPS.86 By using tax return data, the findings
of this thesis are expected to provide more reliable results and facilitate a deeper
understanding of the BEPS issue, especially from the perspective of a developing country.
The data used in this thesis are expected to be reliable because they are related to the years
2009–2015 and were recorded after the completion of the 2002 tax administration reform.
This thesis also contributes to tax administration practices in Indonesia by providing
evidence of the characteristics of profit shifting in this developing country. The empirical
evidence provided by this thesis is expected to help policymakers improve the tax system
in general and profit shifting supervision in particular.
7.3 Limitations of the Study
This thesis contains at least two limitations. The first limitation concerns
determinants other than tax rate differences that may encourage MNEs to shift profits.
Dharmapala and Riedel (2013) note that cross-border profit shifting activities are
perceived to be the main threat to the tax base of high-tax economies around the world.
However, they observe that the existing literature generally employs indirect
identification methods to evaluate profit shifting behaviour by assessing firm responses
(e.g., adjustments in reported pre-tax profitability, intra-firm transfer prices, debt–equity
structure) to changes in the corporate tax rate or the difference in tax rates between home
and host countries. Identification is therefore based on rather infrequent changes in STRs,
which are difficult to differentiate from contemporaneous fluctuations of other dynamics
in the home and/or host country, such as political, social and economic environments.
Dharmapala and Riedel (2013) also underline that changes in tax rates may confound the
86 However, the OECD (2015a, p. 22) observes that tax return data ‘is not a panacea for all the problems
facing an analysis of BEPS’.

171
profit shifting estimation because such changes can influence other profitability factors
such as management efforts. This study potentially contains the above weaknesses.
Second, this thesis does not capture profit shifting to a third country. Let us take
Apple, a giant multinational information technology company, as an example. Apple Inc.
(US) owns Apple (China) and Apple Operations International (AOI, Ireland). AOI
(Ireland) controls Apple (Indonesia). Therefore, the immediate parent of Apple Indonesia
is AOI (Ireland) and the ultimate parent is Apple Inc. (US). While the US (i.e., the third
country) may play an important role in shifting profits from Indonesia to Ireland,
comparing the tax rates between Ireland and Indonesia is more appropriate than
comparing the tax rates between the US and Indonesia. Thus, this study uses the tax rate
differences between the ultimate parent’s country and Indonesia. In the case of Apple,
this thesis uses the tax rate differences between Ireland and Indonesia to detect whether
Apple (Indonesia) shifts profits out of Indonesia to Ireland. Figure 7.1 uses Apple to
illustrate the scope of Study 1.
Figure 7.1
Scope of the Study
Control Control
Control
Flow of income Flow of goods
Apple Inc.
(USA)
AOI
(Ireland)
Apple
(China)
Apple
(Indonesia)
172
In profit shifting strategies, the ultimate parent establishes an immediate parent to
be used as an SPV to shift profits from a host country by exploiting the low tax rate in the
country of the immediate parent. For example, the CIT rate in Ireland is 12.5%, which is
much lower than the CIT rate in the US and Indonesia (40% and 25%, respectively). In
the case of Apple, AOI does not pay any tax because the company is not a resident of
Ireland, as the Irish definition of corporate tax residence is determined solely by the
location of a company’s central management and control. Further, AOI is not a resident
of the US because US tax law defines the residence of a company solely in terms of the
place of incorporation (Ting, 2014). Therefore, while the possibility of shifting profits to
a third country exists, focusing on the STR differences between the immediate parent’s
country (Ireland) and the host country (Indonesia) to examine whether FOICs (Apple
Indonesia) shift profits is reasonable and will cover profit shifting in most cases.
7.4 Future Research
This thesis provides empirical evidence that Indonesia suffers from profit shifting
by foreign MNE affiliates operating in Indonesia by analysing tax return data from 2009
to 2015. Since 2016, Indonesia has taken action to fight profit shifting activities. In
addition, according to some experts, Indonesia is likely to adopt a general anti-avoidance
rule soon (Shelepov, 2017). Among other actions, Indonesia has made two major
improvements. First, Indonesia introduced Finance Minister Regulation No. 169 (PMK
169), which came into effect on 1 January 2016. The new rule partially reflects the
recommendations of the OECD BEPS Action 4 (interest deductions). The word ‘partially’
is used because PMK 169 is basically a thin capitalisation rule based on a debt-to-equity
approach rather than the fixed or group ratio endorsed by BEPS Action 4. Second,
following PMK 169, Finance Minister Regulation No. 213 (PMK 213) was introduced

173
and came into effect on 30 December 2016. PMK 213, which regulates transfer pricing
documentation, is in line with BEPS Action 13 (Viray, 2017), which requires
(1) taxpayers to keep the three-tiered transfer pricing documentation—namely the master
file, the local file and the country-by-country report; and (2) the tax authority to specify
the types of additional documents and information regarding related party transactions
that taxpayers must keep.
These developments are examples of how the Indonesian government is trying to
keep pace with today’s business environment, which is characterised with progressive
development, and to catch up with the rapid tax avoidance strategies used by FOICs. The
newly introduced regulations are important events subsequent to the period of study
covered in this thesis because they came into effect after 2015. It has been a typical issue
in Indonesia that most regulations are implemented without adequate research. Therefore,
ongoing research is needed to further examine whether the newly introduced profit
shifting regulations will reduce the magnitude of profit shifting in Indonesia. The results
of the research will provide insights into whether the government should fully or partially
implement the recommendations listed in the BEPS Action Plan given that it partially
adopted the recommendations advocated by BEPS Action 4 (interest deductions), but
fully adopted BEPS Action 13 (transfer pricing documentation).
7.5 Concluding Remarks
This thesis confirms that Indonesia—a developing country—suffers from profit
shifting strategies by foreign MNEs. Further, this thesis provides empirical evidence of
how FOICs shift profits from Indonesia. Previous studies suggest that MNEs use two
channels to shift profits: transfer pricing and debt financing. Indonesia is not an exception.
This thesis indicates that FOICs (i.e., Indonesian affiliates of foreign MNEs) also use

174
transfer pricing and debt financing as the channels to shift profits from Indonesia.
However, in the case of Indonesia, transfer pricing plays a more important role than debt
financing. By focusing on a developing country, the empirical evidence provided by this
thesis is expected to contribute to efforts to provide a clear picture of cross-border profit
shifting by MNEs operating in developing countries.
Similarly to policymakers in other developing countries, the Indonesian
government appears to encounter difficulties in controlling profit shifting by foreign
MNE affiliates. According to Dourado (2015), developing countries face difficulties in
addressing profit shifting issues and joining tax cooperation because they lack technical
and human resources. This is likely to be the source of the problem in Indonesia, and the
country should start taking action to overcome the problem; otherwise, profit shifting by
MNEs will continue to erode the government’s revenue from the CIT sector.

175
REFERENCES
Allingham, M. G., & Sandmo, A. (1972). Income tax evasion: A theoretical analysis.
Journal of Public Economics, 1(3), 323–338.
Arnold, J. (2012). Improving the tax system in Indonesia (OECD Economics Department
Working Paper No. 998): Paris, France: Organisation for Economic Co-Operation and
Development.
Asher, M. G. (1997). Reforming the tax system in Indonesia. In W. Thirsk (Ed.), Tax
reform in developing countries (Vol. 235, pp. 127–166). Washington, DC: World Bank.
Badan Pusat Statistik. (2013). Pendapatan nasional Indonesia. National income of
Indonesia 2009–2012. (Catalog : 9301001). Jakarta, Indonesia: Author.
Badan Pusat Statistik. (2015). Pendapatan nasional Indonesia. National income of
Indonesia 2010–2014. (Catalog : 9301501). Jakarta, Indonesia: Author.
Badan Pusat Statistik. (2017a). Pendapatan nasional Indonesia. National income of
Indonesia 2012–2016. (Catalog : 9301001). Jakarta, Indonesia: Author.
Badan Pusat Statistik. (2017b). Statistical Yearbook of Indonesia 2017. (Catalog :
1101001). Jakarta, Indonesia: Author.
Baker, R. W. (2005). Capitalism's Achilles heel: Dirty money and how to renew the free-
market system: Hoboken, NJ: Wileys.
Bank Indonesia. (2016). 2015 Economic Report on Indonesia. Jakarta, Indonesia: Author.
Bartelsman, E. J., & Beetsma, R. M. (2003). Why pay more? Corporate tax avoidance
through transfer pricing in OECD countries. Journal of Public Economics, 87(9), 2225–
2252.
Bastin, L. (2014). Transfer pricing and the WTO. Journal of World Trade, 48(1), 59–80.
Beer, S., & Loeprick, J. (2015). Profit shifting: Drivers of transfer (mis) pricing and the
potential of countermeasures. International Tax and Public Finance, 22(3), 426–451.
Bernard, A. B., Jensen, J. B., & Schott, P. K. (2006). Transfer pricing by US-based
multinational firms (NBER Working Paper No. 12493). Cambridge, MA: National
Bureau of Economic Research.

176
Bernard, J.-T., & Weiner, R. J. (1990). Multinational corporations, transfer prices, and
taxes: Evidence from the US petroleum industry. In A. Razin & J. Slemrod (Eds.),
Taxation in the global economy (pp. 123–160): Chicago, IL: University of Chicago Press.
Beuselinck, C., Deloof, M., & Vanstraelen, A. (2015). Cross-jurisdictional income
shifting and tax enforcement: Evidence from public versus private multinationals. Review
of Accounting Studies, 20(2), 710–746.
Blaylock, B., Shevlin, T., & Wilson, R. J. (2011). Tax avoidance, large positive temporary
book-tax differences, and earnings persistence. The Accounting Review, 87(1), 91–120.
British Broadcasting Corporation. (2016, 24 May). Google’s Paris HQ raided in tax
probe. Retrieved from http://www.bbc.com/news/business-36370628.
Buettner, T., & Wamser, G. (2007) Intercompany loans and profit shifting: Evidence from
company-level data (CESifo Working Paper Series No. 1959). Munich, Germany: Center
for Economic Studies and Ifo Institute: CESifo GmbH.
Buettner, T., & Wamser, G. (2013). Internal debt and multinational profit shifting:
Empirical evidence from firm-level panel data. National Tax Journal, 66(1), 63–95.
Buettner, T., Overesch, M., Schreiber, U., & Wamser, G. (2012). The impact of thin-
capitalization rules on the capital structure of multinational firms. Journal of Public
Economics, 96(11), 930–938.
Buslei, H., & Simmler, M. (2012) The impact of introducing an interest barrier: Evidence
from the German corporation tax reform 2008 (DIW Berlin Discussion Paper No. 1215).
Berlin, Germany: DIW Berlin.
Chari, A., Chen, W., & Dominguez, K. M. E. (2012). Foreign ownership and firm
performance: Emerging market acquisitions in the United States. IMF Economic Review,
60(1), 1–42.
Chen, K.-P., & Chu, C. Y. C. (2005). Internal control versus external manipulation: A
model of corporate income tax evasion. RAND Journal of Economics, 36(1), 151–164.
Chrisafis, A., & Garside, J. (2016, May 25). Google offices raided in Paris as prosecutors
announce fraud probe. Retrieved from
https://www.theguardian.com/technology/2016/may/24/google-offices-paris-raided-
french-tax-authorities.
Christian Aid. (2009). False profits: Robbing the poor to keep the rich tax-free. London,
England: Author.
Christian, C., & Schultz, T. (2005). ROA-based estimates of income shifting by US
multinational corporations IRS Research Bulletin: Recent Research on Tax

177
Administration and Compliance-Proceedings of the 2005 IRS Research Conference (pp.
57–72). Washington, DC: IBM Business Consulting Services.
Clausing, K. A. (2003). Tax-motivated transfer pricing and US intrafirm trade prices.
Journal of Public Economics, 87(9), 2207–2223.
Clausing, K. A. (2009). Multinational firm tax avoidance and tax policy. National Tax
Journal, 62(4), 703–725.
Clausing, K. A. (2011, March 28). The revenue effects of multinational firm income
shifting. Tax Notes, 130, 1580–1586.
Clausing, K. A. (2016). The Effect of Profit Shifting on the Corporate Tax Base in the
United States and Beyond. National Tax Journal, 69(4), 905–934.
Cobham, A. (2005). Tax evasion, tax avoidance and development finance (QEH Working
Paper Series No. 129). Oxford, England: University of Oxford.
Collins, J., Kemsley, D., & Lang, M. (1998). Cross-jurisdictional income shifting and
earnings valuation. Journal of Accounting Research, 36(2), 209–229.
Copithorne, L. W. (1971). International corporate transfer prices and government policy.
The Canadian Journal of Economics/Revue canadienne d'Economique, 4(3), 324–341.
Crivelli, E., De Mooij, R. A., & Keen, M. M. (2015). Base Erosion, Profit Shifting and
Developing Countries. Washington, DC: International Monetary Fund.
Crocker, K. J., & Slemrod, J. (2005). Corporate tax evasion with agency costs. Journal
of Public Economics, 89(9), 1593–1610.
De Boyrie, M. E., Pak, S. J., & Zdanowicz, J. S. (2005). Estimating the magnitude of
capital flight due to abnormal pricing in international trade: The Russia–USA case.
Accounting Forum, 29(3), 249–270.
De Simone, L. (2016). Does a common set of accounting standards affect tax-motivated
income shifting for multinational firms? Journal of Accounting and Economics, 61(1),
145–165.
Desai, M. A., & Dharmapala, D. (2009). Corporate tax avoidance and firm value. Review
of Economics and Statistics, 91(3), 537–546.
Desai, M. A., Dyck, A., & Zingales, L. (2007). Theft and taxes. Journal of Financial
Economics, 84(3), 591–623.
Desai, M. A., Foley, C. F., & Hines, J. R. (2006). The demand for tax haven operations.
Journal of Public Economics, 90(3), 513–531.

178
Dharmapala, D. (2014a). What do we know about base erosion and profit shifting? A
review of the empirical literature. Fiscal Studies, 35(4), 421–448.
Dharmapala, D. (2014b). Base erosion and profit shifting: A simple conceptual
framework (Coase-Sandor Institute for Law & Economics Working Paper No. 703).
Chicago, IL: University of Chicago.
Dharmapala, D., & Riedel, N. (2013). Earnings shocks and tax-motivated income-
shifting: Evidence from European multinationals. Journal of Public Economics, 97, 95–
107.
Directorate General of Tax. (2009) Sunset policy. 2008 annual report. Jakarta, Indonesia:
Author.
Directorate General of Tax. (2010) Serving with heart to achieve a self-sufficient nation.
2009 annual report. Jakarta, Indonesia: Author.
Directorate General of Tax. (2011) DGT’s efforts in reforming the bureaucracy and
winning the people’s heart. 2010 annual report. Jakarta, Indonesia: Author.
Directorate General of Tax. (2013) Harmonization in building the nation. 2012 annual
report. Jakarta, Indonesia: Author.
Directorate General of Tax. (2015a). DJP sukses hentikan tren rugi perusahaan
multinasional Retrieved September 28 from http://www.pajak.go.id/content/article/djp-
sukses-hentikan-tren-rugi-perusahaan-multinasional#.VgovATUwrF0.twitter.
Directorate General of Tax. (2015b) Upholding the spirit of revitalization for integrated
transformation. 2014 annual report. Jakarta, Indonesia: Author.
Directorate General of Tax. (2016a) The guidance year of taxpayers compliance:
Building a culture of tax compliance. 2015 annual report. Jakarta, Indonesia: Author.
Directorate General of Tax. (2016b). Sambut tahun penegakan hukum, Ditjen Pajak kini
punya 3 direktorat baru Retrieved from http://www.pajak.go.id/content/article/sambut-
tahun-penegakan-hukum-ditjen-pajak-kini-punya-3-direktorat-baru.
Dourado, A. P. (2015). The base erosion and profit shifting initiative under analysis.
Intertax, 43(1), 2.
Dowd, T., Landefeld, P., & Moore, A. (2017). Profit shifting of U.S. multinationals.
Journal of Public Economics, 148(Suppl C), 1–13.
Dunning, J. H. (1977). Trade, location of economic activity and the MNE: A search for
an eclectic approach. In P.-O. Hesselborn, B. Ohlin & P. M. Wijkman (Eds.), The

179
international allocation of economic activity (pp. 395–418): London, England: Palgrave
Macmillan.
Dyreng, S. D., Hanlon, M., & Maydew, E. L. (2008). Long-run corporate tax avoidance.
The Accounting Review, 83(1), 61–82.
Eden, L. (1983). Transfer pricing policies under tariff barriers. The Canadian Journal of
Economics, 16(4), 669–685.
Egger, P., Eggert, W., & Winner, H. (2010). Saving taxes through foreign plant
ownership. Journal of International Economics, 81(1), 99–108.
Frank, M. M., Lynch, L. J., & Rego, S. O. (2009). Tax reporting aggressiveness and its
relation to aggressive financial reporting. The Accounting Review, 84(2), 467–496.
Friedman, M. (2007). The social responsibility of business is to increase its profits. In W.
C. Zimmerli, K. Richter & M. Holzinger (Eds.), Corporate ethics and corporate
governance (pp. 173–178): Berlin, Germany: Springer.
Fuest, C., & Riedel, N. (2009). Tax evasion, tax avoidance and tax expenditures in
developing countries: A review of the literature. Report prepared for the UK Department
for International Development (DFID). Oxford, England: Oxford University Centre for
Business Taxation.
Fuest, C., & Riedel, N. (2010). Tax evasion and tax avoidance in developing countries:
The role of international profit shifting (Oxford University Centre for Business Taxation
Working Paper 10/12). Oxford, England: Oxford University.
Fuest, C., & Riedel, N. (2012). Tax evasion and tax avoidance: The role of international
profit shifting. In P. Reuter (Ed.), Draining development? Controlling Flows of Illicit
Funds from Developing Countries (pp. 109–142): Washington, DC: World Bank.
Gillis, M. (1985). Micro and macroeconomics of tax reform: Indonesia. Journal of
Development Economics, 19(3), 221–254.
Gordon, R. H., & Hines, J. R. (2002). International taxation. In A. J. Auerbach & M.
Feldstein (Eds.), Handbook of public economics (Vol. 4, pp. 1935–1995). Amsterdam,
Netherlands: North Holland.
Gramlich, J. D., & Wheeler, J. E. (2003). How Chevron, Texaco, and the Indonesian
government structured transactions to avoid billions in US income taxes. Accounting
Horizons, 17(2), 107–122.
Gravelle, J. G. (2010). Tax havens: International tax avoidance and evasion. Washington,
DC: Congressional Research Service.

180
Grubert, H. (1998). Another look at the low taxable income of foreign-controlled
companies in the United States Proceedings. Annual Conference on Taxation and
Minutes of the Annual Meeting of the National Tax Association (pp. 157–175).
Washington, DC: National Tax Association.
Grubert, H. (2003). Intangible income, intercompany transactions, income shifting, and
the choice of location. National Tax Journal, 56(1), 221–242.
Grubert, H. (2012). Foreign taxes and the growing share of US multinational company
income abroad: Profits, not sales, are being globalized. National Tax Journal, 65(2), 247–
281.
Grubert, H., & Mutti, J. (1991). Taxes, tariffs and transfer pricing in multinational
corporate decision making. The Review of Economics and Statistics, 73(2), 285-293.
Grubert, H., & Slemrod, J. (1998). The effect of taxes on investment and income shifting
to Puerto Rico. Review of Economics and Statistics, 80(3), 365–373.
Halperin, R., & Srinidhi, B. (1987). The effects of the US income tax regulations' transfer
pricing rules on allocative efficiency. The Accounting Review, 62(4), 686–706.
Hanlon, M., & Heitzman, S. (2010). A review of tax research. Journal of Accounting and
Economics, 50(2), 127–178.
Harris, D. G. (1993). The impact of US tax law revision on multinational corporations'
capital location and income-shifting decisions. Journal of Accounting research,
31(Suppl.), 111–140.
Harris, D., Morck, R., & Slemrod, J. B. (1993). Income shifting in US multinational
corporations. In A. Giovannini, R. G. Hubbard & J. Slemrod (Eds.), Studies in
international taxation (pp. 277–308). Chicago, IL: University of Chicago Press.
Hines Jr, J. R. (1999). Lessons from behavioral responses to international taxation.
National Tax Journal, 52(2), 305–322.
Hines, J. R., & Rice, E. M. (1994). Fiscal paradise: Foreign tax havens and American
business. The Quarterly Journal of Economics, 109(1), 149–182.
Hjelmgaard, K. (2016, May 24). Reports: Google's offices in Paris raided. Retrieved from
https://www.usatoday.com/story/tech/2016/05/24/google-search-tech-giants-paris-
offices-raided-report-says/84838756/.
Hoechle, D. (2007). Robust standard errors for panel regressions with cross-sectional
dependence. The Stata Journal, 7(2), 281–312.

181
Hong, Q., & Smart, M. (2010). In praise of tax havens: International tax planning and
foreign direct investment. European Economic Review, 54(1), 82–95.
Horst, T. (1971). The theory of the multinational firm: Optimal behavior under different
tariff and tax rates. The Journal of Political Economy, 1059–1072.
Houston, J., & Tran, A. (2001). A survey of tax evasion using the randomized response
technique. Advances in Taxation, 13, 69–94.
Huizinga, H., & Laeven, L. (2008). International profit shifting within multinationals: A
multi-country perspective. Journal of Public Economics, 92(5), 1164–1182.
Huizinga, H., Laeven, L., & Nicodeme, G. (2008). Capital structure and international debt
shifting. Journal of Financial Economics, 88(1), 80–118.
Indonesian Ministry of Finance. (2010) Laporan keuangan pemerintah pusat 2009—
Audited (The 2009 central government financial statements—Audited). Jakarta,
Indonesia: Author.
Indonesian Ministry of Finance. (2011) Transformasi, lebih bernilai (Transformation,
more valuable), annual report 2010. Jakarta, Indonesia: Author.
Indonesian Ministry of Finance. (2015). DJP tegaskan perusahaan asing agar tak lakukan
penghindaran pajak. Jakarta, Indonesia: Author.
International Monetary Fund. (2014a). Indonesia: Tax policy and administration setting
a strategy for the coming years. Washington, DC: Fiscal Affairs Department,
International Monetary Fund.
International Monetary Fund. (2014b). Spillovers in international corporate taxation
(IMF Policy Paper). Washington, DC: Author.
Jacob, J. (1996). Taxes and transfer pricing: Income shifting and the volume of intrafirm
transfers. Journal of Accounting Research, 34(2), 301–312.
James, S., & Alley, C. (2002). Tax compliance, self-assessment and tax administration.
Journal of Finance and Management in Public Services, 2(2), 27–42.
Janský, P., & Kokeš, O. (2015). Corporate tax base erosion and profit shifting out of the
Czech Republic. Post-Communist Economies, 27(4), 537–546.
Janský, P., & Prats, A. (2015). International profit‐shifting out of developing countries
and the role of tax havens. Development Policy Review, 33(3), 271–292.
Jefriando, M. (2013, April 12). Wah, Agus Marto sebut 4.000 perusahaan sudah 7 tahun
tak bayar pajak. Retrieved from

182
http://finance.detik.com/read/2013/04/12/170450/2218976/4/wah-agus-marto-sebut-
4000-perusahaan-sudah-7-tahun-tak-bayar-pajak.
Jefriando, M. (2015, January 14). 4.000 perusahaan milik asing di RI tak pernah bayar
pajak. Retrieved from https://finance.detik.com/berita-ekonomi-bisnis/d-2803808/4000-
perusahaan-milik-asing-di-ri-tak-pernah-bayar-pajak.
Jenkins, G. P., & Wright, B. D. (1975). Taxation of income of multinational corporations:
The case of the United States petroleum industry. The Review of Economics and Statistics,
57(1), 1–11.
Jensen, M. C., & Meckling, W. H. (1976). Theory of the firm: Managerial behavior,
agency costs and ownership structure. Journal of Financial Economics, 3(4), 305–360.
Johannesen, N., Tørsløv, T., & Wier, L. (2016). Are less developed countries more
exposed to multinational tax avoidance? Method and evidence from micro-data (WIDER
Working Paper No. 2016/10). Helsinki, Finland: World Institute for Development
Economics Research.
Julio, B., & Yook, Y. (2016). Policy uncertainty, irreversibility, and cross-border flows
of capital. Journal of International Economics, 103, 13–26.
Kelley, T. J., Koontz, D. L., & Kadet, J. M. (2016). Profit shifting: Effectively connected
income and financial Statement risks. Journal of Accountancy, 221(2), 48–55.
Kind, H. J., Midelfart, K. H., & Schjelderup, G. (2005). Corporate tax systems,
multinational enterprises, and economic integration. Journal of International Economics,
65(2), 507–521.
Klassen, K. J., Lisowsky, P., & Mescall, D. (2016). Transfer pricing: Strategies, practices,
and tax minimization. Contemporary Accounting Research, 34(1), 455–493.
Klassen, K., Lang, M., & Wolfson, M. (1993). Geographic income shifting by
multinational corporations in response to tax rate changes. Journal of Accounting
Research, 31(Suppl.), 141–173.
Lerche, D. (1980). Efficiency of taxation in Indonesia. Bulletin of Indonesian Economic
Studies, 16(1), 34–51.
Lisowsky, P. (2010). Seeking shelter: Empirically modeling tax shelters using financial
statement information. The Accounting Review, 85(5), 1693–1720.
Markle, K. (2015). A comparison of the tax‐motivated income shifting of multinationals
in territorial and worldwide countries. Contemporary Accounting Research, 33(1), 7–43.

183
Markusen, J. R. (1995). The boundaries of multinational enterprises and the theory of
international trade. The Journal of Economic Perspectives, 9(2), 169–189.
Markusen, J. R. (2002). Multinational firms and the theory of international trade.
Cambridge: MIT Press.
Merville, L. J., & Petty, J. W. (1978). Transfer pricing for the multinational firm.
Accounting Review, 53(4), 935–951.
Mills, L. F., & Newberry, K. J. (2004). Do foreign multinationals' tax incentives influence
their US income reporting and debt policy? National Tax Journal, 57(1), 89–107.
Myers, S. C. (1977). Determinants of corporate borrowing. Journal of Financial
Economics, 5(2), 147–175.
Newberry, K. J., & Dhaliwal, D. S. (2001). Cross‐jurisdictional income shifting by US
multinationals: Evidence from international bond offerings. Journal of Accounting
Research, 39(3), 643–662.
Organisation for Economic Co-operation and Development. (1998). Harmful tax
competition: an emerging global issue. Paris, France: Author.
Organisation for Economic Co-operation and Development. (2007). Manual on effective
mutual agreement procedures (MEMAP) February 2007 version. Paris, France: Author.
Organisation for Economic Co-operation and Development. (2009). OECD transfer
pricing guidelines for multinational enterprises and tax administrations. Paris, France:
Author.
Organisation for Economic Co-operation and Development. (2010). OECD Economic
Surveys: Indonesia 2010. Paris, France: Author.
Organisation for Economic Co-operation and Development. (2012). OECD Economic
Surveys: Indonesia 2012. Paris, France: Author.
Organisation for Economic Co-operation and Development. (2013a). Tax Administration
2013: Comparative Information on OECD and Other Advanced and Emerging
Economies. Paris, France: Author.
Organisation for Economic Co-operation and Development. (2013b). Addressing Base
Erosion and Profit Shifting. Paris, France: Author.
Organisation for Economic Co-operation and Development. (2013c). Action Plan on Base
Erosion and Profit Shifting. Paris, France: Author.

184
Organisation for Economic Co-operation and Development. (2014a). OECD/G20 Base
Erosion and Profit Shifting Project Frequently Asked Questions. Paris, France: Author.
Organisation for Economic Co-operation and Development. (2014b). Part 1 of a report
to G20 Development Working Group on the impact of BEPS in low income countries.
Paris, France: Author.
Organisation for Economic Co-operation and Development. (2014c). Model tax
convention on income and on capital: condensed version. Paris, France: Author.
Organisation for Economic Co-operation and Development. (2015a). Measuring and
Monitoring BEPS, Action 11 - 2015 Final Report, OECD/G20 Base Erosion and Profit
Shifting Project. Paris, France: Author.
Organisation for Economic Co-operation and Development. (2015b). OECD Economic
Surveys: Indonesia 2015. Paris, France: Author.
Organisation for Economic Co-operation and Development. (2015c). Revenue Statistics
in Asian Countries, Trends in Indonesia, Malaysia and the Philippines 1990-2013. Paris,
France: Author.
Organisation for Economic Co-operation and Development. (2016). OECD Economic
Surveys: Indonesia 2016. Paris, France: Author.
Organisation for Economic Co-operation and Development. (2017). Revenue statistics in
ASian countries. Trends in Indonesia, Japan, Kazakhstan, Korea, Malaysia, The
Philippines and Singapore 1990-2015. Paris, France: Author.
Oxfam. (2000). Tax Havens: releasing the hidden billions for poverty eradication (Oxfam
Briefing Papers). London, England: Author.
Pak, S., & Zdanowicz, J. (2002). US trade with the world: An estimate of 2001 lost US
federal income tax revenues due to over-invoiced imports and under-invoiced exports
(Trade Research Institute Working Paper No. 9404-01). Miami, FL: Trade Research
Institute.
Pakpahan, R. (2012, February). Tax reform in Indonesia: Issues, challenges and
solutions. Paper presented at the IMF-Japan High Level Tax Conference for Asian and
Pacific Countries, Tokyo, Japan.
Pendse, S. J. (2012, October). International transfer pricing regulations: Freedom of
globalized management vs. rightful tax. Paper presented at the 2012 International
Conference on Financial and Management Science (ICFMS 2012), Cochin, India.
Riedel, N. (2014). Quantifying international tax avoidance: A review of the academic
literature (European Tax Policy Forum Policy Paper No. 2). London, England: European
Tax Policy Forum.

185
Rose, M., & Labbé, C. (2016, May 24). Investigators raid Google Paris HQ in tax evasion
inquiry Retrieved 27 May 2016 from https://www.reuters.com/article/us-google-france-
investigation/investigators-raid-google-paris-hq-in-tax-evasion-inquiry-
idUSKCN0YF1CV.
Rosid, A., Evans, C., & Tran-Nam, B. (2016). Do perceptions of corruption influence
personal income taxpayer reporting behaviour? Evidence from Indonesia. eJournal of Tax
Research, 14(2), 1–35.
Rugman, A. M. (1986). New theories of the multinational enterprises: An assessment of
internalization theory. Bulletin of Economic Research, 38(2), 101–118.
Salihu, I. A., Annuar, H. A., & Obid, S. N. S. (2015). Foreign investors' interests and
corporate tax avoidance: Evidence from an emerging economy. Journal of Contemporary
Accounting & Economics, 11(2), 138–147.
Sandmo, A. (2005). The theory of tax evasion: A retrospective view. National Tax
Journal, 58(4), 643–663.
Satter, R., & Liedtke, M. (2016, May 24). Police at Google's Paris office after reports of
tax raid Retrieved from http://www.businessinsider.com/ap-police-at-googles-paris-
office-after-reports-of-tax-raid-2016-5/?r=AU&IR=T.
Saunders-Scott, M. J. (2015). Substitution across methods of profit shifting. National Tax
Journal, 68(4), 1099–1120.
Schindler, D., & Schjelderup, G. (2012). Debt shifting and ownership structure. European
Economic Review, 56(4), 635–647.
Schindler, D., & Schjelderup, G. (2013). Transfer pricing and debt shifting in
multinationals (CESifo Working Paper No. 4381). Munich, Germany: Center for
Economic Studies and Ifo Institute.
Schjelderup, G., & Weichenrieder, A. J. (1999). Trade, multinationals, and transfer
pricing regulations. Canadian Journal of Economics, 32(3), 817–834.
Scholes, M. S., Wolfson, M. A., Erickson, M., Maydew, E. L., & Shevlin, T. (2009).
Taxes and business strategy: A planning approach (4 ed.). Upper Saddle River, NJ:
Pearson/Prentice-Hall.
Shelepov, A. (2017). BEPS action plan implementation in Asian-Pacific countries. 13-
20. Retrieved from https://www.ranepa.ru/images/media/articles/APNB_eng_3.pdf.
Sikka, P., & Willmott, H. (2010). The dark side of transfer pricing: Its role in tax
avoidance and wealth retentiveness. Critical Perspectives on Accounting, 21(4), 342–
356.

186
Slemrod, J. (2004). The economics of corporate tax selfishness. National Tax Journal,
57(4), 877–899.
Slemrod, J., & Yitzhaki, S. (2002). Tax avoidance, evasion, and administration. In A. J.
Auerbach & M. Feldstein (Eds.), Handbook of public economics (Vol. 3, pp. 1423–1470).
Amsterdam, Netherlands: Elsevier.
Spencer, D. (2012). Transfer pricing: Will the OECD adjust to reality. Journal of
International Taxation, 23, 34–52.
Stiglitz, J. E. (1986). The general theory of tax avoidance. Cambridge, MA: National
Bureau of Economic Research.
Stock, J. H., & Watson, M. W. (2015). Introduction to econometrics (3 ed.). Boston, MA:
Pearson Education.
Swenson, D. L. (2001). Tax reforms and evidence of transfer pricing. National Tax
Journal, 54(1), 7–25.
Thomson, A., Waters, R., & Houlder, V. (2016, May 25). Google’s Paris offices raided
by French authorities in tax probe. Retrieved from http://www.ft.com/cms/s/0/90018a06-
21ac-11e6-aa98-db1e01fabc0c.html#axzz49dn9kZSB.
Ting, A. (2014). iTax-Apple’s international tax structure and the double non-taxation
issue. British Tax Review(1), 40–71.
Titcomb, J. (2016, May 24). Google Paris offices raided in £1.2 billion tax probe.
Retrieved from https://www.telegraph.co.uk/technology/2016/05/24/google-paris-
offices-raided-in-tax-probe/.
Tran, A. (2015). Can taxable income be estimated from financial reports of listed
companies in Australia? Australian Tax Forum, 30(3), 569–594.
Tresch, R. W. (2015). Public finance: A normative theory (3rd ed.). Oxford, England:
Academic Press.
United Nations. (2011). United Nations model double taxation convention between
developed and developing countries. New York, NY: Department of Economic & Social
Affairs.
United Nations. (2013a). World investment report 2013: Global value chains: Investment
and trade for development. Geneva: United Nations Conference on Trade and
Development.
United Nations. (2013b). World investment prospects survey 2013–2015. Geneva: United
Nations Conference on Trade and Development.

187
United Nations. (2013c). United Nations practical manual on transfer pricing for
developing countries. New York, NY: Department of Economic & Social Affairs.
Vicard, V. (2015). Profit shifting through transfer pricing: evidence from French firm
level trade data (Banque de France Working Paper No. 555). Paris, France: Banque de
France.
Viray, V. B. (2017). Base erosion and profit shifting (BEPS) inclusive framework
implementation in the Southeast Asian region. Retrieved from
https://www.financierworldwide.com/base-erosion-and-profit-shifting-beps-inclusive-
framework-implementation-in-the-southeast-asian-region/#.WnZkhaiWbIU.
Weichenrieder, A. J. (2009). Profit shifting in the EU: Evidence from Germany.
International Tax and Public Finance, 16(3), 281–297.
Weisbach, D. A. (2003). Corporate tax avoidance Proceedings. Annual Conference on
Taxation and Minutes of the Annual Meeting of the National Tax Association (pp. 9–15).
Washington, DC: National Tax Association.
Wickham, D. W. (1991). The new US transfer pricing tax penalty: A solution, or a
symptom of the cause, of the international transfer pricing puzzle. International Tax
Journal, 18, 1–45.
Widihartanto, S. (2014). Regulating Indonesia's high wealth individual taxpayers: ideas
for policy transfer (Unpublished PhD thesis). The Australian National University,
Canberra, Australia.
Wilson, J. D. (1999). Theories of tax competition. National Tax Journal, 52(2), 269–304.
World Bank. (2014). 2014 world development indicators. Washington DC: International
Bank for Reconstruction and Development/The World Bank.
World Bank. (2016). How does the World Bank classify countries? Retrieved from
https://datahelpdesk.worldbank.org/knowledgebase/articles/378834-how-does-the-
world-bank-classify-countries.

188
Appendices
Appendix 1
Indonesian Corporate Tax Return Form
ATTENTION h FOLLOW INSTRUCTION IN THE MANUALh PRINT OR TYPE WITH CAPITAL LETTER OR BLACK INK
h MARK "X" IN THE APPROPRIATE BOX AMENDED RETURN
T I N :
TAXPAYER'S NAME :
BUSINESS CLASIFICATION : KLU :
TELEPHONE NUMBER : - FACSIMILE NO. -
ACCOUNTING PERIOD :
FOREIGN DOMICILE OF HEAD OFFICE (Permanent Establisment only) :
FINANCIAL STATEMENT : AUDITED AUDIT OPINION UNAUDITED
NAME OF PUBLIC ACCOUNTANT FIRM :
TIN OF PUBLIC ACCOUNTANT FIRM :
NAME OF CPA :
TIN OF CPA :
NAME OF TAX CONSULTANT FIRM :
TIN OF TAX CONSULTANT FIRM :
NAME OF TAX CONSULTANT :
TIN OF TAX CONSULTANT :
*) The filling of coloumns of Rupiahs must be without decimal value (see example in the manual book page.3)
1. FISCAL NET INCOME
(Copy from Form 1771-1 line 8 column 3)…………………………………..
2. FISCAL LOSS CARRIED FORWARD
(Copy from Special Attachment 2A Total of Column B) …………………..
3. TAXABLE INCOME (1 - 2) ………………………………………………………
4. INCOME TAX DUE (Choose one of these Rates according to Taxpayer criteria. See manual book)
a. Tax Rate Article 17 paragraph (1) letter b X line 3) …………………
b. Tax Rate Article 17 paragraph (2b) X line 3………………….
c. Tax Rate Article 31E paragraph (1)
5. ADJUSTMENT FOR FOREIGN TAX CREDIT REFUNDED THAT HAD
BEEN CREDITED IN THE PREVIOUS YEAR'S RETURN
(Income Tax Art.24)
6. TOTAL TAX DUE (4 + 5) …………………………………………………………
7. INCOME TAX BORNE BY THE GOVERNMENT (Foreign Aid Project)
8. a. DOMESTIC TAX CREDIT
(Copy from Form 1771-III Total of Column 5)
b. FOREIGN TAX CREDIT
(Copy from Special Attachment 7A Total of column 7)
c. TOTAL (8a + 8b) ……………………………………………………………….
9. a. TAX DUE AFTER CREDIT
b. TAX OVERLY WITHHELD
10. PREPAID TAX :
a. MONTHLY INSTALLMENT TAX ARTICLE 25………………………………
b. NOTICE OF TAX COLLECTION (Principal only)
c. TAX ARTICLE POINT 8 / DEPARTURE TAX ………………………………….
d. TOTAL (10a + 10b + 10c) ………………………………..
11. a. UNDERPAID TAX (INCOME TAX ARTICLE 29)
b. OVERPAID TAX (INCOME TAX ARTICLE 28A)
12. UNDERPAID TAX ON NUMBER 11.a SETTLED ON…………………………………………………
13. OVERPAID AMOUNT STATED IN 11.b WOULD BE :
a. REFUNDED b. COMPENSATED WITH OUTSTANDING TAX PAYABLE
Refund for a Taxpayer with Certain Criteria only : Preliminary Refund (Tax Law on Article 17C or 17D)
F.1.1.32.14
DATE MONTH YEAR
10c
10d
D. IN
CO
ME
TA
X U
ND
ER
/OV
ER
PA
ID
(9 - 10d) 11
(6 - 7 - 8c) 9
10a
10b
C. T
AX
CR
ED
ITS
7
8a
8b
8c
B. IN
CO
ME
TA
X D
UE
4
5
6
IDR *)(1) (2) (3)
A. T
AX
AB
LE
IN
CO
ME
1
2
3
to
DIRECTORATE GENERAL OF TAXES
IDE
NT
ITY
FO
RM
MINISTRY OF FINANCE
1771CORPORATE ANNUAL TAXABLE YEAR
INCOME TAX RETURN 2 0

189
FORM 1771 Page 2
14. a. INCOME BASE FOR CALCULATION OF MONTHLY TAX
INSTALLMENT ……………………………………………………..
b. FISCALL LOSS CARRIED FORWARD :
(From Special Attachment 2A Total of Column 9)
c. TAXABLE INCOME (14a - 14b) ……………………………………………
d. TAX DUE
(Tax Rate from Part B line 4 X 14c) …………………………………………..
e. WITHOLDING TAX PAID BASED ON NUMBER 14a
f. INCOME TAX MUST BE PAID (14d - 14e) ……………………….
g. INCOME TAX ARTICLE 25 : (1/12 x 14f) ……………………………………………………….
15. a. FINAL TAX :
(From Form 1771-IV Total Part A Column 5) ……………………………
b. NON-TAXABLE INCOME :
GROSS INCOME
(From Form 1771-IV Total Part B of Column 3) ……………………………….
16. a. There is a Transaction in Related Parties and/or with Tax Haven Country Resident(Compulsory to submit Special Attachment 3A, 3A-1. and 3A-2 Manual Book of Annual Return)*
b. There is not a Transaction in Related Parties and/or with Tax Heaven Country Resident.
17. OTHER THAN FORM OF 1771-I, 1771-II, 1771-III, 1771-IV, 1771-V, AND 1771-VI
WITH THIS ALSO ATTACHED :
a. THIRD COPY OF TAX PAYMENT RECEIPT OF INCOME TAX ARTICLE 29
b. FINANCIAL STATEMENTS
c. TRANSCRIPT OF ELEMENTS FROM FINANCIAL STATEMENT (Special Attachment 8A-1 /8A-2 /8A-3 /8A-4 /8A-5 /8A-6)*
d. DEPRECIATION AND AMORTIZATION TABLES (Special Attachment 1A of the Annual Income Tax Return Manual)*
e. CALCULATION OF FISCAL LOSS CARRIED FORWARD (Special Attachment 2A of Income Tax Return Manual)*
f. INVESTMENT FACILITIES PROVIDED (Special Attachment 4A of the Income Tax Return Manual)
g. LIST OF MAJOR BRANCHES (Special Attachment 5A of the Income Tax Return Manual)
h. THIRD COPY OF PAYMENT RECEIPT OF INCOME TAX ARTICLE 26 PARAGRAPH (4) (For Permanent Establishment only)
i. CALCULATION OF INCOME TAX ART.26 PARAGRAPH (4) (Permanent Establishment only) (Special Attachment 6A of Income Tax Return Manual)*
j. FOREIGN TAX CREDITS (Special Attachment 7A Income Tax Return Manual)*
k. POWER OF ATTORNEY (if needed)
l. ……………………………………………………………………………………………………………………..
m. ………………………………………………………………………………………………………………………
n. ………………………………………………………………………………………………………………………
Understanding All The Sanctions Provided by The Law and Regulations, I Hereby Declare that The Information Stated in this Return, Including
All Attachments Provided, are True, Complete, Clear, and Under No Circumstances Wharsoever.
a. TAX PAYER b. AUTHORIZED c. d.REPRESENTATIVE
SIGNATURE AND COMPANY SEAL
: e.
T I N : f.
F.1.1.32.14
REPRESENTATI VE
FULL NAME MANAGEMENT/
(place) date month year
H.
AT
TA
CH
ME
NT
S
DECLARATION
F.F
INA
L T
AX
AN
D N
ON
-
TA
XA
BL
E IN
CO
ME
15a
15b
G. S
TA
TE
ME
NT
OF
TR
AN
SA
CT
ION
IN
RE
LA
TE
D P
AR
TIE
S
14f
14g
E. M
ON
TH
LY
IN
ST
AL
LM
EN
T O
F A
RT
.25 F
OR
CU
RR
EN
T Y
EA
R
14a
14b
14c
14d
14e
IDR(1) (2) (3)

190
T I N :
TAXPAYER'S NAME :
ACCOUNTING PERIOD :
DOMESTIC COMMERCIAL NET INCOME :
a. GROSS INCOME …………………………………………………………………………………..1a
b. COST OF GOOD SOLD …………………………………………………………………………………….1b
c. OTHER EXPENSE ………………………………………………………………………………………………...1c
d. NET INCOME FROM BUSINESS (1a - 1b - 1c) …………………………………………………………………...1d
e. INCOME FROM SIDE BUSINESS …………………………………………………………………………….1e
f. EXPENSE FROM SIDE BUSINESS …………………………………………………………………………………………..1f
g. NET INCOME FROM SIDE BUSINESS (1e - 1f) …………………………………………………………….1g
h. TOTAL (1d + 1g) ………………………………………………………………………………………………...1h
FOREIGN COMMERCIAL NET INCOME
(From Special Attachment 7A Column 4)……………………………………………….. .
TOTAL OF COMMERCIAL NET INCOME (1h + 2) ………………………………………. 3
INCOME SUBJECT TO FINAL TAX
AND NON-TAXABLE INCOME………………………………………………………….. .
POSITIVE FISCAL ADJUSTMENT :
a. EXPENSE CHARGED OR INCURRED FOR THE PERSONAL BENEFIT OF
SHAREHOLDERS, PARTNERSHIP OR MEMBERS... ………………………………………...
b. FORMATION OR ACCUMULATION OF ALLOWANCES ……………………….. .5b
c. CONSIDERATION OR REMUNERATION RELATED TO EMPLOYMENT OR
SERVICES GIVEN IN THE FORM OF A BENEFIT IN KIND…………………………...
d. EXCESSIVE COMPENSATION PAID TO SHAREHOLDERS OR OTHER
ASSOCIATED PARTIES AS A CONSIDERATION OF WORK PERFOMED…………..
e. GIFTS, AIDS, OR DONATION ………………………………………… .5e
f. INCOME TAX …………………………………………………………………………….5f
g. SALARIES PAID TO A MEMBER OF AN ASSOCIATION, FIRMA, OR LIMITED
PARTNERSHIP WHICH CAPTAL DOES NOT CONSIST OF STOCKS………………..
h. ADMINISTRATION SANCTION ……………………………………………………………………………………………..5h
i. LESS COMMERCIAL DEPRECIATION OVER FISCAL DEPRECIATION ………………………………...5i
j. LESS COMMERCIAL AMORTIZATION OVER FISCAL AMORTIZATION ………………………………...5j
k. DEFERRED EXPENSES ………………………………………………………………...5k
l. OTHER POSITIVE FISCAL ADJUSTMENTS …………………………………………………...5l
m. TOTAL 5a s.d. 5l ………………………………………………………………………………….5m
NEGATIVE FISCAL ADJUSTMENT :
a. LESS COMMERCIAL DEPRECIATION UNDER FISCAL DEPRECIATION …………………………………………………………………………………..6a
b. ESS COMMERCIAL AMORTIZATION UNDER FISCAL AMORTIZATION ………………………………...6b
c. DEFERRED INCOME ………………………………………………………………………………………………...6c
d. OTHER NEGATIVE FISCAL ADJUSTMENTS …………………………………………………...6d
e. TOTAL 6a s.d. 6d …………………………………………………………………………….6e
FACILITIES OF INVESTMENT ALLOWANCES
…… YEAR 7a (From Special Attachment 4A line 5b) ………………………...
FISCAL NET INCOME (3 - 4 + 5m - 6e - 7b) …………………………………………. .8
NOTES : Copy Total of Line 8 to Form 1771 Letter A Line 1.
D.1.1.32.31
8.
7.7b
6.
5g
5a
5c
5d
3.
4.4
5.
2. 2
1.
NO DESCRIPTIONS IDR(1) (2) (3)
toIDE
NT
ITY
0MINISTRY OF FINANCE
CALCULATION OF FISCAL NET INCOMEDIRECTORATE GENERAL OF TAXES
FO
RM 1771 - I
ATTACHMENT-I
TA
XA
BL
E Y
EA
R
CORPORATE ANNUAL INCOME TAX RETURN2

191
T I N : TAXPAYER'S NAME :
ACCOUNTING PERIOD :
NO
(1)
1.
2.
3.
4.
5.
6.
7.
8.
9.
10.
11.
12.
13.
14.
Note :
Number 1 for Trading Company fill with Inventory, for industry fill with purchase of material, indirect material and finished good.
Number 7 includes management fee, technical assistance fee, and other services.
Line 11 includes total expenses not covered in Line 1 to 10.
Line 12 and 13 for tradingcompanies, filled with beginning/ending balances of merchandise inventory, for industrial companies, filled with beginning/ending balances of raw materials,
indirect materials, work in process, and finished goods inventory.
D.1.1.32.54
h
h
h
h
ENDING INVENTORY (-/-)
TOTAL OF LINE 1 TO 12 MINUS LINE 13
OTHER EXPENSES
BEGINNING INVENTORY
ROYALTIES EXPENSE
MARKETING AND PROMOTION EXPENSE
EXPENSE RELATED TO SERVICE
BAD DEBT EXPENSE
RENT EXPENSES
INTEREST EXPENSES
TRANSPORTATION EXPENSE
DEPRECIATION AND AMORTIZATION
EXPENSE
PURCHASE OF MATERIAL/MERCHANDISE
SALARIES, WAGES, BONUSES,
GRATIFICATION, HONORARIUM, AND
OTHERS
DETAILS COST OF GOOD SOLD (IDR) OTHER OPERATING EXPENSE (IDR) NON-OPERATING EXPENSE (IDR) TOTAL (IDR)
(2) (3) (4) (5) (6) = (3) + (4) + (5)
s.d.IDE
NT
ITY
0MINISTRY OF FINANCE
DETAILS OF COST OF GOOD SOLD, OTHER OPERATING EXPENSE AND COMMERCIAL NON-OPERATING EXPENSEDIRECTORATE GENERAL OF TAXES
FO
RM 1771 - II
ATTACHMENT-II
TA
XA
BL
E Y
EA
R
CORPORATE ANNUAL INCOME TAX RETURN 2

192
T I N : TAXPAYER'S NAME :
ACCOUNTING PERIOD :
Notes :
Filled with calculation of each Withholding Tax Receipt. Page - from page Attachment-III
Copy of Total Income Tax Article 22, Income Tax Article 23 and Income Tax Article 26 column (5) to Form 1771 Letter C Line 8.a.
D.1.1.32.32
h
h
TOTAL TTL
TYPES OF
INCOME/TRANSACTION(IDR) NUMBER DATE
(2) (3) (4) (5) (6) (7)
NAME AND TIN WITHHOLDING AGENT
WITHHOLDING OBJECT
INCOME TAX WITHHELD (IDR)
WITHHOLDING RECEIPT/TAX PAYMENT SLIP (SSP)/SSPCP
2 0MINISTRY OF FINANCE
FOREIGN TAX CREDITDIRECTORATE GENERAL OF TAXES
IF NEEDED. ADDITIONAL PAGES MAY BE ADDEED
1771 - IIIATTACHMENT- III
TA
XA
BL
E Y
EA
R
CORPORATE ANNUAL INCOME TAX RETURN
to

193
T I N :
TAXPAYER'S NAME :
ACCOUNTING PERIOD :
PART A : FINAL INCOME TAX
a.
b.
c.
PART B : NON-TAXABLE INCOMECopy of Form 1771 letter F line 15 point a
Copy to Form 1771 letter F line 15 point b
Page - from page Attachment-IV
D.1.1.32.34
7.
etc
TOTAL PART B TPB
IF NEEDED. ADDITIONAL PAGES MAY BE ADDEED
5.
6. EXCESS INCOME RECEIVED BY NONPROFIT AND REGISTERED
EDUCATION INSTITUTION OR RESEARCH AND DEVELOPMENT
ESTABLISHMENT WHICH ARE REINVESTED IN THE FORM OF FACILITIES
AND IN INFRASTRUCTURE FOR EDUCATIONAL AND/OR R&D ACTIVITIES
SHARES OF PROFIT RECEIVED BY VENTURE CAPITAL COMPANIES FROM
ITS PARTNERS
3. DIVIDEND FROM INVESTMENT/OWNERSHIP OF SHARES OF THE INDONESIAN
BUSINESS ENTITIES (Article 4 Paragraph (3) Item f of Income Tax Law)
4. CONTRIBUTION AND SPECIFIC INCOME RECEIVED BY A PENSION FUND
1. AID/DONATION
2. GRANT
NO TYPES OF INCOME GROSS INCOME (IDR)
(1) (2) (3)
14.
etc
TOTAL PART A TPA
12. REVALUATION OF FIXED ASSETS\
13.DERIVATIVE TRANSACTION TRADE IN
CAPITAL MARKET
10.GROSS INCOME OF FOREIGN
SHIPPING/AIRLINES COMPANY
11.GROSS INCOME OF DOMESTIC SHIPPING
COMPANY
CONSTRUCTION SUPERVISOR
9. GROSS SALES OF REPRESENTATIVE OFFICE
CONTRUCTOR
DESIGNER
7.INCOME FROM LEASE/RENT VALUE OF
LAND/BUILDING
8. CONSTRUCTION RELATED FEE :
5.
INCOME FROM
DISTRIBUTOR/DEALER/AGENT OF OIL
PRODUCTS
6.INCOME FROM TRANSFER VALUE OF RIGHT
ON LAND/BUILDING
3.INCOME FROM SALES VALUES OF SHARE
TRADED IN STOCK EXCHANGE
4.INCOME FROM SALES VALUE OF VENTURE
CAPITAL SHARE
1.
INTEREST INCOME ON TIME
DEPOSITS/OTHER SAVINGS AND DISCOUNT
OF CENTRAL BANK'S
SERTIFICATE/SECURITIES STATE
2. INTEREST/DISCOUNT OF BOND
NO TYPES OF INCOME TAX BASE (IDR) RATE (%) INCOME TAX PAYABLE (IDR)
(1) (2) (3) (4) (5)
to
IDE
NT
ITY
0MINISTRY OF FINANCE
FINAL INCOME TAX AND NON-TAXABLE INCOMEDIRECTORATE GENERAL OF TAXES
FO
RM 1771 - IV
ATTACHMENT - IV
TA
XA
BL
E Y
EA
R
CORPORATE ANNUAL INCOME TAX RETURN2

194
h LIST OF SHAREHOLDERS/CAPITAL OWNERS AND TOTAL DIVIDENDS DISTRIBUTED
h LIST OF DIRECTORS AND COMMISSIONERS
T I N :
TAXPAYER'S NAME :
ACCOUNTING PERIOD :
PART A : LIST OF SHAREHOLDERS/CAPITAL OWNERS AND TOTAL DIVIDENDS DISTRIBUTED
PART B : LIST OF DIRECTORS AND COMMISSIONERS
Page - from page Attachment-V
D.1.1.32.35
9.
10.
dst
IF NEEDED. ADDITIONAL PAGES MAY BE ADDEED
7.
8.
5.
6.
3.
4.
1.
2.
NO NAME AND ADDRESS T I N POSITION
(1) (2) (3) (4)
TOTAL PART A TPA 100%
10.
dst
9.
8.
7.
6.
5.
4.
3.
2.
1.
(1) (2) (3) (4) (5) (6)
NO NAME AND ADDRESS T I N TOTAL PAID IN SHARES
DIVIDEND (IDR)(IDR) %
to
IDE
NT
ITY
0MINISTRY OF FINANCE
DIRECTORATE GENERAL OF TAXES
FO
RM 1771 - V
ATTACHMENT - V
TA
XA
BL
E Y
EA
R
CORPORATE ANNUAL INCOME TAX RETURN2

195
h LIST OF CAPITAL CONTRIBUTION IN AFFILIATION COMPANIES
h LIST OF ACCOUNT PAYABLE FROM SHAREHOLDERS AND/OR AFFILIATION COMPANIES
h LIST OF ACCOUNT RECEIVABLE TO SHAREHOLDERS AND/OR AFFILIATION COMPANIES
T I N :
TAXPAYER'S NAME :
ACCOUNTING PERIOD :
PART A : LIST OF CAPITAL CONTRIBUTION IN AFFILIATION COMPANIES
PART B : LIST OF ACCOUNT PAYABLE FROM SHAREHOLDERS AND/OR AFFILIATION COMPANIES
PART C : LIST OF ACCOUNT RECEIVABLE TO SHAREHOLDERS AND/OR AFFILIATION COMPANIES
Page - from page Attachment-VI
D.1.1.32.36
dst
IF NEEDED. ADDITIONAL PAGES MAY BE ADDEED
12
11.
10.
9.
8.
7.
6.
5.
4.
3.
2.
1.
(1) (2) (3) (4) (5) (6)
NO NAME AND ADDRESS T I N TOTAL LOAN (IDR) YEARINTEREST/
YR %
etc
12
11.
10.
9.
8.
7.
6.
5.
4.
3.
2.
1.
INTEREST/
YR %
(1) (2) (3) (4) (5) (6)
TOTAL TTL
NO NAME AND ADDRESS T I N TOTAL LOAN (IDR) YEAR
4.
5.
etc
2.
3.
(1) (2) (3) (4) (5)
1.
NO NAME AND ADDRESS T I N AMOUNT OF CAPITAL CONTRIBUTION
(IDR) %
to
IDE
NT
ITY
0MINISTRY OF FINANCE
DIRECTORATE GENERAL OF TAXES
FO
RM
1771 - VIATTACHMENT - VI
TA
XA
BL
E Y
EA
R
CORPORATE ANNUAL INCOME TAX RETURN2
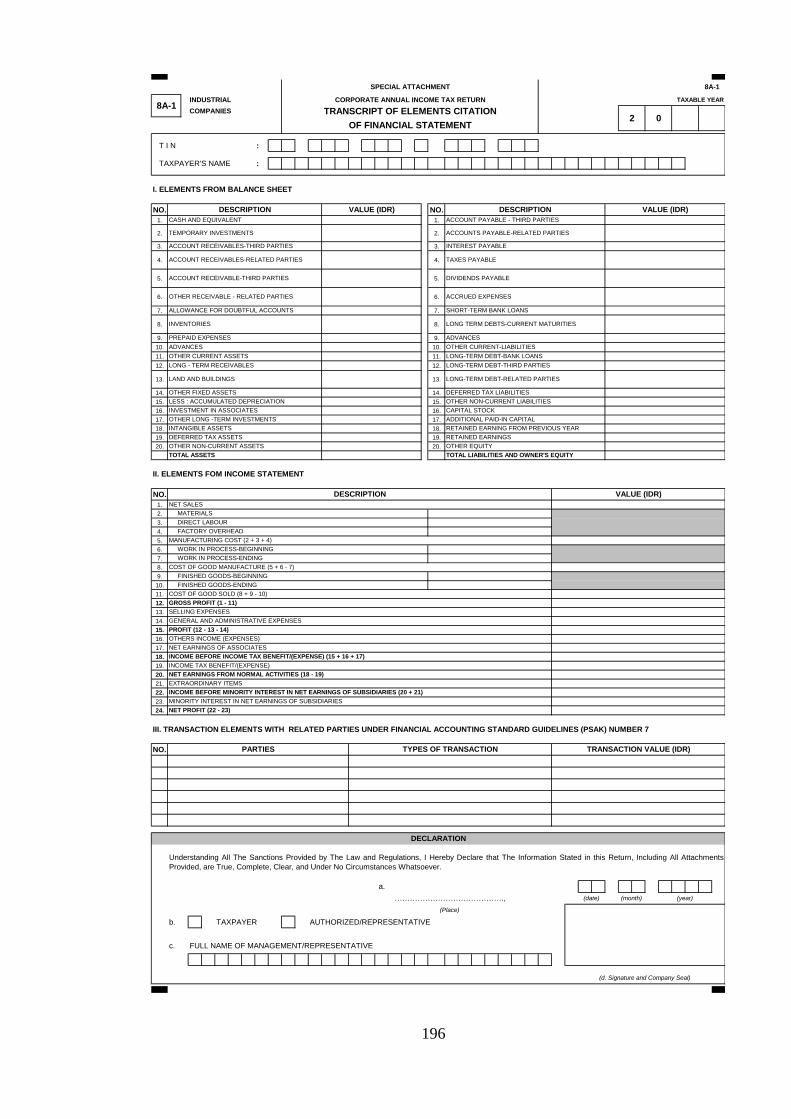
196
T I N :
TAXPAYER'S NAME :
NO. NO.
1. 1.
2. 2.
3. 3.
4. 4.
5. 5.
6. 6.
7. 7.
8. 8.
9. 9.
10. 10.
11. 11.
12. 12.
13. 13.
14. 14.
15. 15.
16. 16.
17. 17.
18. 18.
19. 19.
20. 20.
NO.
1.
2.
3.
4.
5.
6.
7.
8.
9.
10.
11.
12.
13.
14.
15.
16.
17.
18.
19.
20.
21.
22.
23.
24.
III. TRANSACTION ELEMENTS WITH RELATED PARTIES UNDER FINANCIAL ACCOUNTING STANDARD GUIDELINES (PSAK) NUMBER 7
NO.
b. TAXPAYER AUTHORIZED/REPRESENTATIVE
c. FULL NAME OF MANAGEMENT/REPRESENTATIVE
SPECIAL ATTACHMENT 8A-1
8A-1INDUSTRIAL CORPORATE ANNUAL INCOME TAX RETURN TAXABLE YEAR
COMPANIES TRANSCRIPT OF ELEMENTS CITATION2 0
OF FINANCIAL STATEMENT
I. ELEMENTS FROM BALANCE SHEET
DESCRIPTION VALUE (IDR) DESCRIPTION VALUE (IDR)
CASH AND EQUIVALENT ACCOUNT PAYABLE - THIRD PARTIES
TEMPORARY INVESTMENTS ACCOUNTS PAYABLE-RELATED PARTIES
ACCOUNT RECEIVABLES-THIRD PARTIES INTEREST PAYABLE
ACCOUNT RECEIVABLES-RELATED PARTIES TAXES PAYABLE
ACCOUNT RECEIVABLE-THIRD PARTIES DIVIDENDS PAYABLE
OTHER RECEIVABLE - RELATED PARTIES ACCRUED EXPENSES
ALLOWANCE FOR DOUBTFUL ACCOUNTS SHORT-TERM BANK LOANS
INVENTORIES LONG TERM DEBTS-CURRENT MATURITIES
PREPAID EXPENSES ADVANCES
ADVANCES OTHER CURRENT-LIABILITIES
OTHER CURRENT ASSETS LONG-TERM DEBT-BANK LOANS
LONG - TERM RECEIVABLES LONG-TERM DEBT-THIRD PARTIES
LAND AND BUILDINGS LONG-TERM DEBT-RELATED PARTIES
OTHER FIXED ASSETS DEFERRED TAX LIABILITIES
LESS : ACCUMULATED DEPRECIATION OTHER NON-CURRENT LIABILITIES
INVESTMENT IN ASSOCIATES CAPITAL STOCK
OTHER LONG -TERM INVESTMENTS ADDITIONAL PAID-IN CAPITAL
INTANGIBLE ASSETS RETAINED EARNING FROM PREVIOUS YEAR
DEFERRED TAX ASSETS RETAINED EARNINGS
OTHER NON-CURRENT ASSETS OTHER EQUITY
TOTAL ASSETS TOTAL LIABILITIES AND OWNER'S EQUITY
II. ELEMENTS FOM INCOME STATEMENT
DESCRIPTION VALUE (IDR)
NET SALES
MATERIALS
DIRECT LABOUR
FACTORY OVERHEAD
MANUFACTURING COST (2 + 3 + 4)
WORK IN PROCESS-BEGINNING
WORK IN PROCESS-ENDING
COST OF GOOD MANUFACTURE (5 + 6 - 7)
FINISHED GOODS-BEGINNING
FINISHED GOODS-ENDING
COST OF GOOD SOLD (8 + 9 - 10)
GROSS PROFIT (1 - 11)
SELLING EXPENSES
GENERAL AND ADMINISTRATIVE EXPENSES
PROFIT (12 - 13 - 14)
OTHERS INCOME (EXPENSES)
NET EARNINGS OF ASSOCIATES
INCOME BEFORE INCOME TAX BENEFIT/(EXPENSE) (15 + 16 + 17)
INCOME TAX BENEFIT/(EXPENSE)
NET EARNINGS FROM NORMAL ACTIVITIES (18 - 19)
EXTRAORDINARY ITEMS
INCOME BEFORE MINORITY INTEREST IN NET EARNINGS OF SUBSIDIARIES (20 + 21)
MINORITY INTEREST IN NET EARNINGS OF SUBSIDIARIES
NET PROFIT (22 - 23)
PARTIES TYPES OF TRANSACTION TRANSACTION VALUE (IDR)
DECLARATION
Understanding All The Sanctions Provided by The Law and Regulations, I Hereby Declare that The Information Stated in this Return, Including All Attachments
Provided, are True, Complete, Clear, and Under No Circumstances Whatsoever.
a.
……………………………………., (date) (month) (year)
(d. Signature and Company Seal)
(Place)

197
Appendix 2
Tax Treaty Network of Indonesia as at 30 June 2018
No. Partner Countries Effective Date
1 Algeria 1 January 2001
2 Armenia 1 January 2017
3 Australia 1 July 1993
4 Austria 1 January 1989
5 Bangladesh 1 January 2007
6 Belarus 9 May 2018
7 Belgium 1 January 2002
8 Brunei Darussalam 1 January 2003
9 Bulgaria 1 January 1993
10 Canada 1 January 1980
11 China 1 January 2004
12 Czech 1 January 1997
13 Democratic People’s Republic of Korea 1 January 2005
14 Denmark 1 January 1987
15 Egypt 1 January 2003
16 Finland 1 January 1990
17 France 1 January 1981
18 Germany 1 January 1992
19 Hong Kong 1 January 2013
20 Hungary 1 January 1994
21 India 1 January 1988

198
No. Partner Countries Effective Date
22 Iran 1 January 2011
23 Italy 1 January 1996
24 Japan 1 January 1983
25 Jordan 1 January 1999
26 Kingdom of Morocco 1 January 2013
27 Kuwait 1 January 1999
28 Luxembourg 1 January 1995
29 Malaysia 1 January 1987
30 Mexico 1 January 2005
31 Mongolia 1 January 2001
32 Netherlands 1 January 2004
33 New Zealand 1 January 1989
34 Norway 1 January 1991
35 Pakistan 1 January 1991
36 Papua New Guinea 1 January 2015
37 Philippines 1 January 1983
38 Poland 1 January 1994
39 Portuguese 1 January 2008
40 Qatar 1 January 2008
41 Republic of Croatia 1 January 2013
42 Republic of Korea 1 January 1990
43 Republic of Suriname 1 January 2014
44 Romania 1 January 2000

199
No. Partner Countries Effective Date
45 Russia 1 January 2003
46 Saudi Arabia 1 January 1985
47 Seychelles 1 January 2001
48 Singapore 1 January 1992
49 Slovakia 1 January 2002
50 South Africa 1 January 1999
51 Spain 1 January 2000
52 Sri Lanka 1 January 1995
53 Sudan 1 January 2001
54 Sweden 1 January 1990
55 Switzerland 1 January 1990
56 Syria 1 January 1999
57 Taiwan 1 January 1996
58 Thailand 1 January 2004
59 Tunisia 1 January 1994
60 Turkey 1 January 2001
61 Ukraine 1 January 1999
62 United Arab Emirates 1 January 2000
63 United Kingdom 1 January 1995
64 United States 1 February 1997
65 Uzbekistan 1 January 1999
66 Venezuela 1 January 2001
67 Vietnam 1 January 2000
Source: Armenia and Belarus: DGT officials; Other countries: List of Indonesia’s Tax Treaty
Network (Directorate General of Tax, 2016a, pp. 145-146)

200
Appendix 3
Final Sample by Country of Parent, 2009–2015 (Study 1—TI Model)
Country
Year
2009 2010 2011 2012 2013 2014 2015 Total
Japan 173 179 185 207 197 246 148 1,335
Korea, Republic of 111 131 148 171 207 268 261 1,297
Singapore 97 105 109 118 124 137 98 788
Malaysia 29 31 38 43 52 69 50 312
China 15 16 23 33 38 77 75 277
Taiwan 25 25 27 27 29 36 32 201
United States 26 24 26 31 30 37 27 201
Netherlands 27 28 27 25 24 30 29 190
Australia 19 17 18 23 26 36 25 164
British Virgin Islands 21 21 23 24 22 26 17 154
United Kingdom 17 20 23 24 24 24 14 146
Germany 13 15 18 18 17 23 21 125
Hong Kong, SAR 13 13 16 14 19 21 17 113
France 10 11 10 13 19 19 16 98
India 6 10 11 14 18 22 16 97
Switzerland 11 9 10 9 13 12 5 69
Thailand 3 3 5 3 7 10 4 35
Canada 5 4 4 5 4 3 3 28
Luxembourg 4 3 4 4 5 5 3 28
Italy 2 1 3 3 3 7 5 24
Belgium 2 2 3 3 4 6 3 23

201
Country
Year
2009 2010 2011 2012 2013 2014 2015 Total
Mauritius 4 4 3 3 2 4 3 23
Spain 0 2 0 4 4 7 4 21
Sweden 3 4 3 4 2 3 2 21
Pakistan 2 2 1 3 2 5 1 16
Austria 2 2 2 2 2 3 2 15
Samoa 0 2 1 2 2 3 2 12
Denmark 1 2 1 1 1 4 1 11
New Zealand 0 1 1 3 2 2 2 11
Philippines 1 0 1 1 2 3 2 10
Guinea 2 2 1 2 1 1 0 9
Finland 1 1 1 1 1 1 1 7
Marshall Islands 1 1 1 1 1 1 1 7
Norway 1 1 1 1 0 1 1 6
Brunei 0 0 0 1 2 2 0 5
Cayman Islands 0 0 0 0 0 3 2 5
Channel Islands 1 1 1 1 1 0 0 5
Liberia 1 1 0 1 1 1 0 5
Panama 1 0 1 1 1 0 1 5
Poland 0 1 1 1 1 1 0 5
Jordan 0 0 1 1 1 0 1 4
Kenya 0 0 1 1 1 1 0 4
Czech Republic 0 0 0 0 0 2 1 3

202
Country
Year
2009 2010 2011 2012 2013 2014 2015 Total
Iran 1 0 0 0 1 1 0 3
Liechtenstein 0 1 0 0 1 1 0 3
Argentina 0 0 0 1 1 0 0 2
Egypt 0 0 0 0 0 1 1 2
Estonia 0 0 0 0 0 0 2 2
Iraq 0 0 0 0 1 0 1 2
Lebanon 0 0 0 0 0 1 1 2
Maldives 0 0 0 0 0 1 1 2
Nigeria 0 0 0 1 1 0 0 2
Saudi Arabia 0 0 0 0 0 2 0 2
Seychelles 0 0 0 0 0 1 1 2
Turkey 0 0 0 0 0 0 2 2
United Arab Emirates 1 0 1 0 0 0 0 2
Vietnam 0 0 0 0 1 1 0 2
Congo 0 0 0 0 0 1 0 1
Cyprus 0 0 0 0 0 1 0 1
Mali 0 0 0 0 0 1 0 1
Portugal 0 0 0 0 0 1 0 1
Total 652 696 754 849 918 1,175 905 5,949

203
Appendix 4
USD—IDR Exchange Rates for Tax Purposes, 2009–2015
Year
Exchange Rate Finance Minister
Decree USD1 to IDR Date
2009 IDR 9,502 31-Dec-09 1397/KM.1/2009
2010 IDR 9,044 31-Dec-10 1145/KM.1/2010
2011 IDR 9,069 31-Dec-11 1529/KM.1/2011
2012 IDR 9,708 31-Dec-12 27/KM.11/2012
2013 IDR 12,194 31-Dec-13 64/KM.11/2013
2014 IDR 12,441 31-Dec-14 59/KM.11/2014
2015 IDR 13,640 31-Dec-15 61/KM.11/2015

204
Appendix 5
Statutory Tax Rates, 2009–2015
Location
Tax Rate %
2009 2010 2011 2012 2013 2014 2015
Argentina 35 35 35 35 35 35 35
Australia 30 30 30 30 30 30 30
Austria 25 25 25 25 25 25 25
Belgium 33.99 33.99 33.99 33.99 33.99 33.99 33.99
British Virgin Islands 0 0 0 0 0 0 0
Brunei
23.5 22 21 20 20 18.5
Canada 33 31 28 26 26 26.5 26.5
Cayman Islands 0 0 0 0 0 0 0
Channel Islands 0 0 0 0 0 0 0
China 25 25 25 25 25 25 25
Congo
40 35 35 35
Cyprus 10 10 10 10 12.5 12.5 12.5
Czech Republic 20 19 19 19 19 19 19
Denmark 25 25 25 25 25 24.5 23.5
Egypt 20 20 20 25 25 25 25
Estonia 21 21 21 21 21 21 20
Finland 26 26 26 24.5 24.5 20 20
France 33.33 33.33 33.33 33.33 33.33 33.33 33.33
Germany 29.44 29.41 29.37 29.48 29.55 29.58 29.65
Guinea 35 35 35 35 35 35 35
Hong Kong, SAR 16.5 16.5 16.5 16.5 16.5 16.5 16.5

205
Location
Tax Rate %
2009 2010 2011 2012 2013 2014 2015
India 33.99 33.99 32.44 32.45 33.99 33.99 34.61
Indonesia 28 25 25 25 25 25 25
Iran 25 25 25 25 25 25 25
Iraq 15 15 15 15 15 15 15
Italy 31.4 31.4 31.4 31.4 31.4 31.4 31.4
Japan 40.69 40.69 40.69 38.01 38.01 35.64 33.06
Jordan 25 14 14 14 14 14 20
Kenya 30 30 30 30
Korea, Republic of 24.2 24.2 22 24.2 24.2 24.2 24.2
Lebanon 15 15 15 15 15 15 15
Liberia 25 25 25 25 25 25 25
Liechtenstein 12.5 12.5 12.5 12.5 12.5
Luxembourg 28.59 28.59 28.8 28.8 29.22 29.22 29.22
Malaysia 25 25 25 25 25 25 25
Maldives 0 0 0 0 0 0 0
Mali 30
Marshall Islands 0 0 0 0 0 0 0
Mauritius 15 15 15 15 15 15 15
Netherlands 25.5 25.5 25 25 25 25 25
New Zealand 30 30 28 28 28 28 28
Nigeria 30 30 30 30 30 30 30
Norway 28 28 28 28 28 27 27

206
Location
Tax Rate %
2009 2010 2011 2012 2013 2014 2015
Pakistan 35 35 35 35 35 34 33
Panama 30 27.5 25 25 25 25 25
Philippines 30 30 30 30 30 30 30
Poland 19 19 19 19 19 19 19
Portugal 25 25 25 25 25 23 21
Samoa 27 27 27 27 27 27 27
Saudi Arabia 20 20 20 20 20 20 20
Seychelles 40 33 33 33 33 33 33
Singapore 18 17 17 17 17 17 17
Spain 30 30 30 30 30 30 28
Sweden 26.3 26.3 26.3 26.3 22 22 22
Switzerland 18.96 18.75 18.31 18.06 18.01 17.92 17.92
Taiwan 25 17 17 17 17 17 17
Thailand 30 30 30 23 20 20 20
Turkey 20 20 20 20 20 20 20
United Arab Emirates 55 55 55 55 55 55 55
United Kingdom 28 28 26 24 23 21 20
United States 40 40 40 40 40 40 40
Vietnam 25 25 25 25 25 22 22
Sources: British Virgin Islands: http://www.ey.com/Publication/vwLUAssets/Worldwide_corporate_tax_
guide_2015/$FILE/Worldwide%20Corporate%20Tax%20Guide%202015.pdf; Brunei (2010–2011):
http://www.rd.go.th/publish/fileadmin/user_upload/AEC/AseanTax-Brunei.pdf, (2012–2015):
https://www2.deloitte.com/content/dam/Deloitte/global/Documents/Tax/dttl-tax-corporate-tax-rates-
2012-2016.pdf; Channel Islands: http://taxsummaries.pwc.com/uk/taxsummaries/wwts.nsf/ID/
Jersey-Corporate-Taxes-on-corporate-income; Guinea: http://www.tradingeconomics.com/guinea/
corporate-tax-rate; Iran: http://www.doingbusiness.org/data/exploreeconomies/iran/paying-taxes/; Iraq
(2009–2012): http://www.tradingeconomics.com/iraq/corporate-tax-rate; Lebanon (2009–2012):
http://www.tradingeconomics.com/lebanon/corporate-tax-rate; Liberia: http://www.doingbusiness.org/

207
data/exploreeconomies/liberia/paying-taxes/; Maldives: http://www.tradingeconomics.com/maldives/
corporate-tax-rate; Mali: http://www.doingbusiness.org/data/exploreeconomies/guinea/paying-taxes/;
Marshall Islands: http://www.doingbusiness.org/data/exploreeconomies/marshall-islands/paying-taxes;
Seychelles: http://www.tradingeconomics.com/seychelles/corporate-tax-rate; other locations/year:
https://home.kpmg.com/xx/en/home/services/tax/tax-tools-and-resources/tax-rates-online/corporate-tax-
rates-table.html.

208
Appendix 6
Final Sample by Two-digit Industry Primary Group, 2009–2015 (TI Model)
Industry Primary Groups
Year
Total
2009 2010 2011 2012 2013 2014 2015
10 (food industry) 28 30 27 37 32 28 16 198
11 (beverage industry) 5 5 6 5 8 7 3 39
12 (tobacco industry) 9 8 11 12 9 9 8 66
13 (textile industry) 22 24 23 25 23 26 18 161
14 (confection industry) 23 29 34 34 37 47 40 244
15 (leather and foot-ware) 15 18 20 20 26 30 33 162
16 (wood, non-furniture) 8 9 10 8 9 12 8 64
17 (paper industry) 5 4 5 5 9 8 8 44
18 (printing industry) 3 2 3 5 2 8 6 29
19 (coal and oil refinery) 1 1 1 0 1 4 2 10
20 (chemical industry) 44 49 51 52 57 50 43 346
21 (pharmaceutical) 4 4 4 4 4 4 2 26
22 (rubber industry) 39 42 39 44 43 46 37 290
23 (minerals non-metal) 18 18 15 18 21 22 9 121
24 (basic metal) 18 16 19 21 16 16 4 110
25 (metal goods) 22 27 28 30 27 37 23 194
26 (computers, electronics) 33 36 37 40 34 32 19 231
27 (electrical) 13 13 12 14 14 12 8 86
28 (industrial machinery) 29 29 29 38 38 38 34 235
29 (automobile) 35 39 42 45 39 44 21 265
30 (transport equipment 18 19 18 17 14 17 7 110
31 (furniture) 10 10 11 13 18 23 13 98
32 (processing) 7 7 9 11 11 13 14 72

209
Industry Primary Groups
Year
Total
2009 2010 2011 2012 2013 2014 2015
33 (repair-machinery) 6 5 7 9 10 9 10 56
35 (electricity and gas sup) 0 0 1 1 2 2 1 7
36 (water supply) 2 2 2 2 1 2 2 13
38 (waste management) 0 0 2 1 2 3 2 10
41 (non-civil construction) 7 9 9 12 15 29 22 103
42 (civil construction) 14 13 12 15 19 24 16 113
43 (special construction) 9 8 7 11 10 12 11 68
45 (automobile trading) 6 7 10 10 8 12 4 57
46 (non-automobile trad) 81 89 110 133 158 248 232 1,051
47 (non-automobile retail) 5 8 7 12 10 25 14 81
50 (water transport) 3 3 2 3 3 7 3 24
51 (air transport) 1 2 2 1 1 1 0 8
52 (transportation support) 11 11 15 13 19 23 19 111
55 (accommodation) 7 8 8 12 12 20 9 76
56 (food and beverage) 4 3 4 5 13 23 21 73
58 (publishing) 0 0 0 0 0 2 4 6
61 (telecommunication) 3 3 4 2 2 7 5 26
62 (programming) 6 5 5 5 9 11 14 55
63 (information service) 2 1 3 4 2 11 12 35
66 (supporting financial) 0 0 0 1 1 1 0 3
68 (real estate) 10 12 11 13 12 18 18 94
70 (management consult) 19 27 27 32 50 66 58 279
71(architecture service) 14 9 15 13 14 15 13 93
72 (research and dev) 2 1 1 1 3 1 0 9
73 (adv. and market rese) 0 0 0 0 0 0 1 1

210
Industry Primary Groups
Year
Total
2009 2010 2011 2012 2013 2014 2015
74 (other professional) 4 4 4 5 7 11 7 42
77 (rental services) 3 3 2 2 2 1 1 14
78 (employment services) 1 0 1 2 1 2 2 9
79 (travel agencies) 3 3 3 3 3 4 1 20
81 (bldg. and landscaping) 0 1 1 1 1 1 0 5
82 (administration) 2 2 3 2 5 5 1 20
85 (education services) 1 0 1 1 2 3 3 11
86 (health services) 2 2 1 1 1 5 1 13
89 (other social services) 0 0 1 0 2 2 0 5
91(library and archive) 9 9 11 10 13 20 8 80
93 (sport services) 3 3 4 5 5 6 5 31
95 (repair services) 0 0 0 0 0 1 1 2
96 (other personal services) 0 1 2 4 2 5 3 17
99 (international agencies) 3 3 2 4 6 4 5 27
Total 652 696 754 849 918 1,175 905 5,949

211
Appendix 7
Variance Inflation Factor—Study 1
Variable
VIF
TI AP
Pooled OLS
with
clustered
errors
Pooled OLS
after log-
transforming
the
dependent
variable +
clustering
errors
Pooled OLS
with
clustered
errors
Pooled OLS
after log-
transforming
the
dependent
variable +
clustering
errors
TRdiff 1.17 1.19 1.18 1.18
lnSales 1.97 1.82 1.88 1.87
Age 1.72 1.62 1.67 1.67
Industry group (max) 5.66 4.60 4.79 4.78
Year (max) 2.31 1.96 2.16 2.15

212
Appendix 8
Regression Result for Industry Groups: Effect of Tax Rate Difference on TI
𝑇𝐼/𝑆𝑖𝑡 = 𝛽0 + 𝛽1𝑇𝑅𝑑𝑖𝑓𝑓𝑖𝑡 + 𝛽2 ln 𝑆𝑎𝑙𝑒𝑠𝑖𝑡 + 𝛽3𝐴𝑔𝑒𝑖𝑡 + 𝛽4−64𝐼𝑛𝑑𝑢𝑠𝑡𝑟𝑦𝑖𝑡 +
𝛽65−70𝑌𝑒𝑎𝑟𝑡 + 𝜀𝑖𝑡
Industry Group Estimated Coefficient t-statistic
11 (beverage industry) 0.141 8.03***
12 (tobacco industry) 0.133 9.37***
13 (textile industry) −0.033 −3.09***
14 (confection industry) −0.042 −4.41***
15 (leather goods and foot-ware) −0.026 −2.48**
16 (wood, non-furniture) −0.042 −2.92***
17 (paper industry) −0.030 −1.78*
18 (printing industry) −0.005 −0.25
19 (coal and oil refinery) 0.046 1.44
20 (chemical industry) 0.011 1.21
21 (pharmaceutical) −0.030 −1.46
22 (rubber industry) −0.028 −3.04***
23 (minerals non-metal) −0.011 −0.93
24 (basic metal) −0.019 −1.59
25 (metal goods) 0.016 1.57
26 (computers, electronics) −0.050 −5.21***
27 (electrical) −0.029 −2.20**
28 (industrial machinery) 0.004 0.46
29 (automobile) 0.008 0.88
30 (transport equipment 0.020 1.68*

213
Industry Group Estimated Coefficient t-statistic
31 (furniture) −0.034 −2.73***
32 (processing) −0.030 −2.20**
33 (repair-machinery) 0.024 1.56
35 (electricity and gas supply) 0.018 0.47
36 (water supply) 0.119 4.16***
38 (waste management) 0.021 0.65
41 (non-civil construction) −0.081 −6.70***
42 (civil construction) −0.054 −4.57***
43 (special construction) −0.056 −4.00***
45 (automobile trading) −0.020 −1.36
46 (non-automobile trading) −0.007 −0.86
47 (non-automobile retail) −0.037 −2.78***
50 (water transport) −0.046 −2.12**
51 (air transport) −0.026 −0.72
52 (transportation support) 0.045 3.81***
55 (accommodation) −0.013 −0.98
56 (food and beverage service) −0.014 −0.97
58 (publishing) −0.063 −1.53
61 (telecommunication) 0.033 1.60
62 (programming) 0.029 1.92*
63 (information service) −0.014 −0.78
66 (supporting financial services) −0.013 −0.22
68 (real estate) −0.022 −1.75

214
Industry Group Estimated Coefficient t-statistic
70 (management consulting) 0.047 4.84***
71(architecture service) −0.003 −0.23
72 (research and development) 0.130 3.83***
73 (advertising and market research) −0.011 −0.11
74 (other professional services) 0.046 2.72***
77 (rental services) 0.060 2.16**
78 (employment services) 0.055 1.63
79 (travel agencies) −0.037 −1.59
81 (building and landscaping services) −0.016 −0.37
82 (administration services) 0.017 0.74
85 (education services) −0.008 −0.26
86 (health services) −0.043 −1.49
89 (other social services) −0.027 −0.60
91(library and archive services) 0.086 6.51***
93 (sport services) 0.042 2.19**
95 (repair-computer and households) −0.002 −0.03
96 (other personal services) −0.051 −2.01**
99 (international agencies) 0.042 2.05**

215
Appendix 9
Unbalanced Panel Data—Study 1 (TI Model)
Frequency % Cumulated Pattern
255 13.81 13.81 . . . . . . 1
214 11.59 25.39 . . . . . 1 .
184 9.96 35.35 . . . . . 11
158 8.55 43.91 1111111
155 8.39 52.3 111111 .
66 3.57 55.87 11111 . .
56 3.03 58.91 . . . . 11 .
52 2.82 61.72 . . . . 1 . .
52 2.82 64.54 . . . . 111
655 35.46 100 (other patterns)
1,847 100
XXXXXXX
Notes: The panel is unbalanced: There are 1,847 firms with 5,973 firm-year observations. On average, a
firm has 3.2 yearly observations. Some firms have data for only one year (e.g., 255 firms have data for 2015
only; 214 firms have data for 2014 only). Only 158 firms out of 1,847 (less than 9%) have data for all seven
years.

216
Appendix 10
Final Sample by Country of Parent, 2009–2015 (Study 2)
A. AP
Country
Year
2009 2010 2011 2012 2013 2014 2015 Total
Japan 98 108 116 125 80 144 116 787
Korea, Republic of 77 91 114 112 44 92 186 716
Singapore 55 59 70 63 37 60 65 409
Malaysia 22 22 29 22 18 27 45 185
China 11 13 19 13 5 14 50 125
Taiwan 18 22 21 21 5 11 25 123
United States 10 17 15 16 17 20 19 114
Netherlands 19 19 14 12 9 15 15 103
Australia 14 11 14 11 15 16 16 97
Germany 10 13 15 15 13 14 17 97
British Virgin Islands 14 16 19 13 8 10 12 92
United Kingdom 12 13 16 13 8 10 10 82
Hong Kong, SAR 11 11 10 9 6 7 14 68
France 10 10 11 10 7 4 13 65
India 6 6 11 6 4 5 14 52
Switzerland 8 7 7 6 7 6 3 44
Thailand 3 3 4 2 7 6 2 27
Mauritius 4 4 4 3 2 4 5 26
Luxembourg 1 2 4 4 3 4 3 21
Spain 0 1 0 4 3 3 3 14

217
Country
Year
2009 2010 2011 2012 2013 2014 2015 Total
Italy 2 1 2 3 1 1 2 12
Belgium 1 1 2 2 1 2 2 11
Canada 1 2 3 4 0 0 1 11
Sweden 0 2 1 2 2 1 3 11
Austria 1 2 2 1 1 1 2 10
Samoa 1 1 1 0 2 2 3 10
Denmark 1 1 1 1 0 3 2 9
Marshall Islands 1 1 1 1 1 1 1 7
Pakistan 2 2 0 0 0 1 1 6
Cayman Islands 0 0 1 1 1 1 1 5
Liberia 1 1 0 1 1 1 0 5
Philippines 1 1 1 0 0 0 2 5
Channel Islands 1 0 1 1 1 0 0 4
Panama 0 0 1 1 1 0 1 4
Poland 0 1 1 1 0 1 0 4
Brunei 0 0 0 1 1 1 0 3
Finland 0 0 1 0 1 1 0 3
Jordan 0 0 1 0 1 0 1 3
Argentina 0 0 0 1 0 0 1 2
Liechtenstein 0 0 0 0 1 1 0 2
Norway 1 0 0 0 0 0 1 2
Seychelles 1 0 0 0 0 1 0 2

218
Country
Year
2009 2010 2011 2012 2013 2014 2015 Total
United Arab Emirates 1 0 1 0 0 0 0 2
Bahrain 0 0 0 0 0 0 1 1
Czech Republic 0 0 0 0 0 0 1 1
Egypt 0 0 0 0 0 0 1 1
Estonia 0 0 0 0 0 0 1 1
Guinea 0 1 0 0 0 0 0 1
Iran 1 0 0 0 0 0 0 1
Iraq 0 0 0 0 0 0 1 1
Lebanon 0 0 0 0 0 0 1 1
New Zealand 0 0 0 1 0 0 0 1
Vietnam 0 0 0 0 0 0 1 1
Total 420 465 534 502 314 491 664 3,390
B. TI
Country
Year
2009 2010 2011 2012 2013 2014 2015 Total
Japan 99 108 120 126 73 129 76 731
Korea, Republic of 89 97 127 118 44 83 150 708
Singapore 62 64 74 69 42 53 41 405
Malaysia 24 22 30 22 16 27 26 167
Taiwan 17 21 22 20 6 10 15 111
United States 12 17 18 18 17 19 10 111
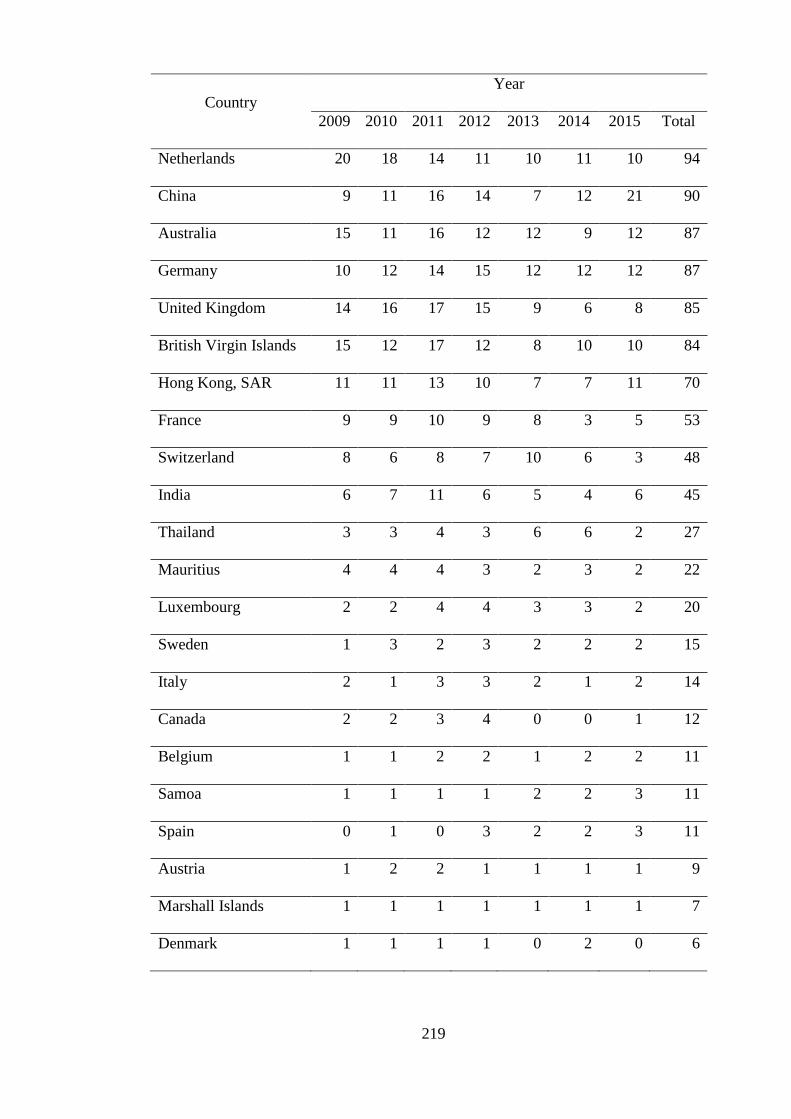
219
Country
Year
2009 2010 2011 2012 2013 2014 2015 Total
Netherlands 20 18 14 11 10 11 10 94
China 9 11 16 14 7 12 21 90
Australia 15 11 16 12 12 9 12 87
Germany 10 12 14 15 12 12 12 87
United Kingdom 14 16 17 15 9 6 8 85
British Virgin Islands 15 12 17 12 8 10 10 84
Hong Kong, SAR 11 11 13 10 7 7 11 70
France 9 9 10 9 8 3 5 53
Switzerland 8 6 8 7 10 6 3 48
India 6 7 11 6 5 4 6 45
Thailand 3 3 4 3 6 6 2 27
Mauritius 4 4 4 3 2 3 2 22
Luxembourg 2 2 4 4 3 3 2 20
Sweden 1 3 2 3 2 2 2 15
Italy 2 1 3 3 2 1 2 14
Canada 2 2 3 4 0 0 1 12
Belgium 1 1 2 2 1 2 2 11
Samoa 1 1 1 1 2 2 3 11
Spain 0 1 0 3 2 2 3 11
Austria 1 2 2 1 1 1 1 9
Marshall Islands 1 1 1 1 1 1 1 7
Denmark 1 1 1 1 0 2 0 6

220
Country
Year
2009 2010 2011 2012 2013 2014 2015 Total
Pakistan 2 2 1 1 0 0 0 6
Liberia 1 1 0 1 1 1 0 5
Channel Islands 1 0 1 1 1 0 0 4
Panama 0 0 1 1 1 0 1 4
Brunei 0 0 0 1 1 1 0 3
Liechtenstein 0 1 0 0 1 1 0 3
Philippines 1 0 1 0 0 0 1 3
Poland 0 1 1 1 0 0 0 3
Jordan 0 0 1 0 1 0 0 2
Norway 1 0 0 0 0 0 1 2
Seychelles 0 0 0 0 0 1 1 2
United Arab Emirates 1 0 1 0 0 0 0 2
Argentina 0 0 0 1 0 0 0 1
Cayman Islands 0 0 0 0 0 0 1 1
Guinea 0 1 0 0 0 0 0 1
Iran 1 0 0 0 0 0 0 1
Iraq 0 0 0 0 0 0 1 1
Kenya 0 0 1 0 0 0 0 1
Lebanon 0 0 0 0 0 0 1 1
New Zealand 0 0 0 1 0 0 0 1
Total 447 470 562 521 314 430 444 3,188

221
Appendix 11
Unbalanced Panel Data—Study 2
A. AP
Frequency % Cumulated Pattern
299 24.33 24.33 . . . . . . 1
86 7 31.33 . . . . . 1 .
61 4.96 36.29 1111111
52 4.23 40.52 . . . . . 11
50 4.07 44.59 1111 . . .
34 2.77 47.36 . . 1 . . . .
33 2.69 50.04 111111 .
32 2.6 52.64 . . . 1 . . .
28 2.28 54.92 11111 . .
554 45.08 100 (other patterns)
1,229 100
XXXXXXX
Notes: The panel is unbalanced: There are 1,229 firms with 3,390 firm-year observations. On average, a
firm has 2.8 yearly observations. Some firms have data for only one year (e.g., 299 firms have data for 2015
only; 86 firms have data for 2014 only). Only 61 firms out of 1,229 (about 5%) have data for all seven
years.
B. TI
Frequency % Cumulated Pattern
170 15.81 15.81 . . . . . . 1
75 6.98 22.79 . . . . . 1 .
64 5.95 28.74 1111 . . .
51 4.74 33.49 1111111
49 4.56 38.05 111111 .

222
Frequency % Cumulated Pattern
35 3.26 41.3 . . 1 . . . .
35 3.26 44.56 11111 . .
33 3.07 47.63 . . . 1 . . .
31 2.88 50.51 . . . . . 11
532 49.49 100 (other patterns)
1,075 100
XXXXXXX
Notes: As in Study 1, the panel is unbalanced: There are 1,075 firms with 3,188 firm-year observations. On
average, a firm has three yearly observations. Some firms have data for only one year (e.g., 170 firms have
data for 2015 only; 75 firms have data for 2014 only). Only 51 firms out of 1,075 (less than 5%) have data
for all seven years.

223
Appendix 12
Variance Inflation Factor—Study 2
Variable
VIF
AP TI
Parent’s tax rate 1.02 1.03
Natural log of capital 2.54 2.56
Natural log of labour 2.53 2.59

224
Appendix 13
Related Parties under Indonesian Income Tax Law
Income Tax Law No. 7/1983 as lastly amended by Law No. 36/2008 ITL Article
18 (4a) refers to related parties as two companies or more that meet at least one of the
following two criteria:
a. Ownership
If a taxpayer directly or indirectly owns at least 25% of the equity of another
taxpayer, or if a relationship exists between two taxpayers through common ownership
of at least 25% of equity by a third taxpayer, all taxpayers involved are related parties.
Figure 1 illustrates related parties based on ownership according to the elucidation of ITL
Article 18 (4a).
Figure A13.1
Illustration of Related Parties Based on Ownership
50% 25%
50%
As shown in Figure A13.1, Company A directly owns 50% of shares of Company
B. Company B owns 50% of shares of Company C. Company A therefore indirectly has
ownership of 25% of shares of Company C. Further, Company A also has 25% of shares
of Company D. Thus, Company A, Company B, Company C and Company D are
considered related parties (e.g., Company A and Company B are related parties because
Company A
Company B
Company C
Company D

225
of direct ownership, Company A and Company C are related parties because of indirect
ownership, and Company C and Company D are related parties because of common
ownership by Company A.
b. Management or technology
Two companies or more are considered related parties if they are under the same
management or technology. This provision implies that companies do not have to have
ownership to be considered related parties. The presence of control of management and
technology in one company by another company are sufficient to indicate that the two
companies are related parties for tax purposes.
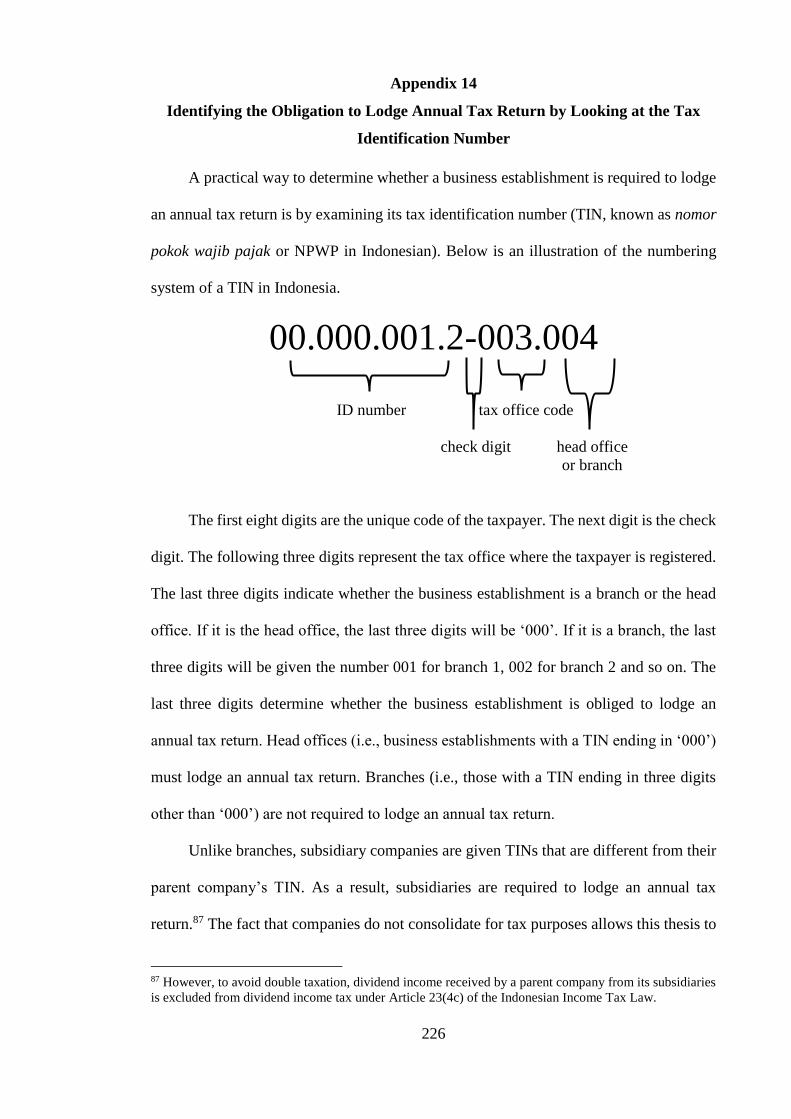
226
Appendix 14
Identifying the Obligation to Lodge Annual Tax Return by Looking at the Tax
Identification Number
A practical way to determine whether a business establishment is required to lodge
an annual tax return is by examining its tax identification number (TIN, known as nomor
pokok wajib pajak or NPWP in Indonesian). Below is an illustration of the numbering
system of a TIN in Indonesia.
00.000.001.2-003.004
ID number tax office code
check digit head office
or branch
The first eight digits are the unique code of the taxpayer. The next digit is the check
digit. The following three digits represent the tax office where the taxpayer is registered.
The last three digits indicate whether the business establishment is a branch or the head
office. If it is the head office, the last three digits will be ‘000’. If it is a branch, the last
three digits will be given the number 001 for branch 1, 002 for branch 2 and so on. The
last three digits determine whether the business establishment is obliged to lodge an
annual tax return. Head offices (i.e., business establishments with a TIN ending in ‘000’)
must lodge an annual tax return. Branches (i.e., those with a TIN ending in three digits
other than ‘000’) are not required to lodge an annual tax return.
Unlike branches, subsidiary companies are given TINs that are different from their
parent company’s TIN. As a result, subsidiaries are required to lodge an annual tax
return.87 The fact that companies do not consolidate for tax purposes allows this thesis to
87 However, to avoid double taxation, dividend income received by a parent company from its subsidiaries
is excluded from dividend income tax under Article 23(4c) of the Indonesian Income Tax Law.

227
examine whether FOICs shift profits by means of intra-group debt financing by
comparing the use of long-term liability to related parties between FOICs and DOICs.
Under Indonesian Financial Reporting Standard No. 4 (Pernyataan Standar Akuntansi
Keuangan/PSAK No. 4), companies are required to prepare consolidated financial
statements for accounting purposes.

228
Appendix 15
Final Sample by Country of Parent, 2009–2015 (Study 3)
A. EBIT/S
Country
Year
Total
2009 2010 2011 2012 2013 2014 2015
Japan 81 78 82 82 74 87 86 570
Korea, Republic of 64 61 67 77 59 77 88 493
Singapore 41 42 49 54 54 63 58 361
Malaysia 17 21 21 20 22 30 34 165
United States 15 12 16 14 18 23 15 113
China 8 8 11 21 12 22 19 101
Netherlands 12 13 12 11 13 20 20 101
Taiwan 16 14 13 15 7 13 11 89
Germany 7 11 9 10 9 13 12 71
United Kingdom 8 8 11 7 14 13 9 70
Australia 10 9 10 9 8 11 12 69
British Virgin Islands 7 10 12 7 8 13 10 67
Hong Kong, SAR 5 4 8 9 10 8 10 54
France 9 10 9 7 4 4 6 49
Switzerland 6 7 7 7 8 7 3 45
India 4 4 6 5 5 6 5 35
Thailand 4 5 5 2 6 4 4 30
Mauritius 2 2 4 3 2 2 3 18
Canada 2 2 1 3 2 1 4 15
Luxembourg 1 1 2 1 2 5 3 15

229
Country
Year
Total
2009 2010 2011 2012 2013 2014 2015
Samoa 1 2 2 2 2 1 2 12
Italy 2 1 2 1 2 2 1 11
Spain 0 1 0 0 3 3 3 10
Pakistan 2 1 2 2 1 1 0 9
Liberia 1 1 1 1 1 1 1 7
Seychelles 1 1 1 1 1 1 1 7
Sweden 1 1 1 1 1 1 1 7
Philippines 0 1 1 1 1 1 1 6
Austria 1 1 0 0 1 1 1 5
Guinea 1 1 0 1 1 1 0 5
Norway 1 1 1 1 0 0 1 5
Liechtenstein 1 0 0 0 1 1 1 4
Denmark 1 0 0 0 0 1 1 3
New Zealand 0 0 0 0 0 1 1 2
Panama 1 0 0 0 0 0 1 2
United Arab Emirates 1 0 1 0 0 0 0 2
Vietnam 0 0 0 0 1 1 0 2
Belgium 0 0 0 0 0 1 0 1
Brunei 0 0 0 0 1 0 0 1
Channel Islands 0 0 0 0 0 1 0 1
Estonia 0 0 0 0 0 0 1 1
Nigeria 0 0 0 1 0 0 0 1

230
Country
Year
Total
2009 2010 2011 2012 2013 2014 2015
Portugal 0 0 0 0 0 1 0 1
Total 334 334 367 376 354 442 429 2,636
B. LTL_RP/TA
Country
Year
Total
2009 2010 2011 2012 2013 2014 2015
Japan 120 133 139 139 135 132 116 914
Korea, Republic of 74 78 88 79 80 86 119 604
Singapore 58 68 72 72 79 89 88 526
Malaysia 20 26 33 26 27 28 50 210
United States 13 20 22 22 24 28 20 149
Netherlands 21 22 20 19 16 25 25 148
China 12 14 18 9 9 11 47 120
Taiwan 12 17 18 16 15 17 20 115
British Virgin Islands 12 13 17 16 14 15 19 106
United Kingdom 13 16 13 16 14 18 13 103
Hong Kong, SAR 11 12 14 12 14 13 22 98
Australia 12 10 14 15 15 12 16 94
Germany 9 13 12 12 13 16 14 89
France 10 11 11 11 12 14 8 77
India 7 7 9 8 7 8 17 63
Switzerland 9 8 8 7 8 8 5 53
Thailand 5 5 4 3 6 5 9 37

231
Country
Year
Total
2009 2010 2011 2012 2013 2014 2015
Luxembourg 3 4 5 4 5 5 3 29
Mauritius 4 4 4 4 4 3 2 25
Canada 2 3 2 2 2 2 3 16
Spain 0 1 1 3 3 3 5 16
Pakistan 3 2 2 2 2 3 1 15
Italy 2 1 2 1 2 2 3 13
Denmark 1 2 1 1 2 2 1 10
Sweden 1 2 2 2 1 1 1 10
Belgium 1 1 1 1 1 2 2 9
Samoa 1 1 1 1 2 1 2 9
New Zealand 0 1 1 1 1 2 2 8
Liberia 1 1 1 1 1 1 1 7
Austria 0 1 1 1 1 1 1 6
Finland 1 1 1 1 1 1 0 6
Channel Islands 1 0 1 1 1 1 0 5
Liechtenstein 1 1 0 1 0 0 1 4
Panama 0 0 1 1 1 0 1 4
Philippines 0 1 1 0 0 1 1 4
Seychelles 1 1 1 0 0 0 1 4
Cayman Islands 0 0 0 0 0 1 2 3
Estonia 0 0 0 0 0 1 2 3
Jordan 0 0 1 0 1 0 1 3

232
Country
Year
Total
2009 2010 2011 2012 2013 2014 2015
Nigeria 0 0 1 0 0 0 1 2
Norway 1 0 0 0 0 0 1 2
Saudi Arabia 0 1 1 0 0 0 0 2
United Arab Emirates 1 0 1 0 0 0 0 2
Bahrain 0 0 0 0 0 0 1 1
Cyprus 0 0 0 0 0 1 0 1
Egypt 0 0 0 0 0 0 1 1
Guinea 0 1 0 0 0 0 0 1
Kenya 0 1 0 0 0 0 0 1
Vietnam 0 0 0 0 0 0 1 1
Total 443 504 545 510 519 559 649 3,729

233
Appendix 16
Variance Inflation Factor—Study 3
Variable
VIF
EBIT/S LTL_RP/TA
FOIC 1.01 1.01
lnSales 1.39 1.31
Age 1.38 1.37
Capital intensity 1.28
Industry group (max) 3.59 4.14
Year (max) 1.93 2.22

234
Appendix 17
Regression Result before the Matching Procedure for Industry Groups: How
FOICs Differ from DOICs in Terms of EBIT and Long-term Liabilities to Related
Parties
A. EBIT/S
𝐸𝐵𝐼𝑇/𝑆𝑖𝑡 = 𝛽0 + 𝛽1𝐹𝑂𝐼𝐶𝑖𝑡 + 𝛽2 ln 𝑆𝑎𝑙𝑒𝑠𝑖𝑡 + 𝛽3𝐴𝑔𝑒𝑖𝑡 + 𝛽4−76𝐼𝑛𝑑𝑢𝑠𝑡𝑟𝑦𝑖𝑡 + 𝛽77−82𝑌𝑒𝑎𝑟𝑡
+ 𝜀𝑖𝑡
Industry Group Estimated Coefficient t-statistic
11 (beverage industry) -0.008 -0.13
12 (tobacco industry) 0.076 3.22
13 (textile industry) -0.082 -4.80
14 (confection industry) -0.086 -6.54
15 (leather goods and foot-ware) -0.066 -3.48
16 (wood, non-furniture) -0.105 -4.10
17 (paper industry) -0.070 -4.31
18 (printing industry) -0.058 -3.89
19 (coal and oil industry) -0.088 -4.58
20 (chemical industry) -0.039 -2.79
21 (pharmaceutical) -0.032 -1.97
22 (rubber industry) -0.062 -4.79
23 (minerals non-metal) -0.037 -2.40
24 (basic metal) -0.100 -5.63
25 (metal goods) -0.035 -2.38
26 (computers, electronics) -0.089 -3.53
27 (electrical) -0.058 -3.84

235
Industry Group Estimated Coefficient t-statistic
28 (industrial machinery) -0.021 -1.21
29 (automobile) -0.023 -1.47
30 (transport equipment -0.045 -2.84
31 (furniture) -0.059 -4.21
32 (processing) -0.013 -0.48
33 (repair-machinery) -0.032 -1.35
35 (electricity and gas supply) -0.026 -0.80
36 (water supply) 0.105 3.41
37 (industry-waste management) -0.024 -2.04
38 (waste management) -0.019 -0.93
41 (non-civil construction) -0.008 -0.44
42 (civil construction) -0.017 -1.06
43 (special construction) -0.011 -0.64
45 (automobile trading) -0.090 -6.73
46 (non-automobile trading) -0.066 -5.52
47 (non-automobile retail) -0.072 -5.36
49 (land transport) 0.020 0.83
50 (water transport) 0.150 4.54
51 (air transport) -0.123 -4.57
52 (transportation support) -0.017 -0.96
53 (post and courier) -0.074 -4.07
55 (accommodation) 0.002 0.07
56 (food and beverage service) -0.104 -4.88

236
Industry Group Estimated Coefficient t-statistic
58 (publishing) 0.033 0.87
59 (audio and video) -0.063 -2.41
60 (broadcasting) 0.101 2.13
61 (telecommunication) -0.030 -1.04
62 (programming) -0.034 -1.83
63 (information service) 0.110 2.89
64 (non-insurance and pension f. services) 0.307 14.30
65 (insurance and pension) 0.250 6.02
66 (supporting financial services) 0.302 13.62
68 (real estate) 0.206 9.86
69 (law and accounting) 0.099 4.62
70 (management consulting) 0.032 1.61
71(architecture service) -0.032 -1.96
72 (research and development) 0.016 0.24
73 (advertising and market research) -0.061 -3.43
74 (other professional services) -0.023 -0.95
77 (rental services) 0.191 5.42
78 (employment services) -0.070 -5.17
79 (travel agencies) -0.122 -9.26
80 (security and investigation) -0.062 -4.96
81 (building and landscaping) 0.047 0.76
82 (administration services) -0.042 -2.02
85 (education services) 0.001 0.06

237
Industry Group Estimated Coefficient t-statistic
86 (health services) -0.043 -2.19
88 (social service) 0.701 60.30
89 (other social services) -0.047 -2.18
90 (entertainment and arts) -0.120 -2.64
91 (entertainment and arts) -0.032 -1.45
93 (sport services) -0.015 -0.28
94 (organisation membership) -0.136 -1.52
95 (repair-computer and households) 0.030 0.80
96 (other personal services) 0.058 0.50
99 (international agencies) -0.027 -1.11
B. LTL_RP/TA
𝐿𝑇𝐿_𝑅𝑃/𝑇𝐴𝑖𝑡 = 𝛽0 + 𝛽1𝐹𝑂𝐼𝐶𝑖𝑡 + 𝛽2 ln 𝑆𝑎𝑙𝑒𝑠𝑖𝑡 + 𝛽3𝐶𝑎𝑝𝐼𝑛𝑡𝑖𝑡 + 𝛽4𝐴𝑔𝑒𝑖𝑡 +
𝛽5−77𝐼𝑛𝑑𝑢𝑠𝑡𝑟𝑦𝑖𝑡 + 𝛽78−83𝑌𝑒𝑎𝑟𝑡 + 𝜀𝑖𝑡
Industry Group Estimated Coefficient t-statistic
11 (beverage industry) -0.014 -0.59
12 (tobacco industry) 0.020 1.33
13 (textile industry) -0.032 -2.12
14 (confection industry) -0.035 -4.18
15 (leather goods and foot-ware) -0.005 -0.15
16 (wood, non-furniture) 0.010 0.45
17 (paper industry) -0.035 -4.06
18 (printing industry) -0.034 -4.28
19 (coal and oil industry) -0.019 -1.18

238
Industry Group Estimated Coefficient t-statistic
20 (chemical industry) -0.028 -3.04
21 (pharmaceutical) -0.016 -1.06
22 (rubber industry) -0.040 -4.88
23 (minerals non-metal) -0.021 -1.66
24 (basic metal) -0.040 -4.88
25 (metal goods) -0.023 -2.14
26 (computers, electronics) -0.032 -2.64
27 (electrical) -0.038 -4.63
28 (industrial machinery) -0.027 -2.46
29 (automobile) -0.035 -3.59
30 (transport equipment -0.048 -5.91
31 (furniture) -0.032 -3.05
32 (processing) -0.031 -1.83
33 (repair-machinery) 0.012 0.31
35 (electricity and gas supply) 0.060 1.72
36 (water supply) -0.042 -2.30
37 (industry-waste management) -0.054 -7.15
38 (waste management) -0.043 -5.32
41 (non-civil construction) -0.031 -3.83
42 (civil construction) -0.029 -3.54
43 (special construction) -0.035 -4.44
45 (automobile trading) -0.027 -3.15
46 (non-automobile trading) -0.029 -3.88

239
Industry Group Estimated Coefficient t-statistic
47 (non-automobile retail) -0.034 -4.46
49 (land transport) -0.035 -3.33
50 (water transport) -0.006 -0.44
51 (air transport) -0.029 -3.01
52 (transportation support) -0.026 -2.88
53 (post and courier) -0.043 -4.76
55 (accommodation) 0.000 0.00
56 (food and beverage service) -0.023 -1.81
58 (publishing) -0.022 -1.81
59 (audio and video) -0.037 -4.57
60 (broadcasting) 0.008 0.40
61 (telecommunication) -0.021 -1.94
62 (programming) -0.027 -2.50
63 (information service) -0.026 -2.47
64 (non-insurance and pension f. services ) -0.017 -1.98
65 (insurance and pension) 0.010 0.97
66 (supporting financial services) -0.031 -4.03
68 (real estate) -0.022 -2.64
69 (law and accounting) -0.023 -1.90
70 (management consulting) -0.015 -1.47
71(architecture service) -0.020 -1.90
72 (research and development) -0.011 -0.50
73 (advertising and market research) -0.029 -3.43

240
Industry Group Estimated Coefficient t-statistic
74 (other professional services) -0.030 -2.82
77 (rental services) -0.032 -3.16
78 (employment services) -0.025 -2.69
79 (travel agencies) -0.018 -1.04
80 (security and investigation) -0.035 -4.58
81 (building and landscaping) -0.041 -5.30
82 (administration services) -0.042 -4.90
85 (education services) -0.035 -3.59
86 (health services) -0.031 -2.10
88 (social service) -0.035 -4.69
89 (other social services) -0.032 -3.13
90 (entertainment and arts) -0.049 -5.99
91 (entertainment and arts) -0.009 -0.76
93 (sport services) -0.028 -1.57
94 (organisation membership) -0.034 -4.58
95 (repair-computer and households) -0.014 -0.88
96 (other personal services) -0.049 -4.28
99 (international agencies) -0.003 -0.20

241
Appendix 18
Regression Result after the Matching Procedure for Industry Groups: How FOICs
Differ from DOICs in Terms of EBIT and Long-term Liabilities to Related Parties
A. EBIT/S
𝐸𝐵𝐼𝑇/𝑆𝑖𝑡 = 𝛽0 + 𝛽1𝐹𝑂𝐼𝐶𝑖𝑡 + 𝛽2 ln 𝑆𝑎𝑙𝑒𝑠𝑖𝑡 + 𝛽3𝐴𝑔𝑒𝑖𝑡 + 𝛽4−53𝐼𝑛𝑑𝑢𝑠𝑡𝑟𝑦𝑖𝑡 + 𝛽54−59𝑌𝑒𝑎𝑟𝑡 +
𝜀𝑖𝑡
Industry Group Estimated Coefficient t-statistic
11 (beverage industry) 0.030 0.46
12 (tobacco industry) - 0.028 -0.56
13 (textile industry) - 0.055 -2.24**
14 (confection industry) - 0.077 -3.60***
15 (leather goods and foot-ware) - 0.072 -3.20***
16 (wood, non-furniture) - 0.070 -2.72***
17 (paper industry) - 0.046 -1.63
18 (printing industry) - 0.072 -2.30**
20 (chemical industry) - 0.032 -1.57
21 (pharmaceutical) - 0.065 -2.17**
22 (rubber industry) - 0.049 -2.53**
23 (minerals non-metal) - 0.043 -2.04**
24 (basic metal) - 0.064 -2.88***
25 (metal goods) - 0.017 -0.69
26 (computers, electronics) - 0.101 -3.51***
27 (electrical) -0.046 -1.91*
28 (industrial machinery) -0.026 -1.07
29 (automobile) -0.011 -0.43

242
Industry Group Estimated Coefficient t-statistic
30 (transport equipment -0.040 -1.90*
31 (furniture) -0.042 -1.64*
32 (processing) -0.029 -0.96
33 (repair-machinery) 0.038 1.78*
35 (electricity and gas supply) 0.025 0.45
36 (water supply) 0.138 5.91***
41 (non-civil construction) 0.006 0.17
42 (civil construction) -0.009 -0.24
43 (special construction) -0.021 -0.63
45 (automobile trading) -0.051 -2.28**
46 (non-automobile trading) -0.042 -2.03*
47 (non-automobile retail) -0.080 -3.12***
50 (water transport) 0.056 0.47
51 (air transport) -0.213 -2.99***
52 (transportation support) -0.012 -0.35
55 (accommodation) -0.027 -0.53
61 (telecommunication) -0.062 -0.75
62 (programming) -0.021 -0.78
63 (information service) 0.219 2.49**
68 (real estate) 0.226 4.30***
70 (management consulting) 0.022 0.80
71(architecture service) -0.028 -1.07
72 (research and development) 0.091 2.00**

243
Industry Group Estimated Coefficient t-statistic
73 (advertising and market research) -0.166 -2.46**
74 (other professional services) 0.035 0.75
78 (employment services) 0.016 0.32
79 (travel agencies) -0.077 -2.82***
85 (education services) 0.034 0.56
86 (health services) 0.014 0.27
89 (other social services) -0.069 -3.32***
91 (library and archive services) -0.010 -0.24
99 (international agencies) -0.106 -2.35**
B. LTL_RP/TA
𝐿𝑇𝐿_𝑅𝑃/𝑇𝐴𝑖𝑡 = 𝛽0 + 𝛽1𝐹𝑂𝐼𝐶𝑖𝑡 + 𝛽2 ln 𝑆𝑎𝑙𝑒𝑠𝑖𝑡 + 𝛽3𝐶𝑎𝑝𝐼𝑛𝑡𝑖𝑡 + 𝛽4𝐴𝑔𝑒𝑖𝑡 +
𝛽5−61𝐼𝑛𝑑𝑢𝑠𝑡𝑟𝑦𝑖𝑡 + 𝛽62−67𝑌𝑒𝑎𝑟𝑡 + 𝜀𝑖𝑡
Industry Group Estimated Coefficient t-statistic
11 (beverage industry) -0.024 -0.73
12 (tobacco industry) 0.037 0.92
13 (textile industry) -0.046 -1.84*
14 (confection industry) -0.053 -3.11***
15 (leather goods and foot-ware) 0.001 0.01
16 (wood, non-furniture) 0.024 0.60
17 (paper industry) -0.058 -3.49***
18 (printing industry) -0.054 -2.73***
20 (chemical industry) -0.044 -2.50**
21 (pharmaceutical) -0.032 -1.40

244
Industry Group Estimated Coefficient t-statistic
22 (rubber industry) -0.064 -3.81***
23 (minerals non-metal) -0.032 -1.41
24 (basic metal) -0.064 -3.90***
25 (metal goods) -0.033 -1.50
26 (computers, electronics) -0.051 -2.77***
27 (electrical) -0.056 -3.25***
28 (industrial machinery) -0.047 -2.71***
29 (automobile) -0.050 -2.84***
30 (transport equipment -0.070 -4.26***
31 (furniture) -0.026 -0.89
32 (processing) -0.049 -2.20**
33 (repair-machinery) 0.005 0.07
35 (electricity and gas supply) -0.016 -0.39
36 (water supply) -0.070 -3.91***
38 (waste management) -0.067 -3.35***
41 (non-civil construction) -0.043 -2.46***
42 (civil construction) -0.044 -2.48**
43 (special construction) -0.059 -3.55***
45 (automobile trading) -0.048 -2.75***
46 (non-automobile trading) -0.041 -2.43**
47 (non-automobile retail) -0.045 -2.40**
50 (water transport) -0.027 -0.61
51 (air transport) -0.055 -1.98**

245
Industry Group Estimated Coefficient t-statistic
52 (transportation support) -0.041 -2.04**
55 (accommodation) -0.013 -0.31
56 (food and beverage service) -0.045 -2.12**
58 (publishing) -0.061 -3.39***
61 (telecommunication) -0.048 -2.55**
62 (programming) -0.055 -3.30***
63 (information service) -0.050 -2.50**
68 (real estate) -0.025 -1.14
70 (management consulting) -0.033 -1.76*
71(architecture service) -0.049 -2.75***
72 (research and development) 0.075 1.43
73 (advertising and market research) -0.040 -1.75*
74 (other professional services) -0.034 -1.14
77 (rental services) -0.086 -5.13***
78 (employment services) -0.065 -3.87***
79 (travel agencies) -0.009 -0.16
82 (administration services) -0.066 -3.65***
85 (education services) -0.049 -2.18**
86 (health services) -0.066 -3.95***
89 (other social services) -0.095 -5.09***
91 (library and archive services) -0.019 -0.73
95 (repair-computer and households) 0.021 0.35
96 (other personal services) -0.066 -3.64***

246
Industry Group Estimated Coefficient t-statistic
99 (international agencies) -0.019 -0.73


![Base Erosion and Profit Shifting [BEPS] Analysis and India ... · PDF fileBase Erosion and Profit Shifting [BEPS] Analysis and India perspective 2017](https://static.fdocuments.net/doc/165x107/5aba58ca7f8b9a24028b629f/base-erosion-and-profit-shifting-beps-analysis-and-india-erosion-and-profit.jpg)