Barloworld - ShareData
140
ONE Barloworld creating value Integrated Report 2018
Transcript of Barloworld - ShareData

ONEBarloworld
creating value
Integrated Report 2018
Barlo
wo
rld In
tegrated
Rep
ort 2018

Contents
About this
report
2 Our audience
2 Integrated thinking
2 Reporting frameworks
3 Report scope and boundary
3 Events after the reporting period
3 Assurance
3 Supplementary documents
3 Significant changes during the reporting period
3 Statement by the board of directors
3 Forward-looking information
6 One Barloworld
8 Our geographic footprint
10 Business model
14 Chairman’s review
18 Chief executive’s review
22 Finance director’s review
Barloworld is a distributor of leading global brands, providing integrated rental, fleet management, product support and logistics solutions.
Established in 1902 in South Africa, Barloworld is one of South Africa’s oldest companies. Our commitment to customer service, ethical conduct and innovation have ensured Barloworld’s sustainability for more than 116 years.
Inspiring a world of differenceAs a company we believe in delivering tangible benefits to all our stakeholders. At Barloworld, we’re proud to inspire some of the most incredible employees who go above and beyond the call of duty. Through perseverance, commitment and innovative thinking, we are able to make a world of difference.
Ethical conductWhile we conduct our business within the framework of laws and regulations, compliance with the law is not enough for Barloworld. We strive for more.
The Barloworld group is committed to responsible business conduct and best practices. All group activities are guided by the governance framework of ethics, codes of conduct, policies and commitment to legal compliance.
Together, we are upholding the reputation of our great company – and strengthening it for tomorrow.
Structured for value creation
Leading for
value
ONEBarloworld
creating value

Building One Barloworld
Managing for
value
28 Our material issues
29 Understanding our operating context
32 Strategy – Managing for value to deliver on our medium-term strategy
38 Risk management
45 Technology and information
46 Our stakeholder relationships
50 Equipment Southern Africa
52 Equipment Russia
55 Automotive
59 Logistics
63 Corporate centre
66 Value added highlights
68 Creating a high-performance culture
76 Transformation
77 Communities
79 Environmental stewardship
84 Governance review
90 Board committee
92 Executive committees
94 Social, ethics and transformation committee report
95 Remuneration report
119 Shareholder profile
Addendum
120 Summarised consolidated annual financial statements
131 Independent auditor's report
134 Independent auditor's non-financial limited assurance report
136 Assurance matrix
IBC Corporate information
Governance and
remuneration
Focus on execution and deliveryOur vision is clear – to delight our customers and maximise shareholder returns. We understand that in a resource-constrained world, we must critically examine where and how we invest our resources to ensure we grow value sustainably and holistically.
Our ambition is bold and our strategy seeks to balance this goal with responsible corporate citizenship, growing our legacy and protecting our legitimacy.
We are committed to delivering on the aspirations and targets we have set for ourselves. In the past year, our focus has been on, and remains on, execution of the promises made.
This report tells the story of our progress in 2018, as well as where we are going as we continue to build One Barloworld and inspire a world of difference for our stakeholders.
Strategy and valuecreation
Licence to
operate
Navigation guidewww Web links www.barloworld.com
GRIGRI Sustainability Reporting Standards links tohttp://www.barloworld-reports.co.za/integrated-reports/ir-2018/gri-index/index.phpIt is recommended that the relevant GRI references in the integrated report are viewed by the reader to gain a comprehensive perspective on aspects contained in the report.
GRI 102-55
1 Barloworld LimitedIntegrated Report 2018

About this report
Reporting frameworksOur integrated reporting is guided by various codes and standards, including:
– The King Report on Corporate Governance for South Africa, and the accompanying Code on Corporate Governance for South Africa (King IV)™*
– The International Integrated Reporting Council Framework
– International Financial Reporting Standards
– The Companies Act 71 of 2008 (as amended)
– The JSE Listings Requirements
– Global Reporting Initiative (GRI) Sustainability Reporting Standards 2016
Where indicated in our integrated reporting, references are to the relevant GRI Sustainability Reporting Standards (2016) disclosures.
Our audienceThe primary purpose of our integrated report is to explain to our long-term providers of financial capital how Barloworld creates value over time. However, in line with the stakeholder inclusive intentions of King IV, our report also reflects on the wider impact of our value-creation activities on all our key stakeholders.
Send us your feedback
Help us understand what matters to you by sending your comments and feedback on our integrated report to
[email protected] or [email protected] or visit www.barloworld.com to
download the feedback form.
Integrated thinking
In developing our group strategy, all six capitals were considered and are integrated into the key performance indicators (KPIs) used
to measure our performance against strategy.
This year our report is structured around the matters we consider material to our continued sustainability, embedded in our principle of
managing for value (namely capital allocation, operational performance and high-performance culture) and licence to operate.
Our material matters are derived by considering the factors that could substantially affect our ability to create
value in the short, medium, or long term and these matters have informed the content
of the report.
See pages 10 and 11 for more information.
The theme of our 2018 integrated report is “Managing for value”. We are actively managing our portfolio to
create sustainable value while contributing meaningfully to our stakeholders.
Financialcapital
Human capital
Manufactured capital
Social and relationship capital
Natural capital
Intellectual capital
GRI 102-46, 102-47, 102-54
* Copyright and trademarks are owned by the Institute of Directors in Southern Africa NPC and all of its rights are reserved.
2 Barloworld LimitedIntegrated Report 2018

Supplementary documentsThis report and the annual general meeting (AGM) booklet are available online at www.barloworld.com along with: – Full consolidated financial statements – Responses to the GRI Sustainability Reporting Standards
Forward-looking informationWe seek to report transparently on challenges and uncertainties we are likely to encounter in pursuing our strategy. As a result, this report may contain forward-looking statements with respect to our prospects.
Statement by the board of directorsThe board of directors acknowledges its responsibilities to ensure the integrity of the integrated report. The board believes the report addresses all material issues and fairly presents the integrated performance of the group. We as a board believe the integrated report has been prepared in line with best practice set out in the International Integrated Reporting Framework and the King IV code.
Signed on 10 December 2018 by
Dumisa Ntsebeza Dominic Sewela Don Wilson
Chairman Chief executive Finance director
Significant changes during the reporting periodIn June 2018 the group announced the conclusion of the sale of its Equipment Iberia business. The results of the Equipment Iberia operations and the profit on the sale of this operation have been reported separately as a discontinued operation. In February 2018 the Automotive business concluded the minority buy-out in the Salvage Management and Disposal (SMD) business. The sale of the Coachworks Tokai business was concluded in June 2018 and in July 2018 the N4 Witbank Jaguar Land Rover dealership was closed down. All data and our 2018 integrated reporting reflects continuing operations unless otherwise stated.
Report scope and boundaryOur integrated report covers the performance of Barloworld Limited for the financial year ended September 2018 for all geographic regions in which the Barloworld group and its subsidiaries operate.
The report extends beyond financial reporting and includes non-financial performance, opportunities and risks that may have a significant influence on our ability to create value. The consolidated data incorporates the company and all entities controlled by Barloworld as if they are a single economic entity.
There are no other entities over which the group has significant influence that it believes should be included in the report. Both financial and non-financial data are aligned to the same financial reporting period allowing for comparison of performance data. Any limitations are disclosed in the relevant section.
Any material events up to the board approval date on 10 December 2018 are also included.
Events after the reporting periodOn 15 November 2018 the board approved a proposed B-BBEE transaction to be known as “Khula Sizwe”. This proposed transaction seeks participation from our employees, management and the general public in South Africa. The proposed transaction is subject to approval by shareholders at the special general meeting scheduled for Wednesday, 14 February 2019.
AssuranceThe board, with the support of the audit committee, is ultimately responsible for Barloworld’s system of internal control, designed to identify, evaluate, manage, and provide reasonable assurance against material misstatement and loss.
We apply a combined assurance model, which seeks to optimise the assurance obtained from management as well as internal and external assurance providers while fostering a strong ethical climate and mechanisms to ensure compliance. Please refer to page 136 for an understanding of our assurance matrix. The financial information in this report, together with material non-financial indicators (limited assurance), is independently assured by our independent external auditors, while our B-BBEE status is verified by Empowerdex.
GRI 102-10, 102-46, 102-48, 102-56
3 Barloworld LimitedIntegrated Report 2018

Structured for value creation
4 Barloworld LimitedIntegrated Report 2018

5 Barloworld LimitedIntegrated Report 2018

One Barloworld
EquipmentAutomotive
Logistics
An active centre that adds value by driving performance, setting group level priorities, focusing talent on critical issues and driving mergers and acquisitions.
Barloworld Logistics has grown into a significant transportation and supply chain solution business in southern Africa.
Barloworld Equipment is the official dealer for the Caterpillar construction, mining and industrial machine range in 11 southern African countries, Siberia and the Russian Far East.
Barloworld Automotive delivers a range of integrated vehicle usage solutions that create shared value for our customers, company and stakeholders.
Core divisions
Return on invested capital
Logistics (%)
Group (%)
Automotive (%)
Equipment (%)Corporate centre
161718 161718
25
20
15
10
5
0
RussiaSouthern Africa
7.8%
12.8%12.7%
18.1%18.4%21.6%
15
12
9
6
3
0
Automotive161718
12.8%13.1%12.4%
10
8
6
4
2
0
Logistics
6.0%
2.5%
8.7%
161718
15
12
9
6
3
0
Group
9.4%11.2%
WACC 12.5%12.3%
161718
6 Barloworld LimitedIntegrated Report 2018

Car Rental Short-term vehicle rental solutions.
Avis Fleet Vehicle leasing and fleet management products and solutions.
Motor Trading Franchise motor vehicle retailing and asset disposal through online platforms and toolsets.
www.avis.co.zawww.budget.co.za
www.avisfleet.co.zawww.mywheels.co.za
www.barloworldautomotive.co.zawww.smd.co.za
www.barloworldmotor.comwww.tradersonline.co.za
www.nmidsm.co.za
Mining Surface and underground earthmoving equipment and drills.
Construction Infrastructure earthmoving and surface preparation equipment.
Energy and Transportation Diesel and gas generators, industrial, marine and diesel engines.
www.barloworld-equipment.comwww.vost-tech.ruwww.vtenergo.ru
Supply Chain ManagementDedicated and contracted solutions offering a full range of logistic services to leading clients.
Transport A range of transport solutions across sub-Saharan Africa including fuel, chemicals, gas, abnormal loads, consumer products, refrigerated and general freight services.
www.barloworld-logistics.com
www.barloworld.com
GRI 102-2, 102-6, 102-9
Barloworld is a distributor of leading global brands, providing integrated rental, fleet management, product support and logistics solutions. We offer flexible, value-adding, integrated business solutions to our customers backed by leading global brands.
7 Barloworld LimitedIntegrated Report 2018

Our geographic footprint
Russia
Rest of Africa, Europe and Middle East
South Africa
Russia
UAE
Ghana
DRCTanzania
Angola MalawiZambia
ZimbabweBotswana
Mozambique
Swaziland
LesothoSouth Africa
Namibia
Africa
Europe
Middle East
Asia
Barloworld has a proven track record of long-term relationships with global principals and customers. We have the ability to develop and grow businesses in multiple geographies including challenging territories with high growth prospects.
Over 17 400 employees in 16 countries
United Kingdom
8 Barloworld LimitedIntegrated Report 2018

� Angola
��� Botswana
� Democratic Republic of Congo (Katanga province)
� Ghana
��� Lesotho
GRI 102-4, 102-6, 102-7, 102-8
Countries of operation
47%
Equipment
Automotive
Logistics
Segmental performance
RevenueR63.4
OperatingprofitR4.4
Net operating
assetsR26.1
44%
9%
58%
39%
6%(3%)
56%34%
6%
Corporate
Segmental performance (R’billion)4%
�� Malawi ��� Swaziland
��� Mozambique � Tanzania
��� Namibia � United Kingdom
� Russia � United Arab Emirates
���� South Africa ��� Zambia
�� Zimbabwe
Russia
Rest of Africa, Europe and Middle East
South Africa
Revenue
R8.7 billion2017: R6.8 billion
Net operating assets
R4.0 billion2017: R5.0 billion
Operating profit
R448 million2017: R636 million
Number of employees
2 1612017: 2 162
Revenue
R46.9 billion2017: R49.9 billion
Net operating assets
R17.1 billion2017: R16.7 billion
Operating profit
R3.2 billion2017: R2.9 billion
Number of employees
14 2302017: 14 981
Performance per region
Revenue
R7.8 billion2017: R5.1 billion
Net operating assets
R3.0 billion2017: R2.5 billion
Operating profit
R804 million2017: R582 million
Number of employees
1 0262017: 942
9 Barloworld LimitedIntegrated Report 2018

Business model
Key resources and relationshipsWhat we need
The resources and relationships we rely on to sustain our operations
Strategic trends impacting our business model
Our business model delivers a comprehensive approach to value creation in the short, medium, and long term.
– Political uncertainty and regulatory developments
– Economic growth and social challenges in operating markets
– Technological breakthrough in transport
– Growing consumer preferences for environmentally friendly products
– Acquisition underperformance – Climate and environmental – Competitor actions – Currency volatility – Customers and markets – Defined benefit scheme exposure
Top material risks
The resources and relationships we rely on to sustain our operations
– Information security risks and digital disruption
– Operational health and safety risk – Political, terrorism, sanctions – Principals and suppliers – Regulatory environment – Talent – Volatile commodity prices
What we monitor
We monitor:
Our value chainWhat we do
Given the challenging macroeconomic context and the resource
constrained environment we operate in, we are custodians of the
capitals we need in our business.
We adopt an active operating model, driving value creation
across our current operations, assessing their performance
against our internal hurdle rates and deploying all
our capitals optimally.
Our actions are underpinned by our
values: Integrity, Excellence, Teamwork,
Commitment and Sustainability.
At Barloworld, managing for value is about actively driving business performance.
Financial capital
An appropriate mix of debt and equity funding, to meet our working capital needs and growth ambitions
Human capital
A skilled, diverse and motivated workforce, with a high-performance culture
Manufactured capital
Wide geographic footprint of operations and locations to serve our customers
Social and relationship capital
Strong relationships with our principals, suppliers, customers, employees, investors and communities
Natural capital
The natural resources we, directly and indirectly via our customers, depend on such as water, fossil fuels and other natural assets
Intellectual capital
Our unique way of doing business, that includes our Values, our Worldwide Code of Conduct, our governance frameworks and processes
10 Barloworld LimitedIntegrated Report 2018

Our outputsWhat we deliver
Flexible, value-adding, innovative customer solutions and services
Impact on capitalsWhat we impacted
The capitals we use
Equipment – Earthmoving: mining and infrastructure
– Power systems: electric power, marine, petroleum and industrial
Automotive – Short-term vehicle usage – Vehicle ownership solutions – Long-term vehicle leasing and fleet management solutions and products
– Asset disposal through online platforms
Financial capital
Revenue
R63.4 billion 2017: R62.0 billion
Operating profit
R4.4 billion 2017: R4.1 billion
HEPS
1 151 cents 2017: 975 cents
Return on invested capital
12.3% 2017: 11.2%
Free cash flow
R3.6 billion 2017: R3.4 billion
Human capital
Number of employees
17 417 2017: 18 085
Lost-time injury frequency rate (LTIFR)#
0.69 2017: 0.75
Number of work-related fatalities
2 2017: 3
Manufactured capital
Return on net operating assets (%)
20.9% 2017: 16.4%
Group net debt to equity (%)
14.4% 2017: 27.6%
Total assets
R49.3 billion 2017: R46.3 billion
Social and relationship
capital
B-BBEE rating
Level 3 2017: Level 3
Corporate social investment (Rm)
R16 million 2017: R18 million
Natural capital
GHG emissions (scope 1 and 2)
257 650 tCO2e 2017: 270 707 tCO2e
Water withdrawals (ML)^
588 ML 2017: 674 ML
Non-renewable energy consumption†
2 947 696 GJ 2017: 3 087 269 GJ
# LTIFR = Lost-time injuries multiplied by 200 000 divided by total hours worked.^ Municipal sources.† Excludes energy from rental fleets.
Logistics – Supply chain solutions – Transport, warehousing, freight forwarding
Corporate Centre – Group level strategy and mergers and acquisitions activities
– Performance monitoring and capital allocation
– Talent management
Our vision: To delight our customers and maximise shareholder value.
11 Barloworld LimitedIntegrated Report 2018

Leading for value
12 Barloworld LimitedIntegrated Report 2018

Our leadership
Chairman’s review
Dumisa Buhle Ntsebeza
It gives me great pleasure to announce that subsequent to year end, Barloworld has entered into agreements aimed at implementing a transformative broad-based black economic empowerment (B-BBEE) transaction.
Chief executive’s review
Dominic Malentsha Sewela
With further management and executive capacity built into the organisation, we will consolidate on the gains we have made while continuing to pursue our ambitious goal of achieving maximum intrinsic value.
Finance director’s review
Donald Gert Wilson
The group’s financial performance reflects the ongoing commitment to delivering sustainable value to stakeholders.
Our Chairperson’s review covers:
– Operating context and performance
– Evolving our operating model/managing for value
– Licence to operate
– Focus on safety
– Governance and ethical leadership
– Changes to the directorate
– 2019 outlook
– Vote of thanks
Page 14
Our Chief executive’s review covers:
– Managing for value-driving performance
– Capital allocation
– Instilling high-performance culture
– Health and safety
– Licence to operate
– Looking forward
Page 18 Page 22
Our Finance director’s review covers:
– Financial performance from continuing operations for the year-ended 30 September 2018
– Cash flows
– Financial position
– Returns
– Debt
– Dividends
– 2019 outlook
Web links www.barloworld.comwww
13 Barloworld LimitedIntegrated Report 2018

Chairman’s review
I believe that the private sector in South Africa is committed to driving economic growth. We look to government to create a climate of stability, enabling companies to concentrate on doing business and growing our contribution to the economy.
Dumisa Ntsebeza, Chairman
On behalf of the board, it is my privilege to present the 2018 integrated report. The 2018 year has been one of change as the business continued to align itself to the principles of Managing for Value. In a difficult context, it is pleasing to see this focus on delivery yielding positive results.
Operating context and performance The year under review remained challenging across most of the geographies in which we operate. From both a local South African and an international perspective, I remain concerned about the uncertain macro-economic and political landscape, which continues to place pressure on our operations.
In South Africa, Barloworld’s home base and core market, economic growth was virtually stagnant as the economy slipped into a technical recession during the second half of 2018. The Mining Charter review provided some respite to the mining industry by sending positive signals of a more favourable outcome for mining investors. While the appointment of Mr Cyril Ramaphosa as President of the Republic of South Africa has brought some political stability, the country’s social and economic challenges continued to mount.
ONEBarloworld
creating value
14 Barloworld LimitedIntegrated Report 2018

Poverty and unemployment levels remain unsustainably high, deepening inequality and increasing social tensions.
The situation in our country has not been assisted by the revelations that have since come up, especially through the public hearings of the Zondo Judicial Commission of Inquiry, that for almost a decade, or more, the country’s resources were systematically mismanaged, and our country’s resources looted in a grand corruption scam that seems to have been sanctioned from the very top echelons of the governing authorities.
It is comforting, though, that remedial steps to stem the tide of corruption are being taken so that the country’s economy can be grown again in circumstances where there will be no systemic draining of the country’s resources by individuals in high places, and or by the instrumentality of state capture agents in the form of front companies that evidently were being used for criminal activities, including money laundering aided and abetted by the private sector.
We look forward to reports that will come from the various commissions of inquiry aimed at cleaning the environment so that business can flourish in a proper and ethical environment.
Although the current administration is taking steps to address the economic crisis, including the recent announcement of the stimulus package injection into the economy, the challenges are great. The political rhetoric in the run up to the 2019 national elections, seems to be inspired by the Parliamentary Portfolio Committee hearings following the adoption of a resolution by the ruling party, the African National Congress in December 2017, which called for a review of section 25 of our Constitution to accommodate expropriation of land without compensation (referred to as the EWC resolution). The highly politicised public debate has raised concerns that, arguably, might undermine the government’s efforts to create a healthy environment for economic growth, and, consequently, dampen business appetite to invest until there
is predictability about the consequences of the EWC resolution.
With all that having been said, I believe the private sector in South Africa is committed to driving economic growth. We look to government to create a climate of stability, enabling companies to concentrate on doing business and growing our contribution to the economy.
Internationally, ongoing geopolitical dynamics continue to dominate the discourse, with the potential implications of a US-China trade war fuelling fears of trade barriers and heightening economic uncertainty. Furthermore, sanctions in Russia continued during the year and the retaliatory imposition of higher import tariffs in August may have negative consequences for our Equipment business in that territory.
Given the uncertainty of the operating context, we have to ask ourselves the question how we can continue to create value for our stakeholders and remain a sustainable business in the years to come.
The group’s values guide our actions and the principles of integrity, excellence, teamwork, commitment and sustainability remain integral to the way we do business.
15 Barloworld LimitedIntegrated Report 2018

Chairman’s review
The answer, I believe, lies in emphasising the fundamentals in which we believe, while critically reflecting on the levers we can influence.
While the times we operate in are increasingly volatile, I remain optimistic about the group’s ability to deliver on its vision – to delight our customers and maximise shareholder returns.
During the year, the business delivered solid progress against its strategic priorities – including the turnaround of underperforming businesses, the optimisation of our existing portfolio and the focus on growth in order to deliver sustainable returns. Southern Africa remains our core market, and we will potentially grow our presence where we find opportunities that align with our core competencies.
We posted record results in Siberia, despite the challenging geopolitical situation. We also successfully executed the decision to dispose of our Iberian Equipment business. This proved effective, releasing cash which can now be allocated to higher returning businesses that drive top-quartile returns for our shareholders.
Our Equipment and Automotive divisions delivered on the plans to optimise and address underperformance. Through resolute effort, our Logistics business reached its milestone in returns and remains an important part of our One Barloworld stable.
Licence to operateWhile the group’s vision is bold, it is anchored in a genuine commitment to responsible citizenship, intent on preserving our legacy of relationships built on trust. To engender this trust, we know that our commitment to sound practices in environmental, social and governance (ESG) matters must be unwavering.
It gives me great pleasure to announce that subsequent to year end, Barloworld has entered into agreements aimed at implementing a transformative broad-based black economic empowerment (B-BBEE) transaction. The transaction aims to contribute meaningfully to transformation and inclusion in the South African economy. As part of the transaction, a Barloworld Empowerment Foundation will be created, and will focus on three key areas, poverty alleviation, education and youth development.
Focus on safetyI am sad to report that we had two work-related fatalities during the year. On behalf of the board I wish to extend our sincere condolences to the family, friends and colleagues of these employees. We can never become complacent about the potential dangers of our working environments and must continuously challenge ourselves to understand how incidents happen and how to prevent them. Our focus on safety is relentless, and we are committed to ensuring that we remain vigilant on upholding safety standards, creating safe working environments and driving employee awareness of potential safety hazards.
Governance and ethical leadershipThe group’s values guide our actions and the principles of integrity, excellence, teamwork, commitment and sustainability remain integral to the way we do business.
We understand that the board is ultimately accountable to the stakeholders of the business, responsible for providing ethical leadership and offering independent oversight. Critical to these responsibilities is the quality, diversity and commitment of the board.
As the chairperson of the board as well as that of the nominations committee, I feel confident to report that we have a balanced board, rooted in ethics, with a diverse and independent perspective. The board works well together and encourages rigorous and constructive debate to ensure decisions are thought through and fully understood.
The board is also committed to deeply understanding the group’s operations locally and abroad. This year, the board opted to host its annual strategic meeting at our Russian operations. This provided the board with the opportunity to engage with employees and customers, offering first-hand exposure to some of the challenges and opportunities they face at an operational level, and deepening the board’s appreciation and understanding of the group’s business. It was a signal of our commitment to the One Barloworld strategy, highlighting the importance of each of our businesses in us reaching our bold ambition.
16 Barloworld LimitedIntegrated Report 2018
Changes to the directorateAt the annual general meeting scheduled for 14 February 2019, Ms Bongiwe Mkhabela and Mr Isaac Shongwe will retire as directors of the board, and Mr Don Wilson will also retire as a member of the board and finance director. In line with a structured board nomination process for the appointment of non-executive directors of Barloworld Limited Ms Neo Mokhesi and Mr Hugh Molotsi were appointed independent non-executive directors effective 1 February 2019.
To ensure a seamless transition, Ms Olufunke Ighodaro was appointed as an executive director of the board and financial director designate, effective 1 October 2018. She will succeed Mr Wilson as finance director of Barloworld at the annual general meeting in February 2019.
Ms Andiswa Ndoni was appointed company secretary effective 1 September 2018.
The board wishes to thank the departing executive and non-executive directors for their invaluable service and contribution to the board and Barloworld.
2019 outlook Looking ahead, we will closely monitor the unfolding tariff war between the US and China, as well as the sanctions imposed on Russia, in anticipation of the potential impact thereof on Barloworld’s business. These external factors also have the potential to adversely impact the goals we have set, and we will continue to monitor these issues carefully. To retain the trust of our customers, we must continuously mitigate the potential impacts of external factors on our business and ensure product availability to provide solutions for the demands of our customers. We will continue to seek opportunities for growth and to diversify our business where it makes sense to do so.
Barloworld is a resilient organisation and we are fortunate to have customers who are equally resilient. When we work in alignment, I believe we can achieve great feats. During these challenging times, it is how the people of Barloworld, both our employees and our customers alike, handle these challenges that will determine our success in achieving our vision.
Vote of thanksI want to take this opportunity to thank my fellow board members for their strategic counsel, direction, support and oversight of Barloworld.
To Ms Sibongile Mkhabela, Mr Isaac Shongwe and Mr Don Wilson, I would like to express my sincere gratitude for your service and invaluable leadership.
To the executive management team, and specifically Mr Dominic Sewela, I would like to extend my, and the board’s, appreciation for your tireless dedication and drive under challenging circumstances. The energy and commitment within the business is tangible and the board and I have the utmost confidence in your team’s ability to achieve our vision.
Finally, to our stakeholders, thank you for your ongoing support. We look forward to taking you along on this journey towards achieving our vision. We believe we are well positioned to flourish and look forward to overcoming the challenges and celebrating our wins along the way.
Dumisa NtsebezaChairman
17 Barloworld LimitedIntegrated Report 2018

One Barloworld strategy – a year of deliveryIt has been at least 20 months since we embarked on the redefinition of our One Barloworld strategy. In the 2017 report we outlined our key strategic levers and change journey. In the year under review we have continued to make good progress in driving execution and implementation of this strategy. As with any change process this has not been
without challenges, however, I am pleased that the momentum has been created, and with further management and executive capacity built into the organisation we will consolidate on the gains we have made while continuing to pursue our ambitious goal of achieving maximum intrinsic value.
As part of our “Fix” strategy we successfully disposed of the Equipment Iberia business in June 2018 and the bulk of the proceeds were received in the year. Through focused execution we achieved significant turnaround of the Logistics business, which has been one of the highlights in meeting the set returns milestones for the business.
Equipment Southern Africa and Automotive divisions were the “Optimise” focus, with the operational transformation project in the Equipment business continuing, while Motor Retail continued to review its dealer network and cost structures. We have also advanced the review on the optimal deployment of capital in the Leasing business and the exploration of various funding options to enhance return on capital of our rental assets.
Chief executive’s review
Dominic Sewela, Chief executive
Revenue (Rm)
Free cash (Rbn)
543210
181716
3.63.44.3
Revenue (Rm)
ROE (%)
12
9
6
3
0181716
11.410.59.3
Revenue (Rm)
ROIC (%)
15129630
181716
12.311.29.4
18 Barloworld LimitedIntegrated Report 2018

The role of the centre also underwent a major shift and evolution with the adoption of a more active operating model, applying the principles of managing for value, an active shareholder model. This has begun to instil focus on value creation through the structured assessment of opportunities, optimal resource allocation (capital, talent and operating costs), and robust business performance management.
To further enhance its foundational capabilities the group is developing and rolling out a group process optimisation methodology, the Barloworld Business System, which will be supported by process automation capabilities to enable consistent value delivery to customers, institute smarter and simpler ways of working and driving focus on work that matters; while creating a work environment in which our people can focus on meaningful and fulfilling work, relieving them of unnecessary tasks that are inherently wasteful and non-value enhancing.
Aligned to the strategy of maximising the value derived from the use of all our assets, the corporate centre relocated to new premises in November 2018, to make way for
the redevelopment of the Barlow Park precinct that will commence mid-2019.
Managing for value to drive performanceNotwithstanding the headwinds we have prevailed to produce a solid performance and our fixing and optimisation initiatives have also enabled us to weather the vagaries of our dynamic environment. Our operations experienced difficult trading and economic conditions, however, the robust earnings growth was supported by Equipment Russia, the turnaround of the Logistics business and the strong associate income from the Bartrac joint venture in the Katanga region of the DRC. The performance of Equipment Southern Africa and Automotive were satisfactory in a challenging economic cycle.
Revenue was up 2% to R63.4 billion, with operating profit up 7.9% to R4.4 billion. We generated headline earnings from continuing operations of 1 151 cents per ordinary share which represented a 176 cents (18%) increase on last year. Total headline earnings per ordinary share including the discontinued Equipment Iberia operations of 1 192 cents represented a 309 cents per ordinary share (35%) improvement on the 883 cents last year.
We are progressing well in improving our return on invested capital (ROIC) which was at 12.3% for the year (2017: 11.2%) and a return on equity of 11.4% (2017: 10.5%). The continued improvement of these key metrics remains a key focus area for the group.
Equipment Southern AfricaPerformance was driven primarily by higher equipment sales (up 21%) in South Africa, Mozambique and Zambia; and rental revenues (up 25%) increasing overall revenue by 8%, with operating profit in line with the previous year. The sales mix, exchange rate impact and investment in operational and digital transformation marginally reduced the margin to 9.1% (2017: 9.7%), however, the performance from our Bartrac JV in the Katanga province of the Democratic Republic of Congo (DRC) was impressive, increasing by 159% to R251 million (2017: R97 million) as a result of sustained copper and cobalt prices.
We had taken the decision to invest in Angolan US Dollar linked bonds to hedge against the Kwanza devaluation in Angola, and while the government in that territory has taken steps to reform its economy and
Disposal of Equipment Iberia generates R2.5 billion in cash
Record Equipment Russia performance
Logistics turnaround on track16%
9%18%
Revenue (Rm)
HEPS growth (%)
1 500.0
1 000.0
500.0
0181716
1 150.9974.5
840.9
Revenue (Rm)
Total dividend per share (cents)
500400300200100
0181716
462390
345
18%
19 Barloworld LimitedIntegrated Report 2018
Chief executive’s review
restore economic stability the scrapping of the local currency peg to the US Dollar in January 2018 resulted in a 76% devaluation of the Kwanza to September. At September 2018, our investment in US Dollar linked bonds totalled $64.3 million and we decreased the trapped in-country Kwanza cash balance by $20 million to $9.9 million at September 2018 with the bulk remitted to repay the holding company in the United Kingdom (UK).
Equipment RussiaThe division produced a historic stellar performance in our 20 years of operating in Russia driven by strong machine sales which included the delivery of the package deals to Polyus Gold, Norilsk Nickel and NordGold that were highlighted in the September 2017 firm order book. Revenue was up 57% in US Dollar terms, with aftermarket increasing by 11%. Operating profit for the year was up 41%. The operating margin of 10.2% was down on the 11.3% achieved last year due to the increase of large mining machines in the sales mix.
The imposition of increased import tariffs on US sourced machines in early August did not significantly impact the current year’s performance, and it is pleasing that our competitive edge in customer support and proximity has allowed us to remain the preferred choice for our large customers. Testament to that are the additional firm orders that we received post the year end. The divisional ROIC for Russia of 20.4% (2017: 18.4%) was the highest return performance in the group.
AutomotiveThe division has faced some headwinds but produced a satisfactory result amid challenging conditions with low consumer confidence and constrained disposable income. Revenue for the year was 5.6% down on the previous year and an operating profit 2.6% lower than 2017. Operating margin increased from 5.5% to 5.7% in the current year. ROIC for the year of 12.4% was down on last year’s 13.1% due to the lower operating result.
Car Rental revenue for the year was 1.3% up on last year mainly as a result of increased rental days and rate per day, but negatively impacted by lower used vehicle revenue. For the year operating profit reduced by 4.6% due to lower used vehicle profitability.
Avis Fleet revenue declined by 6.9% as a result of lower leasing revenues in some of the key contracts. Operating profit improved by 3.2% on last year mainly driven by increased used vehicle contribution.
In Motor Trading revenue was impacted by dealership closures and disposals in the prior and current year, as well as the implementation of the agency model in Mercedes-Benz (Passenger) during the reporting period with revenue at 7.5% below the prior year. Operating profit for the year was 7.1% below last year with the premium brands showing reduced profitability. As part of the ongoing review of the dealership portfolio, the N4 Witbank Jaguar Land Rover dealership was closed at the end of July.
Logistics Significant turnaround was achieved with the division producing good results and increased returns; and while revenue for the year decreased by 4%, mainly due to the subdued economy and a rationalised customer portfolio in Supply Chain Management, Transport revenue was 6% up on the prior year.
The business had a positive uplift in all key metrics with operating profit of R262 million significantly ahead (160%) of the R101 million generated last year, driven by the operational and cost benefits arising from the turnaround initiatives implemented in 2017. This result was achieved despite a restructuring charge of R12.5 million and sub-optimal performance in the KLL and SmartMatta operations. The division generated a ROIC of 8.7% compared to 2.5% last year, within the set target range in the turnaround process.
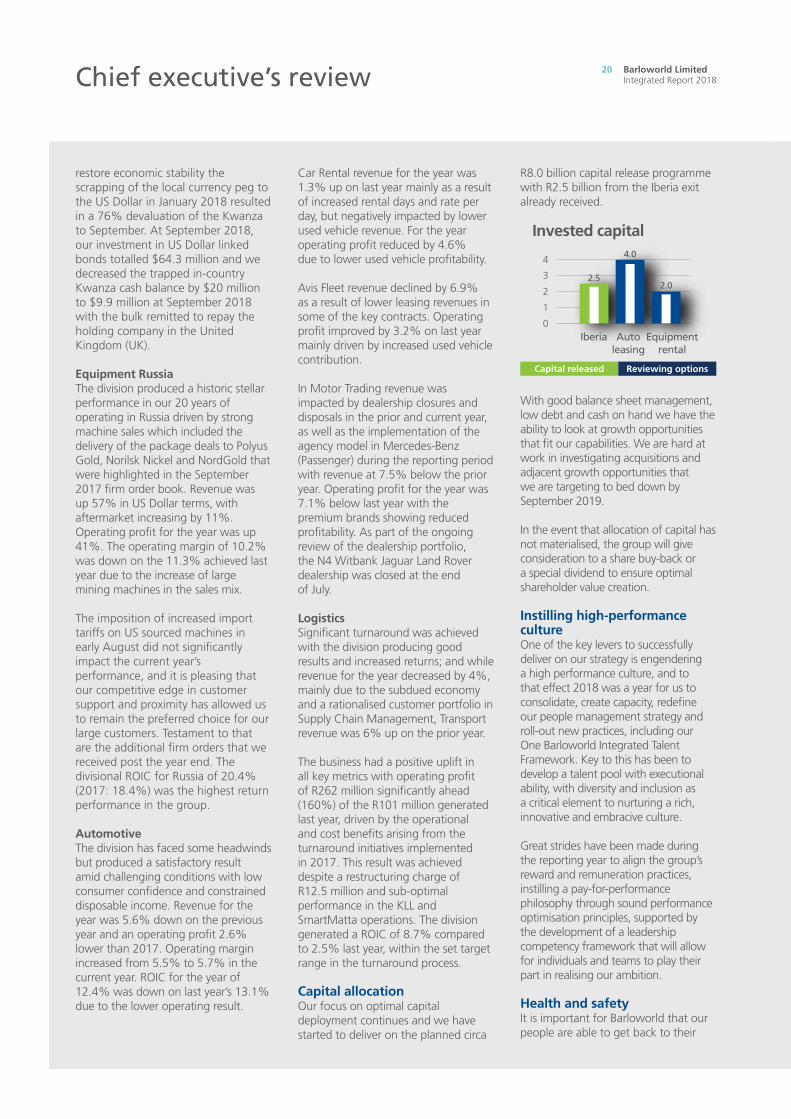
Capital allocationOur focus on optimal capital deployment continues and we have started to deliver on the planned circa
R8.0 billion capital release programme with R2.5 billion from the Iberia exit already received.
Invested capital
4
3
2
1
0Auto
leasingIberia Equipment
rental
2.0
4.0
2.5
Capital released Reviewing options
With good balance sheet management, low debt and cash on hand we have the ability to look at growth opportunities that fit our capabilities. We are hard at work in investigating acquisitions and adjacent growth opportunities that we are targeting to bed down by September 2019.
In the event that allocation of capital has not materialised, the group will give consideration to a share buy-back or a special dividend to ensure optimal shareholder value creation.
Instilling high-performance cultureOne of the key levers to successfully deliver on our strategy is engendering a high performance culture, and to that effect 2018 was a year for us to consolidate, create capacity, redefine our people management strategy and roll-out new practices, including our One Barloworld Integrated Talent Framework. Key to this has been to develop a talent pool with executional ability, with diversity and inclusion as a critical element to nurturing a rich, innovative and embracive culture.
Great strides have been made during the reporting year to align the group’s reward and remuneration practices, instilling a pay-for-performance philosophy through sound performance optimisation principles, supported by the development of a leadership competency framework that will allow for individuals and teams to play their part in realising our ambition.
Health and safetyIt is important for Barloworld that our people are able to get back to their
20 Barloworld LimitedIntegrated Report 2018

families safely every day and therefore we strive for a zero harm work environment where safety is paramount. Our focus on instilling a safety-conscious culture is unwavering. Despite this we tragically had two work-related fatalities during the year, one at Equipment Russia and another at Automotive. The group offered support to the bereaved families and we extend our sincere condolences for their loss. We continuously assess risk exposure and behaviours to inform awareness campaigns on health and safety in the workplace. Licence to operateWe believe it is our role as a good corporate citizen to create value for all our stakeholders and part of this is the redress of the structural imbalances in the South African economy, not only for the long-term sustainability of the country, but also with a view to securing our ability to operate in an environment with social cohesion and stability. Barloworld is therefore aligned with the national development imperatives of advancing inclusive economic transformation and growth through the many initiatives we have in our corporate social investment as well as our enterprise and supplier development platforms.
Further to this, following consultation with both internal and external stakeholders, a broad-based black economic empowerment (B-BBEE) transaction was proposed and subsequently approved by the Barloworld board and the terms of the transaction were announced on 19 November 2018.
Key aspects of the structure are a Foundation, the participation of circa 1 800 junior to senior managers in a management trust, at least 14 000 employees in an employee trust and a black public scheme. We believe what is on offer is a transformative, sustainable and broad-based structure that is efficient in terms of limiting shareholder dilution, has longevity and permanency through the Foundation, while contributing to inclusive growth in the public participation. In line with driving a One Barloworld persona, it is important that our employee participation is inclusive
across the different races in our organisation with the share issue based on the guidance of economically active population statistics of South Africa. The proposed transaction is subject to shareholder approval at the special general meeting scheduled for 14 February 2019.
We also continue to drive transformation and diversity within our supply chain in order to support the broader objectives of the company. We have engaged our various principals to advance the localisation objectives. The equity equivalent investment programme in partnership with the Department of Trade and Industry announced by Caterpillar is ongoing.
Our performance on environmental, social and governance (ESG) aspects remains important to Barloworld, and based on our public disclosures during 2018 the group remained a constituent of the FTSE/JSE Responsible Investment Index, FTSE4Good Index series and the Dow Jones Sustainability Emerging Markets Index.
Looking forwardGrowth in the Chinese economy has moderated and is likely to remain under pressure as a result of the escalating trade dispute with the US.
The outlook for the South African economy has weakened with negative consumer and business confidence impacting local demand and a technical recession in the last half of 2018.
The outlook on commodities fundamentals, however, remains favourable which bodes well for our equipment businesses.
We expect top line uplift in Equipment Southern Africa with more positive sentiment on the Mining Charter likely to improve investment in existing mines and greenfield projects. Government's infrastructure fund should begin to yield benefits in 2020 for the construction sector. We are hoping for a positive outcome in the DRC elections in December 2018 as our customers continue to invest in that territory.
In spite of the Russia tariffs on US-sourced machines, we expect a strong result in Russia as, notwithstanding these tariffs, we secured additional orders post the reporting period from customers that are willing to pay the premium.
Logistics will consolidate the significant improvements made in 2018, to target reaching cost of funds by September 2019, and aim to exceed that in 2020. Thereafter the business will have earned the right to grow and be allocated capital.
Automotive is expected to face some headwinds in the coming year with a slow-growth economy, consumers strapped for disposable income, we therefore expect industry vehicle sales in 2019 to be flat or slightly down on the current year with Rand depreciation adding further pressure to the premium segment. Car Rental will be driven largely by inbound tourism and we have picked up momentum in the Leasing business with additional corporate contracts to make up for non-renewal of some key contracts in 2018.
In the next 18 to 24 months, while we continue to focus on driving our businesses to their full potential through the optimal allocation of capital and the execution of our medium-term strategy, we will take advantage of the strong foundation that has been set for us to pursue value-enhancing acquisitive growth opportunities that fit our capabilities and the optimisation of the group’s capital structure.
Dominic SewelaChief executive
21 Barloworld LimitedIntegrated Report 2018

Finance director’s review
Don Wilson, Finance director
Financial performance from continued operations for the year ended 30 September 2018Revenue for the year increased by 2.4% to R63.4 billion (2017: R62.0 billion) on the back of a record performance in Equipment Russia together with solid growth in Equipment Southern Africa. Despite geopolitical challenges in the latter part of the year, Equipment Russia continued to benefit from strong mining activity in the region, specifically the delivery of large orders contracted at the end of 2017, with revenue up by 57% in US Dollar terms to $606 million (2017: $385 million). Equipment Southern Africa revenues of R19.8 billion were 8.1% above prior year (2017: R18.3 billion) driven by mining machine sales in South Africa and Mozambique. Automotive revenues at R29.8 billion (2017: R31.6 billion) were down by 5.6% against the prior year. Automotive trading revenues were impacted by the 2017 closure and disposal of three General Motors and two BMW dealerships, together with the
Revenue
R63.4 billion2017: R62.07 billion
Operating profit
R4.4 billion2017: R4.16 billion
ONEBarloworld
creating value
In June 2018 the group announced the conclusion of the sale of its Equipment Iberia business. In compliance with IFRS 5, and as presented at the year ended 30 September 2017, the results of the Equipment Iberia operations and the profit on the sale of this operation have been reported separately as a discontinued operation. The following commentary reflects current year trends from the group’s continuing operations unless specifically stated.
22 Barloworld LimitedIntegrated Report 2018

changes in revenue recognition in line with the agency model for Mercedes-Benz new passenger vehicle sales during the year. Logistics’ successful turnaround continued with transport revenues growing by 6.0%, however total Logistics revenue of R5.9 billion (2017: R6.2 billion) was 4% behind the prior year following the loss of key contracts in the prior year.
While the Rand weakened towards the end of the second half of the financial year, a strengthening in the Rand during the first half of the year resulted in a net year to date reduction in revenue of R356 million (0.7%) with the bulk of the reduction impacting Equipment Southern Africa and Russia.
Earnings before interest, taxation, depreciation and amortisation (EBITDA) of R7.0 billion improved by 4.2% while operating profit improved by 7.9% to R4.4 billion (2017: R4.1 billion). Group operating margin increased to 6.9% (2017: 6.6%). Margins in Equipment Russia and
Equipment Southern Africa were negatively impacted by stronger mining machine sales mix contributions which in time will contribute positively to aftermarket activity. Russia generated record operating profits of $61.7 million (2017: $43.6 million). Equipment Southern Africa maintained operating profit at R1.8 billion (2017: R1.8 billion) which was assisted by the release of parts inventory provisions following certification of our rebuild facility. Automotive operating margin improved despite closures and disposals in the prior year while operating profit declined by 2.6%. A highlight of this year’s operating profit growth was the turnaround of Logistics which contributed operating profit of R262 million against last year’s R101 million, an increase of 160%.
Net operating profit after tax (NOPAT), a key element of our ROIC metric for determining economic profit (EP), increased by R126 million to R3.3 billion (2017: R3.2 billion).
The net negative fair value adjustments on financial instruments of R133 million (2017: R209 million) largely consist of the cost of forward points on foreign exchange contracts, translation gains and losses on foreign currency denominated monetary assets and liabilities in Equipment Southern Africa. The weakening of the Rand, particularly towards the end of the financial year, resulted in exchange gains in respect of US Dollar held deposits.
Net finance costs of R1 035 billion are down by R186 million (15%) on the prior year due to lower average borrowings and lower funding rates in South Africa.
Losses from non-operating and capital items of R248 million consist largely of impairments of goodwill, intangibles and other assets of R234 million in Logistics following the decision to dispose of the KLL and SmartMatta businesses and the impairment of an investment held by our Automotive business (R24 million).
The group’s financial performance reflects the ongoing commitment to delivering sustainable value to stakeholders.
23 Barloworld LimitedIntegrated Report 2018

Finance director’s review
The taxation charge increased by R385 million and the effective tax rate (excluding prior year taxation and non-operating and capital items) increased to 28.5% (2017: 23.9%) largely as a result of local currency weakness against the US Dollar in certain offshore operations. In particular, the group’s tax charge was negatively impacted by the weakening Angolan Kwanza, Zambian Kwatcha and Russian Ruble against the US Dollar.
The increase in income from associates and joint ventures in the year is mainly attributable to the profitability of the Equipment joint venture in the Katanga province of the DRC. Income of R235 million was well up on the R93 million achieved last year.
The discontinued Equipment Iberia operations generated a net gain on sale of R1.6 billion, representing the premium to net asset value of the sale of proceeds and a R1.5 billion gain in respect of the recycling of exchange reserves accumulated since the acquisition in 1992.
Overall, profit from continuing operations increased by R247 million (12.2%) to R2.3 billion and headline earnings per share (HEPS) from continuing operations increased by 18% to 1 151 cents (2017: 975 cents). Total HEPS including discontinued operations increased by 35% from 883 cents to 1 192 cents.
Cash flowsGenerating cash flow is a key returns measure for management and the group achieved net cash
flows before financing activities of R2.6 billion, which was in line with the prior year. This was after dividend payments of R953 million for the year.
Cash generated from operations of R3.8 billion was down on the prior year (2017: R6.0 billion) but strong in light of market conditions weighing on our operations.
The group invested R2.1 billion into working capital in the current year compared to the R1.5 billion reduction last year. The increase was largely as a result of increased inventories and receivables in our Equipment businesses. Investments in our rental and leasing fleets were contained to R2.2 billion (2017: R2.9 billion) with car rental well down on the prior year.
Cash inflows from investing activities of R1.9 billion (2017: R329 million outflow) included the proceeds from the sale of Equipment Iberia of R2.5 billion (€163 million).
Our ongoing strategy to hedge our exposure in Angola by investing in Angolan US Dollar linked government bonds protected us against the Kwanza devaluation of more than 76% that has occurred since January 2018 following that currency’s unpegging from the US Dollar. Due to improved US Dollar currency allocations in Angola in the latter part of the year we have marginally reduced our investment in Angolan US Dollar linked government bonds at September 2018 to US Dollar 64 million (2017: US Dollar 66 million) and we have reduced our Kwanza cash on hand by US Dollar 20 million.
Financial positionTotal assets employed in the group increased by R2.9 billion (6.3%) driven by increased inventories and receivables in our Equipment businesses, together with an increase of R4 billion in cash on hand at year end. Assets held for sale of R497 million include the Logistics Middle East business, the KLL and SmartMatta Logistics assets and the Barlow Park office park.
Total debt increased by R1.5 billion to R11.2 billion (2017: R9.7 billion) while net debt of R3.3 billion was R2.5 billion down on the prior year (2017: R5.8 billion) as a result of the increase in cash on hand.
The UK pension scheme deficit decreased from R2.2 billion (£123 million) to R1.8 billion (£95 million) mainly due to an increase in the AA corporate bond yield which reduced the estimated future pension liability. As part of the 2017 triennial recovery plan agreement with the trustees and the UK Pensions Regulator, the group has agreed a payment plan for the next eight years to address the actuarial deficit at the 2017 valuation date.
ReturnsReturn on equity from continuing operations increased to 11.4% from 10.5% last year. Return on invested capital increased to 12.3% from 11.2% driven by increased NOPAT and a reduction in our overall invested capital to R26.0 billion (2017: R26.6 billion). The primary driver of the reduction in invested capital was in the Logistics business where management has reduced the invested capital by R510 million.
24 Barloworld LimitedIntegrated Report 2018

DebtIn October 2017 bonds totalling R425 million (BAW3 and BAW8) matured and were repaid using available banking facilities. In February 2018, BAW29, a five-year, R400 million bond was issued in anticipation of bonds maturing in the latter part of the calendar year. BAW11 and BAW17, totalling R1.2 billion, mature in October and December 2018 respectively with BAW11 repaid just after year end using existing facilities. The refinance of BAW17 will be addressed with a new R700 million three-year bond to be issued in December 2018. Overall the group debt maturity profile is well balanced in future years.
Closing South African short- term debt includes commercial paper totalling R700 million (2017: R643 million). Subject to funding rates, we expect to maintain our participation in this market.
At 30 September 2018 the group had unutilised borrowing facilities of R10.6 billion (2017: R10.7 billion) of which R8.1 billion (2017: R8.0 billion) was committed. The group’s ratio of long-term to short-term debt declined to 54%:46% (2017: 79%: 21%). The increased short-term debt ratio is attributable to maturing bonds of R1.2 billion (as highlighted above). The group has sufficient long-term committed facilities to cover short-term debt.
In March 2018 Moody’s raised Barloworld’s Global Scale outlook from negative to stable following the change of outlook on the Baa3 sovereign rating of South Africa and on 2 May 2018 Moody’s affirmed our long-term and short-term issuer Global Scale Rating of Baa3 and P-3 and long-term and short-term issuer National Scale Rating of Aa1.za and P-1.
Net debt to EBITDA of 0.5 times is well down on the prior year of 0.9 times and supports our capacity for future transactions. Net debt to equity has also reduced to 14.7% from 27.6% in the prior year with 176% of our year-end net debt in the leasing and Car Rental business segments and the Trading segment in a net cash position.
DividendsBarloworld’s dividend policy is to pay dividends within an annual HEPS cover range of 2.5 to 3.0 times. On the back of the results of the year, dividends totalling 462 cents per ordinary share have been declared, representing cover of 2.5 times.
2019 outlookThe execution of our strategy to fix, optimise and grow the business has yielded improved returns for our shareholders and we remain committed to delivering on this strategy. Notwithstanding Logistics’ commendable results for 2018, pressure remains on the turnaround of that business with the aim of driving returns closer to the group hurdle rates.
The low gearing levels in the group mainly as a result of high cash on hand will be addressed going forward by both acquisitions and optimisation of the existing capital structure to improve group returns.
DG WilsonFinance director
25 Barloworld LimitedIntegrated Report 2018

Strategy and value creation
26 Barloworld LimitedIntegrated Report 2018

27 Barloworld LimitedIntegrated Report 2018

Our material issues
During 2017, Barloworld undertook a systematic and structured strategic review process to identify key determinants that have an impact on our ability to create value for our stakeholders.
Since implementing our managing for value approach, our thinking around identifying material issues has matured. For the 2018 report, we considered the various factors that set the context including the operating context, our strategic priorities, the risks for our goals and performance, and alignment of the material issues to concerns identified by our stakeholders.
Our response to each material issue is discussed in detail in the report.
Material issue1. Capital allocation
What this means: Key features Capital Stakeholder
Focus on optimal capital deployment
Cash release and distribution
Shareholders
Maximising returns
Active portfolio management
Performance monitoring
Opportunities for growth See page 36
2. Operational performanceWhat this means: Key features Capital Stakeholder
Driving our business to full potential
Levers for operational efficiencies
PeopleCustomersPrincipals
Unlocking our full potential
Customer centricity
Future outlook See page 50
3. High-performance cultureWhat this means: Key features Capital Stakeholder
Instil a high-performance culture with execution ability
Talent and performance management
People
Diversity and inclusion
Remuneration and reward
Organisational culture
Safety and health See page 68
4. Licence to operateWhat this means: Key features Capital Stakeholder
We embrace our role as a responsible corporate citizen, and strive to play an active and meaningful role in the societies where we operate
Our role in communities
CommunitiesSuppliersEnvironmental stewardship
Transformation See page 74
GRI 102-46, 102-47
28 Barloworld LimitedIntegrated Report 2018

Understanding our operating context
Dimension Trend Potential impact Our response
Political and regulatory
Countries are increasingly adopting regional approaches to security
Adopting regional strategies increase the complexity of doing business in the global arena
Through our participation in industry bodies, we aim to seek common solutions for challenges
The ongoing United States-China trade war
The trade war between these countries limits the potential for growth in our operating areas
We continue to engage our customers to meet their needs and to take advantage of opportunities
Sanctions and geopolitical uncertainty in Russia
While Barloworld has proved resilient against the sanction regime, we continue to closely monitor developments as this could impact the profitability of our customers
We continue to monitor developments, and proactively engage our stakeholders for common solutions
Political uncertainty in South Africa as a result of policy changes and election rhetoric leading up to 2019
Decline in consumer and investor confidence
Our engagement with government institutions and our participation in industry bodies seek solutions for shared challenges
Mining Charter policy uncertainty in South Africa around the Mining Charter, that was gazetted at the end of September 2018
Curtailment of some mining investments in the region
Engagement and representation through industry bodies on responses of interest to the industry and government
Amendments to the mining regulation in the DRC, with certain minerals subject to higher royalties
Decline in consumer and investor confidence
We continue to engage our customers to ensure we understand the potential impact and offer cost effective, tailored solutions
The context in which we operate has a profound influence on our business. We acknowledge the impact of global trends on the sustainability of our operations and develop our strategy in response to address the challenges they may pose, but also to take advantage of the opportunities they present.
29 Barloworld LimitedIntegrated Report 2018

Understanding our operating context
GRI 102-15
Dimension Trend Potential impact Our response
Economic Global economic growth is expected to remain stable at 3.1% for 2018¹
Economic gains are unevenly distributed between regions, underscoring the vulnerability of certain operating jurisdictions
We closely monitor economic developments in the regions where we operate and align our approach in response
South Africa experienced constrained economic growth and slipped into a technical recession during 2018
A constrained economy resulted in reduced consumer activity and oscillating investor confidence
We closely monitor the progress of the economic recovery plan launched in South Africa and seek to reduce our costs and remain agile
Russian economy is expected to grow by 1.9%²
Geopolitical factors may have an impact on pricing and the availability of products
We engage our customers and seek opportunities to ensure product availability
Many global commodity prices remain depressed, with certain commodities showing improvement
The impact is most acute for our equipment business servicing this market
Reduce costs and optimise efficiencies to take advantage of a potential upswing
Infrastructure spend in South Africa contracted, with some major companies in business rescue or liquidation
A contracting construction industry erodes our customer base
Closely monitor the plans for economic recovery in South Africa and reduce costs
Currency volatility in operating jurisdictions
Negative impact on infrastructure spend by governments
Closely monitor global currency trends and align our approach to respond
Social Localisation remains the major social trend
Increasing focus on preserving local knowledge, employing local talent and ensuring execution strategies speak to the local context
Our CSI programmes prioritise local development while our talent acquisition approach gives priority to local talent for employment
Social unrest in South Africa impacted our Logistics business through asset destruction
Escalating social tension and associated violence threatens the security of our freight and people
Our engagement with government institutions seek common solutions for security threats
The standard of living increased exponentially in Russia in recent years
While growing concerns over the lack of structural reforms are evident, the majority of the population acknowledges the progress
Societal progress and a growing middle class could present opportunities for our business and broaden our customer base
Technology threatens job security as certain skills become redundant
Implement skills development initiatives that transition the workforce
We seek to diversify our skills to ensure we remain relevant and fit for opportunity
1 https://www.worldbank.org/en/news/press-release/2018/06/05/global-economy-to-expand-by-3-1-percent-in-2018-slower-growth-seen-ahead² https://tradingeconomics.com/russia/gdp-growth-annual
30 Barloworld LimitedIntegrated Report 2018

Dimension Trend Potential impact Our response
Technology Autonomous, electrified, shared and connected transport solutions for individuals are imminent
Changing consumer preferences will require innovative solutions
We seek to understand and integrate new technology solutions to offer innovative solutions
Breakthroughs in artificial intelligence (AI)
Digital business models that will facilitate competitiveness are required
We leverage the latest technologies to build flexible, digital business models
The rise of contractual services where customers can access cloud-based platforms that coordinate real-time shipments
Disruptive industry forces or players will significantly alter the operating landscape of the future
Our technology-enabled solutions anticipate customer problems before they disrupt production
3D printing technology is rapidly transforming business models in the industrial world
Customers seek cost and production efficiencies from connected technologies
We are progressing the ability to digitally transform customer product requirements and service touch points
Environmental Lower carbon future, water scarcity, responsible waste management
Public pressure for transparency increases and opens the way for companies to demonstrate sustainability leadership, including environmental stewardship
Internal strategies, policies and aspirational targets are in place aimed at reducing our environmental footprint and ensuring responsible corporate citizenship
Changing consumer preferences for more environmentally friendly products and solutions that assist them to reduce their environmental footprint
Innovative solutions are required to ensure products and solutions remain relevant and competitive
We leverage our experience, skills and networks to develop innovative products and solutions that assist customers to realise their environmental ambitions
Responsible investment practices and decisions are increasingly taking into account environmental factors
Organisations that do not practice responsible environmental stewardship may not be considered attractive investments
Our integrated management approach, including our values, embed sustainability. We report on environmental aspects and provide credible and relevant information, including external assurance for material environmental disclosures
31 Barloworld LimitedIntegrated Report 2018

Strategy – Managing for value to deliver on our medium-term strategy
GRI 102-15
We forged a new path by explicitly defining our strategic goals and focus areas to deliver on our ability to sustainably maximise value creation. We began implementation of our strategy without delay, the results of which started to manifest in our 2018 half-year results.
Forging a new path
Our vision will remain while these levers will change over time as we implement our strategy and adapt to a changing environment. As this change occurs we continue to find the right levers to pull
to ensure the ongoing creation of shared value for our stakeholders.
Our new strategy seeks to create value by balancing our long-term growth ambitions while focusing on achieving acceptable returns for our shareholders in the medium term. This will continue to be underpinned by our responsible citizenship programme. In order to adapt to this new operating context and achieve our ambition, the group will drive the strategy by addressing three critical levers in the short to medium term:
During the corporate level strategy review process, we considered all aspects of the group and its businesses. This review caused us to reflect on the following items:
Fix and optimise our existing portfolio
Implement a more active shareholder operating model
Add high-growth businesses to our portfolio
What is the full potential of each business in the portfolio today in the context of the constraints of their existing markets?
Are there opportunities within each of our chosen business segments to further expand the group?
What else would we need to deliver on our growth for value ambitions?
OUR AMBITION IS BOLD
To double the intrinsic value of our business every four years, enabled by the managing for value operating model.
Our vision to delight our customers and maximise shareholder value is grounded in the understanding that we must run a successful business that generates superior returns for our shareholders in order for us to create value for
stakeholders and contribute meaningfully to the societies in which we operate.
In 2017 we worked to align both internal and external stakeholders, including board and management, on Barloworld’s medium-term strategy, informed by our bold ambition. In our last report we outlined our challenges and shortcomings in value creation, which, along with our assessment of the full potential of each of our businesses, informed the context of our change and identification of value-enhancing opportunities.
32 Barloworld LimitedIntegrated Report 2018

Deliver top quartile shareholder returns
Drive profitable growth
Instil a high-performance culture
Fix and optimise existing business portfolio to get full potential
Implement an active shareholder operating model
Acquisitive growth – focused on adding high growth businesses to our portfolio
AmbitionDouble the intrinsic value created every four years
GeographyA core presence in southern
Africa, with operations in Africa, Russia and Europe
CustomersA balanced portfolio, primarily
consisting of business to business (B2B) customers
OfferingIndustrial equipment,
automotive, logistics and branded goods and services
Where to focus
Leadership styleRole-modelling
customer centricity, living our
values, ensuring accountability and One Barloworld
TalentRobust talent
management and diversity to drive excellence and
winning behaviour
Leverage our scale and assets
Superior capabilities and footprint with
active portfolio management
How to deliver
Differentiated relationships
Deep relationships built on trust,
service and delivery
Leading brandsQuality local and
global brands that are leaders in their
categories
Key initiatives – Medium-term goals
FixEquipment Iberia: Iberia exit complete – released R2.5 billionLogistics: business improvement and restructuring (Project Tsutsumani) and disposal of underperforming assets
OptimiseEquipment Southern Africa: operational transformation (Project Akhani)Automotive: motor dealership portfolio assessment (Project Optimize) and cost-base review (Project Align).Restructure of leasing and rental assets
Managing for valueSystematic allocation of capital, talent and time to highest value opportunities, while ensuring group alignment
Talent managementMobilising and focusing talent on the most critical group issues
Portfolio rebalancingDriving corporate strategy and mergers and acquisitions (M&A) to support value creation and profitable growth
Barloworld Business SystemExecution capability based on a continuous improvement methodology
Value creationInorganic, value-accretive growth into attractive markets identified through a set of clear guardrails, based on industry attractiveness and our ability to win, for existing, adjacent and new businesses
Corporate portfolio rebalancing driven by managing for value philosophy and high-performance culture
VisionTo delight our customers and maximise
shareholder value
Inspiring a world of difference, enabling growth and progress in society
Purpose
33 Barloworld LimitedIntegrated Report 2018

Strategy – Managing for value to deliver on our medium-term strategy
Active portfolio management and performance monitoring
During the reporting period, we implemented the Barloworld managing for value operating model, an integrated managerial process systemically designed to enable us to effectively translate the strategic intent and bold ambition into value, by closing the value gap identified.
The process provides a focused agenda on the identification, execution and monitoring of priorities with the highest values‐at‐stake that close the value gap, the benefits of which include:
– Decoupling of strategy development from strategic planning
– Embedding a dynamic resource allocation model to allocate capital and talent in line with the most value‐maximising options
– Simplification and focus of strategic planning on the main value drivers of the business (supplemented by a detailed budget) to enable the business to get to full potential
– Simplification and focus of the performance management process, with fewer, consistent and value‐related key performance indicators (KPIs) for improved line of sight and consequential accountability
2017 Key initiatives outlined – executed in 2018 DRIVING GROUP RETURN ON EQUITY IMPROVEMENT 11.4% (2017: 10.5%)
Fix
Equipment Iberia: business improvement, restructuring and disposal Sale finalised and concluded in June 2018
Logistics: business performance improvement and restructuring
Significant turnaround – Improved performance in the 2018 financial year
Cash flow: R520 million cash generated (2017: R260 million)
Return on invested capital at 8.7% (2017: 2.5%)
Economic profit (R73 million) (2017: (R238 million))
Optimise
Equipment Southern Africa: operational transformation Reduced net expenses
Automotive: motor dealership portfolio assessment and cost base review
Dealer network review resulting in closure of an underperforming dealership and one non-core business
Dealership and head office cost review and realignment, resulting in headcount reduction, reduced expenses and improved operational efficiencies
34 Barloworld LimitedIntegrated Report 2018

DRIVEN THROUGH A MORE ACTIVE ROLE OF THE CENTRE: ACTIVE SHAREHOLDER OPERATING MODEL
Setting corporate-level strategy, group-level priorities and driving M&A
Optimal allocation of capital
Driving performance by setting standards and monitoring delivery
Integrated talent management framework and focusing talent on critical issues
STRATEGY AND PLANNING, M&A
CAPITAL ALLOCATION
PERFORMANCE
TALENT
Post the reporting period and, in line with our managing for value principle, we launched the Barloworld Business System (BBS) to help us build execution capability based on a continuous improvement methodology.
BARLOWORLD BUSINESS SYSTEM – EMBEDDING THE PRINCIPLES OF MANAGING FOR VALUE
Post the reporting period we launched the Barloworld Business System (BBS), a methodology centred on embedding a value enhancing culture of continuous
improvement; our Barloworld transformational way of addressing processes that hinder organisational effectiveness.
By simplifying our processes, understanding our value streams better, building execution capability and harnessing value opportunities that will help achieve our bold ambition, we will
further embed the core principles of managing for value.
If we are to ensure that our customers win we have to free up our people’s time so they can do those things that add value, create avenues for them to participate in identifying problems,
defining solutions, create clarity on outcomes and ownership thereof. That way we create better opportunities for them to grow and thrive, thus building sustainability of improvements where
change capacity and operational excellence are the norm.
35 Barloworld LimitedIntegrated Report 2018

Strategy – Managing for value to deliver on our medium-term strategy
Capital allocationIn the 2018 financial year Barloworld committed to capital release targets aimed at effective resource allocation, and optimal deployment of capital. We have continued to focus on efficient capital utilisation to enhance ROIC and economic profit.
The cash release of R2.5 billion from the sale of Equipment Iberia allows us to deploy capital in another emerging market territory that is aligned with the group’s competencies and this opportunity is being explored. This is also part of our capital release programme that will see us build cash up to R8 billion over the next six to nine months with focus on the following areas: – Automotive Avis Fleet – Leasing: R3 billion – R4 billion (six months) – Equipment Southern Africa Rental: R2 billion (six to nine months) – Optimising our capital structure through capital reduction (ongoing)
Looking aheadThe group will drive the disciplined allocation of capital by addressing its critical levers in the short to medium term.
Active shareholder operating model
Further embed our management principles to drive operational excellence and delivery capability through our managing for value and BBS methodology
Add high-growth businesses to our portfolio
Existing portfolioIn Equipment and Automotive we will target adjacencies that are asset light, counter-cyclical and offer synergies with customers or product, with growing profit pools
NewNew business will leverage existing distribution capabilities and competency
The group will focus on investigating opportunities to deploy capital into higher return businesses utilising strict criteria to ensure value accretive growth
Focus will be in emerging markets and regions contiguous to our existing territories
Progress against our strategic objectives
Our objective is to be the investment of choice by delivering top quartile returns to our shareholders, as measured by the return we generate on the capital invested.
Objective: Progress:
During the year, we continued implementing the strategy, following the review conducted in the prior year, to identify and address underperforming areas of the business through targeted interventions and projects focused on improving efficiency, while exploring acquisitive opportunities. The effects and sustainability of the interventions are beginning to reflect in the current year returns.
DELIVER TOP QUARTILE SHAREHOLDER RETURNS
Key performance indicatorsPerformance
Measure Target 2018 2017 2016
Return on equity* (%) ≥15.0 11.4 10.5 9.3Return on invested capital* (%) ≥13.0 12.3 11.2 9.4* For continuing operations.
36 Barloworld LimitedIntegrated Report 2018

To deliver on our ambition, we actively drive profitable growth across all businesses, to ensure we meet the expectations of our stakeholders.
Objective: Progress:
During the year, we embedded the reviewed and revised measures used to assess the profitability of our operations, moving towards a more balanced view of value creation.
DRIVE PROFITABLE GROWTH
Key performance indicatorsPerformance
Measure Target 2018 2017 2016
Economic profit (Rm) ≥0 (48) (286) (859)Economic profit delta (Rm) ≥0 238 574 (140)Free cash flow (Rm) ≥0* 3 591 3 405 4 279
* Positive free cash flow after interest, before dividends and before major corporate actions.
To deliver, we need to ensure we instil a high-performance culture that emphasises and rewards sustainable delivery.
Objective: Progress:
During the year, we progressed our understanding of the human capital capabilities we need to support our new strategic ambition. We identified key talent within the business and have developed interventions to support their growth.
INSTIL A HIGH-PERFORMANCE CULTURE
Key performance indicatorsPerformance
Measure Target 2018 2017 2016
SafetyWork-related fatalities Zero 2 3 1Lost-time injury frequency rate (LTIFR)* ≤0.5 0.69 0.75 0.75DevelopmentTotal direct training spend per employee ≥R8 000 R4 171 R6 472 R5 195Diversity and inclusion (2020 targets)% women of total headcount ≥35% 28% 28% 26%% women in middle management level and above ≥40% 38% 36% 34%% African, Indian and Coloured (AIC) employees of total headcount ≥75% 76% 74% 72%% AIC employees in middle management level and above ≥50% 45% 42% 34%Rating level under the dti codes Level 4 or better Level 3 Level 3 Level 3
* Lost-time injuries multiplied by 200 000 divided by total hours worked.
GRI 403-2, 404-1, 404-2, 405-1
37 Barloworld LimitedIntegrated Report 2018

Risk management
Change in rating from 2017
Key risks (listed in alphabetical order) Probability Severity
1 Acquisition underperformance
2 Climate and environmental
3 Competitor actions
4 Currency volatility No change No change
5 Defined benefit scheme exposure
9 Information security risks and digital disruption
7 Political risk, sanctions, terrorism and crime
6 Principals and suppliers
10 Regulatory environment
8 Significant customers and channels to market
11 Talent No change
12 Volatile commodity prices No change
The occupational health and safety risks are not reflected on the heat map as our practice is not to attach a value to injuries or fatalities.
100
90
Pro
bab
ility
(%
)
80
70
60
50 Value (R000)
0 50 000 100 000 150 000 200 000 250 000 300 000 350 000 400 000 450 000 500 000
1
3
2
11
10
89
12
6
5
7
4
GRI 102-15 www Barloworld's 2018 CDP climate change and 2018 CDP water disclosure responses
38 Barloworld LimitedIntegrated Report 2018

Barloworld group top risks – 2018 (in alphabetical order)
Key risks Category of risk and management response
Strategic goals and responsible corporate citizenship
Acquisition underperformance
The risk of future net cash flows from acquisitions and/or joint ventures failing to realise the projections upon which the initial purchase consideration or arrangement was based may lead to value destruction for shareholders and a need to impair the related goodwill or assets.
Acquisition risk − A business acquisition policy and procedure is in place that sets out a structured approach and framework to be used when acquisitions and/or joint ventures are being made or entered into. This includes a pre-acquisition phase that includes the requirement to conduct a comprehensive strategic analysis of intended targets, development of acquisition criteria for both strategic and financial aspects, and the quantification of risk-adjusted value creation potential for the respective business unit and the group.
− The acquisition phase includes strategic, legal, financial, tax, human capital, transformation, information systems and technology, technical, risk, governance and responsible corporate citizenship and environmental due diligence processes to verify and validate assumptions and future projections.
− Following acquisitions and/or the formation of joint ventures, planning and task teams are established to focus on the realisation and management of identified value creation opportunities, including synergies.
Deliver top quartile shareholder returns.
Drive profitable growth.
Climate and environmental
Barloworld considers a number of environment-related risks to its operations and value chain. These include climate change and related physical risks due to changing weather patterns; regulatory risks associated with greenhouse gas emissions; financial risks resulting from carbon taxes; operational risks due to constraints in energy supply and the availability of natural resources, such as water. The group identifies the predominant use of fossil fuel-based energy in its supply chain, operations, products and solutions as a risk to itself and its value chain.
Environmental/operational/strategic/financial/regulatory riskMinimise exposure through in-depth risk assessments and strategic responses. Ensure organisational resilience through aligned and integrated management activities and policies.These include:
− Implementation of aspirational efficiency improvement targets in non-renewable energy consumption, greenhouse gas emissions (scope 1 and 2) and water withdrawals, as well as an aspirational target for renewable energy consumption.
− Association with leading principals, provision of products and solutions with reduced environmental footprint and which assist customers to achieve their sustainable development objectives.
− Geographic, industry and product diversification.
Deliver top quartile shareholder returns.
Drive profitable growth.
Responsible corporate citizenship.
39 Barloworld LimitedIntegrated Report 2018
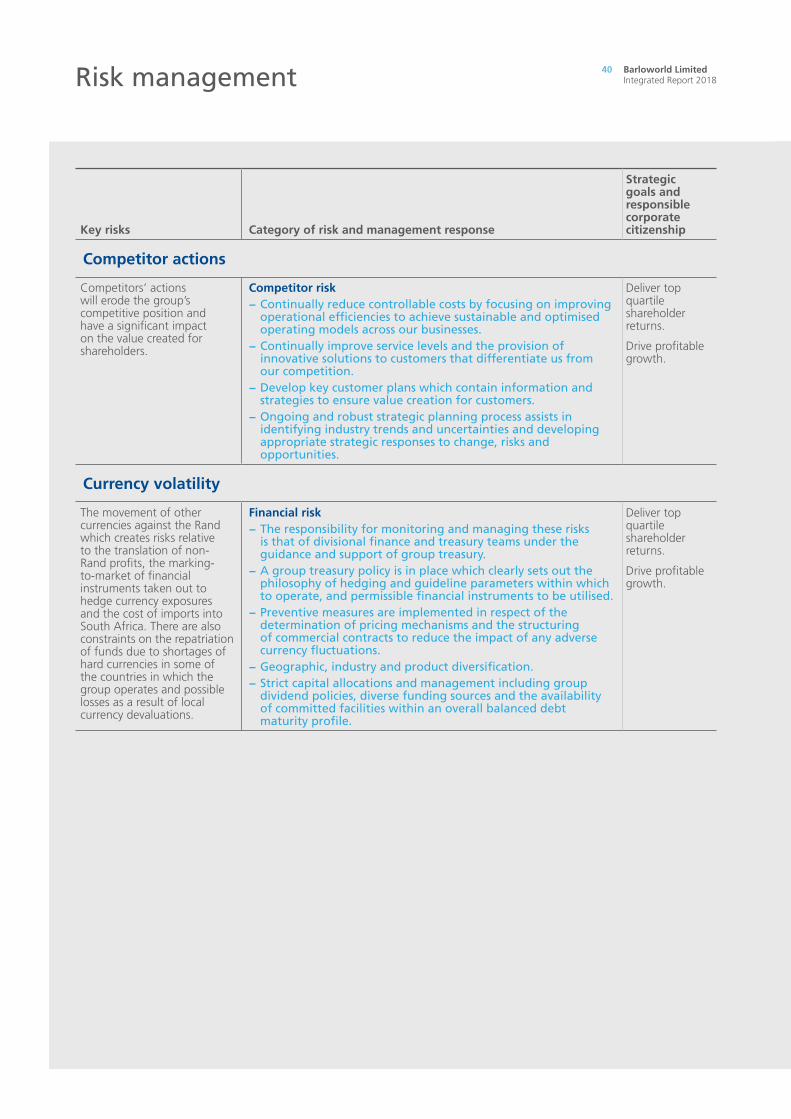
Risk management
Key risks Category of risk and management response
Strategic goals and responsible corporate citizenship
Competitor actions
Competitors’ actions will erode the group’s competitive position and have a significant impact on the value created for shareholders.
Competitor risk − Continually reduce controllable costs by focusing on improving operational efficiencies to achieve sustainable and optimised operating models across our businesses.
− Continually improve service levels and the provision of innovative solutions to customers that differentiate us from our competition.
− Develop key customer plans which contain information and strategies to ensure value creation for customers.
− Ongoing and robust strategic planning process assists in identifying industry trends and uncertainties and developing appropriate strategic responses to change, risks and opportunities.
Deliver top quartile shareholder returns.
Drive profitable growth.
Currency volatility
The movement of other currencies against the Rand which creates risks relative to the translation of non-Rand profits, the marking-to-market of financial instruments taken out to hedge currency exposures and the cost of imports into South Africa. There are also constraints on the repatriation of funds due to shortages of hard currencies in some of the countries in which the group operates and possible losses as a result of local currency devaluations.
Financial risk − The responsibility for monitoring and managing these risks is that of divisional finance and treasury teams under the guidance and support of group treasury.
− A group treasury policy is in place which clearly sets out the philosophy of hedging and guideline parameters within which to operate, and permissible financial instruments to be utilised.
− Preventive measures are implemented in respect of the determination of pricing mechanisms and the structuring of commercial contracts to reduce the impact of any adverse currency fluctuations.
− Geographic, industry and product diversification. − Strict capital allocations and management including group dividend policies, diverse funding sources and the availability of committed facilities within an overall balanced debt maturity profile.
Deliver top quartile shareholder returns.
Drive profitable growth.
40 Barloworld LimitedIntegrated Report 2018

Key risks Category of risk and management response
Strategic goals and responsible corporate citizenship
Defined benefit scheme exposure
One of the key risks for the United Kingdom’s defined benefit scheme over the past few years has been the reduced real yield on AA rated corporate bonds which is used to value the liabilities. In addition, increased life expectancy of members will have an adverse impact on the scheme’s funding position, although this trend has slowed recently. Market volatility remains a risk, with 50% of the scheme’s assets invested in growth assets (largely equities), which includes diversification into absolute return funds. The year-end accounting valuation resulted in the deficit decreasing to £95 million, largely due to a marginal increase in interest rates, good asset returns and changes in the demographic assumptions. The scheme is maturing with the average age of deferred members of 54 years and pensioners of 75 years. This is resulting in the trustee board adopting more prudent assumptions as it will become increasingly necessary to match the investment strategy with the cash outflows necessary to fund the pension payments. The triennial valuation has been completed, which has produced a higher actuarial deficit of £154 million as compared to the valuation in 2014 of £112 million. The increased deficit has largely been due to the reduced gilt interest rates of 2.15% compared to 3.9% in 2014.
Market risk − A suitably qualified representative board of trustees, which includes a professional independent trustee, manages the scheme and is responsible for regularly evaluating the effectiveness of investment decisions, the setting of actuarial factors for the liabilities and managing the administration. Professional investment advisers are used to assist in the management of the investment portfolios with a view to conservatively preserving and enhancing fund valuations. Complex investment risk models are run by the investment advisers and actuaries to assess optimum risk balance. The actuary also conducts a formal triennial valuation and provides updated figures on a real-time basis.
− Funding shortfalls are planned to be made up within sensible time frames via market-anticipated increased interest rates, positive returns on investments and additional contributions from the company agreed at the 2017 triennial valuation. The recovery plan agreed is expected to fund the deficit over nine years.
− The company and trustees have agreed a long-term strategy for reducing funding risk as and when appropriate. This includes a liability-driven investment (LDI) policy which aims to reduce volatility of the funding level of the pension plan by investing in bonds which operate as interest rate hedges, and matching annuities (buy-ins) for pensioners which fund the liabilities agreed in the buy-in. In 2013 and 2016, the fund purchased buy-in insurance policies representing approximately 25% of the assets, and in 2017 invested in interest rate hedges via a pooled fund managed by Legal and General. The combination of the existing hedging, the buy-ins and the bond holdings means the scheme is now 31% hedged against interest rate volatility and 17% hedged against mortality. Following the recent valuation, the interest hedges will be increased to 50%.
− The accounting deficit has been reflected on the company’s balance sheet as a liability in line with International Financial Reporting Standards.
Deliver top quartile shareholder returns.
Responsible corporate citizenship.
41 Barloworld LimitedIntegrated Report 2018

Risk management
Key risks Category of risk and management response
Strategic goals and responsible corporate citizenship
Information security risks and digital disruption
Barloworld makes extensive use of IT systems and digital technology in its operations and to deliver services to its customers. The growing threat landscape posed by cyber-attacks from both cyber-crime and cyber-warfare poses an increasing risk to the business. This threat landscape includes operational disruption, information theft and damage to the group’s reputation.
There is a risk of technological obsolescence and being ‘left behind’ should the group not embrace digital technologies.
Employee/operational/strategic riskBarloworld continues to mature its information security approach in line with the evolving threat landscape.The approach is based on the ability to:
− Prevent, detect and respond to attempts to access the group’s information.
− Restore confidentiality, integrity and availability of systems, information and data in the event of a breach.
− Proactively train, promote and raise information security awareness.
The approach includes all appropriate security mechanisms, physical, technical, organisational, human orientated and legal to keep all information protected against threats.Insurance cover has been effected to offset any losses that may arise from cyber-risk.Barloworld is investing in digital transformation initiatives to improve efficiencies within our businesses and, together with our principals, we are exploring digital technologies to remain relevant and competitive in the markets in which we operate.
Deliver top quartile shareholder returns.
Drive profitable growth.
Instil a high-performance culture.
Occupational health and safety risksBarloworld’s key asset is its employees. The occupational health and safety risk is the likelihood of a person being harmed or suffering adverse health effects if exposed to a hazard in the workplace.
Employee/operational/strategic risk − Minimise exposure through in-depth risk assessments, coupled with the application of preventive and corrective risk management activities and policies.
− Extensive communication and safety awareness programmes, training in accident prevention, accident response, emergency preparedness and the use of protective clothing and equipment, and extensive monitoring, reporting and review of safety data, all with the aim of ensuring a healthy and safe workplace.
Instil a high-performance culture.
42 Barloworld LimitedIntegrated Report 2018

Key risks Category of risk and management response
Strategic goals and responsible corporate citizenship
Political risks, sanctions, terrorism and crimeThe group’s people and assets are spread through numerous countries around the world, while its activities are conducted in many more.
The possibility exists that the group’s people and assets, and the viability of the businesses, may be exposed to sanctions, acts of terrorism, political turmoil or crime in some of the regions in which the group operates, as well as in those that may be identified for expansion. Business growth initiatives require that new markets and territories are the focus of business expansion. These opportunities come with their own distinct risk exposures.
Operational risk − Minimise exposure in high-risk countries through in-depth risk assessments, coupled with the application of preventive and corrective risk management activities.
− Monitor and ensure compliance with international sanctions. − Maintain flexible business models. − Maintain business continuity plans that incorporate emergency response actions, crisis management and business recovery plans specific to the businesses and the respective territories in which the businesses operate.
− Optimise the geographic spread of operations.
Deliver top quartile shareholder returns.
Drive profitable growth.
Responsible corporate citizenship.
Principals and suppliers
Significant businesses in the group are dependent on a small number of principals and/or suppliers.
Barloworld’s success is therefore linked to their ongoing reputation and good standing, financial stability, the competitiveness and quality of their products and services and the availability of equipment to meet customers’ evolving needs.
In order to ensure sustainable value creation, the group depends on suppliers of infrastructure in the countries in which it operates. Most of the group’s businesses are dependent, inter alia, on reliable power and water supply and appropriate transport networks.
Strategic risk − Add value by giving constant feedback to the principals on customer requirements and expectations, market movements and product competitiveness.
− Continually improve/build relationships with principals and major suppliers and strive to be a preferred dealer/customer.
− Provide excellent customer service and lead in our markets. − Build long-term partnerships with customers. − Perform supplier due diligence assessments. − Build relationships with local authorities. − Align strategies and targets with those of the major principals as far as possible.
− Implement initiatives to reduce dependency on infrastructural deficiencies and increase organisational resilience.
Deliver top quartile shareholder returns.
Drive profitable growth.
43 Barloworld LimitedIntegrated Report 2018

Risk management
Key risks Category of risk and management response
Strategic goals and responsible corporate citizenship
Regulatory environmentThe group is subject to an ever-changing statutory universe across all its divisions and geographies. These are monitored and assessed using both internal and external resources. However, the scope of these changes is such that it is difficult to ensure full compliance.
Regulatory risk − Management is responsible for the ongoing monitoring of all pending and actual changes to the group’s regulatory environment. Due to both the large number of and new jurisdictions in which the group operates, this monitoring is an ongoing process.
− A risk-based approach is followed to ensure compliance.
Instil a high-performance culture.
Significant customers and channels to market
Barloworld is exposed to certain large customers and/or industries and well-established distribution and support channels that may change or consolidate.
Market risk − Build long-term partnerships with customers. − Develop customer solutions which differentiate and expand the group’s offering from product-based businesses to service and solutions focused.
− Diversify customer base. − Develop new channels. − Monitor and anticipate competitor activity.
Deliver top quartile shareholder returns.
Drive profitable growth.
Talent
The group is exposed to the ever-increasing war for top talent and might therefore face challenges in attracting, developing and retaining the diverse talent required to sustainably deliver its strategy. If we do not become a company that reflects the demographics of the countries where we operate, our competitiveness and legitimacy will be negatively impacted, and we may lose our licence to trade in the respective regions.
Strategic/employee risk − Focus on creating group-wide, integrated and robust talent growth opportunities and experiences as well as long-term retention plans through a redesign of our talent management strategy.
− Key focus on our diversity and inclusion targets including the percentage of women in the group and having the targets set at group executive and social, ethics and transformation committee levels.
Deliver top quartile shareholder returns.
Drive profitable growth.
Instil a high performance culture.
Volatile commodity prices
The effect of volatile commodity prices has contributed to the slower than anticipated recovery of the group’s businesses, customers, suppliers and funders and to the continued risk that funding constraints within the supply chains could result in a recurring recession and/or impede growth. This, in turn, has negatively impacted many company investments.
Financial risk − Inflationary pressures to be carefully monitored and managed, as appropriate, in each business.
− Focus on costs and cost reduction opportunities, and improve operating efficiencies.
− Monitor customers’ ability to spend, access credit, and settle debt.
− Reduce working capital, limit capital expenditure and improve cash flow.
− Secure adequate committed borrowing facilities. − Maintain credit rating.
Deliver top quartile shareholder returns.
Drive profitable growth.
44 Barloworld LimitedIntegrated Report 2018

Technology and information
The Barloworld board is responsible for governance of group technology and information. The risk and sustainability committee provides oversight of IT governance and has delegated responsibility to management through the group IT steering committee.
Significant IT investments and expenditure are controlled in terms of the group’s delegation of authority framework. Major IT initiatives are reviewed and monitored by the group IT steering committee and a quarterly technology and information report is tabled at the risk and sustainability committee and the board. Management regularly demonstrates to the governing committees that adequate business resilience arrangements are in place including IT disaster recovery.
Independent assurance reviews are conducted by internal and external auditors, and specialist providers on the technology supporting the group’s technology and information arrangements. Findings and remediation progress are reported to the groups governing committees. There is continuous evaluation of the maturity levels of information security to address the evolving cyber-crime landscape. An independent assessment of the effectiveness of the Barloworld information security standard was conducted in the period with no material issues identified.
A group-wide initiative has been introduced to embed a continuous improvement culture in our businesses. The intention is to transform and simplify our processes; better understand our value streams, and build execution capability while harnessing value opportunities. The future focus of the group is ensuring that the digital initiatives within the businesses yield internal efficiencies and evolve the digital customer experience.
The group has specific focus on the risks associated with third party and outsourced service providers. The group has undertaken an assessment on the privacy posture in the various businesses to ensure that personal information of all stakeholders is adequately protected.
45 Barloworld LimitedIntegrated Report 2018

Our stakeholder relationships
Creating value for our stakeholders is central to our management philosophy. In an increasingly uncertain operating context, we recognise that the quality of our relationships has a direct impact on our long-term sustainability. By effectively addressing our stakeholder concerns, we can co-create solutions for a common purpose to maximise value.
Stakeholder engagement takes place at group, corporate and divisional levels, guided by our group policy that has operational guidelines and a reporting framework. In the context of sustained value creation, Barloworld follows an inclusive stakeholder engagement approach to develop and achieve solutions.
Material issue Strategic response Capitals Stakeholder Engagement platformsCapital allocation – Cash release and allocation
– Addressing returns – Active portfolio management – Performance monitoring – Growth
– Shareholders – Individual meetings and conference calls – Web updates – Securities Exchange News Service – Annual general meetings – Industry conferences
Operational performance – Unpack key levers for operational efficiencies – Unlocking full potential – Placing customers at the centre – Future outlook
– People – Individual balanced scorecards, surveys and staff forums – Employee wellness programmes – Mentorship and coaching – Forums with trade unions
– Customers – Visits by representatives, telephonic and email communication – Group website – Surveys – Quarterly forums – Call centres
– Principals – Visits by representatives, telephonic and email communication – Conferences and supplier forums – Online portals
High-performance culture – Talent management – Performance optimisation – Diversity and inclusion – Remuneration and reward to drive shareholder value maximisation
– Culture change – Safety and health
– People – Individual balanced scorecards and surveys – Staff forums – Employee wellness programmes – Mentorship and coaching – Forums with trade unions
Licence to operate – Role in communities – Environmental stewardship – Transformation
– Communities – Engagement through principals and suppliers – Barloworld Trust partnership with NGOs and CSI partners – Public sector engagement
– Suppliers – Visits by representatives – Conferences and supplier forums – Telephonic and email communication – Online portals
GRI 102-40, 102-42 to 102-44, 102-47
46 Barloworld LimitedIntegrated Report 2018

See page 94 for more information.
Material issue Strategic response Capitals Stakeholder Engagement platformsCapital allocation – Cash release and allocation
– Addressing returns – Active portfolio management – Performance monitoring – Growth
– Shareholders – Individual meetings and conference calls – Web updates – Securities Exchange News Service – Annual general meetings – Industry conferences
Operational performance – Unpack key levers for operational efficiencies – Unlocking full potential – Placing customers at the centre – Future outlook
– People – Individual balanced scorecards, surveys and staff forums – Employee wellness programmes – Mentorship and coaching – Forums with trade unions
– Customers – Visits by representatives, telephonic and email communication – Group website – Surveys – Quarterly forums – Call centres
– Principals – Visits by representatives, telephonic and email communication – Conferences and supplier forums – Online portals
High-performance culture – Talent management – Performance optimisation – Diversity and inclusion – Remuneration and reward to drive shareholder value maximisation
– Culture change – Safety and health
– People – Individual balanced scorecards and surveys – Staff forums – Employee wellness programmes – Mentorship and coaching – Forums with trade unions
Licence to operate – Role in communities – Environmental stewardship – Transformation
– Communities – Engagement through principals and suppliers – Barloworld Trust partnership with NGOs and CSI partners – Public sector engagement
– Suppliers – Visits by representatives – Conferences and supplier forums – Telephonic and email communication – Online portals
We ensure our processes are designed to understand and capture legitimate and relevant material stakeholder issues in the context of the legal and strategic context of our business.We respond through our decisions, our demonstrated actions and performance, as well as our communication efforts.
47 Barloworld LimitedIntegrated Report 2018

Managing for value
48 Barloworld LimitedIntegrated Report 2018

49 Barloworld LimitedIntegrated Report 2018

Equipment
Medium-term strategy: Optimise
REACH FULL POTENTIAL AND EXCEED GROUP RETURN ON INVESTED CAPITAL OF 13%
Actions in managing for value
– Improve returns in underperforming businesses above group hurdle rate
– Reduce business process complexity and cost to serve through operational and digital transformation
– Reduce rental book size from R2.5 billion to R2 billion and seek equity partner to double the rental business
– Focus on growth in profitable product range and segment
– Roll out operational excellence programme to sustain new discipline
Highlights
Cash flow
R99 million outflow (2017: R1 337 billion)
Return on invested capital at
12.7% (2017: 12.8%)
Economic profit at
R47 million (2017: R46 million)
Operating profit at
R1 790 million (2017: R1 785 million)
Operating margin at
9.1% (2017: 9.8%)
Full year revenue increased by 8.1% to R19.8 billion primarily due to higher new equipment and rental revenues. Machine revenue was up 21% in 2018 compared to the same period in 2017, driven by growth in mining sales and market share growth in the construction sector. Operating profit remained flat at R1.8 billion. Operating margin reduced to 9.1% (2017: 9.8%), largely due to changes in the sales mix and exchange rate translations.
Policy uncertainty in South Africa around the Mining Charter that was gazetted at the end of September 2018 resulted in curtailment of some mining investments in the region. Nonetheless, demand in underground machines and deliveries to Mozambique and Zambia boosted overall mining machine sales.
Reduced demand in public works and investment in infrastructure constrained the construction sector, but aided by competitive machine offerings and financing solutions, we were able to grow market share in the construction machinery market and introduced new product lines into the sector. Also launched during the period, with Caterpillar, was the local Caterpillar financial services.
The Energy and Transportation segment was also constrained over the period, reflecting a depressed Genset and Engine market and deferral/cancellation of major projects.
Aftermarket revenue for the year was down 2%, due to reduction in MARC and Service revenues, which was also impacted by the ramp down of the DeBeers Voorspoed mine in the Free State in preparation for closure. Service revenue generation dropped by 8.6% due to low service activities in South Africa, Mozambique and Botswana.
DRC JV (Bartrac) delivers solid performance: R251 million in associate income in 2018 compared to R97 million in 2017
Work-related fatalitiesOur focus on safety continues to keep safety
awareness up and create a zero harm environment
ZERO
GRI 102-15
Southern Africa
50 Barloworld LimitedIntegrated Report 2018

Ongoing cost management efforts resulted in a 2% decrease in net expenses, despite inflationary increase in employment costs. We invested R111 million towards IT and digital infrastructure in support of our operational transformation programme.
Bartrac JV, in the Democratic Republic of Congo (DRC), delivered a solid performance, reflecting higher commodity prices and ramp up in production, delivering R251 million in associate income compared to R97 million in 2017. This is notwithstanding the unstable regulatory environment and legal battles involving our key customer which have since been resolved.
Capital allocationImportant to our managing for value principle is deploying strategies to better manage our working capital, and we are exploring options for alternative funding for the growth in rental solutions.
Looking forwardFirm order book stood at R2.4 billion (2017: R1.5 billion).
Order book (Rbn)
Sep 18
Sep 17
R2.4 bn
R1.5 bn
Commodities fundamentals to remain favourable
The South African government’s economic recovery plan is expected
to boost the construction and energy and transport sector with a pledge
of R400 billion to infrastructure development over the next three
years
Industry
1
Focus on improving regional and segment profitability
Delivering operational transformation and process solutions for organisational effectiveness and
efficiency
Embedding a culture of continuous improvement through Barloworld Business System (BBS) to harness
value opportunities
Business transformation focus
2
Move from pure product demand to solutions offering
Adoption of protectionism policies in southern Africa
Chinese contractors and state-owned entities exert influence in Rest of
Africa
Trends
3
Looking forward
Managing for value driving operational performanceRevenue (Rm)
Revenue (Rm)
20 000
15 000161718
18 54718 287
19 775
Revenue (Rm)
Operating pro�t (Rm)
161718
2 000
1 500
1 000
500
0
1 5851 7851 790
Revenue (Rm)
10
5
Operating margin (%)
161718
10
5
8.5
9.89.1
51 Barloworld LimitedIntegrated Report 2018

Equipment
Russia
Medium-term strategy: Grow
MAINTAIN PERFORMANCE ABOVE TARGET FOR GROUP RETURN ON INVESTED CAPITAL
Actions in managing for value
– Grow prime product market share and aftermarket
– Maintain effective cost controls and culture of operational efficiency
– Further engender customer-centricity
– Continue focus on technology-enabled solutions
– Upscale skills and capability in line with growth opportunities
Highlights
Cash flow
$22.2 million cash generated (2017: $17.5)
Return on invested capital at
21.6% (2017: 18.4%)
Economic profit at
$20.0 million (2017: $12.6 million)
Operating profit at
$61.7 million (2017: $43.7 million)
Operating margin at
10.3% (2017: 11.3%)
Despite harsh trading conditions and complex geopolitics, the Equipment Russia business delivered record results in 2018 with a 57% and 41% increase in Dollar terms in revenue and operating profit respectively, while operating margin moderated due to the change in sales mix. This was driven by a strong mining performance with machine deliveries into various commodity sectors, particularly in the gold and coal mining sectors.
Our aftermarket business performed above expectations driven by component and machine overhauls, site presence agreements and new machine assemblies.
In spite of the risks associated with geopolitical uncertainties, further sanctions and the introduction of higher retaliatory customs duties on US-sourced products, we have identified opportunities for further growth of our machine and aftermarket business, by focusing on developing solutions that are customer specific and incorporating technologies that support and enhance customer profitability. Our strategy of developing our branch network across the territory will support our value
Managing for value driving operational performanceRevenue (Rm)
1 000
500
0
Revenue ($m)
161718
329385
606
4144
62
Revenue (Rm)
100
50
0
Operating pro�t ($m)
161718
Revenue (Rm)
15
10
5
0
Operating margin (%)
161718
12.411.3
10.3
Concerted efforts have been made to continue strengthening and propagating a safety culture throughout the organisation
WE REGRETTABLY HAD ONE WORK-RELATED FATALITY
52 Barloworld LimitedIntegrated Report 2018

proposition and lead to opportunities. The infrastructure segment also presents opportunities should federal funding in Russia be directed towards projects in our territory.
Effective cost controls and a culture of operational efficiency, along with balance sheet management, supports our results. This involves continuous improvement in forecasting and stock realisation.
Looking forwardSolid firm order book despite significant deliveries executed in second half of the 2018 financial year.
Order book ($m)
Sep 18
Sep 17
Sep 16
44 32
Large deals (138)
(62.4%)
64
21
Firm orders signed after 30 September 2018
Geopolitical environment remains volatile and challenging
Mining sector and commodity outlook is expected to maintain
positive trajectory, increased retaliatory customs duties will reduce large mining product opportunities
Industry
1
Anticipating higher demand for component and machine rebuild solutions as many customers are
likely to extend the life of their fleets
We will work closely with Caterpillar in carefully evaluating market
development and aligning price levels where possible to mitigate the
impact of sanctions and increased customs tariffs
Aftermarket revenues expected to improve further on the basis of
increased population and anticipated machine and component rebuilds
Drive growth consolidation, tight control over expenses and working
capital management
Operational
2
Medium-term focus on owner miners and mining contractors, who typically procure larger construction Caterpillar equipment manufactured in Russia, Europe, Latin America or
China
Increase in the utilising of formal tenders and online purchasing
practices to obtain optimal pricing across competitors by customers
Trends
3
TECHNOLOGY-ENABLED SOLUTIONS
Notable success in the use of immersive technologies, simulators and remote control technologies in 2018
This will continue to be central to our customer value proposition
Looking forward
53 Barloworld LimitedIntegrated Report 2018

Equipment
Divisional key performance indicators
Equipment Southern Africa Europe Russia HandlingShare of
associate income
Financial capital 2018 2017 2018 2017 2018 2017 2018 2017 2018 2017 2018 2017
Revenue (Rm) 27 572 23 428 19 775 18 287 7 797 5 141 114 765Operating profit/(loss) (Rm) 2 594 2 367 1 790 1 785 804 582 (20) (5) 241 97Net operating assets (Rm) 14 596 15 091 11 637 10 106 2 441 2 959 2 544 306 443 14 902 15 534
Social capital
Employee headcount 5 763 5 766 4 719 4 824 18 17 1 026 925 25 24LTIFR† 0.31 0.32 0.32 0.31 0.00 0.00 0.20 0.45 0.00 0.97Work-related fatalities 1 0 0 0 0 0 1 0 0 0B-BBEE rating n/a n/a 1 1 n/a n/a n/a n/a n/a n/a
Natural capital
Petrol and diesel (ML) 5.09 6.30 4.14 5.43 0.00 0.00 0.95 0.87 0.02 0.36Grid electricity (MWh) 18 544 19 615 15 003 16 137 66 115 3 475 3 363 27 213Non-renewable energy (GJ) 253 236 301 809 206 428 258 237 591 693 46 217 42 879 605 14 169GHG emissions (tCO2e) (scope 1 and 2) 28 678 33 033 25 074 29 656 49 67 3 555 3 310 51 1 131Water withdrawals^ (ML) 170 170 158 158 1 1 11 11 1 2† Lost-time injuries multiplied by 200 000 divided by total hours worked.# Not rated in 2017.^ Municipal sources.
GRI 102-7
54 Barloworld LimitedIntegrated Report 2018

55 Barloworld LimitedIntegrated Report 2018

Automotive
Medium-term strategy: Optimise and grow
REACH FULL POTENTIAL AND EXCEED GROUP RETURN ON INVESTED CAPITAL OF 13% BY 2020
Actions in managing for value
– Review and optimise portfolio
– Address underperforming business units and segments as a key focus
– Align with OEM footprint strategy and optimise returns for our OEMs and principals
– Investigating alternative funding solutions
– Drive intergroup synergies and provide integrated solutions offering
– Digital platforms and toolsets to optimise solutions
– Identify and pursue growth opportunities
Highlights
Cash flow of
R690 million (2017: R794 million)
Return on invested capital at
12.4% (2017: 13.1%)
Economic profit at
(R5 million)(2017: R81 million)
Operating profit at
R1 701 million (2017: R1 747 million)
Operating margin at
5.7% (2017: 5.5%)
CORPORATE ACTIVITY
Minority buy-out in Salvage Management and Disposal (SMD), effective on 19 February 2018
Closed down N4 Witbank Jaguar Land Rover effective 31 July 2018
Segmental performance
In managing for value and ensuring ongoing value creation for all our stakeholders, our focus in the reporting year has been on executing on the group’s medium-term strategy to optimise each of our businesses to reach their full potential. In achieving this all business units across the division have
implemented turnaround strategies to address underperforming segments, re-aligned and restructured cost bases for current activity levels and position themselves for future growth.
GRI 102-15
-4.6%
+3.2%
-7.1%
Operating pro�t (Rm)
Car rental
Operating margin
(%)
8.28.7
19.317.4
2.62.6
Avis �eet
Motor Trading
536 million562 million
641 million621 million
524 million564 million
■ 2018 ■ 2017
Concerted efforts have been made to continue strengthening and propagating a safety culture throughout the organisation
WE REGRETTABLY HAD ONE WORK-RELATED FATALITY
56 Barloworld LimitedIntegrated Report 2018

Managing for value driving operational performanceRevenue (Rm)
Revenue (Rm)
32 000
30 600
29 200
27 800
26 400
25 000161718
31 42731 593
29 809
Revenue (Rm)
Operating pro�t (Rm)
2 000
1 500
1 000161718
1 6541 7471 701
GRI 102-7
achieved through recently securing additional sizeable corporate contracts.
Motor Trading delivered an operating profit of R524 million, down 7.1%, off a revenue of R20 billion, down 7.5% which was impacted by the dealer network restructuring and revenue recognition in line with the new agency model implemented by Mercedes-Benz (Passenger). On a comparable basis, revenue increased by 1.2% on the prior year. While the industry showed marginal growth of 0.5%, it was more negatively impacted by the premium market which declined for the fourth consecutive year. The volume brands delivered a good performance with a positive contribution from aftermarket revenues. The business has benefited from the cost alignment and restructuring decisions taken in the past two years and to further optimise the portfolio, the business closed the underperforming N4 Witbank Jaguar Land Rover dealership and disposed of a non-core business, Coachworks Tokai. Effective 19 February we acquired the minority shares in Salvage Management and Disposal (SMD), which continues to be value accretive with year-on-year growth.
Capital allocationA key driver of managing for value is releasing capital to invest in higher yielding business units. As part of the group’s capital release programme we are reviewing alternative funding solutions for our Fleet business to allow for optimal allocation of capital, while providing the business with the ability to grow organically. An improved focus on higher value opportunities will realign our cost bases to new activity levels and set the businesses up for growth.
2018 performanceThe Automotive division generated operating profit of R1 701 million against revenue of R29.8 billion and yielded an operating margin of 5.7% (2017: 5.5%). A satisfactory result in a difficult trading environment influenced by subdued industry performance, currency volatility and inflation, negative socio-economic conditions, continued decline in business confidence and depressed consumer sentiment.
Car Rental grew revenue by 1.3% to R6.5 billion but operating profit declined by 4.6% to R536 million. Despite the car rental industry being down 0.7%, Avis Budget grew rental days and increased rate per day. Returns were negatively impacted as the used vehicle market for one-year-old vehicles came under pressure and margins declined as a result of lower new vehicle inflation. The business focused on costs and efficiencies, containing fleet costs below inflation, decreased vehicle damage expenses and maintained fleet utilisation at 76%.
Avis Fleet grew operating profit by 3.2% to R641 million and lower leasing revenues in some key contracts resulted in a revenue decline of 6.8% to R3.3 billion. The business achieved a record operating margin of 19.3% (2017: 17.4%). Good used vehicle profit contribution from three to five-year-old de-fleeted vehicles positively contributed to the overall results. Notwithstanding the finance fleet reducing due to the non-renewal of a few large contracts, the total fleet under management increased by 2.0%. In October the City of Johannesburg announced the non-renewal of the Avis Fleet contract for non-specialised vehicles. However, some positive momentum has been
Revenue (Rm)
Operating margin (%)
6.0
5.5
5.0161718
5.3
5.5
5.7
57 Barloworld LimitedIntegrated Report 2018

Automotive
Continue to create value through
optimising existing business portfolio
Turnaround strategies and review of
underperforming businesses and
segmentsIdentify and implement
alternative funding solutions to fund
assets more effectively to enhance returns
Identify organic and acquisitive growth
opportunities in asset-light adjacenciesOptimising the
inherent synergies of our innovative vehicle
usage offering
An upsurge in the global connectivity
trends will drive efficiencies and
also enhance our customer experiences
Increasing mobility trend will require
the business to innovate
continuouslyOngoing reliance on technology to
introduce new experiences and channels to grow
the business
Car Rental industry rental day growth to
remain subduedDual brand
strategy and yield
management to deliver top line
growthLeverage
technology and mobility
solutions to improve customer
experience and drive efficiencies
AutomotiveDivision
CarRental
AvisFleet
MotorTrading
Trends
Industry growth in line with inflation
anticipatedImplement
alternative funding solutions
Subdued growth expected over the next 12 months for
the new vehicle market
Premium segment to remain under
pressure
1 2 3 4 5
Looking forward
Divisional key performance indicatorsAutomotive Car Rental Avis Fleet Motor Trading
Financial capital 2018 2017 2018 2017 2018 2017 2018 2017
Revenue (Rm) 29 809 31 593 6 528 6 446 3 326 3 570 19 955 21 577Operating profit/(loss) (Rm) 1 701 1 747 536 562 641 621 524 564Net operating assets (Rm) 8 758 8 675 2 854 2 750 3 778 3 687 2 126 2 238
Social capital
Employee headcount 7 115 7 397 2 118 2 099 523 539 4 474 4 759LTIFR† 0.94 1.12 0.61 0.44 0.48 0.61 1.15 1.48Work-related fatalities 1 0 0 0 0 0 1 0B-BBEE rating n/a n/a 3 3 2 2 3* 3*
Natural capital
Petrol and diesel (ML) 8.46 9.55 3.10 3.40 0.60 0.63 4.76 5.52Grid electricity (MWh) 34 564 37 296 6 781 6 454 1 169 1 329 26 614 29 513Non-renewable energy (GJ) 421 293 469 130 130 784 139 618 25 327 26 771 265 182 302 741GHG emissions (tCO2e) (scope 1 and 2) 55 017 60 413 14 005 14 332 2 547 2 769 38 465 43 312Water withdrawals^ (ML) 277 348 77 117 8 10 192 221
† Lost-time injuries multiplied by 200 000 divided by total hours worked.* Ratings under Barloworld South Africa.^ Municipal sources.
58 Barloworld LimitedIntegrated Report 2018

59 Barloworld LimitedIntegrated Report 2018

Logistics
Medium-term strategy: Fix
ADDRESS UNDERPERFORMANCE TO MEET TARGET FOR GROUP RETURN ON INVESTED CAPITAL OF 13% BY 2020
Actions in managing for value
– Turn around the financial and operational performance:
– Fit-for-purpose Selling General & Administration (SG&A) costs – align SG&A costs with the size and profitability level of the business
– Optimal operational performance – improve the operational efficiency of the business
– Procurement rebates/savings
– Implement lean and customer-focused operating model to support future growth
Highlights
Cash flow:
R520 million cash generated (2017: R260 million)
Return on invested capital at
8.7% (2017: 2.5%)
Economic profit at
(R73 million) (2017: (R238 million))
Operating profit at
R262 million (2017: R101 million)
Operating margin at
4.4% (2017: 1.6%)
Despite this overall constraining economic environment Barloworld Logistics produced significant improvements in business performance, driven by focused transformational turnaround plans creating value uplift during the reporting period. The business recorded total revenue of R5.9 billion, a decline of 4% from 2017, primarily due to lower trading in our supply chain management business as well as a key contract that ended during the reporting year. However, our transport business experienced revenue growth of 6% compared to the prior year driven by improved trading in the mining and Fast-Moving Consumer Goods (FMCG) sectors, as well as new business that was secured. We
achieved an operating profit of R262 million for the year, a 160% improvement compared to the prior year.
We achieved a significant improvement against all our key performance indicators, including return on invested capital (ROIC), economic profit and free cash flow, demonstrating that the turnaround is yielding results. A critical part of the turnaround was to improve our asset efficiency. We achieved notable increases in profitability, while at the same time reducing our net operating assets by 26%.
During the reporting year, ongoing currency fluctuations, as well as recessionary growth forecasts and escalating fuel costs, placed pressure on customers and eroded margins across the industry.
MANAGING FOR VALUE HIGHLIGHTS
A reduction of SG&A costs
Successful integration of the Transport and SCM businesses
Reduction in operational costs and unlocking efficiencies to streamline operations
Consolidating procurement activities across the business with better win/win value exchange
A more customer responsive operational model and an optimised business portfolio
GRI 102-15
60 Barloworld LimitedIntegrated Report 2018

Divisional key performance indicatorsLogistics Southern Africa EMEA
Financial capital 2018 2017 2018 2017 2018 2017
Revenue (Rm) 5 924 6 171 5 807 6 011 117 160Operating profit/(loss) (Rm) 262 101 255 102 7 (1)Net operating assets (Rm) 1 538 2 082 1 445 1 970 1 093 112
Social capital
Employee headcount 4 395 4 780 4 305 4 671 90 109LTIFR† 0.85 0.77 0.85 0.78 0.96 0.00Work-related fatalities 0 3 0 3 0 0B-BBEE rating 2 2 2 2 N/A N/A
Natural capital
Petrol and diesel (ML) 57.73 58.49 57.67 58.44 0.06 0.05Grid electricity (MWh) 19 557 19 953 17 959 18 088 1 598 1 865Non-renewable energy (GJ) 2 269 827 2 300 034 2 261 923 2 291 740 7 904 8 294GHG emissions (tCO2e) (scope 1 and 2) 173 231 175 552 172 012 174 196 1 219 1 356Water withdrawals^ (ML) 138 152 134 148 4 4
† Lost-time injuries multiplied by 200 000 divided by total hours worked.^ Municipal sources.
Managing for value driving operational performance
Revenue (Rm)
7 000
5 000
2 500
0161718
5 7566 1715 924223
101
262
Revenue (Rm)
Operating pro�t (Rm)
300
200
100
0161718
3.9
1.6
4.4
Revenue (Rm)
Operating margin (%)
6
4
2
0161718
GRI 102-7
We set ourselves value-uplift targets, with the first step being the successful integration of the transport and supply chain management businesses following the buy-out of minorities in the transport business towards the end of 2017. Based on an in-depth assessment of the business, key levers were identified to deliver on the group’s managing for value principles. These were: – Fit-for-purpose SG&A costs – align SG&A costs with the size and profitability level of the business
– Optimal operational performance – improve the operational efficiency of the business
– Procurement rebates/savings – New lean, customer-focused operating model to support future growth
The positive outcomes of the operational and financial transformation plans have created a firm foundation for the business to pursue and consolidate the gains accrued, while redefining and repositioning the value proposition and growth beyond 2018.
61 Barloworld LimitedIntegrated Report 2018

Logistics
Looking forward
Given the prevailing macro-economic conditions, significant organic
growth is not anticipated
The operating environment over the next 12 months is expected to be challenging as the legislative environment continues to evolve
Customers will focus heavily on cost reduction, which may place pressure
on margins
Skills shortages will continue to burden the local supply chain
industry with challenges ranging from filling qualified artisanal
and driver roles to experienced non-technical skills
Industry
1
Continue to focus our efforts on consolidating the gains of the
turnaround strategy
Perform a further review of our portfolio to enhance and optimise
returns
Explore new markets to unlock high-value profit pools
Enhance our business models through the use of technology
Renew existing contracts with customers while maintaining margins
Relocating our corporate and business operations to a new
location in Irene, Pretoria
Business transformation focus
2
CompetitionLocal players are shifting business
and operating models, while international players are entering the
local market
The digitisation of supply chains lowers the barriers of entry to
technology companies and other non-traditional competitors
The 4th Industrial Revolution is expected to have a profound
effect on our customers in the next 36 months
This presents opportunities for supply chain and logistics where we
are investing in industry-leading digital solutions
This will enable co-creation and innovative partnerships with our
customers to derive differentiated value
Trends
3
Logistics plays a crucial role in the agriculture sector in South Africa, with opportunities to build viable, sustainable and collaborative route-to-market
solutions for emerging farmers
Partnering with government and parastatals in the mapping, planning, movement and delivery of critical resources to facilitate continuous supply in a manner that is
cost effective
The government’s efforts to resuscitate the rail transport system for goods as an alternative means to road freight transport offers another good opportunity
OPPORTUNITIES
62 Barloworld LimitedIntegrated Report 2018

63 Barloworld LimitedIntegrated Report 2018

Corporate centre
Managing for valueAs part of strengthening the group’s core capabilities to deliver on the new strategy, the role of the corporate centre has evolved to one of an active shareholder responsible for setting the agenda in managing the six capitals – intellectual; financial; manufactured; social and relationship; human and natural. We make trade-offs between these capitals during our strategic journey to ensure sustainable value creation for all our stakeholders. In the reporting period a great deal of focus was on driving corporate strategy – allocating resources, capital and talent across the group.
CORPORATE STRATEGY
HUMAN CAPITAL
FINANCIAL CAPITAL
Group-led strategy and planning
Driving mergers and acquisitions
Focus on priorities that move the needle
Agenda management
Talent management
Diversity and inclusion
Performance optimisation
Remuneration and reward
Setting financial performance standards
Allocation of capital
Measuring and monitoring performance
Optimal use of assets
This active operating model ensures delivery on the strategy by driving performance, setting management agenda, managerial and planning cycle, defining group-level priorities and activities that are value enhancing to the enterprise as a whole, core to the managing for value principles.
The roles and functions are in the process of being recalibrated and capacity engendered in order to support and drive consistent strategic execution and delivery. The corporate centre functions include human capital, strategy and M&A, sustainability, internal audit, group secretarial, investor relations, corporate communications, corporate finance, treasury, taxation, risk management, insurance, legal, empowerment and transformation.
GRI 102-15
64 Barloworld LimitedIntegrated Report 2018

Divisional key performance indicatorsCorporate Southern Africa UK
Financial capital 2018 2017 2018 2017 2018 2017
Revenue (Rm) 1 2 1 2 Operating loss (Rm) (133) (128) (74) (56) (59) (72)Net operating assets/(liabilities) (Rm) (1 159) (1 709) 580 553 (1 739) (2 262)
Social capital
Employee headcount 119 118LTIFR† 0.96 0.66Work-related fatalities 0 0B-BBEE rating 2 3
Natural capital
Petrol and diesel (ML) 0.01 0.01Grid electricity (MWh) 620 553Non-renewable energy (GJ) 2 735 2 127GHG emissions (tCO2e) (scope 1 and 2) 673 578Water withdrawals^ (ML) 2 2
† Lost-time injuries multiplied by 200 000 divided by total hours worked.^ Municipal sources.
Social and natural capitals for UK office are reported under Equipment Europe.
GRI 102-7
65 Barloworld LimitedIntegrated Report 2018

Value added highlights
Total value created
R19 434 million2017: R16 918 million
2
34
1
Value distribution
11%
11%
28%
50%
Capital providers
Governmentandcommunities
Retained for growthEmployees
20%
5%
13%
2017:
62%
1
2
3
4
R9 725 million2017: R9 948 million R5 478 million
2017: R3 479 million
R2 094 million2017: R1 350 million
R2 137 million2017: R2 141 million
GRI 201-1
66 Barloworld LimitedIntegrated Report 2018

Value added statementfor the year ended 30 September
A measure of the value created by the group by its diverse trading, distribution and other activities to the cost of products and services purchased. This statement shows the total value created and how it was distributed.
2018Rm %
2017Rm
Restated%
Revenue from continuing operations 63 420 61 959Revenue from discontinued operations 3 337 4 076Paid to suppliers for products and services 47 675 49 193***
Value added 19 082 16 842***Income from investments^ 352 76
Total value created 19 434 16 918***
Value distributionEmployees (note 1) 9 725 51 9 948 62 Capital providers: 2 137 11 2 141 13 Finance costs 1 184 1 338Dividends to Barloworld Limited shareholders 872 755Dividends to non-controlling interest in subsidiaries 81 48Government (note 2) 2 078 10 1 332*** 5 Communities (corporate social investment) 16 18Reinvested in the group to maintain and develop operations 5 478 28 3 479 20 Depreciation 2 505 2 589Retained profit 2 963 850Deferred taxation 10 40
19 434 100 16 918*** 100
Value added ratiosNumber of employees (30 September) 17 417 19 201Continued 17 417 18 085Discontinued 1 116Revenue per employee (Rand)# 3 646 142 3 302 823Value created per employee (Rand)# 1 055 537 824 326Corporate social investment – % of profit after taxation, excluding exceptional items 1% 1%
Notes1. EmployeesSalaries, wages, overtime payments, commissions,bonuses and allowances** 8 133 7 902Employer contributions+ 923 1 000
Total continuing operations 9 056 8 902Discontinued operations 669 1 046
Total group 9 725 9 948
2. Central and local governmentCurrent taxation 1 058 744Rates and taxes paid to local authorities 85 68Customs duties, import surcharges and excise taxes 879 469***Skills development levy 56 51
2 078 1 332***
^ Includes interest received, dividend income and share of associate companies’ and joint ventures’ retained profit.# Based on average number of employees.** Represents the gross amounts paid to employees including taxes payable by the employees.+ In respect of pension funds, retirement annuities, provident funds, medical aid and insurance.*** The customs duties, import surcharges and excise taxes disclosed for 2017 have been restated to R469 million (previously disclosed 2017: R41 million). This
has resulted in the total value created being restated to R16 918 million (previously disclosed R16 489 million).
GRI 201-1
67 Barloworld LimitedIntegrated Report 2018

Creating a high-performance culture
Strategic goal: Instil a high-performance culture
KEY FOCUS: OPTIMISE PERFORMANCE AND GROW OUR TALENT
Key initiatives in managing for value
– Design leadership competency framework for the group
– Develop a One Barloworld integrated talent management framework
– Refocus performance optimisation and people development
– Drive diversity and inclusion
– Align remuneration and reward philosophy
– Continue focus on health and safety
Key highlights
Indicator Our performance
Develop a leadership competency framework
Achieved:– The leadership competency framework was designed with reference
to international best practice and inputs from both internal and external stakeholders. Implementation will take place during the 2019 financial year
Develop a One Barloworld integrated talent management framework
Achieved:– The group’s integrated employee value model (IEVM) served as
the basis for developing a consistent framework for managing the group’s senior management talent. The framework includes enhanced performance optimisation processes and people development strategies which will be implemented during the 2019 financial year
Drive diversity and inclusion
– 76.02% black employees (2017: 73.75%)
– 37.89% black women employees within the identified top talent pool
(2017: 35.88%)
– 19.88% female employees within the identified top talent pool
(2017: 17.06%)
Enhance attraction and retention rates
– 18.19% total employee turnover ratio (2017: 21.69%)
– 10.62% voluntary employee turnover ratio (2017: 12.19%)
– 7.57% involuntary employee turnover ratio (2017: 9.50%)
Align remuneration and reward philosophy
Achieved:– The group’s remuneration philosophy and policy was reviewed to
ensure alignment with the group’s strategy. For more details, please refer to the remuneration report on pages 95 to 118
Develop our people A number of our employees benefited from the group’s various formal training and development programmes. For more details refer to page 70
GRI 401-1, 404-1, 404-2, 404-3, 405-1
68 Barloworld LimitedIntegrated Report 2018

High-performance culture driversDuring the reporting period our IEVM practices were prioritised and recalibrated to align to our strategy and its accompanying managing for value philosophy; with specific focus on the following employee value proposition and high-performance drivers:
Talent management
Diversity and inclusion
Performance optimisation
Reward and recognition
Know our talent position
Reward and recognise winning behaviour
and results
Optimise performance and growth
Understand the capacity of our talent to contribute
optimally now and in the future through our robust intellectual capital review
(ICRs) processes
Offer competitive financial and non-financial rewards that
include discretionary short-term incentives and long-term
incentives linked to shareholder value
creation
Contract and achieve gold performance standards while developing and growing our
people’s skills, knowledge and competencies
2 31
One Barloworld integrated talent management frameworkThe framework ensures that we equip our people for optimal performance by creating an environment
that nurtures the best talent through processes that enable us to:
This focus translated into our Integrated Talent Management framework, which aims to activate three drivers across the group and bring our employee value proposition to life, by aligning performance, development and
reward tightly to our bold ambition.
69 Barloworld LimitedIntegrated Report 2018

Creating a high-performance culture
Our principles for optimising performance and winning include:
3. Fair ratings – We use the
One Barloworld Going for Gold rating scale to evaluate performance
– We ensure ratings and scores are consistent,
unbiased and in line with business performance
Group ambition
1. High standards and results focusedWe start with the end in mind by referring to the
One Barloworld Going for Gold rating scale to set and direct focus on high standards of behaviour and
results aligned to business value contracts
2. Continuous feedback and improvement
We encourage and enable continuous and spontaneous
feedback, improvement, learning and development and understanding of performance
consequences
4. IntegrationPerformance scores are used as
input for various integrated talent management decisions to enable
reward, recognition, development, retention or termination where performance
is consistently below expected standards.
People development
Development programmes2017/2018
beneficiaries
Young talent pipeline programmes
Apprenticeships/learnerships 1 632
Internships/graduate programmes
110
Chartered accountant trainees
12
Management and leadership development programmes
Executive development programmes
16
Leadership development programmes
912
Tertiary education support
External bursars (including BET bursars)
77
Employee study support 140
70% On-the-job development
20% Mentoring and coaching
10% Formal learning
Our approach to future talent development varies according to the needs of the organisation and each individual
Other solutions we are working on aim to enhance the on-boarding experience, improve job performance, build capacity for future roles and enhance the exit experience.
DEVELOP THE LEADERSHIP BRAND THROUGH THE LEADERSHIP COMPETENCY FRAMEWORK
We have completed the design phase of the leadership competency framework. This is an important milestone as the framework will be our reference for ensuring that we develop and grow leaders that have the competencies required to lead teams that win as one. The
next phase will be the implementation and embedding of the framework across the group.
70 Barloworld LimitedIntegrated Report 2018

Diversity and inclusionWhile significant progress has been made in transformation, it remains a key focus area for Barloworld and continues to be integral to our success in all areas where we operate.
The central tenets of our approach to equality:
Prohibition of unfair discrimination on the grounds of gender, race, religion, disability, age or sexual orientation
Proactive pursuit of programmes and initiatives to achieve our equality objectives
Compliance with legislation in all countries in which we operate
Identification and elimination of employment barriers which unfairly discriminate
In South Africa, race, gender and disability are included in our employment equity targets, in line with the Department of Trade and Industry’s (dti) Broad-Based Black Economic Empowerment (B-BBEE) scorecard requirements with the target for all South African operations to achieve a level 4 or better. In our non-South African operations, localisation and gender objectives are set in accordance with local demographics and legislation.
GenderWe are making progress against this objective in 2018. Specialised programmes such as our women in leadership development programme and women behind the wheel are aimed at the inclusion and participation of women in key roles of the business across the group.
Total female employees New female hires
Female middle management
Female senior management Female executives
28.44% 782 39.21% 28.79% 34.88%2017: 28.12% 2017: 945 2017: 36.59% 2017: 27.59% 2017: 21.95%
Broad-based Black Economic Empowerment (B-BBEE)In our South African operations, we align to the EAP in the composition of our staff in terms of the number of African, Indian and Coloured (AIC) employees.
■ Board ■ Executive■ Middle management
■ Senior management■ Skilled upper
■ Semi-skilled/apprentices/trainees ■ Labour/unskilled
Employees by ethnic background
5 000
4 000
3 000
2 000
1 000
0White Foreign nationalsAIC
4013 01210 817
1 15 4576
74
764
4 66
056
5
1 20 7188
6 1 80
223
02 0 6 2 15 62 29
917
SA business units’ B-BBEE level
17 1618
1
3 3*
2 2
3 3*
2
3
2
33
2
3
1
2
3 3 3*
2
3* 3 3 3
■ Equipment ■ Car Rental ■ Avis Fleet ■ Motor Retail*■ Logistics ■ Corporate of�ce ■ Barloworld South Africa■ Barloworld Limited
* Ratings under Barloworld South Africa.
4
3
2
1
0
Targeting
40% female
representation
at all levels
by 2020
71 Barloworld LimitedIntegrated Report 2018

Creating a high-performance culture
Localisation of employmentWe seek to obtain skills, create jobs and develop talent in the countries we operate in, reducing the number of expatriates in the workforces of our international operations.
Health and safety
WE REGRETTABLY HAD TWO WORK-RELATED FATALITIES DURING THE
YEAR, ONE IN EQUIPMENT RUSSIA AND ANOTHER IN AUTOMOTIVE
We extend our sincere condolences to the bereaved families to whom we have offered
support. We continue to drive the awareness of health and safety in the workplace; and to
maintain non-hazardous working environments for our people
Group lost-time injury frequency rate*
18
17
16
0.69
0.75
0.75
* LTIFR = Lost-time injuries multiplied by 200 000 divided by total hours
worked.
HIV statistics* (South Africa only)
Employees who know their status (%)
18
17
16
89
72
86
Employees tested who are HIV positive (%)
18
17
16
6
5
5
* Three-year cumulative figures.
TO MINIMISE THE IMPACT OF THE DISEASE OUR AWARENESS, COACHING AND LIFESTYLE INTERVENTIONS FOCUS ON:
– Prevention of new infection– Provision of voluntary counselling and testing
– Provision of appropriate care and treatment for people living with HIV/Aids
– Protection against discrimination and victimisation in the workplace
Looking forward
Change management We will continue aligning our people around the One Barloworld ambition and over the next 18 to 24 months, with consideration to embedding new culture principles and practices, calibrating and evolving change communication throughout the process, both at group and at divisional level
Leadership competency framework
We have developed our leadership competence framework, which will set the tone for the competencies and standards of behaviour required from all leaders
The competencies will be incorporated into key human capital value chain processes as part of the implementation which will take place over the next 24 months
This will enable us to improve the effectiveness of human capital processes and leadership development so that we can sustainably grow the people capacity required to achieve our bold ambition
Metrics that will be added to measure our progress include leadership brand value and a succession bench-strength index
Employee engagement and productivity measurement
We will be reviewing our people engagement measurement tools to align to the principles of our high-performance culture
Remuneration practices More work is required to align remuneration practices across the group and at the various operating levels to effect the principles of our revised remuneration and reward philosophy. We will continue to review both our financial and non-financial reward offerings and we are committed to fair and responsible pay practices
GRI 202-2, 403-2, 403-3 www Barloworld LTIFR approach Barloworld policy on HIV/AIDSwww
72 Barloworld LimitedIntegrated Report 2018

Women behind the wheel of the transport industryWhen considering the individual behind the wheel of a truck, the assumption is often that the person opted for this career out of necessity, rather than choice. It is hardly considered a calling or a career, and truck drivers tend to occupy a clear stereotype in the minds of the public.
It is for this reason that the story of 18-year-old Amanda Mathebula is so refreshing. She has a passion for driving, and after matriculating, signed up for a National Certificate in Professional Driving with the Barloworld Logistics Academy. She recently obtained her Code 14 licence on her first attempt and is due to complete the first of a three-year school partnership programme which covers both professional driving and transport operations management.
Barloworld is committed to developing our talent and seeing our drivers progress through the ranks. We identified a gap for talented professional female drivers and embarked on an industry-first female-focused driver development programme. Since inception, the programme has seen over 100 graduates, of which 90% have been retained in various businesses in Barloworld Logistics.
Barloworld Equipment recognised for empowering womenAs a patriotic and responsible corporate citizen, Barloworld Equipment’s (BWE) gender equity strategy is inspired by the South African Constitution and the Employment Equity Act. We wholeheartedly believe in the principles of promoting fairness and equality in our company as we work towards building a gender representative organisation.
We are implementing a robust human capital and recruitment strategy that ensures that Barloworld Equipment does not only go beyond compliance with the Employment Equity Act, but also helps us build a profitable women-friendly company. Numerous studies done around the world indicate that there is a compelling correlation between gender-balanced companies and strong financial performance. As an organisation, we are committed to tapping the potential of our female colleagues to grow our business.
Even though our country has not yet set numerical employment equity (EE) targets for various sectors of our economy, we took a decision to implement a 40/20 strategy which aims to boost women representation in our workforce to 40% across all senior levels of our company by 2020. This, we believe, is the right thing to do in normalising South Africa and for us to become a high-performing company.
As a member of the 30% Club in South Africa, we entered the PwC/Business Engage Gender Mainstreaming Awards. The categories we entered were: Investing in Young Women where we showcased our participation in the Techno Girls programme – we achieved third place; Economic Empowerment, where we showcased BWE’s female contribution to Barloworld’s Siyakhula programme – we achieved second place; we entered the BWE Executive commitment to women leadership into the Women on Boards category and came first. Finally, our Women Leadership Development Programme enabled us to enter the Women Empowerment in the Workplace category where we also achieved first place. These awards meant that we were also named the 2018 Gender Mainstreaming Champions.
73 Barloworld LimitedIntegrated Report 2018

Licence to operate
74 Barloworld LimitedIntegrated Report 2018

75 Barloworld LimitedIntegrated Report 2018

Transformation
Intent Actions
Enable our strategic goals: Drive business practices that enhance our social equity and limit our environmental footprint
Improve our environmental performance against our 2020 aspirational targets
Develop and implement meaningful interventions that transform our society
Invest in initiatives that drive social cohesion and build resilient communities
Barloworld acknowledges transformation as an economic imperative. We recognise the role we can play to bring about meaningful change in the societies where we operate.
Barloworld made steady progress on issues of management and control, ensuring we are representative of the societies in which we operate. Our development programmes focus on providing meaningful interventions that aim to improve technical capability and capacity, as well as delivery and cost capabilities. We seek to nurture diversity in our supply chain while ensuring we create platforms for development and innovative solutions.
Enterprise development Founded in 2007, Siyakhula is our primary vehicle for supplier and enterprise development for our South Africa operations. Through comprehensive support programmes aimed at empowering small, micro and medium-sized enterprises (SMMEs), Siyakhula promotes B-BBEE, not only within Barloworld, but the broader South African society. Since inception, Siyakhula has invested accumulative spend of over R250 million with assistance provided to 120 SMMEs, indirectly sustaining over 700 jobs. For more information: http://www.barloworldsiyakhula.com
LocalisationIn 2017, we reported on developing black-owned engineering firms in the areas of manufacturing, and repair of parts and components for earthmoving equipment. We identified enterprises with capabilities in steel fabrication, milling, machining and grinding that would benefit from inclusion in the Siyakhula enterprise and supplier development programme. We also considered companies providing engineering services including design, repair and installation of earthmoving equipment.
In the past year, Barloworld Equipment, through our Siyakhula programme, incubated seven businesses. We aim to grow these businesses into mature and independent manufacturing entities with capacity to supply Caterpillar components. To date, some of the successes in the programme include: – Lucient Engineering and Construction (Pty) Ltd provides engineering maintenance services to Barloworld Equipment’s extended mining product range (EMPR) division and recently started operations in the Mpumalanga province. The company employs 200 people, and conducted over 80 dragline services and accomplished more than four planned maintenance sessions in the last 10 months.
Our performance in 2018
Available points
2018 score
2017 score
Ownership 25 24.64 24.64Management control 19 12.44 12.98Enterprise and supplier development (ESD) 40 30.1 28.69Skills development 20 18.41 20.08Socio-economic development 5 5 5Total score 109 90.58 91.39B-BBEE level 3 3
– B Engineering (Pty) Ltd specialises in precision engineering and is based in Johannesburg. The company received support to acquire machining centres and lathes, and recently secured an order from Caterpillar to supply edge cutting components.
– Phumzile Engineering Services & Supplies (Pty) Ltd is a female-owned engineering company based in Polokwane. The company received training at Caterpillar’s Qingzhou factory in China and has subsequently been appointed as secondary dealer for Caterpillar SEM equipment in the Limpopo province.
Other beneficiaries in the programme are engaging with the Barloworld Equipment and Caterpillar procurement teams for opportunities to supply components and services. We are encouraged by the progress and commitment to transform the value chain.
Skills developmentBarloworld recognises that skills development in the form of learnerships, courses and workplace training can provide meaningful opportunities for people to gain access to the workforce. During the reporting year, we established a skills development forum to coordinate and align efforts to enhance and fast track skills development initiatives. Some of our skills development initiatives were also recognised through industry rewards. These included: – Barloworld Equipment won the South African Graduate Employers Association (SAGEA) silver award for the Best Integrated Campaign for its graduate development programme
– Barloworld Equipment was recognised at the Gender Mainstreaming Awards for its investment in young women
– Barloworld Logistics won a Canadian Award for its driver employee engagement programme
GRI 202-2
76 Barloworld LimitedIntegrated Report 2018

GRI 413-1
Communities
Barloworld strives to make a difference by enabling growth and progress, through strategic socio-economic development programmes. We view our social investment as an investment in the future, inspiring a world of difference by building resilient communities.
Our performance in 2018
Area EducationYouth development and empowerment Health and welfare Environment
% of expenditure 55% 14% 22% 9%
Description Programmes that focus on access to quality basic education with an emphasis on improving science, technology, engineering and mathematics (STEM) subjects at high school level, as well as teacher development programmes
Programmes that focus on youth leadership skills development, as well as social entrepreneurship programmes that resolve local community challenges
Initiatives that focus on access to basic healthcare services as well as improved life expectancy
Programmes that increase awareness of climate change and conservation
Description – Bridge – Leap Science and Maths Schools
– Penreach – Infinity
– Enactus SA
– President’s Award for Youth Empowerment
– Rural Education Access Programme
– Teach SA
– Nelson Mandela Children’s Hospital
– Habitat for Humanity
– Rise Against Hunger
– Child Cancer Foundation
– Chris Hani Baragwanath Hospital
– National Business Initiative
– WWF SA
OVERALL CSI INVESTMENT R16 MILLION (2017: R18 MILLION)
Over 600 employee volunteers
Six houses built in Lawley township
Mobile library donated to Lawley Secondary
EMPLOYEE VOLUNTEERISM IN LAWLEY TOWNSHIP
77 Barloworld LimitedIntegrated Report 2018
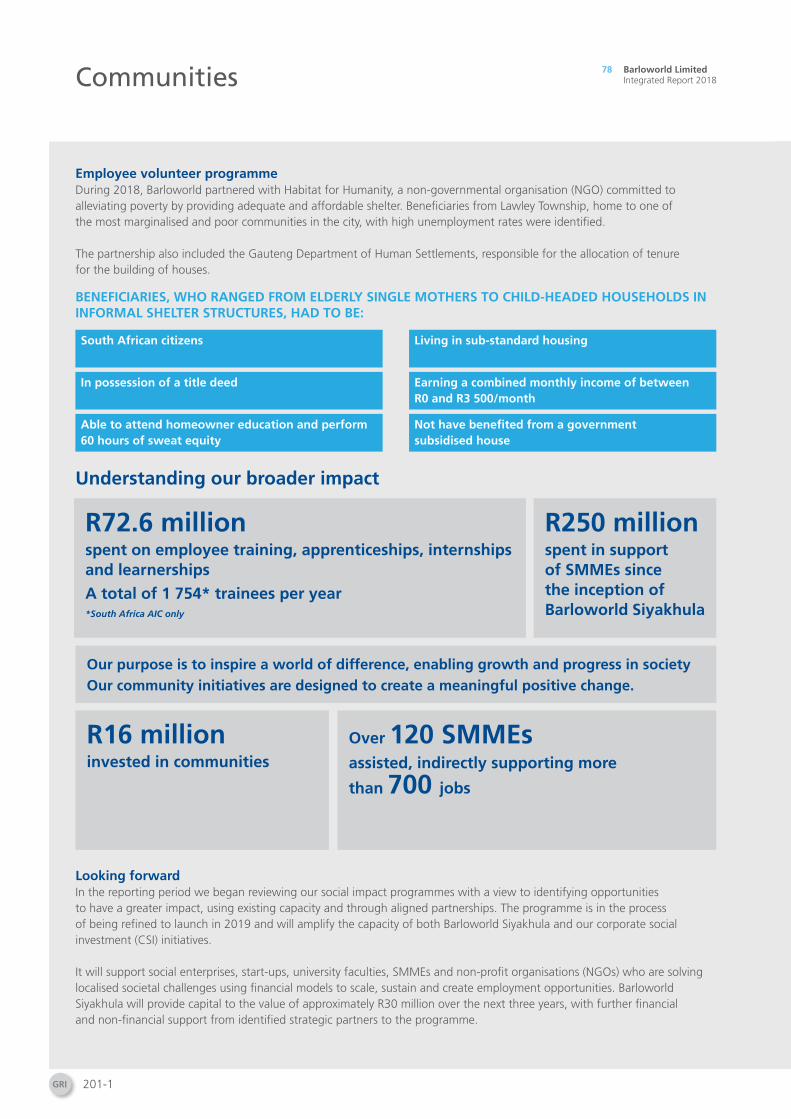
Communities
Employee volunteer programmeDuring 2018, Barloworld partnered with Habitat for Humanity, a non-governmental organisation (NGO) committed to alleviating poverty by providing adequate and affordable shelter. Beneficiaries from Lawley Township, home to one of the most marginalised and poor communities in the city, with high unemployment rates were identified.
The partnership also included the Gauteng Department of Human Settlements, responsible for the allocation of tenure for the building of houses.
BENEFICIARIES, WHO RANGED FROM ELDERLY SINGLE MOTHERS TO CHILD-HEADED HOUSEHOLDS IN INFORMAL SHELTER STRUCTURES, HAD TO BE:
South African citizens Living in sub-standard housing
In possession of a title deed Earning a combined monthly income of between R0 and R3 500/month
Able to attend homeowner education and perform 60 hours of sweat equity
Not have benefited from a government subsidised house
Understanding our broader impact
Looking forwardIn the reporting period we began reviewing our social impact programmes with a view to identifying opportunities to have a greater impact, using existing capacity and through aligned partnerships. The programme is in the process of being refined to launch in 2019 and will amplify the capacity of both Barloworld Siyakhula and our corporate social investment (CSI) initiatives.
It will support social enterprises, start-ups, university faculties, SMMEs and non-profit organisations (NGOs) who are solving localised societal challenges using financial models to scale, sustain and create employment opportunities. Barloworld Siyakhula will provide capital to the value of approximately R30 million over the next three years, with further financial and non-financial support from identified strategic partners to the programme.
R72.6 millionspent on employee training, apprenticeships, internships and learnerships
A total of 1 754* trainees per year*South Africa AIC only
R250 millionspent in support of SMMEs since the inception of Barloworld Siyakhula
Our purpose is to inspire a world of difference, enabling growth and progress in societyOur community initiatives are designed to create a meaningful positive change.
R16 millioninvested in communities
Over 120 SMMEs assisted, indirectly supporting more
than 700 jobs
GRI 201-1
78 Barloworld LimitedIntegrated Report 2018

Environmental stewardship
Our approach to environmental stewardship is reflected in our group policies, including the climate change, energy efficiency, environmental, water use and management and waste management policies. The material aspects of our environmental impact and critical areas of monitoring and management include:
Energy consumption Greenhouse gas (GHG) emissions
Water use Waste management
Our approach
UNDERSCORING OUR COMMITMENT TO ENVIRONMENTAL STEWARDSHIP
Barloworld’s Worldwide Code of Conduct and Code of Ethics support the group’s commitment to the environment and sustainable development. These inform employees’ individual and collective behaviour: ‘Sustainability’ is one of the group’s five core values,
and ‘Protect the Environment’ is one of the five aspects of our Code of Ethics.
Governance and oversight
The group and divisional risk and sustainability sub-committees oversee our aspirations, performance and governance processes. Material Safety, Health and Environmental (SHE) related disclosures are also tabled at the group audit committee biannually, and similar governance processes are undertaken at divisional level by various oversight committees. Reporting and control processes are in place and reviewed periodically throughout the year by internal audit and external assurance is conducted on selected sustainability disclosures.
2018 RECOGNITION
Environmentalstewardship
OurapproachtoenvironmentalstewardshipOurapproachtoenvironmentalstewardshipisreflectedinourgrouppolicies,includingtheclimate change, energy efficiency, environmental, water use and management and wastemanagementpolicies.Thematerialaspectsofourenvironmentalimpactandcriticalareasofmonitoringandmanagementinclude:
- Energy consumption - Greenhouse gas (GHG) emissions - Water stewardship - Waste management
Underscor ing our commitment to environmental s tewardship: Barloworld’s Worldwide Code of Conduct and Code of Ethics supports the group’s commitment to the environment and sustainable development. These inform employees’ individual and collective behaviour: ‘Sustainability’ is one of the group’s five core Values, and ‘Protect the Environment’ is one of the five aspects of our Code of Ethics. For more information, please refer: https://www.barloworld.com/sustainability/worldwide-code/ ; and https://www.barloworld.com/sustainability/code-of-ethics/
Recognit ion
Governance and oversight The group and divisional risk and sustainability sub-committees oversee our aspirations, performance and governance processes. Material SHE related disclosures are tabled at the group audit committee biannually, and similar governance processes are undertaken at divisional level by various oversight committees. Reporting and control processes are in place and reviewed periodically throughout the year by Barloworld Group Internal Audit Services, and external assurance is conducted on selected sustainability disclosures by our financial assurance provider.
GRI 102-10, 301 to 308
www External certifications and accreditations coverage 2018
www Barloworld Worldwide Code of Conduct and Code of Ethics
www Barloworld 2018 CDP climate change and CDP water disclosure responses
wwwBarloworld environmental, energy efficiency, climate change, waste management, water use and management policies
79 Barloworld LimitedIntegrated Report 2018

Environmental stewardship
Material aspect Aspirational group 2020 target
Energy consumption We aim to:
Improve our non-renewable energy efficiency by 10%, off a 2015 baseline (48.2), to 43.4
Measure:
Non-renewable energy intensity (GJ/R1m revenue)
We aim to have:
2 000 MWh or more renewable energy consumption per annum
Measure:
Renewable energy consumption (MWh)
GHG emissions We aim to:
Improve our greenhouse gas emissions (scope 1 and 2) efficiency by 10%, off a 2015 baseline (4.3), to 3.9
Measure:
GHG emissions (scope 1 and 2) intensity (tCO2e/R1m revenue)
Water use We aim to:
Improve our water withdrawal (municipal sources) efficiency by 10%, off a 2015 baseline (12.0), to 10.8
Measure:
Water withdrawal (municipal sources) intensity (KL/R1m revenue)
Waste management We aim to have:
100% of our waste disposed of through formal waste management service providers
Measure:
Percentage of waste disposed of through formal waste management service providers (%)
Our aspirational group 2020 targets
In order to drive our commitments, aspirational five-year targets were set in 2016 for each identified material aspect. These targets assist in prioritising internal resources towards initiatives that contribute to responsible environmental stewardship and are off a 2015 baseline. While progress against targets may not be linear over the target period, reporting systems are in place that enable the collection and reporting of credible data, allowing for effective monitoring, management and oversight.
80 Barloworld LimitedIntegrated Report 2018

2018 performance and progress against targets
120%
110%
100%
90%
80%
70%
60%
50%
40%
30%
20%
10%0%
Non-renewableenergy intensity*
(GJ/R1 million revenue)
Waste disposed of through formal waste management
service providers – solid waste (%)
Emissions intensity(Scope 1 and 2)
(tCO2e/R1 million revenue)
Water withdrawalintensity
(KL/R1 million revenue)
Renewableenergy
consumption(MWh)
Waste disposed ofthrough formal
waste managementservice providers
– liquid waste (%)
* Excludes energy from rental �eets.
93%
48%
100%
99%
114%
95%
While the aspirational group targets are set to the end of our 2020 financial period, we currently monitor and manage our progress.
The above diagram details progress against the set group targets, which cover each of the identified material sustainability aspects.
2020 Target
2018 Actual
2017 Actual
2016 Actual
PROGRESS AGAINST ASPIRATIONAL GROUP 2020 TARGETS
81 Barloworld LimitedIntegrated Report 2018

Environmental stewardship
Renewable and non-renewable energy To reduce our footprint and manage our energy use we follow a measure, avoid, reduce, switch and offset (MARSO) approach, which addresses our responsible citizenship programme, increasing energy cost and supply challenges. Our operations have generally progressed to the ‘reduce’ and the ‘switch’ phases, with a concerted drive to reduce non-renewable energy consumption and a linked effort to switch to renewable energy sources. This year, we continued our implementation of solar photovoltaic (PV) solutions, with these solutions generating
approximately 950 MWh of renewable energy. Further installations are anticipated in the group and PV also forms part of our product offerings.
Our non-renewable energy intensity improved over the prior year, and we are making steady progress towards our 2020 aspirational target. Having optimised their energy efficiency, Equipment Isando and Boksburg Power facilities have incorporated renewable energy into their energy mix, and similar installations are planned for identified operations. Such installations reduce demand for fossil fuel energy and positively
contribute to Barloworld reducing its non-renewable energy and emissions footprint. Implemented energy efficiency initiatives contributed to the 5% decrease in non-renewable energy consumption during 2018.
Revenue (Rm)
Renewable energy (MWh)
17 16182020Target
51090
950
2 000
Greenhouse gas emissions(Scope 1 and 2) (tCO2e)
■ Scope 1: diesel ■ Scope 1: petrol■ Scope 1: other (LPG, CNG)■ Scope 2: grid electricity■ Emissions intensity (tCO2e/R1 million revenue)● 2020 emissions intensity
(tCO2e/R1 million revenue) target
17 16182020 Target
3.9
4.44.3
4.1
8%6%
28%
65%
1%28%
64%
7%1%
28%
63%
1%
257 650 270 707 266 769
Non-renewable energy*(GJ)
■ Direct: diesel■ Direct: petrol■ Direct: other (LPG, CNG)■ Indirect: grid electricity■ Non-renewable energy intensity
(GJ/R1 million revenue)● 2020 non-renewable energy intensity
(GJ/R1 million revenue) target
17 16182020 Target
9%
8%1% 1%
10%82%
9%
9%81%
9%1%
80%
46.5
3 037 0343 087 2692 947 696
49.848.9
●
43.4
* Excludes energy from rental fleets.
82 Barloworld LimitedIntegrated Report 2018

Looking forwardWe will continue our initiatives to improve efficiencies in non-renewable energy consumption, greenhouse gas emissions and water withdrawals; and progress renewable energy installations and responsible waste management. Progress against our aspirational group 2020 targets will be reported to our stakeholders. Synergies and opportunities presented by our rebuild and remanufacture operations, and our solar PV offering will be leveraged and incorporated into our customer solutions where appropriate.
Greenhouse gas emissions We strive to reduce our greenhouse gas (GHG) emissions which primarily result from the combustion of non-renewable liquid fuels, such as diesel and petrol, and also indirectly through the purchase of grid electricity.
Since our GHG emissions are linked to non-renewable energy consumption, emissions (scope 1 and 2) decreased by 5% aligned to the decrease in such consumption during 2018. Our emissions (scope 1 and 2) intensity improved over the prior year, and we are making steady progress towards our 2020 aspirational target.
We report certain scope 3 emissions. These cover emissions from our Avis Budget South African rental fleet and business air travel, both of which decreased during the year.
Greenhouse gasemissions (Scope 3)(tCO2e)
161718
■ Business air travel■ Car rental (South Africa)
95%
5% 6%
94% 94%
115 272 120 453 111 847
6%
Water Although we are a limited consumer of water, we recognise global concern over water scarcity. While we have achieved our aspirational group 2020 target, we continue to explore initiatives, such as water recycling and rainwater harvesting to further improve efficiencies. We withdraw the majority of our water from municipal sources. Water withdrawals from municipal sources decreased by 13% during 2018. Overall, 25.3% (2017: 24.8%) of water withdrawn was recycled.
Water withdrawals (ML^)
■ Water withdrawal^ intensity (KL/R1 million revenue)
● 2020 water withdrawal^ intensity(KL/R1 million revenue) target
17 1618
674 755588
10.8 10.9 12.29.3
2020 Target
^ Municipal sources.
Water recycling* (%)
161718
17.6
24.825.3
* Water recycled as a percentage of water withdrawn from municipal sources.
Waste management Due to the nature of our business, we do not generate significant volumes of waste. Paper, tyres and oil filters constitute the majority of our solid waste, while our liquid waste primarily comprises lubricants. Our aspirational group 2020 target is to have 100% of our waste disposed of through formal waste management service providers. Currently, the majority of our waste is disposed of through formal contractors.
2020 Target
Waste disposed ofthrough formalwaste management service providers (%)
1617
94
100
979999
100100●
18
18
■ Solid waste ■ Liquid waste
Our waste management systems currently monitor waste type, volume, disposal method and destination. We aim to continuously evolve and improve these systems.
83 Barloworld LimitedIntegrated Report 2018

Governance and remuneration
84 Barloworld LimitedIntegrated Report 2018

Governance review
Barloworld is committed to the highest standards of governance. We believe that excellent corporate governance is key to ensuring we deliver value to our stakeholders, building trust and enhancing our reputation.
King Report on Corporate Governance for South Africa 2016 (King IV)King IV is a principle and outcomes-based approach to corporate governance.
Barloworld embraces the principles and outcomes of King IV. During the year, work was performed to embed the principles of King IV into our business. We are materially compliant with King IV, and a statement on our application of the principles of King IV is available on www.barloworld.com.
Outcomes of King IV
Ethical culture
Effective control
LegitimacyGood
performance
www
Ethical leadershipWe are committed to doing business ethically while also building a sustainable company that recognises the short- and long-term impact of its activities on the economy, society and the environment. We believe ethical leadership is the foundation upon which we create value for our stakeholders.
The board provides effective leadership based on a principled foundation and is ultimately responsible for the company’s ethics performance. Executive management is, in turn, responsible for setting up a well-designed and properly implemented ethics management process.
The group is governed by the Barloworld Worldwide Code of Conduct and Code of Ethics. The Code of Ethics requires Barloworld directors, management and employees to obey the law, to respect others, to be fair, honest and to protect the environment. The Worldwide Code of Conduct articulates Barloworld’s commitment to doing business the right way, according to best practices, guided by our values.
Our ethics and compliance programme is designed to further entrench and integrate good corporate governance throughout the group. We continue to perform assessments of ethical risks and opportunities and integrate these into the risk management processes.
Our governance frameworkOur governance framework supports our value creation process and enables the delivery of our vision. The board ensures that there are the necessary committee structures, including the executive committee, empowered with clear terms of reference that assist the board in discharging its responsibilities.
Board
Shareholders
Chief executive
Subsidiary boards/divisions, functional unit committee and forumsExecutive committee
General purpose
committee
Nominations committee
Audit committee
Risk and sustainability
committee
Social, ethics and
transformation committee
Remuneration committee
GRI 102-18 to 102-39
85 Barloworld LimitedIntegrated Report 2018

Governance review
CompositionDesignation
Executive Independent non-executive Non-executive
3 10 10
Tenure
0 – 3 years 4 – 6 years >7 years
6 2 5
Nationality
South African International
10 3
Race
Black White
9 4
Gender
Female Male
6 7
Age
46 – 50 51 – 55 56 – 60 >60
1 3 3 6
Skills and experienceThe board’s diverse backgrounds ensure a wide range of skills and experience to make judgements, independent of management, on areas such as strategy, performance, business development, transformation, diversity, ethics and environmental management. These include: – Social development – Finance – Legal – Mergers and acquisitions – Strategy – Risk – Corporate governance – Technology
Board of directorsRole and function of the boardThe board steers and sets the direction of the group and brings independent judgement and leadership to material decisions, while ensuring strategy, risk, performance and sustainable development considerations are integrated into decision-making and appropriately balanced.
The board functions in accordance with the requirements of King IV and within the context of the Companies Act, the Listings Requirements of the JSE Limited and other applicable laws, rules and codes of governance. The board is responsible for, among other things, the governance of risk and information technology, and has ensured that the company has an effective, independent audit committee and an effective risk-based internal audit function. The board is satisfied that it fulfilled all its duties and obligations in the 2018 financial year.
Composition of the boardConsiderable thought is given to board balance and composition. Collectively, the board believes the current mix of knowledge, skill and experience meets the requirements to lead the company effectively.
There is clear balance of power and authority at board of directors level and no one director has unfettered powers of decision making.
The board has evaluated the rationale and meaning of the requirements of independence of directors in accordance with King IV. An assessment of the factors and circumstances of each non-executive director is performed annually. The independence of non-executives who have served on the board for longer than nine years is also assessed annually. The board is satisfied that all of the non-executive directors are independent.
GRI 405-1
86 Barloworld LimitedIntegrated Report 2018

Chairman and chief executive (CE)The roles of the chairman and CE are clearly differentiated.
Chairman Responsible for leading the board, ensuring its effectiveness and setting its agenda.
CE Leads the executive team in running the business, developing strategy and coordinating proposals for consideration by the board.
Board appointment processBarloworld has a rigorous and transparent policy regarding the appointment of directors to the board.
Nominations committee Board Shareholders
Proposes directors to the board for consideration on the basis of skills, knowledge and experience, and taking into account gender and race diversity appropriate to the needs of the company.
Considers the recommendations of the nominations committee before making an appointment.
All newly appointed directors are subject to ratification at the next annual general meeting of shareholders following their appointment.
Succession planningBarloworld is committed to forward-thinking succession planning to ensure stability within the leadership. The board ensures that it has robust succession plans that recognise the businesses’ current and future needs, taking into account the group’s strategy. Ms Sibongile Susan Mkhabela and Mr Oupa Isaac Shongwe will retire from the board at the 2019 annual general meeting (AGM). Following due process, the board identified Ms Neo Mokhosi and Mr Hugh Molotsi as independent non-executive directors, and will seek ratification from the shareholders for their appointment at the 2019 AGM.
Director developmentThe development of industry and group knowledge is a continuous process. Directors are briefed on legal developments and changes in the risk and general business environment on an ongoing basis. We inform newly appointed directors of Barloworld’s business as well as their own duties and responsibilities as directors.
Directors are able to seek independent professional advice concerning the company’s affairs should they require.
Board evaluationTo assess the board’s effectiveness and that of its committees, we conduct an external and internal board evaluation every two years. Due to the appointment of several new non-executive directors during 2017, and changes expected to be ratified at the 2019 AGM, we opted to postpone our external board evaluation to 2019 to allow sufficient time for changes to become embedded and to enable a more effective and meaningful evaluation.
87 Barloworld LimitedIntegrated Report 2018

Governance review
In accordance with the JSE Listings Requirements, the board has considered and satisfied itself that
Finance directorDon Wilson has appropriate expertise and experience to meet the responsibilities of his appointed position.
The board has also considered and satisfied itself of the appropriateness of the expertise and adequacy of resources of the finance function.
Company secretaryThe experience and competence of the company secretary was appropriate. Ms Lerato Manaka was the company secretary for 11 months of the 2018 financial year, while Ms Andiswa Ndoni was appointed on 1 September 2018 and is the group's current company secretary.
Furthermore, she is neither a director nor a public officer of the company or any of its subsidiaries.
Board and committee meetings attendance
CommitteesLength of service Board Audit GPC Nomco Remco R&S SETC
Non-executive directors
Dumisa Buhle Ntsebeza (Chair) 19 years 6/6 n/a 6/6 5/5 5/5 n/a 5/5Neo Phakama Dongwana 6 years 6/6 n/a n/a 5/5 5/5 6/6 5/5Ngozi Frances Oluwatoyin Edozien
5 years 5/6 6/6 4/6* n/a n/a n/a n/a
Hester Hickey 2 years 6/6 4/6* n/a n/a n/a 6/6 n/aMichael Lynch-Bell 2 years 5/6 6/6 n/a n/a n/a 6/6 5/5 Sibongile Susan Mkhabela 13 years 5/6 n/a n/a 4/5 n/a n/a 5/5Sango Siviwe Ntsaluba 10 years 5/6 6/6 5/6 n/a 4/5 6/6 n/aPeter Schmid 2 years 5/6 n/a 5/6 n/a 5/5 n/a n/aOupa Isaac Shongwe 12 years 6/6 n/a 6/6 5/5 5/5 n/a n/aNomavuso Patience Mnxasana 1 years 6/6 6/6 n/a n/a n/a n/a n/a
Executive directors
Dominic Malentsha Sewela 4.6 years 6/6 n/a 6/6 n/a n/a 6/6 5/5Donald Gert Wilson 12 years 6/6 n/a n/a n/a n/a 6/6 n/aOlufunke Ighodaro
* Appointed on 15 November 2017.
88 Barloworld LimitedIntegrated Report 2018

Board and committees’ responsibilities
Board – Reviewed and approved the group strategy – Adopted a term limit policy for non-executive directors prescribing the term limit as nine years of service or 70 years of age, whichever is the earlier, however, non-executive directors who have served beyond the term limits at the time of approval of the policy will continue to serve until they retire by rotation
– Exercised independent, informed and effective judgement on material decisions of the company and group companies
Audit – Assisted the board in its responsibilities, covering the internal and external audit processes for the group, considering the significant risks, the adequacy and functioning of the group’s internal controls and the integrity of financial reporting. (For more details on the responsibilities of the audit committee refer to the audit committee report included in the 2018 financial statements on pages 11 to 14.)
General purpose – Reviewed significant transactions and legal matters, including matters of a strategic nature
Nominations – Provided advice and guidance on succession planning, director appointments and director induction and training
Remuneration – Advised and provided guidance to the board on director remuneration, setting and implementing remuneration policy, approval of general composition of remuneration packages and criteria for executive bonus and incentive awards and administration, refer to the remuneration report on pages 95 to 118.)
Risk and sustainability – Set the group risk culture, appetite, framework, policies and strategy and ensured that robust risk management processes are in place
– Addressed sustainable development in the company including climate change and environmental stewardship
Social, ethics and transformation
– Assisted the group in discharging its social, ethics and transformation responsibilities and implementing practices consistent with good corporate citizenship. (For more details on the responsibilities of the social, ethics and transformation committee, refer to the chairman’s report from pages 14 to 17.)
For more details on the responsibilities, powers, policies, practices and processes of the board, directors and committees, refer to the board charter and committee terms of reference, as well as the company’s Memorandum of Incorporation, on our website, www.barloworld.com.www
89 Barloworld LimitedIntegrated Report 2018

Board committee
Non-executive directorsExecutive directors
Chief executive Qualifications: BSc Chemical EngineeringProfile: Dominic rejoined Barloworld in 2007 as chief executive officer to the Equipment division South Africa. In 2014 he was promoted to chief operating officer of Barloworld Equipment Southern Africa and thereafter chief executive officer of Barloworld Equipment Southern Africa. He joined the board on 19 March 2014 and was subsequently appointed deputy chief executive effective 1 March 2016. From 1 October 2016, Dominic became the chief executive designate of Barloworld. Prior to joining Barloworld, Dominic was deputy managing director of Afgri Limited. On 8 February 2017 Dominic was appointed chief executive of Barloworld Limited.Nationality: South African
Finance directorQualifications: BCom, CTA, CA(SA)Profile: Donald rejoined Barloworld as finance director in 2006 and was appointed to the Barloworld board in September 2006. Previously he was executive director – finance at Sappi Limited. Nationality: South African
Dominic Malentsha Sewela 53
Donald Gert Wilson 61
Independent non-executive directorQualifications: BA (Hons) Economics and Accountancy; FCA of the ICAEWProfile: Michael was appointed to the Barloworld board in April 2017. His early Ernst & Young career was focused on auditing clients within the oil and gas sectors and added mining to his portfolio later. Michael also led Ernst & Young’s UK IPO and Global Natural Resources transaction teams in the transaction advisory practice. He has been involved with the CIS since 1991 and has advised many CIS companies on fundraising, reorganisations, transactions, corporate governance and IPOs. Michael is a former chair of the Bureau and current member of UNECE’s Expert Group on Resource Classification and a non-executive director of Gem Diamonds, Lenta and Kaz Minerals.Nationality: British
Executive directorQualifications: BSc (Hons), FCA (England and Wales)Profile: Funke Ighodaro, was appointed as an executive director of the board and CFO-designate of the company with effect from 1 October 2018. She previously served as the group CFO of Tiger Brands Limited, Primedia Limited and as executive director of Kagiso Trust Investments and managing director of its private equity interests. She has served as an independent non-executive director of Datatec Limited, the Institute of Chartered Accountants in England and Wales Members’ Advisory Board for Africa and UAC of Nigeria Limited as well as audit committee chairman and independent non-executive director of Massmart Limited and Transaction Capital Limited.Nationality: Nigerian, British
Michael Lynch-Bell 65
Funke Ighodaro 55
ChairmanQualifications: BA, BProc, LLB, LLM (International Law)Profile: Dumisa was appointed to the Barloworld board in May 1999. He is an advocate of the High Court of South Africa and a member of the Johannesburg Bar. In 2005 he was conferred the status of Silk and was the first black African advocate in the history of the Cape Bar to receive this recognition. He served as a commissioner on the Truth and Reconciliation Commission, and has been appointed from time to time as acting judge of the High Court of South Africa. In January 2017, Dumisa was appointed as a Chancellor of the University of Fort Hare.Nationality: South African
Advocate Dumisa Buhle Ntsebeza SC 68
90 Barloworld LimitedIntegrated Report 2018
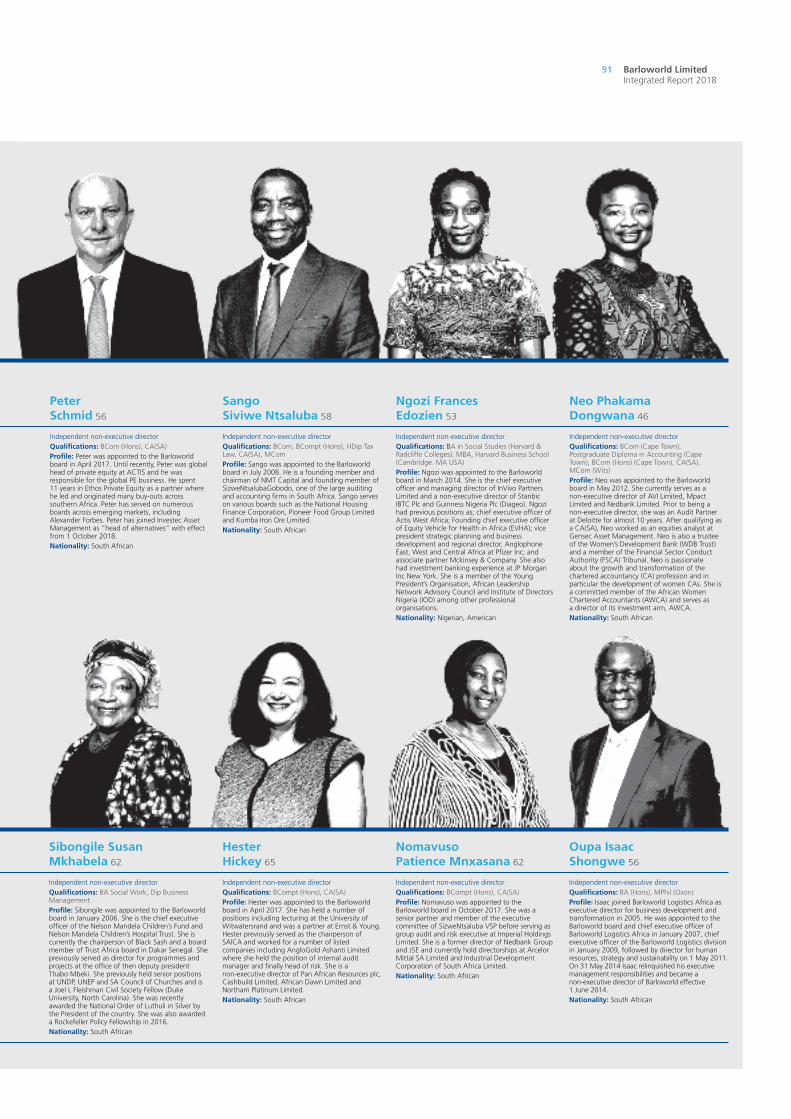
Independent non-executive directorQualifications: BA in Social Studies (Harvard & Radcliffe Colleges), MBA, Harvard Business School (Cambridge. MA USA) Profile: Ngozi was appointed to the Barloworld board in March 2014. She is the chief executive officer and managing director of InVivo Partners Limited and a non-executive director of Stanbic IBTC Plc and Guinness Nigeria Plc (Diageo). Ngozi had previous positions as; chief executive officer of Actis West Africa; Founding chief executive officer of Equity Vehicle for Health in Africa (EVHA); vice president strategic planning and business development and regional director, Anglophone East, West and Central Africa at Pfizer Inc; and associate partner Mckinsey & Company. She also had investment banking experience at JP Morgan Inc New York. She is a member of the Young President’s Organisation, African Leadership Network Advisory Council and Institute of Directors Nigeria (IOD) among other professional organisations. Nationality: Nigerian, American
Independent non-executive directorQualifications: BCom (Cape Town), Postgraduate Diploma in Accounting (Cape Town), BCom (Hons) (Cape Town), CA(SA), MCom (Wits)Profile: Neo was appointed to the Barloworld board in May 2012. She currently serves as a non-executive director of AVI Limited, Mpact Limited and Nedbank Limited. Prior to being a non-executive director, she was an Audit Partner at Deloitte for almost 10 years. After qualifying as a CA(SA), Neo worked as an equities analyst at Gensec Asset Management. Neo is also a trustee of the Women’s Development Bank (WDB Trust) and a member of the Financial Sector Conduct Authority (FSCA) Tribunal. Neo is passionate about the growth and transformation of the chartered accountancy (CA) profession and in particular the development of women CAs. She is a committed member of the African Women Chartered Accountants (AWCA) and serves as a director of its investment arm, AWCA.Nationality: South African
Independent non-executive directorQualifications: BCom, BCompt (Hons), HDip Tax Law, CA(SA), MComProfile: Sango was appointed to the Barloworld board in July 2008. He is a founding member and chairman of NMT Capital and founding member of SizweNtsalubaGobodo, one of the large auditing and accounting firms in South Africa. Sango serves on various boards such as the National Housing Finance Corporation, Pioneer Food Group Limited and Kumba Iron Ore Limited. Nationality: South African
Independent non-executive directorQualifications: BCom (Hons), CA(SA)Profile: Peter was appointed to the Barloworld board in April 2017. Until recently, Peter was global head of private equity at ACTIS and he was responsible for the global PE business. He spent 11 years in Ethos Private Equity as a partner where he led and originated many buy-outs across southern Africa. Peter has served on numerous boards across emerging markets, including Alexander Forbes. Peter has joined Investec Asset Management as “head of alternatives” with effect from 1 October 2018.Nationality: South African
Ngozi Frances Edozien 53
Neo Phakama Dongwana 46
Sango Siviwe Ntsaluba 58
Peter Schmid 56
Independent non-executive directorQualifications: BCompt (Hons), CA(SA)Profile: Hester was appointed to the Barloworld board in April 2017. She has held a number of positions including lecturing at the University of Witwatersrand and was a partner at Ernst & Young. Hester previously served as the chairperson of SAICA and worked for a number of listed companies including AngloGold Ashanti Limited where she held the position of internal audit manager and finally head of risk. She is a non-executive director of Pan African Resources plc, Cashbuild Limited, African Dawn Limited and Northam Platinum Limited.Nationality: South African
Independent non-executive directorQualifications: BCompt (Hons), CA(SA)Profile: Nomavuso was appointed to the Barloworld board in October 2017. She was a senior partner and member of the executive committee of SizweNtsaluba VSP before serving as group audit and risk executive at Imperial Holdings Limited. She is a former director of Nedbank Group and JSE and currently hold directorships at Arcelor Mittal SA Limited and Industrial Development Corporation of South Africa Limited.Nationality: South African
Independent non-executive directorQualifications: BA Social Work, Dip Business ManagementProfile: Sibongile was appointed to the Barloworld board in January 2006. She is the chief executive officer of the Nelson Mandela Children’s Fund and Nelson Mandela Children’s Hospital Trust. She is currently the chairperson of Black Sash and a board member of Trust Africa board in Dakar Senegal. She previously served as director for programmes and projects at the office of then deputy president Thabo Mbeki. She previously held senior positions at UNDP, UNEP and SA Council of Churches and is a Joel L Fleishman Civil Society Fellow (Duke University, North Carolina). She was recently awarded the National Order of Luthuli in Silver by the President of the country. She was also awarded a Rockefeller Policy Fellowship in 2016.Nationality: South African
Hester Hickey 65
Nomavuso Patience Mnxasana 62
Sibongile Susan Mkhabela 62
Independent non-executive directorQualifications: BA (Hons), MPhil (Oxon)Profile: Isaac joined Barloworld Logistics Africa as executive director for business development and transformation in 2005. He was appointed to the Barloworld board and chief executive officer of Barloworld Logistics Africa in January 2007, chief executive officer of the Barloworld Logistics division in January 2009, followed by director for human resources, strategy and sustainability on 1 May 2011. On 31 May 2014 Isaac relinquished his executive management responsibilities and became a non-executive director of Barloworld effective 1 June 2014.Nationality: South African
Oupa Isaac Shongwe 56
91 Barloworld LimitedIntegrated Report 2018

Executive committee
Chief executive Qualifications: BSc Chemical EngineeringProfile: Dominic rejoined Barloworld in 2007 as chief executive officer to the Equipment division South Africa. In 2014 he was promoted to chief operating officer of Barloworld Equipment Southern Africa and thereafter chief executive officer of Barloworld Equipment Southern Africa. He joined the board on 19 March 2014 and was subsequently appointed deputy chief executive effective 1 March 2016. From 1 October 2016, Dominic became the chief executive designate of Barloworld. Prior to joining Barloworld, Dominic was deputy managing director of Afgri Limited. On 8 February 2017 Dominic was appointed chief executive of Barloworld Limited.Nationality: South African
Dominic Malentsha Sewela 53
Group executive: Insurance and RiskQualifications: BCom (Vista University), Certificate in tax from UNISA and MBA (University of the Witwatersrand), Fellow FCA (Institute of Chartered Accountants, England and Wales)Profile: Lesibana joined Barloworld Equipment Southern Africa in June 2012 in the role of divisional director for strategy, risk and sustainability. He assumed operational responsibility for operations in Malawi and for the joint venture in Zimbabwe from 2013. Lesibana transferred to Barloworld Corporate Office in October 2017, where he is currently employed in the role of deputy group executive for risk, legal and insurance.Nationality: South African
LesibanaLedwaba 52
Group executive: Strategy and M&A
Qualification: BCompt
Profile: Chris joined Barloworld in 1998 and has held various roles in strategy at the group and divisional levels. He has been directly involved in M&A activity in the Automotive division over the last 10 years and also supported various transactions in the Logistics business. Prior to his current position, Chris was the CE of the Digital Disposal Solutions business in the Automotive division.
Nationality: South African
Chris Wierenga 42
Finance directorQualifications: BCom, CTA, CA(SA)Profile: Donald rejoined Barloworld as finance director in 2006 and was appointed to the Barloworld board in September 2006. Previously he was executive director – finance at Sappi Limited. Nationality: South African
Group executive: Corporate AffairsQualifications: Gugu is a journalist by training from Durban University of Technology MAP from Wits Business School. MA – IE School of Human Sciences and Technology: Master in Positive Leadership and Strategy programme (Graduate in July 2019)Harvard University: Public Policy (2012)Yale University: Leadership and Public Policy (2014)INSEAD Business School: COL 2017Lee Kuan Yew School of Public Policy, Singapore: Leadership and Public Policy (2017)Profile: She was Managing Director for Public Policy and Strategy at Barclays Africa. Prior to this, she headed up the Strategy and Emerging Markets division at Ernst & Young and served as Group Corporate Affairs Director at the Public Investment Corporation, (PIC). She has a 20-year track record in financial services, strategy and public affairs. Appointed 01 October 2018.Nationality: South African
Donald Gert Wilson 61
Gugu Sepamla 47
92 Barloworld LimitedIntegrated Report 2018

CEO: Logistics
Qualifications: BTech; MAP
Profile: Kamogelo, a qualified industrial engineer, with 21 years of senior business executive experience in operations and management in varied sectors including Logistics, Industrial, Automotive, Food Services, Hospitality, Rail and Post Service, 18 years of which were in senior and executive management roles with blue chip companies. In his role as CEO, Kamogelo is responsible for driving further growth, in line with our group-wide growth ambitions, in the Logistics business.
Nationality: South African
CEO: Automotive
Qualification: BCom (Hons)
Profile: Keith joined Barloworld in 2004 when Avis Southern Africa was bought by Barloworld. He started his career at Avis in 1998 and was appointed as chief executive for Avis Car Rental Southern Africa in 2004. In 2007 he was appointed as chief executive for Barloworld Automotive – Car Rental that included the southern Africa and Scandinavian operations. Keith was appointed chief executive Barloworld Automotive on 1 March 2015.
Nationality: South African
CEO: Equipment Southern Africa
Qualifications: BSc Engineering Metallurgy and Materials (Wits), Postgraduate diploma in Business Administration (De Montfort University)
Profile: Emmy has held the position of CEO for Barloworld Equipment South Africa since 1 October 2012, which equates to 60% of the southern African business. His career stretches over various commodities and disciplines in the industry. Emmy was previously the CEO of Hernic Ferrochrome, having previously held senior executive roles at Anglo American and BHP Billiton.
Nationality: South African
Group executive: Legal
Qualifications: BCom, MBA, FCII
Profile: Hilary joined Barloworld in 2003 as head of insurance. Her portfolio has grown over the past 13 years to include global responsibility for legal, risk, internal audit, ethics and compliance, the group’s ethics tip-off line, the Barloworld Medical Scheme and the Barloworld retirement fund, part of the Old Mutual SuperFund.
Nationality: South African
KamogeloMmutlana 44
KeithRankin 48
Emmy Leeka 48
HilaryWilton 62
Executive directorQualifications: BSc. (Hons), FCA (England and Wales)Profile: Funke Ighodaro, was appointed as an executive director of the board and CFO-designate of the company with effect from 1 October 2018. She previously served as the group CFO of Tiger Brands Limited, Primedia Limited and as executive director of Kagiso Trust Investments and managing director of its private equity interests. She has served as an independent non-executive director of Datatec Limited, the Institute of Chartered Accountants in England and Wales Members’ Advisory Board for Africa and UAC of Nigeria Limited as well as audit committee chairman and independent non-executive director of Massmart Limited and Transaction Capital Limited.Nationality: Nigerian, British
CEO: Equipment RussiaQualification: Chartered AccountantProfile: Quinton joined Barloworld Automotive in August 1992 as financial manager in Motor Retail. In 2003 he was appointed as financial director of Barloworld Equipment’s International operations based in London, United Kingdom. In May 2008 he was appointed as deputy general director of Barloworld Equipment´s operations in Russia and in July 2012 was appointed as general director for Barloworld’s Russian business.Nationality: South African
FunkeIghodaro 55
QuintonMcGeer 53
Company secretaryQualifications: BProc, LLB, global executive development programme (GIBS), certificate in corporate governanceProfile: Attorney of the High Court of South Africa. Former company secretary and legal counsel for Basil Read, former member of the Judicial Services Commission and sits on the Competition Tribunal as a part-time member. She has over 20 years’ experience as attorney and eight as company secretary. Andiswa was appointed company secretary on 1 September 2018.Nationality: South African
Andiswa ThandekaNdoni 51
Group executive: Human CapitalQualifications: CA(SA), Postgraduate diploma in Accounting, BAdmin (Hons), Higher diploma in banking law, Certificate of proficiency in short-term insuranceProfile: Tantaswa has worked for KPMG SA where she was executive head: people (HR) and transformation. She is a chartered accountant with qualifications in industrial psychology, accounting, banking and finance. She has also served as national president at the Association for the Advancement of Black Accountants of Southern Africa (ABASA). In addition, Tantaswa has previously worked for Standard Bank and Nkonki Inc and serves as a non-executive director on a number of boards.Nationality: South African
Tantaswa Fubu 44
93 Barloworld LimitedIntegrated Report 2018

Social, ethics and transformation committee report
The committee operates under terms of reference, a copy of which can be found on our website www.barloworld.com. The committee has a clearly defined framework, aligned to the Companies Act, the King Report on Corporate Governance in South Africa (King IV™) and other relevant legislation and standards, to determine the most effective processes and reporting formats to deal with matters under the committee’s mandate.
The committee recognises that some of its statutory functions overlap with the functions or mandates or terms of reference of other committees of the board. Where appropriate, these functions have been aligned to the mandate of the committee. In other areas of overlap such as safety, health and environmental matters, the committee, without derogating from its duties and responsibilities, worked closely with and relied upon the work of other committees of the board. The committee strives to apply relevant codes of best practice including, but not limited to, the United Nations Global Compact Principles and Sustainable Development Goals, the Organisation for Economic Cooperation and Development (OECD) guidelines regarding corruption, International Labour Organisation Decent Work Agenda, and the principles of good corporate citizenship as espoused in the King IV report.
The committee has access to any director or prescribed officer or employee of the company. Where appropriate, these levels of employees have been asked to provide information or the explanations necessary to enable the committee to deliver its mandate.
www
The committee carried out the following duties:Human capital: Monitored the implementation of the key people initiatives that will enable the achievement of the group’s ambition and strategy in an aligned and sustainable manner. Key focus areas included overseeing efforts to develop a One Barloworld leadership competency framework and integrated talent management, performance optimisation, learning and development, as well as remuneration and reward to ensure optimal human capital resource allocation.
Diversity and inclusion: Approved the revised diversity and inclusion targets for the group for 2019, 2020 and 2022 by gender, race and grade. The strategy involves identifying and eliminating any employment barriers, perceived or real, and to promote demographic representation in the workplace that more closely resembles that of the communities in which we operate.
Ethics: The Ethics Line reporting process was revised to further promote and instil an ethical culture. The amended process has enhanced the effectiveness and independence of the investigations carried out across the group.
Stakeholder engagement: The company continues to evolve its approach and strategic intent to stakeholder engagement. The process of mapping stakeholder relationships is being undertaken across the group. Stakeholder engagement continues to be key in enhancing the group’s sustained value creation.
Empowerment and transformation: As part of ongoing efforts to deliver on its responsibilities, the committee will continue to review, monitor and report on areas under its mandate. We have introduced the Transformation and Empowerment dialogues (TE-Dialogues) during the year which are being rolled out throughout the group. We also put increased effort on preferential procurement across all divisions and business units in order to bolster access to the Barloworld value chain for black-owned and black women-owned entities.
SS MkhabelaChairman
Social, ethics and transformation committee
94 Barloworld LimitedIntegrated Report 2018

Remuneration report
Part 1: Background statement
Dear shareholders
I am pleased to provide you with the Barloworld Limited (Barloworld or the company) remuneration report for the year ended 30 September 2018.
As reported in 2017, the company embarked on a strategic review process and as a result the group remuneration philosophy and policy was reviewed to ensure alignment with the new strategy and ambition.
We are satisfied with the response we have received from shareholders in support of our revised policy. Notwithstanding the fact that 97.97% of shareholders endorsed the policy, the remuneration committee will continue to engage shareholders on key issues underpinning the policy.
The main changes that were implemented during the year as per the revised policy were: – The short-term incentive scheme (STI) was redesigned in order to drive appropriate behaviours and focus senior employees towards shareholder value creation as follows: – At executive director and prescribed officer level the weighting for the short-term incentives was revised and a greater weighting has been assigned to company performance, as below: – financial performance – 65% (previously 60%). The financial performance is split between group and divisional financial performance objectives depending on grading and divisional responsibility
– personal performance – 25% (previously 30%) – diversity and inclusion metric remained unchanged at 10%.
The remuneration committee is of the view that a 65% weighting on financial performance is justified to ensure a sufficient link between financial returns, shareholder value creation and reward.
– The STI metrics were reviewed and more specifically, economic profit replaced operating profit. At divisional level, return on invested capital (ROIC) was added and the metrics are:
Group%
Division%
Economic profit (EP) 30 35Free cash flow to firm after interest (FCF) 30 35Return on equity (ROE) 25 0Return on invested capital (ROIC) 0 30Headline earnings per share (HEPS) 15 0
– The STI is capped at 175% of annual basic salary for executives (previously 125%) and 200% for the CEO (previously 150%).
– At least one financial performance metric must achieve threshold before the STI pays. This prerequisite, which is in the form of a financial multiplier curve, escalates at an increasing rate between threshold and target and at a higher rate between target and outperformance.
– In response to previous comments from certain shareholders, the overall retention component on our long-term incentives (LTI) for executive directors and prescribed officers has been reduced from 25% to 7.5%
– The mix between share appreciation rights and full shares granted under our LTIs at executive level was reviewed. The share appreciation rights now bear a greater weighting (70% share appreciation rights (previously 35%) and 30% full shares (previously 65%). We believe that this change aligns with the revised strategy of the company
– The remuneration committee also adopted a malus and claw-back policy applicable to the group and the divisional executive committee members. This policy applies to all variable remuneration.
GRI 102-35 to 102-39
95 Barloworld LimitedIntegrated Report 2018

Remuneration report
Barloworld delivered strong performance in the 2018 financial year despite challenging macro-economic environments in our respective geographies. It is against the backdrop of this solid performance that STI payments were awarded and the LTI awarded in 2016, will vest.
During the year, the remuneration committee conducted further work on the King IV Code on Corporate Governance and the amended JSE Listings Requirements on remuneration. We are therefore pleased to confirm that this report complies with leading governance and disclosure requirements and is set out in three parts as follows: – Part 1 contains the background statement – Part 2 sets out the company’s remuneration philosophy and policy
– Part 3 details the implementation of the policy in the 2018 financial year.
Parts 2 and 3 will be put forward for separate non-binding advisory votes.
The company continues with the practice of fair, responsible and equitable remuneration. In this regard, the remuneration committee regularly reviews the company’s internal wage gap. The remuneration committee further seeks to find a balance between the interests of executives and shareholders to ensure fair and responsible outcomes. For this reason a significant portion of the pay of our senior employees is at risk and subject to stretching performance conditions.
As in the past, our hope is that this report evidences the company’s continued focus on responsible remuneration that is performance based and driven by sound governance principles.
We trust that we have provided a clear summary of the remuneration policy and explanations of the executive management team’s remuneration and that you find this to be a comprehensive overview.
NP Dongwana Chairperson Remuneration committee 23 November 2018
96 Barloworld LimitedIntegrated Report 2018
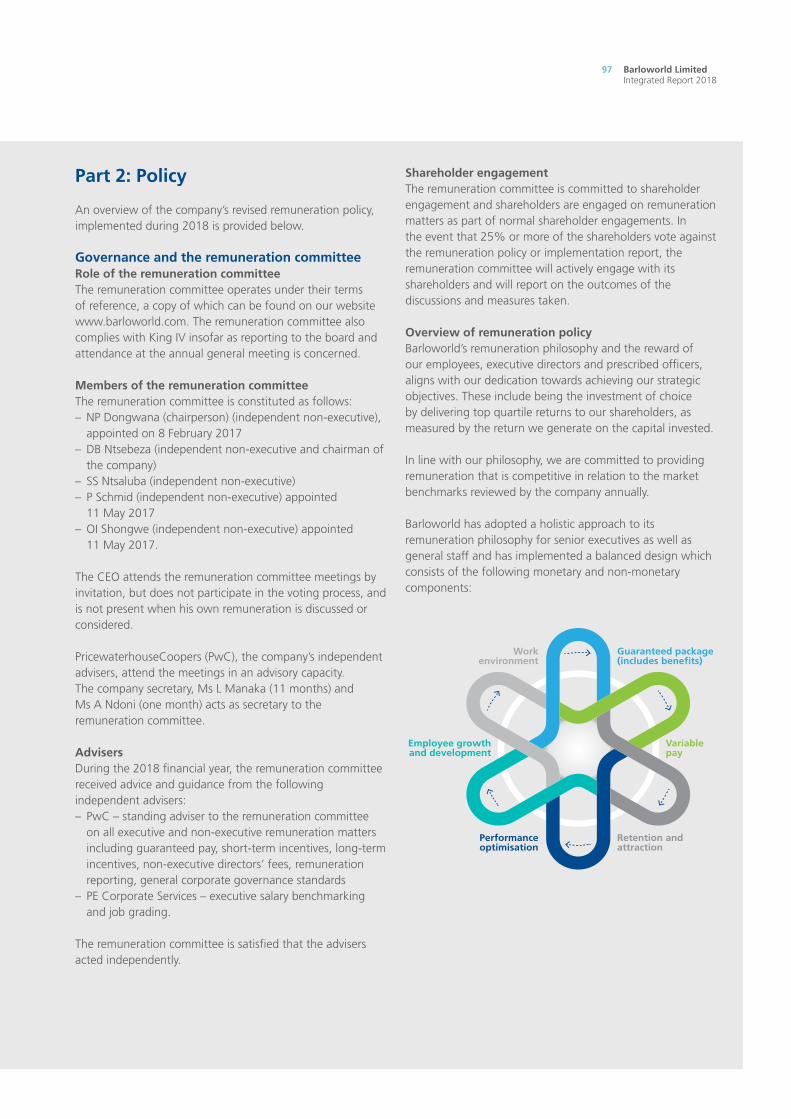
Part 2: Policy
An overview of the company’s revised remuneration policy, implemented during 2018 is provided below.
Governance and the remuneration committeeRole of the remuneration committeeThe remuneration committee operates under their terms of reference, a copy of which can be found on our website www.barloworld.com. The remuneration committee also complies with King IV insofar as reporting to the board and attendance at the annual general meeting is concerned.
Members of the remuneration committeeThe remuneration committee is constituted as follows: – NP Dongwana (chairperson) (independent non-executive), appointed on 8 February 2017
– DB Ntsebeza (independent non-executive and chairman of the company)
– SS Ntsaluba (independent non-executive) – P Schmid (independent non-executive) appointed 11 May 2017
– OI Shongwe (independent non-executive) appointed 11 May 2017.
The CEO attends the remuneration committee meetings by invitation, but does not participate in the voting process, and is not present when his own remuneration is discussed or considered.
PricewaterhouseCoopers (PwC), the company’s independent advisers, attend the meetings in an advisory capacity. The company secretary, Ms L Manaka (11 months) and Ms A Ndoni (one month) acts as secretary to the remuneration committee.
AdvisersDuring the 2018 financial year, the remuneration committee received advice and guidance from the following independent advisers: – PwC – standing adviser to the remuneration committee on all executive and non-executive remuneration matters including guaranteed pay, short-term incentives, long-term incentives, non-executive directors’ fees, remuneration reporting, general corporate governance standards
– PE Corporate Services – executive salary benchmarking and job grading.
The remuneration committee is satisfied that the advisers acted independently.
Shareholder engagementThe remuneration committee is committed to shareholder engagement and shareholders are engaged on remuneration matters as part of normal shareholder engagements. In the event that 25% or more of the shareholders vote against the remuneration policy or implementation report, the remuneration committee will actively engage with its shareholders and will report on the outcomes of the discussions and measures taken.
Overview of remuneration policyBarloworld’s remuneration philosophy and the reward of our employees, executive directors and prescribed officers, aligns with our dedication towards achieving our strategic objectives. These include being the investment of choice by delivering top quartile returns to our shareholders, as measured by the return we generate on the capital invested.
In line with our philosophy, we are committed to providing remuneration that is competitive in relation to the market benchmarks reviewed by the company annually.
Barloworld has adopted a holistic approach to its remuneration philosophy for senior executives as well as general staff and has implemented a balanced design which consists of the following monetary and non-monetary components:
Guaranteed package (includes bene�ts)
Variablepay
Retention and attraction
Performanceoptimisation
Employee growth and development
Workenvironment
97 Barloworld LimitedIntegrated Report 2018

Remuneration report
Elements of remuneration The table below summarises the remuneration policy as it applies to all employees, with detailed information on the composition of the total remuneration package for executive directors and prescribed officers.
Element Objective Eligibility PolicyChanges for 2019
Fixed
Base salary Reflects scope and nature of role, performance and experience
All employees
Role of benchmarking and salary adjustments Barloworld operates the Towers Watson global grading methodology and structure. This assesses employee remuneration against an independently determined grade which is based on a number of factors including the “size” of the job (as measured by revenue and number of employees) as well as its “complexity” (incorporating aspects such as whether it is a domestic, international or global business). Base salary for executives and senior management is benchmarked by independent consultants, PE Corporate Services.
In the case of executive directors and prescribed officers, two sources are used to benchmark salaries: – PE Corporate Services using the Tower Watson grading system.
– Independent benchmark against a comparator group comprising JSE listed companies, performed by PwC.
The remuneration committee approves salary increases for executive directors and prescribed officers on an individual basis. The CEO approves salaries of other group executive members. These are submitted to the remuneration committee for noting. The salary adjustments for other employees are considered by the appropriate heads of divisions and these are approved by the group internal remco (CEO, HC executive, and finance director).
Market positioningIn most cases, the base salary is benchmarked to the market median. Variations around the median may be influenced by the nature of the role, experience, changes in responsibilities and performance track record.
No proposed changes
Benefits Provides employees with contractually agreed basic benefits
All employees
The percentage of company contribution to benefits varies by country.
No proposed changes
98 Barloworld LimitedIntegrated Report 2018

Element Objective Eligibility PolicyChanges for 2019
Variable
Short-term incentive (STI)
Rewards and motivates achievement of financial, diversity and inclusion as well as individual performance objectives
All employees
All employees above grade 15 (including executive directors and prescribed officers)STIs are paid in cash and are based on achievement of annual targets aimed at delivering the strategy and increasing shareholder value. The STI operates on an additive basis and is capped at 200% of annual basic salary for the CEO and 175% for executives. For other employees, the STI operates on a sliding scale depending on grade.
The criteria, as applicable from 2018 for earning a bonus consists of three elements: – Financial performance objectives, with a 65% weighting. The 65% weighting is split between group and divisional financial performance objectives depending on grading and divisional responsibility
– Personal scorecard objectives (incorporating non-financial measures), with a 25% weighting
– Diversity objectives, with a 10% weighting.
At least one financial performance metric must achieve threshold before the STI pays. This prerequisite, which is in the form of a financial multiplier curve, escalates at an increasing rate between threshold and target and at a higher rate between target and outperformance.
Threshold, target and outperformance financial objectives are set by the remuneration committee annually in advance and are explained in further detail below.
The remuneration committee reviews the actual performance of the executives against the objectives set.
The revised STI Scheme is subject to affordability and the remuneration committee’s approval.
All employees below grade 15Due to the diversified nature of the business, each of the business units have their own bonus or 13th cheque scheme for employees below grade 15.
Divisional bonus plans are aligned such that divisional employees are incentivised on similar financial targets to the executive scheme (as detailed above).
No proposed changes
99 Barloworld LimitedIntegrated Report 2018

Element Objective Eligibility PolicyChanges for 2019
Variable
Long-term incentives (LTIs)
To align management and employee interests to those of shareholders over multiple reporting periods and create sustainable value
Employees on grade 15 and above and a limited number of grade 14 employees who hold strategic or operational critical roles
The company operates the following LTI plans: – Forfeitable Share Plan (FSP) – Share Appreciation Right (SARs) Scheme.
Forfeitable Share Plan (FSP)The awards are structured as forfeitable share awards and participants receive shares (including dividend and voting rights) on the date of the award but the shares are subject to restrictions and a risk of forfeiture during a three-year vesting period, when stated performance conditions are not met.
The performance awards are subject to performance conditions and continued employment while retention awards are subject to continued employment only.
To the extent that the performance targets are not achieved, those shares will be forfeited and there will be no re-testing of the performance targets. Notional FSP awards, settled in cash on the vesting date can also be made.
Share appreciation rights (SARs)The Scheme was developed to provide employees with an opportunity to benefit from growth in the underlying value of the ordinary shares of Barloworld. From 2016 onwards, only group executives participate in the SARs Scheme.
The SARs are subject to three, four and five-year vesting periods. All SARs will lapse if not exercised within six years from the date of grant. The first four awards (2006 to 2009) were cash settled. From 2011 onwards, awards are equity settled. From 2007, the entire SARs award was subject to a performance target, as set out below. Notional SARs awards settled in cash on exercise can also be made.
Performance conditionsFull details of the performance conditions and measurement are provided from page 106.
No changes proposed
Remuneration report 100 Barloworld LimitedIntegrated Report 2018

Element Objective Eligibility PolicyChanges for 2019
Variable
Limits and quantumAn aggregate limit of 22 744 049 (twenty-two million, seven hundred and forty-four thousand and forty-nine) shares, equating to approximately 10% (ten percent) of the current issued share capital of the company applies to all the share plans. The maximum number of unvested FSP awards which may be made to any one participant is 0.25% of the issued ordinary share capital of the company. Similarly, the maximum number of unvested SARs granted to any one participant may not exceed 1% of the issued ordinary share capital of the company.
The 10% plan limit has not been used in totality (current dilution is 0.29%) due to our settlement practices. The plan limit is in place to avoid shareholder dilution in the market.
On an annual basis, the remuneration committee approves the quantum of awards to be made, the performance targets and a mix of instruments to be granted to eligible employees. Full details are disclosed in part 3.
Package designExecutive remuneration is heavily weighted toward variable remuneration. The graphs set out the CEO, as well as the average of the executive directors and the prescribed officers’ potential pay mix at below threshold, at target and at stretch or outperformance.
The pay mix potential reflected includes cost to company (CTC), short-term incentives (STI) and long-term incentives (LTI).
Below threshold performance (R000)
Chief executive
■ CTC ■ STI***■ LTI**
* Average CTC ** Indicative expected value of retention
FSPs on grant date*** STI is not payable for performance
below threshold
3815 921
921
10 733
Executive directors and
prescribed officers*
At targeted performance (R000)
Executive directors and
prescribed officers*
Chief executive
■ CTC ■ STI■ LTI**
* Average CTC** Indicative expected value on grant date
3 554
4 2725 921
8 588
9 501
10 733
At stretch or outperformance level (R000)
Chief executive
■ CTC ■ STI■ LTI**
5 9218 136
4 633
10 733
18 098
11 194
* Average CTC** Indicative expected value on grant date
assuming full vesting
Executive directors and
prescribed officers*
101 Barloworld LimitedIntegrated Report 2018

Performance targets The financial metrics for short and long-term incentives are set by the remuneration committee on an annual basis and are carefully selected based on key business drivers over the short and long term.
The metrics are as follows: Short-term incentiveFinancial metrics (65% weighting)A combination of the following metrics and weightings are applied:
Group measures: Divisional measures: – Economic profit (EP) 30% Economic profit (EP) 35% – Free cash flow to firm after interest (FCF) 30% Free cash flow to firm after interest (FCF) 35% – Return on equity (ROE) 25% Return on invested capital (ROIC) 30% – Headline earnings per share (HEPS) 15%
The 65% weighting is split between group and divisional financial performance objectives depending on grading and divisional responsibility. Prescribed officers and executives with divisional responsibility have a split of 40% group and 25% division.
The targets are set to take into account the current trading conditions and challenges faced by the company or relevant division and incorporate a meaningful level of stretch to motivate and retain senior employees. The threshold targets are set at immediate prior year actuals.
Individual scorecard objectives (25% weighting)In respect of personal scorecard objectives, these would typically include aspects such as: – Leadership behaviours – Customer loyalty and satisfaction – Relationships with principals – Safety performance – Market share targets – People development and training – Sustainable development key performance indicators
– Aftermarket growth targets – Acquisitions and disposals – Special projects.
Diversity and inclusion objectives (10% weighting)The attainment of specific workforce diversity and inclusions targets (gender and race).
Earning levels The percentage of basic salary paid as a bonus based on relative achievement against targets (threshold, target and outperformance) is:
CEO
Performance metricThreshold
%Target
%
Outperfor-mance
%
Bonus based on financial targets (group) 0.0 32.5 65.0Bonus based on personal scorecard objectives 0.0 12.5 25.0Bonus based on diversity objectives 0.0 5.0 10.0
Sub-total 0.0 50.0 100.0
Financial multiplier 0.0 105.0 100.0STI cap 200.0 200.0 200.0
Total bonus 0.0 105.0 200.0
Remuneration report 102 Barloworld LimitedIntegrated Report 2018

Executive directors and prescribed officers
Performance metricThreshold
%Target
%
Outperfor-mance
%
Bonus based on financial targets (based on a combination of group and divisional targets) 0.0 32.5 65.0
Bonus based on personal scorecard objectives 0.0 12.5 25.0
Bonus based on diversity objectives 0.0 5.0 10.0
Sub-total 0.0 50.0 100.0
Financial multiplier 0.0 105.0 100.0
STI cap 175.0 175.0 175.0
Total bonus 0.0 91.9 175.0
Long-term incentivesDetails surrounding the performance conditions for the LTIs are set out below:
SARs FSP
Performance condition(s) and weighting(s)
Headline earnings per share (HEPS)
SARs are also subject to the inherent performance condition of the share price appreciation being above the strike price (defined as the share price at the date of issue)
The following performance targets are used: – Relative total shareholder return (TSR) – HEPS – Return on net operating assets (RONOA).
The relative weighting of the performance conditions is reviewed on an annual basis.
Vesting of awards at threshold performance
25% 22.5%
Vesting of awards at on-target performance
100% 100%
Performance period The performance conditions are measured over a three-year period, commensurate with the financial years of the company.
Executive contracts The main terms of the service contracts applicable to executive directors and prescribed officers are summarised below:
Provision Policy
Contract term Indefinite – or until normal retirement age in the relevant jurisdiction, subject to specified notice periods by the executive and the company
Notice period Nine months for the CEOSix months for other executives
Termination of employment and change of control payments and/or automatic vesting of long-term incentives
Change of control provisions are covered by FSP and SARs rules and allow for proportionate vesting of awards. Change of control clauses in employment contracts provide for redundancy terms, based on established guidelines, in the event of termination of employment within six months of change of control
Restraint of trade Applicable to some executives per their employment contracts
Other benefits Not applicable
103 Barloworld LimitedIntegrated Report 2018
Malus and claw-backTo further align the interests of executives with those of the shareholders, the remuneration committee adopted a malus and claw-back policy applicable to members of the group executive committee and the members of the divisional executive committees. This policy applies to all variable remuneration.
Should a trigger event arise before the vesting/payment of any variable remuneration, the remuneration committee can, at its own discretion cancel any unvested/unpaid incentives. If the trigger event arises after variable remuneration that has been paid/settled, the remuneration committee can demand the repayment of an amount equal to the pre-tax value of any bonus paid, or a pre-tax amount equal to the market value of any long-term incentive received. Typically trigger events include gross misconduct, loss to the company due to the failure to observe risk management policies or where misleading financial information has been used and has influenced the incentive amount awarded and/or paid.
Non-executive directorsNon-executive directors are appointed subject to the provisions set out in a letter of appointment. The letter sets out, among other things, the term of appointment, duties and responsibilities, fees and other payments, and provisions related to termination of services.
Non-executive directors receive a standard fee for their services on the board and board committees. The remuneration committee reviews the level of fees and makes recommendations to the board for
consideration. In November 2018, a benchmarking exercise was conducted by PwC, the company’s independent remuneration adviser.
The benchmark analysis was against a comparator group comprising JSE-listed companies. The PwC report indicated that some of the committee fees lag the comparator group median. The CEO recommended that increases should be made to fees that were significantly below market levels. However, a staggered approach would be followed to align the fees to market levels over a few years.
The proposed fees for the 2019 financial year are set out in the notice to the annual general meeting (AGM) on page 5 of the AGM booklet. Such fees are exclusive of any value added tax (VAT) that might be applicable, depending on the individual registration circumstances of a particular director. The fees have been adjusted marginally, while the fees which significantly lag the comparator group have been increased to the median.
Non-binding advisory voteShareholders are requested to cast a non-binding advisory vote on the aforementioned part 2 of this report.
Part 3: Disclosure of the implementation of the policies for the period under review
Key remuneration decisions taken during the year The remuneration committee discussed the following matters during 2018: – Approval of the changes to the company’s remuneration policy
– Approval of the long-term incentive awards, inclusive of the mix of instruments to be used and company performance conditions relating thereto
– Approval of the targets and weighting of the performance measures of the STI scheme
– Reviewed personal scorecard objectives of the executives
– Reviewed and approved the adoption of a malus and claw-back policy
– Reviewed global and national developments in respect of executive remuneration
– Reviewed and approved peer group companies for benchmarking in 2018
– Reviewed executive pay equity trends in the group
– Approved salary increases for executive directors and prescribed officers
– Approved the STI payments for executive directors and prescribed officers
– Reviewed King IV principles – Reviewed and approved the company’s remuneration report
– Reviewed and recommended increases to non-executive director fees
– Reviewed the remuneration committee terms of reference
– Reviewed and considered executive shareholding requirements.
Guaranteed package/base salary adjustmentsOn average the executives received a 6% increase. Details of the basic salary and guaranteed packages (basic salary plus benefits) paid to each of the executive directors and prescribed officers during the 2018 financial year are set out from page 108 of this report.
Remuneration report 104 Barloworld LimitedIntegrated Report 2018

2018 short-term incentive outcomesPerformance against group financial targets
Metric Threshold Target Outperformance Actual
Economic profit (million)*Equipment Southern Africa R55 R192 R329 R42Equipment Russia $13 $17 $21 $20Automotive R81 R163 R244 R15Logistics (R238) (R122) (R6) (R69)Group (R286) (R29) R228 R5
HEPS (cents) Group 974 1 096 1 218 1 151Free cash flow to firm after interest (million)
Equipment Southern Africa R40 R177 R314 (R100)Equipment Russia $2 $6 $10 $22Automotive R117 R198 R279 R690Logistics R264 R311 R358 R520Group R3 273 R3 530 R3 787 3 591
ROE (%)Group 10.5 11.8 13.0 11.4 ROIC (%)
Equipment Southern Africa 12.8 14.2 15.5 12.7 Equipment Russia 18.8 21.0 23.2 21.6 Automotive 13.1 13.9 14.7 12.4 Logistics 2.5 7.3 12.0 8.7
n Below threshold n Between threshold and target n Between target and outperformance n Outperformance and above
* Based on weighted average cost of capital (“WACC”) at beginning of reporting period.
The financial objectives set out in the table above were approved by the remuneration committee for the divisional executive directors and prescribed officers.
The executive directors, Dominic Sewela (CEO), Don Wilson (finance director) and one prescribed officer, Peter Bulterman (CEO: Equipment Southern Africa, Russia and Iberia) were measured against group financial targets. The other prescribed officers (Emmy Leeka and Keith Rankin) were measured against a combination of group and divisional financial targets (40% group and 25% division).
STI paymentsAnnual performance bonus payments are made in cash following finalisation of the company’s audited financial results for the year in question and are not deferred.
Annual performance bonus payments made to executive directors and prescribed officers are disclosed on page 109 of this report.
– The scheme is calculated based on the following formula which incorporates six variables:
[A + B + C + D] x E x F x Annual basic cash salary – Individual Scorecard score [A] counting for up to 25% of the Total Bonus percentage (Total Bonus percentage = [A + B + C + D]).
– Diversity and Inclusion score [B] counting for up to 10% of the Total Bonus percentage.
– Group financial performance objectives [C], counting for up to 65% of the Total Bonus percentage.
– Divisional financial performance score [D], counting for up to 25%, is only applicable for executives with divisional responsibility.
– Financial Multiplier [E] is a calculated amount based on Group financial performance [C].(a) If group financial performance %
[C] < 50%: Financial Multiplier = group financial performance %/50% x 105%
(b) If group financial performance % [C] > 50%: Financial Multiplier = (group financial performance %
– 50%)/50% x (1 – 105%) +105%
(c) Illustrative effect of the above: (i) If group financial performance
% [C] = 0%, financial multiplier = 0%
(ii) If group financial performance % [C] = 25%, financial multiplier = 52.5%
(iii) If group financial performance % [C] = 50%, financial multiplier = 105%
(iv) If group financial performance % [C] = 75%, financial multiplier = 102.5%
(v) If group financial performance % [C] = 100%, financial multiplier = 100%
– STI Cap [F] is multiplied by the annual basic cash salary.
105 Barloworld LimitedIntegrated Report 2018

Remuneration report
LTI awards made during the yearIn line with the revised policy, executive directors and prescribed officers received a combination of awards under the SAR Scheme and FSP. The mix between SAR and FSP awards, together with the percentage it represents of TGP is depicted below, as well as details of the applicable performance conditions and targets are set out on the next page.
2018 instruments awarded and quantumDue to prohibited period restrictions, the remuneration committee could not grant equity awards to participants. As a result notional SAR and FSP awards were granted. These awards have the same conditions as equity-settled awards, but will be settled in cash on vesting and exercise.
In the table on the next page the instruments granted, together with the grant expected values per executive director and prescribed officers are provided. Expected value differs from face value (which is the share price on the grant date) and is the indicative fair value of the instrument on the grant date. When determining the expected value of an instrument, the type of instrument and the probability of satisfying the performance conditions were taken into account.
In this context, STIs represented as a percentage of basic salary for the year ended 30 September 2018 were calculated as follows:
Personal scorecard
(% of basic)
D&I scorecard
(% of basic)
Group financials
(% of basic)
Group financial
multiplier
Divisional financials
(% of basic)
Total bonus as a % of
cash salary
Potential maximum bonus as
% of basic Name A B C E D F
CEDominic Sewela 17.5 7.0 36.0 104.5 n/a 126.4 200.0Executive directorsDonald Wilson 12.5 7.0 36.0 104.5 n/a 101.4 175.0Prescribed officers Emmy Leeka 7.8 7.5 22.1 104.5 0.0 68.6 175.0Keith Rankin 14.2 5.2 22.1 104.5 8.8 91.8 175.0Peter Bulterman 12.5 7.0 36.0 104.5 n/a 101.4 175.0
LTI vesting outcomes
Historic and outstanding awardsThe table below provides an overview of the actual vesting and likelihood of vesting of historic and outstanding awards made under the SAR and FSP.
Award SAR FSP
2012 100% (A) 84% (A)2013 100% (A) 71.7% (A)2014 0% (A) 39.3% (A)2015 0% (A) 52% (A)2016 100% (A) 100% (A)2017 100% (L) 100% (L)2018 100% (L) 100% (L)
(Actual (A), proportion likely to vest (L))
Awards with a performance period ending during the 2018 financial yearThe vesting profile for awards made during March 2016 with a performance period that commenced on 1 October 2015 and ending 30 September 2018, vesting during March 2019 are as follows:
FSP performance conditions for the 2016 award Achievement of performance conditions
TSR 100%HEPS 100% RONOA 100%Resultant vesting 100%
SAR performance conditions for the 2016 award Achievement of performance conditions
HEPS 100%Resultant vesting 100%
106 Barloworld LimitedIntegrated Report 2018

NameNotional
SAR
Notionalperfor-mance
FSP
Notionalretention
FSP Total
Mix between instruments
All executive directors and prescribed officers
70% 22.5% 7.5% 100%
At grant expected value
DM Sewela 56% 15% 9% 80%
DG Wilson Within three years of retirement and therefore not
eligible for an awardK Rankin 42% 12% 6% 60%M Leeka 42% 12% 6% 60%
2018 performance conditionsFSP awardsFSP awards were granted on 30 March 2016 with a performance period that commenced on 1 October 2015 and ending 30 September 2018, and the vesting period will expire on 29 March 2019. The following performance targets, weighting and performance periods were applicable to the SARs awarded to executive directors and prescribed officers. Linear vesting on a sliding scale will be applied between threshold and target performance:
Weighting ofperformance
conditions (%)
Below threshold
(vesting %)Threshold
(vesting %)Target
(vesting %)
Performance FSPsTSR 30 0 6.75 22.5HEPS 30 0 6.75 22.5RONOA 40 0 9 30Vesting of performance FSPs 0 22.5 75Retention FSPs
No performance conditions
Vesting of retention FSPs 25 25 25
Combined maximum vesting 25 47.5 100
The following targets were set for the respective performance conditions and are considered by the remuneration committee to be stretching in the context of the company’s business strategy and the market conditions. Linear vesting applies between threshold and target performance.
Condition Threshold (22.5% vesting) Target (100% vesting)
TSR Median of peer group Upper quartile of peer group*HEPS 0% real growth 6% real growthRONOA 15% 20%
* The following comparator group was set for the 2018 TSR condition:
– Bidvest Group Limited – Sime Darby Berhard (Malaysia) – Finning International Inc. (Canada) – Supergroup Limited – Imperial Holdings Limited – Tiger Brands Limited – KAP Industrial Holdings Limited – Trencor Limited – Remgro Limited – Wilson Bayly Hlm-Ovc Limited
SARs awards SARs awards were granted on 30 March 2018 and a third of the SARs will vest on the third, fourth and fifth anniversary of the grant date, respectively and participants have until 30 March 2024 to exercise their vested SARs. The following performance targets, weighting and performance periods were applicable to the number of SARs awarded and are tested over a three-year performance period. Linear vesting on a sliding scale will be applied between threshold and target performance:
Condition Threshold (25% vesting) Target (100% vesting)
Real growth in HEPS 0% real growth 2% real growth
107 Barloworld LimitedIntegrated Report 2018

Remuneration report
Total remuneration outcomes
2017 2018
All figures stated in R’000
Basic salary
Retirement and
medical aid Car
benefitsOther
benefits
Cash perfor-mance bonus1
Dividends (R’000)10
LTI reflected2,3
Total single figure
remune-ration
Basic salary
Retirement and
medical aidCar
benefitsOther
benefits
Cash perfor-mance bonus1
Dividends (R’000)10
LTI reflected2,3
Total single figure
remune-ration
Executive directorsCB Thomson4,5,6 3 490 703 95 32 847 5 852 216 2 235 45 437 108 9 179 9 287 D Sewela 7 121 1 096 268 3 7 079 263 3 350 19 179 8 537 1 301 285 3 10 787 359 8 458 29 729 DG Wilson 4 239 1 056 246 2 3 605 188 1 544 10 879 4 655 1 187 273 3 4 756 119 6 302 17 295
Prescribed officersPJ Bulterman7,8 5 258 860 251 3 5 154 188 1 544 13 257 2 916 25 360 1 459 2 958 – – 7 718 E Leeka9 3 548 621 430 1 369 3 527 95 630 10 219 4 224 692 469 1 369 2 897 165 2 989 12 805 PK Rankin9 4 020 756 161 1 369 3 879 173 1 926 12 284 4 278 805 161 1 375 3 930 185 5 562 16 295
Total 24 186 4 389 1 356 2 746 23 244 905 8 993 65 819 24 610 4 010 1 547 4 208 25 327 829 23 312 83 842 1 Bonuses related to the performance in 2017 and 2018 financial years. 2 The 2017 LTI reflected includes the value of the SARS and FSPs (with performance conditions) awards made on 30 March 2015 with a performance period
ending on 30 September 2017 and FSPs without performance conditions that were granted on 29 March 2017.3 The 2018 LTI reflected includes the value of the SARS and FSPs (with performance conditions) awards made on 30 March 2016 with a performance period
ending on 30 September 2018 and FSPs without performance conditions that were granted on 31 January 2018.4 CB Thomson resigned from the company on 8 February 2017.5 Other benefits relate to severance pay, leave pay and long service awards.6 The LTIs reflected for CB Thomson relate to LTIs that he continues to hold that will remain subject to originally set performance conditions and performance
periods.7 PJ Bulterman was only a prescribed officer for only a part of the 2018 financial year.8 PJ Bulterman's other benefits for 2018 include a retirement benefit and leave pay that were due.9 Other benefits for E Leeka and PK Rankin include retention bonuses.10 Dividends paid in relation to performance shares not yet included in the single figure in prior years.
108 Barloworld LimitedIntegrated Report 2018

2017 2018
All figures stated in R’000
Basic salary
Retirement and
medical aid Car
benefitsOther
benefits
Cash perfor-mance bonus1
Dividends (R’000)10
LTI reflected2,3
Total single figure
remune-ration
Basic salary
Retirement and
medical aidCar
benefitsOther
benefits
Cash perfor-mance bonus1
Dividends (R’000)10
LTI reflected2,3
Total single figure
remune-ration
Executive directorsCB Thomson4,5,6 3 490 703 95 32 847 5 852 216 2 235 45 437 108 9 179 9 287 D Sewela 7 121 1 096 268 3 7 079 263 3 350 19 179 8 537 1 301 285 3 10 787 359 8 458 29 729 DG Wilson 4 239 1 056 246 2 3 605 188 1 544 10 879 4 655 1 187 273 3 4 756 119 6 302 17 295
Prescribed officersPJ Bulterman7,8 5 258 860 251 3 5 154 188 1 544 13 257 2 916 25 360 1 459 2 958 – – 7 718 E Leeka9 3 548 621 430 1 369 3 527 95 630 10 219 4 224 692 469 1 369 2 897 165 2 989 12 805 PK Rankin9 4 020 756 161 1 369 3 879 173 1 926 12 284 4 278 805 161 1 375 3 930 185 5 562 16 295
Total 24 186 4 389 1 356 2 746 23 244 905 8 993 65 819 24 610 4 010 1 547 4 208 25 327 829 23 312 83 842 1 Bonuses related to the performance in 2017 and 2018 financial years. 2 The 2017 LTI reflected includes the value of the SARS and FSPs (with performance conditions) awards made on 30 March 2015 with a performance period
ending on 30 September 2017 and FSPs without performance conditions that were granted on 29 March 2017.3 The 2018 LTI reflected includes the value of the SARS and FSPs (with performance conditions) awards made on 30 March 2016 with a performance period
ending on 30 September 2018 and FSPs without performance conditions that were granted on 31 January 2018.4 CB Thomson resigned from the company on 8 February 2017.5 Other benefits relate to severance pay, leave pay and long service awards.6 The LTIs reflected for CB Thomson relate to LTIs that he continues to hold that will remain subject to originally set performance conditions and performance
periods.7 PJ Bulterman was only a prescribed officer for only a part of the 2018 financial year.8 PJ Bulterman's other benefits for 2018 include a retirement benefit and leave pay that were due.9 Other benefits for E Leeka and PK Rankin include retention bonuses.10 Dividends paid in relation to performance shares not yet included in the single figure in prior years.
109 Barloworld LimitedIntegrated Report 2018

Unvested and settled LTI awardsIn line with the new reporting requirements of King IV, the number of unvested and settled LTIs are disclosed below.
2017 2018
Award date
Opening number on 1 October
2016
Granted during 2017
Forfeited/lapsed during 2017
Exercised/settled during 2017
Closing number on
30 September 2017
Cash value on
settlement during 201722
Closing estimated
fair value at 30 September
2017
Granted during
2018
Forfeited/lapsed during
2018
Exercised/settled during
2018
Closing number on
30 September 2018
Cash value on
settlement during
201822
Closing estimated
fair value at 30 September
2018
Number of awards
Number of awards
Number of awards
Number of awards
Number of awards ZAR ZAR
Number of awards
Number of awards
Number of awards
Number of awards ZAR ZAR
Strike price
D SewelaShare Appreciation Right Plan11
28 February 2011 15 758 (15 758) – 573 591 – – – 70.8330 March 2012 19 590 (13 060) 6 530 140 395 187 933 (6 530) – 467 026 – 96.4819 March 2013 31 510 (21 006) 10 504 559 495 362 703 10 504 333 187 90.7318 March 201418 35 060 (35 060) – – – – 106.8230 March 201518 50 340 50 340 – (50 340) – – 90.7730 March 2016 65 350 65 350 3 896 014 65 350 3 572 554 72.7729 March 2017 85 920 85 920 3 431 271 85 920 3 259 522 121.53 31 January 2018 – – 137 540 137 540 3 543 536 177.71
Forfeitable Share Plan – with performance conditions12
18 March 201419 18 630 (15 090) (3 540) – 497 066 – – 30 March 201519 23 700 23 700 84 135 1 543 704 (11 376) (12 324) – 2 039 480 – 30 March 2016 34 610 34 610 122 866 3 862 707 34 610 141 901 4 237 995 29 March 2017 44 580 44 580 55 725 5 584 091 44 580 182 778 5 458 821 31 January 201821 – – 16 430 16 430 34 667 2 011 854
Forfeitable Share Plan – no performance conditions13
18 March 201420 6 210 (6 210) – 811 088 – – 30 March 201520 7 900 7 900 28 045 989 554 (7 900) – 1 306 265 – 30 March 2016 11 540 11 540 40 967 1 445 500 11 540 47 314 1 413 073 29 March 2017 14 860 14 860 18 575 1 861 364 14 860 60 926 1 819 607 31 January 201821 – – 5 480 5 480 11 563 671 026
2 931 948 23 164 841 4 291 920 26 321 174
Remuneration report 110 Barloworld LimitedIntegrated Report 2018
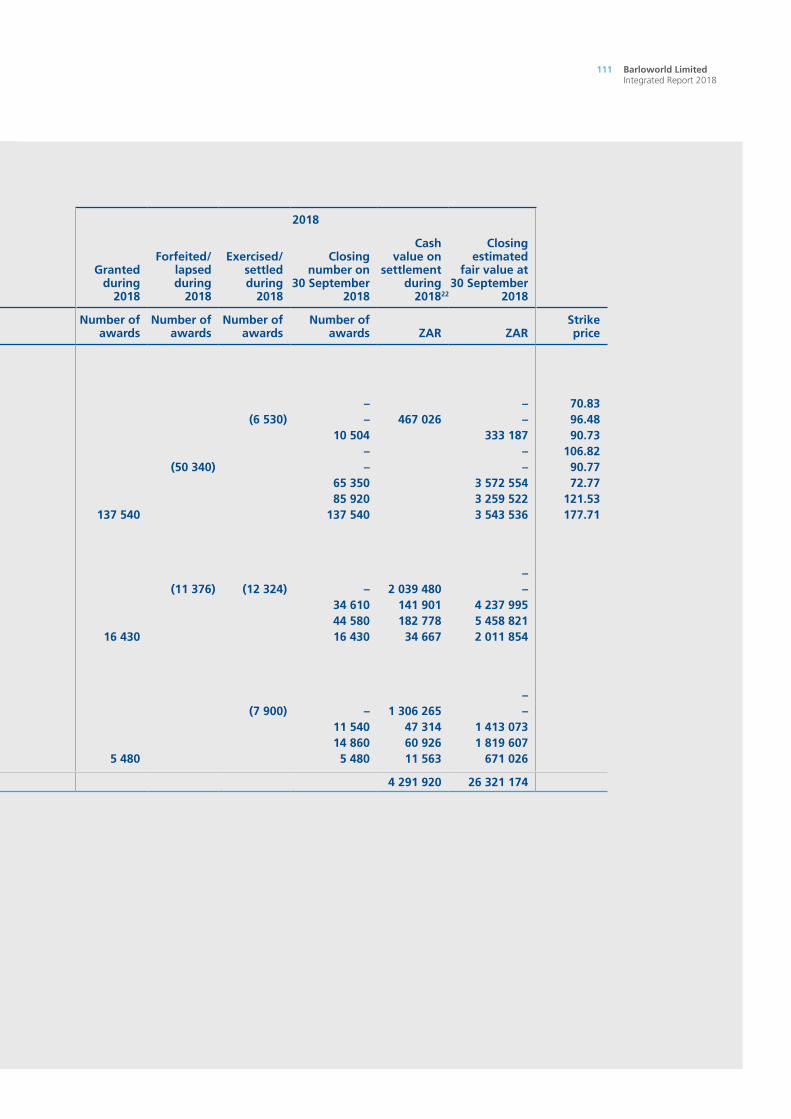
Unvested and settled LTI awardsIn line with the new reporting requirements of King IV, the number of unvested and settled LTIs are disclosed below.
2017 2018
Award date
Opening number on 1 October
2016
Granted during 2017
Forfeited/lapsed during 2017
Exercised/settled during 2017
Closing number on
30 September 2017
Cash value on
settlement during 201722
Closing estimated
fair value at 30 September
2017
Granted during
2018
Forfeited/lapsed during
2018
Exercised/settled during
2018
Closing number on
30 September 2018
Cash value on
settlement during
201822
Closing estimated
fair value at 30 September
2018
Number of awards
Number of awards
Number of awards
Number of awards
Number of awards ZAR ZAR
Number of awards
Number of awards
Number of awards
Number of awards ZAR ZAR
Strike price
D SewelaShare Appreciation Right Plan11
28 February 2011 15 758 (15 758) – 573 591 – – – 70.8330 March 2012 19 590 (13 060) 6 530 140 395 187 933 (6 530) – 467 026 – 96.4819 March 2013 31 510 (21 006) 10 504 559 495 362 703 10 504 333 187 90.7318 March 201418 35 060 (35 060) – – – – 106.8230 March 201518 50 340 50 340 – (50 340) – – 90.7730 March 2016 65 350 65 350 3 896 014 65 350 3 572 554 72.7729 March 2017 85 920 85 920 3 431 271 85 920 3 259 522 121.53 31 January 2018 – – 137 540 137 540 3 543 536 177.71
Forfeitable Share Plan – with performance conditions12
18 March 201419 18 630 (15 090) (3 540) – 497 066 – – 30 March 201519 23 700 23 700 84 135 1 543 704 (11 376) (12 324) – 2 039 480 – 30 March 2016 34 610 34 610 122 866 3 862 707 34 610 141 901 4 237 995 29 March 2017 44 580 44 580 55 725 5 584 091 44 580 182 778 5 458 821 31 January 201821 – – 16 430 16 430 34 667 2 011 854
Forfeitable Share Plan – no performance conditions13
18 March 201420 6 210 (6 210) – 811 088 – – 30 March 201520 7 900 7 900 28 045 989 554 (7 900) – 1 306 265 – 30 March 2016 11 540 11 540 40 967 1 445 500 11 540 47 314 1 413 073 29 March 2017 14 860 14 860 18 575 1 861 364 14 860 60 926 1 819 607 31 January 201821 – – 5 480 5 480 11 563 671 026
2 931 948 23 164 841 4 291 920 26 321 174
111 Barloworld LimitedIntegrated Report 2018

2017 2018
Award date
Opening number on 1 October
2016
Granted during 2017
Forfeited/lapsed during 2017
Exercised/settled during 2017
Closing number on
30 September 2017
Cash value on
settlement during 201722
Closing estimated
fair value at 30 September
2017
Granted during
2018
Forfeited/lapsed during
2018
Exercised/settled during
2018
Closing number on
30 September 2018
Cash value on
settlement during
201822
Closing estimated
fair value at 30 September
2018
Number of awards
Number of awards
Number of awards
Number of awards
Number of awards ZAR ZAR
Number of awards
Number of awards
Number of awards
Number of awards ZAR ZAR
Strike price
CB Thomson14
Share Appreciation Right Plan11
30 March 2012 72 000 – (72 000) – 1 342 320 – – – 96.4819 March 2013 80 440 (53 626) 26 814 1 417 603 925 887 (26 814) – 2 179 174 – 90.7318 March 201418 67 010 (67 010) – – – – 106.8230 March 201518 96 950 96 950 – (96 950) – – 90.7730 March 201615 119 560 119 560 7 127 888 119 560 6 536 106 72.77
Forfeitable Share Plan – with performance conditions12
18 March 201419 35 600 (28 836) (6 764) – 949 769 – – – 30 March 201519 45 650 (11 340) 34 310 121 801 2 234 789 (16 469) (17 841) – 2 952 513 – 30 March 201615 63 320 (36 869) 26 451 93 901 2 952 108 26 451 108 449 3 238 925
Forfeitable Share Plan – no performance conditions13
18 March 201420 11 870 (11 870) – 1 550 341 – – – 30 March 201520 15 220 (3 781) (11 439) – 1 521 769 – – – 30 March 201616 21 110 (12 292) (8 818) – 1 206 378 – – –
8 203 882 13 240 672 5 240 136 9 775 031
DG Wilson17
Share Appreciation Right Plan11
30 March 2012 35 000 (35 000) – 526 417 – – – 96.4819 March 2013 43 840 (29 226) 14 614 772 589 504 621 (14 614) – 1 051 770 – 90.7318 March 201418 35 060 (35 060) – – – – 106.8230 March 201518 50 340 50 340 – (50 340) – – 90.7730 March 2016 55 030 55 030 3 280 760 55 030 3 008 380 72.77
Forfeitable Share Plan – with performance conditions12
18 March 201419 18 630 (15 090) (3 540) – 497 066 – – – 30 March 201519 23 700 23 700 84 135 1 543 704 (11 376) (12 324) – 1 985 349 – 30 March 2016 29 140 29 140 103 447 3 252 218 29 140 119 474 3 568 193
Forfeitable Share Plan – no performance conditions13
18 March 201420 6 210 (6 210) – 811 088 – – – 30 March 201520 7 900 7 900 28 045 989 554 (7 900) – 1 253 335 – 30 March 2016 9 710 9 710 34 471 1 216 275 9 710 39 811 1 188 990
2 857 258 10 787 132 4 449 739 7 765 562
Remuneration report 112 Barloworld LimitedIntegrated Report 2018

2017 2018
Award date
Opening number on 1 October
2016
Granted during 2017
Forfeited/lapsed during 2017
Exercised/settled during 2017
Closing number on
30 September 2017
Cash value on
settlement during 201722
Closing estimated
fair value at 30 September
2017
Granted during
2018
Forfeited/lapsed during
2018
Exercised/settled during
2018
Closing number on
30 September 2018
Cash value on
settlement during
201822
Closing estimated
fair value at 30 September
2018
Number of awards
Number of awards
Number of awards
Number of awards
Number of awards ZAR ZAR
Number of awards
Number of awards
Number of awards
Number of awards ZAR ZAR
Strike price
CB Thomson14
Share Appreciation Right Plan11
30 March 2012 72 000 – (72 000) – 1 342 320 – – – 96.4819 March 2013 80 440 (53 626) 26 814 1 417 603 925 887 (26 814) – 2 179 174 – 90.7318 March 201418 67 010 (67 010) – – – – 106.8230 March 201518 96 950 96 950 – (96 950) – – 90.7730 March 201615 119 560 119 560 7 127 888 119 560 6 536 106 72.77
Forfeitable Share Plan – with performance conditions12
18 March 201419 35 600 (28 836) (6 764) – 949 769 – – – 30 March 201519 45 650 (11 340) 34 310 121 801 2 234 789 (16 469) (17 841) – 2 952 513 – 30 March 201615 63 320 (36 869) 26 451 93 901 2 952 108 26 451 108 449 3 238 925
Forfeitable Share Plan – no performance conditions13
18 March 201420 11 870 (11 870) – 1 550 341 – – – 30 March 201520 15 220 (3 781) (11 439) – 1 521 769 – – – 30 March 201616 21 110 (12 292) (8 818) – 1 206 378 – – –
8 203 882 13 240 672 5 240 136 9 775 031
DG Wilson17
Share Appreciation Right Plan11
30 March 2012 35 000 (35 000) – 526 417 – – – 96.4819 March 2013 43 840 (29 226) 14 614 772 589 504 621 (14 614) – 1 051 770 – 90.7318 March 201418 35 060 (35 060) – – – – 106.8230 March 201518 50 340 50 340 – (50 340) – – 90.7730 March 2016 55 030 55 030 3 280 760 55 030 3 008 380 72.77
Forfeitable Share Plan – with performance conditions12
18 March 201419 18 630 (15 090) (3 540) – 497 066 – – – 30 March 201519 23 700 23 700 84 135 1 543 704 (11 376) (12 324) – 1 985 349 – 30 March 2016 29 140 29 140 103 447 3 252 218 29 140 119 474 3 568 193
Forfeitable Share Plan – no performance conditions13
18 March 201420 6 210 (6 210) – 811 088 – – – 30 March 201520 7 900 7 900 28 045 989 554 (7 900) – 1 253 335 – 30 March 2016 9 710 9 710 34 471 1 216 275 9 710 39 811 1 188 990
2 857 258 10 787 132 4 449 739 7 765 562
113 Barloworld LimitedIntegrated Report 2018

2017 2018
Award date
Opening number on 1 October
2016
Granted during 2017
Forfeited/lapsed during 2017
Exercised/settled during 2017
Closing number on
30 September 2017
Cash value on
settlement during 201722
Closing estimated
fair value at 30 September
2017
Granted during
2018
Forfeited/lapsed during
2018
Exercised/settled during
2018
Closing number on
30 September 2018
Cash value on
settlement during
201822
Closing estimated
fair value at 30 September
2018
Number of awards
Number of awards
Number of awards
Number of awards
Number of awards ZAR ZAR
Number of awards
Number of awards
Number of awards
Number of awards ZAR ZAR
Strike price
PJ Bulterman17
Share Appreciation Right Plan11
28 February 2011 24 667 (24 667) – 890 725 – – – 70.8330 March 2012 35 000 35 000 1 007 300 (35 000) – 2 656 500 – 96.4819 March 2013 43 840 43 840 1 513 795 43 840 1 390 605 90.7318 March 201418 35 060 (35 060) – – – – 106.8230 March 201518 50 340 50 340 – (50 340) – – 90.77
Forfeitable Share Plan – with performance conditions12
18 March 201419 18 630 (15 090) (3 540) – 497 066 – – – 30 March 201519 23 700 23 700 84 135 1 543 704 (11 376) (12 324) – 2 054 117 –
Forfeitable Share Plan – no performance conditions13
18 March 201420 6 210 (6 210) – 811 088 – – – 30 March 201520 7 900 7 900 28 045 989 554 (7 900) – 1 276 482 –
2 311 060 5 054 353 5 987 099 1 390 605
E LeekaShare Appreciation Right Plan11
19 March 2013 45 740 45 740 1 579 402 45 740 1 450 873 90.7318 March 201418 38 510 (38 510) – – – – 106.8230 March 201518 55 620 55 620 – -55 620 – – 90.7730 March 2016 – – – – 72.7729 March 2017 29 950 29 950 1 196 073 29 950 1 136 204 121.53 31 March 2018 – – 55 270 55 270 1 423 958 177.71
Forfeitable Share Plan – with performance conditions12
30 March 2016 21 220 21 220 75 331 2 368 293 21 220 87 002 2 598 389 29 March 2017 15 540 15 540 19 425 1 946 540 15 540 63 714 1 902 873 31 January 201821 – – 6 600 6 600 13 926 808 170
Forfeitable Share Plan – no performance conditions13
18 March 201420 3 430 (3 430) – 447 992 – – – 30 March 201520 4 390 4 390 15 585 549 891 -4 390 – 696 474 – 30 March 2016 7 070 7 070 25 099 885 588 7 070 28 987 865 722 29 March 2017 5 180 5 180 6 475 648 847 5 180 21 238 634 291 31 January 201821 – – 2 200 2 200 4 642 269 390
589 906 9 174 635 915 983 11 089 870
Remuneration report 114 Barloworld LimitedIntegrated Report 2018
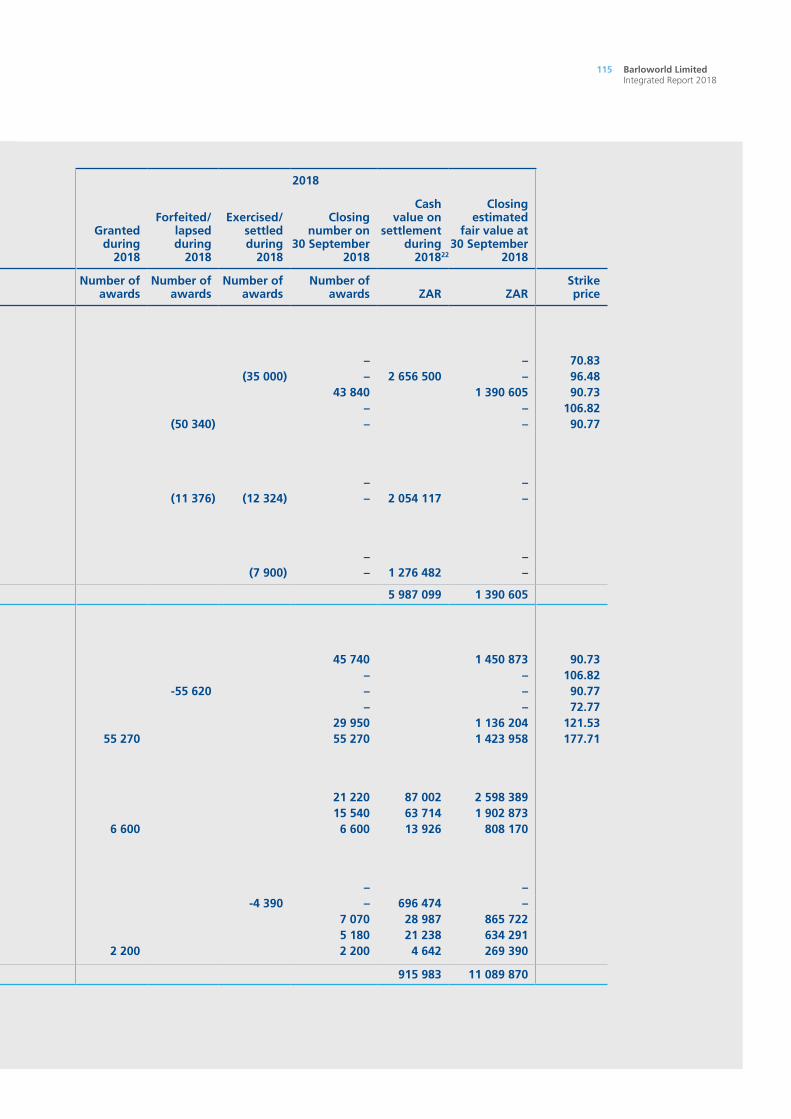
2017 2018
Award date
Opening number on 1 October
2016
Granted during 2017
Forfeited/lapsed during 2017
Exercised/settled during 2017
Closing number on
30 September 2017
Cash value on
settlement during 201722
Closing estimated
fair value at 30 September
2017
Granted during
2018
Forfeited/lapsed during
2018
Exercised/settled during
2018
Closing number on
30 September 2018
Cash value on
settlement during
201822
Closing estimated
fair value at 30 September
2018
Number of awards
Number of awards
Number of awards
Number of awards
Number of awards ZAR ZAR
Number of awards
Number of awards
Number of awards
Number of awards ZAR ZAR
Strike price
PJ Bulterman17
Share Appreciation Right Plan11
28 February 2011 24 667 (24 667) – 890 725 – – – 70.8330 March 2012 35 000 35 000 1 007 300 (35 000) – 2 656 500 – 96.4819 March 2013 43 840 43 840 1 513 795 43 840 1 390 605 90.7318 March 201418 35 060 (35 060) – – – – 106.8230 March 201518 50 340 50 340 – (50 340) – – 90.77
Forfeitable Share Plan – with performance conditions12
18 March 201419 18 630 (15 090) (3 540) – 497 066 – – – 30 March 201519 23 700 23 700 84 135 1 543 704 (11 376) (12 324) – 2 054 117 –
Forfeitable Share Plan – no performance conditions13
18 March 201420 6 210 (6 210) – 811 088 – – – 30 March 201520 7 900 7 900 28 045 989 554 (7 900) – 1 276 482 –
2 311 060 5 054 353 5 987 099 1 390 605
E LeekaShare Appreciation Right Plan11
19 March 2013 45 740 45 740 1 579 402 45 740 1 450 873 90.7318 March 201418 38 510 (38 510) – – – – 106.8230 March 201518 55 620 55 620 – -55 620 – – 90.7730 March 2016 – – – – 72.7729 March 2017 29 950 29 950 1 196 073 29 950 1 136 204 121.53 31 March 2018 – – 55 270 55 270 1 423 958 177.71
Forfeitable Share Plan – with performance conditions12
30 March 2016 21 220 21 220 75 331 2 368 293 21 220 87 002 2 598 389 29 March 2017 15 540 15 540 19 425 1 946 540 15 540 63 714 1 902 873 31 January 201821 – – 6 600 6 600 13 926 808 170
Forfeitable Share Plan – no performance conditions13
18 March 201420 3 430 (3 430) – 447 992 – – – 30 March 201520 4 390 4 390 15 585 549 891 -4 390 – 696 474 – 30 March 2016 7 070 7 070 25 099 885 588 7 070 28 987 865 722 29 March 2017 5 180 5 180 6 475 648 847 5 180 21 238 634 291 31 January 201821 – – 2 200 2 200 4 642 269 390
589 906 9 174 635 915 983 11 089 870
115 Barloworld LimitedIntegrated Report 2018

2017 2018
Award date
Opening number on 1 October
2016
Granted during 2017
Forfeited/lapsed during 2017
Exercised/settled during 2017
Closing number on
30 September 2017
Cash value on
settlement during 201722
Closing estimated
fair value at 30 September
2017
Granted during
2018
Forfeited/lapsed during
2018
Exercised/settled during
2018
Closing number on
30 September 2018
Cash value on
settlement during
201822
Closing estimated
fair value at 30 September
2018
Number of awards
Number of awards
Number of awards
Number of awards
Number of awards ZAR ZAR
Number of awards
Number of awards
Number of awards
Number of awards ZAR ZAR
Strike price
PK RankinShare Appreciation Right Plan11
28 February 2011 28 940 (28 940) – 1 304 326 – – – 70.8330 March 2012 24 710 (24 710) – 649 869 – – – 96.4819 March 2013 39 260 (13 086) 26 174 431 184 903 788 (26 174) – 1 509 716 – 90.7318 March 201418 33 210 -33 210 – – – – 106.8230 March 201518 39 220 39 220 – (39 220) – – 90.7730 March 2016 45 150 45 150 2 691 737 45 150 2 468 260 72.7729 March 2017 34 430 34 430 1 374 984 34 430 1 306 161 121.53 31 January 2018 – – 55 270 55 270 1 423 958 177.71
Forfeitable Share Plan – with performance conditions12
30 March 201519 18 470 18 470 65 569 1 203 047 (8 866) (9 604) – 1 547 232 – 30 March 2016 23 910 23 910 84 881 2 668 515 23 910 98 031 2 927 780 29 March 2017 17 860 17 860 22 325 2 237 144 17 860 73 226 2 186 957 31 January 201821 – – 6 600 6 600 13 926 808 170
Forfeitable Share Plan – no performance conditions13
18 March 201420 2 960 (2 960) – 386 606 – – – 30 March 201520 6 160 6 160 21 868 771 602 (6 160) – 977 284 – 30 March 2016 7 970 7 970 28 294 998 322 7 970 32 677 975 927 29 March 2017 5 950 5 950 7 438 745 297 5 950 24 395 728 578 31 January 201821 – – 2 200 2 200 4 642 269 390
3 002 358 13 594 437 4 281 129 13 095 180 11 The estimated fair value of SARs which have vested but remain unexercised and which are within 12 months from vesting after year end was determined
using the year end 30-day VWAP of R125.26 (2017) and R122.45 (2018) less the strike price and adjusted by the likelihood of performance conditions being met as at each year end. The fair value of SARs which are more than 12 months from vesting after year end was determined on a similar basis except that an indicative valuation was performed to determine the value of an instrument. The following vesting percentages were used for the 2017 fair value calculations: 0% (2014 allocation), 0% (2015 allocation) and 100% (2016 and 2017 allocation). 2018 fair value calculations were based on the following estimated vesting percentages: 0% (2015 allocation), 100% (2016, 2017 and 2018 allocation).
12 The estimated fair value of FSPs with performance conditions was determined using the year end 30-day VWAP of R125.26 (2017) and R122.45 (2018) adjusted by the estimated likelihood of performance conditions being met as at each year-end. The following vesting percentages were used for the 2017 fair value calculations: 52% (2015 allocation), 100% (2016 allocation) and 100% (2017 allocation). 2018 fair value calculations were based on the following estimated vesting percentages: 89.10% (2016 allocation), 100% (2017 allocation) and 100% (2018 allocation).
13 The estimated fair value for the FSPs without performance conditions was determined based on the year end 30-day VWAP of R125.26 and R122.45 for 2017 and 2018 respectively.
14 CB Thomson resigned from the company on 8 February 2017. No LTI allocations were made to him in 2017.15 CB Thomson continues to hold SARs and FSPs with performance conditions that were allocated to him on 30 March 2016. These will remain subject to
originally set performance conditions and performance period.16 On the date of his resignation from the company a portion of the FSP awards without performance conditions were forfeited and a portion vested
immediately.17 As of 2016 PJ Bulterman, and DG Wilson (2017) were not eligible for LTI allocations as they were within three years of retirement.18 The SAR allocation on 18 March 2014 and 30 March 2015 were forfeited on 18 March 2017 and 30 March 2018 respectively as the performance conditions
were not met.19 The FSPs with performance conditions allocated on 18 March 2014 and 30 March 2015 vested on 18 March 2017 and 29 March 2018. The vesting
percentages for the allocations are 19% and 52% respectively.20 The FSPs with no performance conditions allocated on 18 March 2014 and 30 March 2015 vested on 18 March 2017 and 29 March 2018 respectively.21 The company was trading under cautionary from 1 February 2018. This resulted in a prohibited period which restricted the company from making any
equity-settled awards. Therefore, cash-settled notional FSPs were allocated to participants. 22 Represents the value of shares vested during the year and dividends received on FSPs.
Remuneration report 116 Barloworld LimitedIntegrated Report 2018

2017 2018
Award date
Opening number on 1 October
2016
Granted during 2017
Forfeited/lapsed during 2017
Exercised/settled during 2017
Closing number on
30 September 2017
Cash value on
settlement during 201722
Closing estimated
fair value at 30 September
2017
Granted during
2018
Forfeited/lapsed during
2018
Exercised/settled during
2018
Closing number on
30 September 2018
Cash value on
settlement during
201822
Closing estimated
fair value at 30 September
2018
Number of awards
Number of awards
Number of awards
Number of awards
Number of awards ZAR ZAR
Number of awards
Number of awards
Number of awards
Number of awards ZAR ZAR
Strike price
PK RankinShare Appreciation Right Plan11
28 February 2011 28 940 (28 940) – 1 304 326 – – – 70.8330 March 2012 24 710 (24 710) – 649 869 – – – 96.4819 March 2013 39 260 (13 086) 26 174 431 184 903 788 (26 174) – 1 509 716 – 90.7318 March 201418 33 210 -33 210 – – – – 106.8230 March 201518 39 220 39 220 – (39 220) – – 90.7730 March 2016 45 150 45 150 2 691 737 45 150 2 468 260 72.7729 March 2017 34 430 34 430 1 374 984 34 430 1 306 161 121.53 31 January 2018 – – 55 270 55 270 1 423 958 177.71
Forfeitable Share Plan – with performance conditions12
30 March 201519 18 470 18 470 65 569 1 203 047 (8 866) (9 604) – 1 547 232 – 30 March 2016 23 910 23 910 84 881 2 668 515 23 910 98 031 2 927 780 29 March 2017 17 860 17 860 22 325 2 237 144 17 860 73 226 2 186 957 31 January 201821 – – 6 600 6 600 13 926 808 170
Forfeitable Share Plan – no performance conditions13
18 March 201420 2 960 (2 960) – 386 606 – – – 30 March 201520 6 160 6 160 21 868 771 602 (6 160) – 977 284 – 30 March 2016 7 970 7 970 28 294 998 322 7 970 32 677 975 927 29 March 2017 5 950 5 950 7 438 745 297 5 950 24 395 728 578 31 January 201821 – – 2 200 2 200 4 642 269 390
3 002 358 13 594 437 4 281 129 13 095 180 11 The estimated fair value of SARs which have vested but remain unexercised and which are within 12 months from vesting after year end was determined
using the year end 30-day VWAP of R125.26 (2017) and R122.45 (2018) less the strike price and adjusted by the likelihood of performance conditions being met as at each year end. The fair value of SARs which are more than 12 months from vesting after year end was determined on a similar basis except that an indicative valuation was performed to determine the value of an instrument. The following vesting percentages were used for the 2017 fair value calculations: 0% (2014 allocation), 0% (2015 allocation) and 100% (2016 and 2017 allocation). 2018 fair value calculations were based on the following estimated vesting percentages: 0% (2015 allocation), 100% (2016, 2017 and 2018 allocation).
12 The estimated fair value of FSPs with performance conditions was determined using the year end 30-day VWAP of R125.26 (2017) and R122.45 (2018) adjusted by the estimated likelihood of performance conditions being met as at each year-end. The following vesting percentages were used for the 2017 fair value calculations: 52% (2015 allocation), 100% (2016 allocation) and 100% (2017 allocation). 2018 fair value calculations were based on the following estimated vesting percentages: 89.10% (2016 allocation), 100% (2017 allocation) and 100% (2018 allocation).
13 The estimated fair value for the FSPs without performance conditions was determined based on the year end 30-day VWAP of R125.26 and R122.45 for 2017 and 2018 respectively.
14 CB Thomson resigned from the company on 8 February 2017. No LTI allocations were made to him in 2017.15 CB Thomson continues to hold SARs and FSPs with performance conditions that were allocated to him on 30 March 2016. These will remain subject to
originally set performance conditions and performance period.16 On the date of his resignation from the company a portion of the FSP awards without performance conditions were forfeited and a portion vested
immediately.17 As of 2016 PJ Bulterman, and DG Wilson (2017) were not eligible for LTI allocations as they were within three years of retirement.18 The SAR allocation on 18 March 2014 and 30 March 2015 were forfeited on 18 March 2017 and 30 March 2018 respectively as the performance conditions
were not met.19 The FSPs with performance conditions allocated on 18 March 2014 and 30 March 2015 vested on 18 March 2017 and 29 March 2018. The vesting
percentages for the allocations are 19% and 52% respectively.20 The FSPs with no performance conditions allocated on 18 March 2014 and 30 March 2015 vested on 18 March 2017 and 29 March 2018 respectively.21 The company was trading under cautionary from 1 February 2018. This resulted in a prohibited period which restricted the company from making any
equity-settled awards. Therefore, cash-settled notional FSPs were allocated to participants. 22 Represents the value of shares vested during the year and dividends received on FSPs.
117 Barloworld LimitedIntegrated Report 2018

Non-executive directors’ fees for 2018Fees for NEDs during the current financial year are set out on page 5 of the consolidated annual financial statements, as approved by the remuneration committee and by the board, on authority granted by shareholders at the annual general meeting held on 31 January 2018.
Proposed non-executive director fees for 2019Refer to the special resolution section set out in the notice of annual general meeting for approval by shareholders in terms of section 66 of the Companies Act on page 6 of the AGM booklet.
Non-binding advisory voteShareholders are requested to cast a non-binding advisory vote on the aforementioned part 3 of this report.
NP DongwanaChairperson of the remuneration committee
Remuneration report 118 Barloworld LimitedIntegrated Report 2018

Shareholder profile
PUBLIC AND NON-PUBLIC SHAREHOLDING OF ORDINARY SHARES
Shareholder typeNumber
of holders% of total
shareholdersNumber
of shares% of issued
capital
Non-public shareholders 9 0.10 643 614 0.30– Directors, prescribed officers and associates 8 0.09 609 935 0.29– Employee and educational trusts 1 0.01 33 679 0.02Public shareholders 9 198 99.90 212 048 964 99.70
Total 9 207 100.00 212 692 578 100.00
REGISTERED SHAREHOLDER SPREAD
Shareholder spreadNumber
of holders% of total
shareholdersNumber
of shares% of issued
capital
1 – 1 000 shares 6 825 74.13 2 181 218 1.031 001 – 10 000 shares 1 703 18.50 5 255 559 2.4710 001 – 100 000 shares 504 5.47 16 591 168 7.80100 001 – 1 000 000 shares 141 1.53 41 702 573 19.611 000 001 shares and above 34 0.37 146 962 060 69.10
Total 9 207 100.00 212 692 578 100.00
BENEFICIAL SHAREHOLDINGS
Beneficial shareholdingsTotal
shareholding %
Government Employees Pension Fund (PIC) 34 423 067 16.18WGI Emerging Markets Fund LLC 10 209 595 4.80
Total 44 632 662 20.98
INVESTMENT MANAGERS HOLDING 5% OR MORE
Investment managerTotal
shareholding %
PIC 33 421 992 15.71Westwood Global Investments LLC 21 762 819 10.23Dimensional Fund Advisers 13 798 342 6.49
GEOGRAPHIC SPLIT OF BENEFICIAL SHAREHOLDERS
RegionTotal
shareholding% of issued
capital
South Africa 92 974 558 43.71 United States of America and Canada 72 671 202 34.17 United Kingdom 18 406 844 8.65 Rest of Europe 14 389 986 6.77 Rest of World 14 249 988 6.70
Total 212 692 578 100.00
GRI 102-5
119 Barloworld LimitedIntegrated Report 2018

Summarised consolidated income statementfor the year ended 30 September
Audited
Note 2018
Rm2017
Rm%
change
CONTINUING OPERATIONSRevenue 63 420 61 959 2
Operating profit before items listed below (EBITDA) 6 978 6 694Depreciation (2 433) (2 468)Amortisation of intangible assets (141) (144)
Operating profit 4 404 4 082 8Fair value adjustments on financial instruments (133) (209)Finance costs (1 182) (1 329)Income from investments 147 109
Profit before non-operating and capital items 3 236 2 653 22Non-operating and capital items 3 (248) (155)
Profit before taxation 2 988 2 498Taxation (950) (565)
Profit after taxation 2 038 1 933 5Income from associates and joint ventures 235 93
Profit for the year from continuing operations 2 273 2 026 12
DISCONTINUED OPERATIONSProfit/(loss) from discontinued operation 6 1 647 (269)
Profit for the year 3 920 1 757Net profit attributable to:Owners of Barloworld Limited 3 846 1 643 134Non-controlling interest in subsidiaries 74 114
3 920 1 757
Earnings per share from group (cents)– basic 1 823.8 779.6 – diluted 1 812.9 774.7 Earnings per share from continuing operations (cents)– basic 1 042.8 907.2 – diluted 1 036.5 901.5 Earnings/(loss) per share from discontinued operation (cents)– basic 781.0 (127.6)– diluted 776.4 (126.8)
GRI 201-1 to 201-4
120 Barloworld LimitedIntegrated Report 2018

Summarised consolidated statement of other comprehensive incomefor the year ended 30 September
Audited
2018Rm
2017Rm
Profit for the year 3 920 1 757 Items that may be reclassified subsequently to loss or profit: (874) 75
Exchange gains on translation of foreign operations 645 8 Translation reserves realised on disposal of foreign subsidiaries (1 502)(Loss)/gain on cash flow hedges (23) 89 Deferred taxation on cash flow hedges 6 (22)
Items that will not be reclassified to profit or loss: 345 535 Actuarial gains on post-retirement benefit obligations 415 678 Taxation effect of net actuarial losses (70) (143)
Other comprehensive (loss)/income for the year, net of taxation (529) 610
Total other comprehensive income for the year 3 391 2 367
Total other comprehensive income attributable to:Owners of Barloworld Limited 3 317 2 253 Non-controlling interest in subsidiaries 74 114
3 391 2 367
121 Barloworld LimitedIntegrated Report 2018

Summarised consolidated statement of financial positionat 30 September
Audited
Note 2018
Rm2017
Rm
ASSETSNon-current assets 19 231 18 613
Property, plant and equipment 12 657 12 659Goodwill 1 873 1 932Intangible assets 1 528 1 602Investment in associates and joint ventures 1 343 1 093Finance lease receivables 211 240Long-term financial assets 909 404Deferred taxation assets 710 683
Current assets 29 531 24 368Vehicle rental fleet 3 058 3 222Inventories 9 592 8 457Trade and other receivables 8 883 8 676Taxation 105 88Cash and cash equivalents 7 893 3 925
Assets classified as held for sale 6 497 3 343
Total assets 49 259 46 324
EQUITY AND LIABILITIESCapital and reservesShare capital and premium 441 441Other reserves 4 194 5 144Retained income 17 598 14 690
Interest of shareholders of Barloworld Limited 22 233 20 275Non-controlling interest 517 602
Interest of all shareholders 22 750 20 877Non-current liabilities 8 917 10 852
Interest-bearing 5 995 7 623Deferred taxation liabilities 632 538Provisions 47 19Other non-current liabilities 2 243 2 672
Current liabilities 17 466 13 798Trade and other payables 11 122 10 697Provisions 1 100 929Taxation 70 117Amounts due to bankers and short-term loans 5 174 2 055
Liabilities directly associated with assets classified as held for sale 6 126 797
Total equity and liabilities 49 259 46 324
122 Barloworld LimitedIntegrated Report 2018

Summarised consolidated statement of changes in equityat 30 September
Audited
Share capital
and premium
Rm
Otherreserves
Rm
Retainedincome
Rm
Attribu-table to
Barloworld Limited
share-holders
Rm
Non-controlling
interestRm
Interest of all
share-holders
Rm
Balance at 1 October 2016 441 5 134 13 367 18 942 737 19 679
Total comprehensive income for the year 75 2 178 2 253 114 2 367
Transactions with owners, recorded directly in equity
Other reserve movements (154) 32 (122) (122)Other changes in minority
shareholders’ interest and minority loans 89 (132) (43) (201) (244)
Dividends (755) (755) (48) (803)
Balance at 30 September 2017 441 5 144 14 690 20 275 602 20 877
Total comprehensive (loss)/income for the year (874) 4 191 3 317 74 3 391
Transactions with owners, recorded directly in equity
Other reserve movements (41) 55 14 (3) 11Other changes in minority
shareholders’ interest and minority loans (183) (183) (75) (258)
Disposal of subsidiary (35) (283) (318) (318)Dividends (872) (872) (81) (953)
Balance at 30 September 2018 441 4 194 17 598 22 233 517 22 750
123 Barloworld LimitedIntegrated Report 2018

Summarised consolidated statement of cash flowsfor the year ended 30 September
Audited
Notes 2018
Rm2017
Rm
CASH FLOWS FROM OPERATING ACTIVITIESOperating cash flows before movements in working capital 8 111 7 307Movement in working capital (2 065) 1 539
Cash generated from operations before investment in leasing and rental fleets 6 046 8 846Fleet leasing and equipment rental fleet (1 593) (1 661)
Additions (3 305) (3 550)Proceeds on disposal 1 713 1 889
Vehicles rental fleet (631) (1 220)Additions (3 921) (4 373)Proceeds on disposal 3 290 3 153
Cash generated from operations 3 822 5 965Finance costs (1 184) (1 338)Realised fair value adjustments on financial instruments (140) (270)Dividends received from investments, associates and joint ventures 113 13Interest received 147 108Taxation paid (1 058) (744)
Cash inflow from operations 1 700 3 734Dividends paid (including non-controlling interest) (953) (803)
Cash retained from operating activities 747 2 931
CASH FLOWS FROM INVESTING ACTIVITIESAcquisition of subsidiaries, investments and intangibles 4 (86) (393)Proceeds on disposal of subsidiaries, investments and intangibles 5 2 342 379Movements in investments in leasing receivables (53) (134)Acquisition of other property, plant and equipment (618) (774)
Replacement capital expenditure (244) (315)Expansion capital expenditure (374) (458)
Proceeds on disposal of property, plant and equipment 306 593
Net cash generated/(used) in investing activities 1 891 (329)
Net cash inflow before financing activities 2 638 2 602
CASH FLOWS FROM FINANCING ACTIVITIESShares repurchased for equity-settled share-based payment (43) (154)Purchase of non-controlling interest (257) (201)Non-controlling interest loan and equity movements 4Proceeds from long-term borrowings 2 956 4 260Repayment of long-term borrowings (3 322) (5 005)Movement in short-term interest-bearing liabilities 1 746 (546)
Net cash from/(used in) financing activities 1 080 (1 642)
Net increase in cash and cash equivalents 3 718 960Cash and cash equivalents at beginning of year 3 925 3 028Cash and cash equivalents held for sale at beginning of year 102Effect of foreign exchange rate movement on cash balance 167 39Effect of cash balances classified as held for sale (19) (102)
Cash and cash equivalents at end of year 7 893 3 925
Cash balances not available for use due to reserving restrictions 178 444
124 Barloworld LimitedIntegrated Report 2018

Summarised notes to the consolidated financial statementsfor the year ended 30 September
1. BASIS OF PREPARATIONThe summarised consolidated financial statements are prepared in accordance with the requirements of IAS 34: Interim Financial Reporting, and the requirements of the Companies Act of South Africa as applicable to the summarised financial statements. The accounting policies applied in the preparation of the consolidated financial statements are derived in terms of International Financial Reporting Standards and are consistent with those accounting policies applied in the preparation of the previous consolidated financial statements, with the exception of a change in estimate relating to the determination of the net realisable value (NRV) of rebuild components.
In the current year the Equipment Southern Africa Rebuild Centre was certified by Caterpillar. In order to receive certification the Rebuild Centre had to demonstrate excellence in quality, efficiency, capacity, image, administration and continuous improvements. This certification, together with operational efficiencies, has resulted in increased margins being earned on rebuilt components which management believes are sustainable into the foreseeable future. This has resulted in a change in determining the scale applied to estimating the NRV of rebuilt components and in the determination of inventory turns. This change in methodology to estimate the NRV provision recognised against rebuilt components is considered a change in estimate in accordance with IAS 8: Accounting policies, changes estimates and errors. This change has been accounted for prospectively in the current year. Applying the previous methodology, the NRV provision against rebuilt components would have increased by R75 million in the year (income statement charge of R75 million). The revised estimate resulted in a reduction in the NRV provision against rebuilt components of R205 million. Therefore the net impact recognised in the income statement as income for the year was R130 million. Equipment Iberia was sold in the year and the results of this operation have been classified as a discontinued operation.
This set of summarised consolidated financial statements is a summary of the complete set of financial statements available for inspection at our registered office. An unmodified audit opinion was issued on the complete set of the consolidated financial statements.
These summarised consolidated financial statements and the complete set of the consolidated financial statements were prepared under the supervision of RL Pole CA(SA) (group general manager: finance).
Audited
2018Rm
2017Rm
2. RECONCILIATION OF NET PROFIT TO HEADLINE EARNINGSProfit attributable to Barloworld shareholders 3 846 1 643
Adjusted for the following:Loss on disposal of subsidiaries and investments (IFRS 10) (98) 25 Profit on disposal of plant, property, equipment and intangibles assets excluding rental assets (IAS 16 and IAS 38) (10) (43)Impairment of goodwill (IFRS 3) 70 73 Impairment of plant and equipment (IAS 16) and intangibles (IAS 38) and other assets 155 98 Impairment of investments in associates and joint ventures (IAS 36) 24Realisation of translation reserves on disposal of foreign subsidiaries (IAS 21) (1 502)Taxation effects of remeasurements (18) (5)Associate and non-controlling interest in remeasurements 47 71
Net remeasurements excluded from headline earnings (1 332) 219
Headline earnings 2 514 1 862
Headline earnings from continuing operations 2 427 2 053Headline earnings/(loss) from discontinued operation 87 (191)
125 Barloworld LimitedIntegrated Report 2018

Audited
2018Rm
2017Rm
2. RECONCILIATION OF NET PROFIT TO HEADLINE EARNINGS continuedWeighted average number of ordinary shares in issue during the year (000) – basic 210 875 210 780– diluted 212 147 212 095Headline earnings per share (cents)– basic 1 192.1 883.4– diluted 1 185.0 877.9Headline earnings per share from continuing operations (cents)– basic 1 150.9 974.5– diluted 1 144.0 968.0Headline earnings/(loss) per share from discontinued operation (cents)– basic 41.2 (91.1)– diluted 41.0 (90.1)
3. NON-OPERATING AND CAPITAL ITEMSLoss on acquisitions and disposal of investments and subsidiaries (25)Impairment of investments (24) (73)Impairment of goodwill (70)Profit on disposal of property, plant, equipment, intangibles and other assets 1 41Impairment of property, plant and equipment, intangibles and other assets (155) (98)
Gross non-operating and capital items from continuing operations (248) (155)Taxation benefit on non-operating and capital items 20 5Non-operating and capital items included in associate income from continuing operations 7
Net non-operating and capital items from continuing operations (228) (143)Net non-operating and capital items from discontinued operations 9Taxation charge on non-operating and capital items from discontinued operations (2)Non-operating and capital items included in associate income from discontinued operations (47) (78)
Net non-operating and capital items loss (268) (221)
As per our group accounting policy the definition of non-operating and capital items does not include profit or loss on property, plant and equipment, intangibles and investments. These items are adjusted for in the headline earnings calculation.
Summarised notes to the consolidated financial statementsfor the year ended 30 September
126 Barloworld LimitedIntegrated Report 2018

Audited
2018Rm
2017Rm
4. ACQUISITION OF SUBSIDIARIES, INVESTMENTS AND INTANGIBLESInvestment and intangible assets acquired (86) (393)
Cash amounts paid to acquire subsidiaries, investments and intangibles (86) (393)
5. PROCEEDS ON DISPOSAL OF SUBSIDIARIES, INVESTMENTS AND INTANGIBLESInventories disposed 969 551 Receivables disposed 1 196 26Payables, taxation and deferred taxation balances disposed and settled (785) (60)Borrowings net of cash 162 Property, plant and equipment, non-current assets, goodwill and intangibles 1 048 151
Net assets disposed 2 590 668Outstanding receivable from buyer (170)Less: Non-cash translation reserves realised on disposal of foreign subsidiaries (1 502)Profit/(loss) on disposal 1 586 (9)Investment in joint venture (301)
Net cash proceeds on disposal of subsidiaries 2 504 358Bank balances and cash in subsidiaries disposed (162)Proceeds on disposal of investments and intangibles 21
Cash proceeds on disposal of subsidiaries, investments and intangibles 2 342 379
The net cash proceeds on disposal of subsidiaries arises from the sale of the Equipment Iberia business for R2.5 billion (€163 million) during June 2018.
6. DISCONTINUED OPERATION AND ASSETS CLASSIFIED AS HELD FOR SALE Rm RmDue to its significance, Equipment Iberia business segment was classified as a discontinued operation at 30 September 2017. The sale of this business segment was concluded during June 2018.
Revenue 3 337 4 076
Operating profit before items listed below (EBITDA) 215 58Depreciation (72) (121)Amortisation of intangible assets (7) (14)
Operating profit/(loss)^ 136 (77)Finance costs (2) (9)Income from investments 1
Profit/(loss) before non-operating and capital items 134 (85)Non-operating and capital items 9
Profit/(loss) before taxation 143 (85)Taxation (29) (51)
Profit/(loss) after taxation 114 (136)Loss from associates# (67) (133)
Profit/(loss) from discontinued operations 47 (269)Net profit on disposal of discontinued operations* 1 600
Profit/(loss) discontinued operations per income statement 1 647 (269)
^ Operating loss at 30 September 2017 included restructuring costs at R137 million (€9.1 million).# Loss from associates includes an impairment of investment of R47 million (2017: R78 million).* Net profit on disposal of Equipment Iberia includes R1.5 billion that relates to recycle of the foreign currency translation reserves since acquisition.
127 Barloworld LimitedIntegrated Report 2018

Audited
2018Rm
2017Rm
6. DISCONTINUED OPERATION AND ASSETS CLASSIFIED AS HELD FOR SALE continuedThe cash flows from the discontinued operation are as follows:Cash flows from operating activities 129 381 Cash flows from investing activities (31) (65)Cash flows from financing activities (6) (326)
The major classes of assets and liabilities classified as held for sale are as follows:
Property, plant and equipment 253 1 131 Investments 97 Long-term financial assets 9 Deferred tax assets 18 166 Intangible assets 2 42 Inventories 37 823 Trade and other receivables*** 168 973 Cash balances 19 102
Assets classified as held for sale 497 3 343
Interest-bearing long-term loans (33)Trade and other payables – short and long term** (125) (637)Deferred tax liability (2)Provisions (125)Bank overdraft (1)
Total liabilities associated with assets classified as held for sale (126) (797)
Net assets classified as held for sale 371 2 546
Per business segment:Equipment Iberia 2 424 Logistics 278 122 Corporate division 93
Total group 371 2 546
*** Include financial assets of R63 million (2017: R798 million).** Include financial liabilities measured at amortised cost of R83 million (2017: R369 million)
Following a detailed strategic review of the various operations within the Logistics business, management has taken the firm decision to sell the KLL and SmartMatta businesses. In the prior year, the Logistics Middle East operations were classified as held for sale and positive steps have been made to dispose of this business in the year. Based on progress in the year and developments subsequent to year end, management is confident that this sale will take place in 2019, failing which a reassessment of this classification will be made. These assets do not constitute a major line of business and have therefore not been classified as discontinued operations.
The net assets held for sale within the Corporate division relate to the Barlow Park property owned by Barloworld Limited which is in the process of being sold into a consortium of investors with the aim of redeveloping the site into a multi-use precinct.
Summarised notes to the consolidated financial statementsfor the year ended 30 September
128 Barloworld LimitedIntegrated Report 2018

Audited
2018Rm
2017Rm
7. FINANCIAL INSTRUMENTSCarrying value of financial instruments by class:Financial assets:Trade receivables– Industry 6 124 5 429– Government 902 438– Consumers 543 403Other loans and receivables and cash balances 9 120 5 732Finance lease receivables 459 499Derivatives (including items designated as effective hedging instruments)– Forward exchange contracts 1 42Other financial assets at fair value 278 49
Total carrying value of financial assets 17 427 12 592
Financial liabilities:Trade payables– Principals 2 925 3 336– Other suppliers 3 734 5 234Other non-interest-bearing payables 490 435Derivatives (including items designated as effective hedging instruments)– Forward exchange contracts 35– Other derivatives 9 5Interest-bearing debt measured at amortised cost 13 920 9 134
Total carrying value of financial liabilities 21 113 18 144
Fair value measurements recognised in the statement of financial positionLevel 1 measurements are derived from quoted prices in active markets. Level 2 fair value measurements are those derived from inputs other than quoted prices included within Level 1 that are observable either directly or indirectly. Level 3 fair value measurements are those derived from valuation techniques that include inputs that are not based on observable market data (unobservable inputs).
2018 Level 1 Level 2 Level 3 Total
Financial assets at fair value through profit or lossFinancial assets designated at fair value through profit or loss 55 55Available-for-sale financial assetsShares 5 5Derivative assets designated as effective hedging instruments 1 1Total 1 60 61Financial liabilities at fair value through profit or lossFinancial liabilities designated at fair value through profit or loss 9 9Derivatives 35 35
Total 44 44
2017 Level 1 Level 2 Level 3 Total
Financial assets at fair value through profit or lossFinancial assets designated at fair value through profit or loss 49 49Available-for-sale financial assetsShares 5 5Derivative assets designated as effective hedging instruments 42 42
Total 42 54 96
Financial liabilities at fair value through profit or lossFinancial liabilities designated at fair value through profit or loss 5 5
Total 5 5
129 Barloworld LimitedIntegrated Report 2018
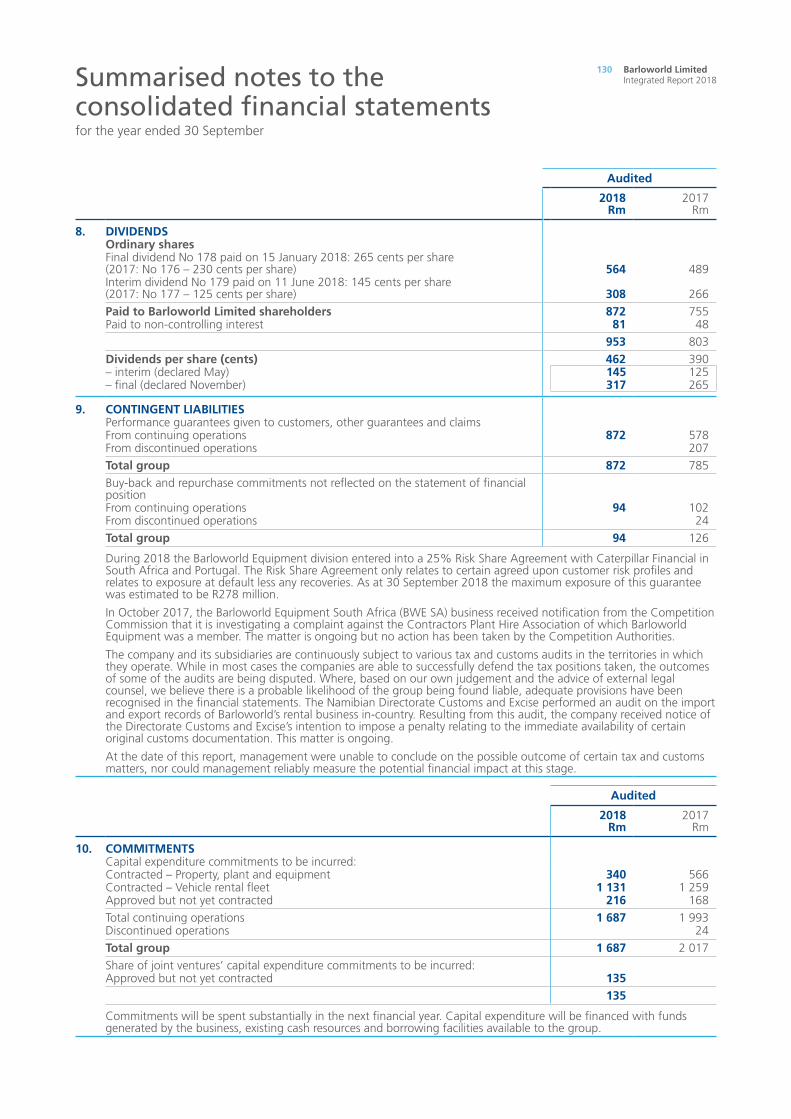
Audited
2018Rm
2017Rm
8. DIVIDENDSOrdinary sharesFinal dividend No 178 paid on 15 January 2018: 265 cents per share (2017: No 176 – 230 cents per share) 564 489Interim dividend No 179 paid on 11 June 2018: 145 cents per share (2017: No 177 – 125 cents per share) 308 266
Paid to Barloworld Limited shareholders 872 755Paid to non-controlling interest 81 48
953 803
Dividends per share (cents) 462 390– interim (declared May) 145 125– final (declared November) 317 265
9. CONTINGENT LIABILITIESPerformance guarantees given to customers, other guarantees and claimsFrom continuing operations 872 578From discontinued operations 207
Total group 872 785
Buy-back and repurchase commitments not reflected on the statement of financial position From continuing operations 94 102From discontinued operations 24
Total group 94 126
During 2018 the Barloworld Equipment division entered into a 25% Risk Share Agreement with Caterpillar Financial in South Africa and Portugal. The Risk Share Agreement only relates to certain agreed upon customer risk profiles and relates to exposure at default less any recoveries. As at 30 September 2018 the maximum exposure of this guarantee was estimated to be R278 million.
In October 2017, the Barloworld Equipment South Africa (BWE SA) business received notification from the Competition Commission that it is investigating a complaint against the Contractors Plant Hire Association of which Barloworld Equipment was a member. The matter is ongoing but no action has been taken by the Competition Authorities.
The company and its subsidiaries are continuously subject to various tax and customs audits in the territories in which they operate. While in most cases the companies are able to successfully defend the tax positions taken, the outcomes of some of the audits are being disputed. Where, based on our own judgement and the advice of external legal counsel, we believe there is a probable likelihood of the group being found liable, adequate provisions have been recognised in the financial statements. The Namibian Directorate Customs and Excise performed an audit on the import and export records of Barloworld’s rental business in-country. Resulting from this audit, the company received notice of the Directorate Customs and Excise’s intention to impose a penalty relating to the immediate availability of certain original customs documentation. This matter is ongoing.
At the date of this report, management were unable to conclude on the possible outcome of certain tax and customs matters, nor could management reliably measure the potential financial impact at this stage.
Audited
2018Rm
2017Rm
10. COMMITMENTSCapital expenditure commitments to be incurred:Contracted – Property, plant and equipment 340 566 Contracted – Vehicle rental fleet 1 131 1 259 Approved but not yet contracted 216 168
Total continuing operations 1 687 1 993 Discontinued operations 24
Total group 1 687 2 017
Share of joint ventures’ capital expenditure commitments to be incurred:Approved but not yet contracted 135
135
Commitments will be spent substantially in the next financial year. Capital expenditure will be financed with funds generated by the business, existing cash resources and borrowing facilities available to the group.
Summarised notes to the consolidated financial statementsfor the year ended 30 September
130 Barloworld LimitedIntegrated Report 2018
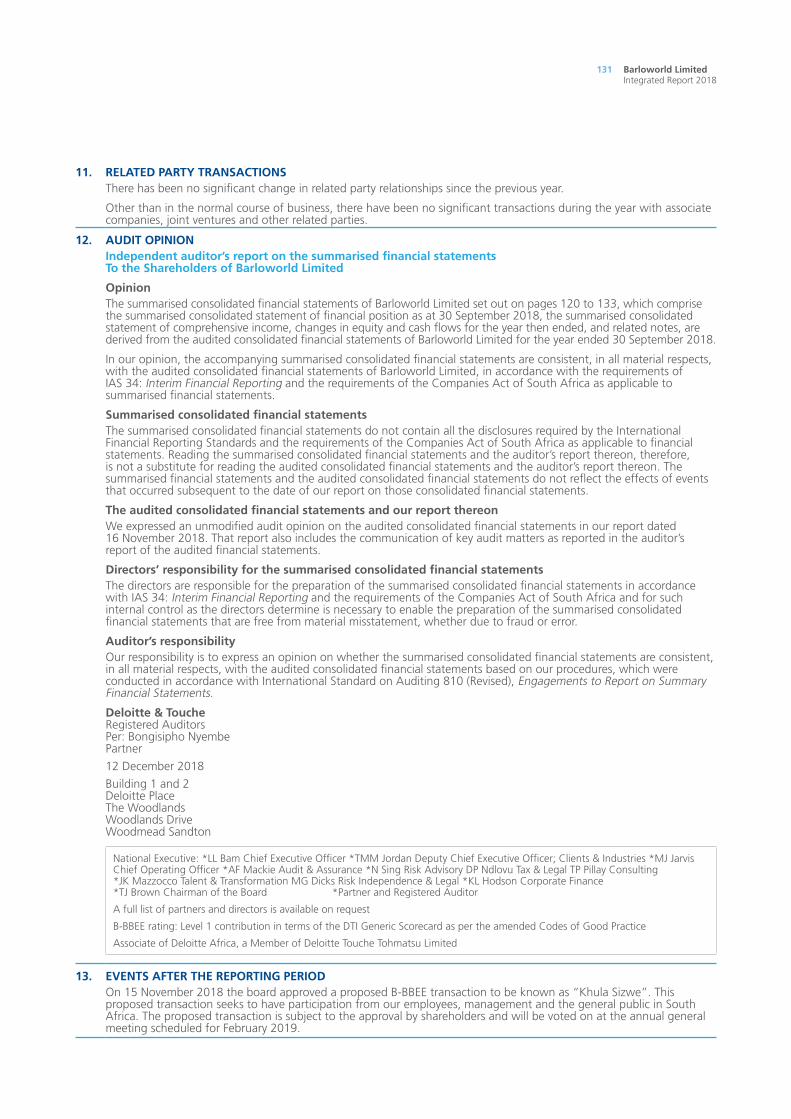
11. RELATED PARTY TRANSACTIONSThere has been no significant change in related party relationships since the previous year.
Other than in the normal course of business, there have been no significant transactions during the year with associate companies, joint ventures and other related parties.
12. AUDIT OPINIONIndependent auditor’s report on the summarised financial statementsTo the Shareholders of Barloworld Limited
OpinionThe summarised consolidated financial statements of Barloworld Limited set out on pages 120 to 133, which comprise the summarised consolidated statement of financial position as at 30 September 2018, the summarised consolidated statement of comprehensive income, changes in equity and cash flows for the year then ended, and related notes, are derived from the audited consolidated financial statements of Barloworld Limited for the year ended 30 September 2018.
In our opinion, the accompanying summarised consolidated financial statements are consistent, in all material respects, with the audited consolidated financial statements of Barloworld Limited, in accordance with the requirements of IAS 34: Interim Financial Reporting and the requirements of the Companies Act of South Africa as applicable to summarised financial statements.
Summarised consolidated financial statementsThe summarised consolidated financial statements do not contain all the disclosures required by the International Financial Reporting Standards and the requirements of the Companies Act of South Africa as applicable to financial statements. Reading the summarised consolidated financial statements and the auditor’s report thereon, therefore, is not a substitute for reading the audited consolidated financial statements and the auditor’s report thereon. The summarised financial statements and the audited consolidated financial statements do not reflect the effects of events that occurred subsequent to the date of our report on those consolidated financial statements.
The audited consolidated financial statements and our report thereonWe expressed an unmodified audit opinion on the audited consolidated financial statements in our report dated 16 November 2018. That report also includes the communication of key audit matters as reported in the auditor’s report of the audited financial statements.
Directors’ responsibility for the summarised consolidated financial statementsThe directors are responsible for the preparation of the summarised consolidated financial statements in accordance with IAS 34: Interim Financial Reporting and the requirements of the Companies Act of South Africa and for such internal control as the directors determine is necessary to enable the preparation of the summarised consolidated financial statements that are free from material misstatement, whether due to fraud or error.
Auditor’s responsibilityOur responsibility is to express an opinion on whether the summarised consolidated financial statements are consistent, in all material respects, with the audited consolidated financial statements based on our procedures, which were conducted in accordance with International Standard on Auditing 810 (Revised), Engagements to Report on Summary Financial Statements.
Deloitte & Touche Registered AuditorsPer: Bongisipho NyembePartner
12 December 2018
Building 1 and 2Deloitte PlaceThe WoodlandsWoodlands DriveWoodmead Sandton
National Executive: *LL Bam Chief Executive Officer *TMM Jordan Deputy Chief Executive Officer; Clients & Industries *MJ Jarvis Chief Operating Officer *AF Mackie Audit & Assurance *N Sing Risk Advisory DP Ndlovu Tax & Legal TP Pillay Consulting *JK Mazzocco Talent & Transformation MG Dicks Risk Independence & Legal *KL Hodson Corporate Finance *TJ Brown Chairman of the Board *Partner and Registered Auditor
A full list of partners and directors is available on request
B-BBEE rating: Level 1 contribution in terms of the DTI Generic Scorecard as per the amended Codes of Good Practice
Associate of Deloitte Africa, a Member of Deloitte Touche Tohmatsu Limited
13. EVENTS AFTER THE REPORTING PERIODOn 15 November 2018 the board approved a proposed B-BBEE transaction to be known as “Khula Sizwe”. This proposed transaction seeks to have participation from our employees, management and the general public in South Africa. The proposed transaction is subject to the approval by shareholders and will be voted on at the annual general meeting scheduled for February 2019.
131 Barloworld LimitedIntegrated Report 2018

Summarised notes to the consolidated financial statementsfor the year ended 30 September
14. OPERATING SEGMENTS (AUDITED)
RevenueOperating
profit/(loss)
Fair value adjustments on financial instruments
Operating profit/(loss) including fair value
adjustmentsNet operating
assets/(liabilities)
Year ended 30 September
Year ended 30 September
Year ended 30 September
Year ended 30 September
Year ended 30 September
2018Rm
2017Rm
2018Rm
2017Rm
2018Rm
2017Rm
2018Rm
2017Rm
2018Rm
2017Rm
Equipment and Handling 27 686 24 193 2 574 2 362 (84) (184) 2 490 2 178 14 902 15 534Automotive and Logistics 35 733 37 764 1 963 1 848 (19) (6) 1 944 1 842 10 296 10 757Corporate 1 2 (133) (128) (30) (19) (163) (147) (1 159) (1 709)
Total group 63 420 61 959 4 404 4 082 (133) (209) 4 271 3 873 24 039 24 582
132 Barloworld LimitedIntegrated Report 2018

14. OPERATING SEGMENTS (AUDITED)
RevenueOperating
profit/(loss)
Fair value adjustments on financial instruments
Operating profit/(loss) including fair value
adjustmentsNet operating
assets/(liabilities)
Year ended 30 September
Year ended 30 September
Year ended 30 September
Year ended 30 September
Year ended 30 September
2018Rm
2017Rm
2018Rm
2017Rm
2018Rm
2017Rm
2018Rm
2017Rm
2018Rm
2017Rm
Equipment and Handling 27 686 24 193 2 574 2 362 (84) (184) 2 490 2 178 14 902 15 534Automotive and Logistics 35 733 37 764 1 963 1 848 (19) (6) 1 944 1 842 10 296 10 757Corporate 1 2 (133) (128) (30) (19) (163) (147) (1 159) (1 709)
Total group 63 420 61 959 4 404 4 082 (133) (209) 4 271 3 873 24 039 24 582
133 Barloworld LimitedIntegrated Report 2018

Independent auditor’s non-financial limited assurance report
To the directors of Barloworld Limited
Limited assurance report on the sustainability key performance indicator disclosures as contained in the Integrated Report We have undertaken a limited assurance engagement on selected subject matter disclosures to be published in the Barloworld Limited Integrated Report and GRI Modular Response (the Reports) for the year ended 30 September 2018.
Subject matterThe subject matter comprises the key sustainability performance indicators disclosed in accordance with management’s basis of preparation, supported by the GRI Sustainability Reporting Standards (GRI Standards) and the Greenhouse Gas Protocol (GHG Protocol) Corporate Standard, during the year ended 30 September 2018.
The terms of management’s basis of preparation, supported by the GRI and the GHG protocol, comprise the criteria by which the company’s compliance is evaluated for purposes of our limited assurance engagement. The sustainability key performance indicators were the following:
Value created – Value added statement (R million)
Community support – Group corporate social investment spend (R million)
People – Total number of employees – Employee breakdown by race (RSA only) and gender
Safety – Number of work-related fatalities – Lost-time injury frequency rate
Energy – Fuel consumption – petrol and diesel (ML) – Grid electricity consumption (MWh) – Non-renewable energy consumption (GJ): including consumption by primary energy source
Carbon emissions (tCO2e) – Scope 1 emissions: including emissions by primary energy source
– Scope 2 emissions – Scope 3 rental fleet emissions – Avis Budget South Africa
Water – Water withdrawals (municipal sources) (ML)
Directors’ responsibilityThe company’s directors being the responsible party, and where appropriate, those charged with governance are responsible for the sustainability key performance indicators information, in accordance with management’s basis of preparation, supported by the GRI and GHG Protocol.
The responsibility includes: – Ensuring that the sustainability key performance indicators are properly presented in accordance with management’s basis of preparation, supported by the GRI and GHG Protocol
– Confirming the measurement or evaluation of the underlying subject matter against the applicable criteria, including that all relevant matters are reflected in the subject matter information
– Designing, establishing and maintaining internal controls to ensure that the sustainability key performance indicators are properly presented in accordance with management’s basis of preparation, supported by the GRI and GHG Protocol.
Assurance practitioner’s responsibilityWe conducted our assurance engagement in accordance with the International Standard on Assurance Engagements (ISAE) 3000 (Revised), Assurance Engagements Other Than Audits or Reviews of Historic Financial Information. This standard requires us to comply with ethical requirements and to plan and perform our limited assurance engagement with the aim of obtaining limited assurance regarding the subject matter of the engagement.
We shall not be responsible for reporting on any sustainability key performance information beyond the period covered by our limited assurance engagement.
Quality controlThe firm applies International Standard on Quality Control 1 and accordingly maintains a comprehensive system of quality control including documented policies and procedures regarding compliance with ethical requirements, professional standards and applicable legal and regulatory requirements.
Independence and other ethical requirementsWe have complied with the independence and other ethical requirements of Parts A and B of the Code of Ethics for Professional Accountants issued by the International Ethics Standards Board for Accountants, which is founded on the fundamental principles of integrity, objectivity, professional competence and due care, confidentiality and professional behaviour.
GRI 102-56
134 Barloworld LimitedIntegrated Report 2018

Summary of work performedWe have performed our procedures on the sustainability key performance indicators of the company, as prepared by management in accordance with management’s basis of preparation, supported by the GRI and the GHG Protocol for the year ended 30 September 2018. Our evaluation included performing such procedures as we considered necessary which included: – Interviewing management and senior executives to obtain an understanding of the internal control environment, risk assessment process and information systems relevant to the sustainability reporting process for the selected subject matter
– Assessing the systems and processes to generate, collate, aggregate, validate and monitor the source data used to prepare the selected subject matter for disclosure in the Reports
– Inspecting supporting documentation and performing analytical review procedures
– Evaluating whether the selected sustainability key performance indicator disclosures are consistent with our overall knowledge and experience of sustainability processes at Barloworld.
Our assurance engagement does not constitute an audit or review of any of the underlying information conducted in accordance with International Standards on Auditing or International Standards on Review Engagements and accordingly, we do not express an audit opinion or review conclusion.
We believe that our evidence obtained is sufficient and appropriate to provide a basis for our limited assurance conclusion.
In a limited assurance engagement, the procedures performed vary in nature and timing from, and are less in extent than for, a reasonable assurance engagement. Consequently, the level of assurance obtained in a limited assurance engagement is substantially lower than the assurance that would have been obtained had we performed a reasonable assurance engagement. Accordingly, we do not express a reasonable assurance opinion about whether the sustainability key performance indicators have been presented, in all material respects, with management’s basis of preparation, supported by the GRI and GHG Protocol.
Other mattersOur report does not extend to any disclosures or assertions relating to future performance plans and/or strategies disclosed in the Reports. The maintenance and integrity of the Barloworld website is the responsibility of Barloworld management. Our procedures did not involve consideration of these matters and, accordingly we accept no responsibility for any changes to either the information on the website, the Reports or our independent assurance report that may have occurred since the initial date of presentation.
ConclusionBased on our examination of the evidence obtained, nothing has come to our attention that causes us to believe that the selected sustainability key performance indicators, as set out in the subject matter paragraph (of our report) for the year ended 30 September 2018, are not prepared, in all material respects, in accordance with management’s basis of preparation, supported by the GRI and the GHG Protocol Corporate Standard.
Restriction on use and distribution – for special purpose engagementsOur work has been undertaken to enable us to express a limited assurance conclusion on the selected subject matter to the directors of Barloworld in accordance with the terms of our engagement, and for no other purpose. We do not accept or assume liability to any party other than the entity, for our work, for this report, or for the conclusion we have reached.
Claire HoyDirector
Deloitte & Touche
10 December 2018
National Executive: *LL Bam Chief Executive Officer *TMM Jordan Deputy Chief Executive Officer; Clients & Industries *MJ Jarvis Chief Operating Officer *AF Mackie Audit & Assurance *N Sing Risk Advisory DP Ndlovu Tax & Legal TP Pillay Consulting *JK Mazzocco Talent & Transformation MG Dicks Risk Independence & Legal *KL Hodson Corporate Finance *TJ Brown Chairman of the Board
A full list of partners and directors is available on request * Partner and Registered Auditor
B-BBEE rating: Level 1 contribution in terms of the DTI Generic Scorecard as per the amended Codes of Good Practice
Associate of Deloitte Africa, a Member of Deloitte Touche Tohmatsu Limited
135 Barloworld LimitedIntegrated Report 2018

Assurance matrix
Reportingaspect assured
Independentassuranceproviders
Scope ofreview
Framework/standard Output Frequency
Annual financial statements
External audit Annual financial statements audit
IFRS External audit opinion
Annual
Companies Act
International Standards on Auditing (ISA)
Interim financial results
External audit Review of interim financial results
International Standard on Assurance Engagements (ISAE 2410)
Assurance statement
Annual
Companies Act
International Standards on Auditing (ISA)
Internal controls, governance and risk management process
Group internal audit
Review of risk management, governance, operational and non-financial reporting processes
Institute of Internal Auditors (IIA) International Standards for the Professional Practice of Internal Auditing
Internal audit opinion on the adequacy and effectiveness of controls, governance and risk management processes
Annual
External audit Barloworld group internal audit methodology
Internal financial controls
Group internal audit
Assurance on the adequacy and effectiveness of financial controls
Institute of Internal Auditors (IIA) International Standards for the Professional Practice of Internal Auditing
Internal audit opinion on financial controls
Annual
External audit Barloworld group internal audit methodology
Barloworld internal financial control framework
External audit reports
Key sustainability indicators
External audit Assurance on selected key non-financial performance indicators
International Standard on Assurance Engagements (ISAE 3000) (Revised)
Assurance report Annual
Black economic empowerment rating
Empowerdex Verification of empowerment status
Department of Trade and Industry (dti) Broad-Based Black Economic Empowerment (B-BBEE) scorecard
Empowerment rating certificate
Annual
GRI 102-56
136 Barloworld LimitedIntegrated Report 2018
Corporate information
This Integrated Report is printed on GalerieArtTM Natural White which is PEFC and FSC certified and made from 100% elemental chlorine-free pulps.
Barloworld Limited(Registration number 1918/000095/06)JSE codes: BAW and BAWPISIN codes: ZAE000026639 and ZAE000026647
Registered office and business addressBarloworld Limited 61 Katherine Street, PO Box 782248, Sandton 2146, South AfricaTel: +27 11 445 1000 Email: [email protected]
Transfer secretaries – South AfricaLink Market Services South Africa (Pty) Limited (Registration number 2000/007239/07)13th Floor, Rennie House, 19 Ameshoff Street, Braamfontein, Johannesburg 2001(PO Box 4844, Johannesburg 2000)Tel: +27 11 630 0000
Registrars – United KingdomEquiniti LimitedAspect House, Spencer Road, Lancing, West Sussex BN99 6DA, EnglandTel: +44 190 383 3381
Transfer secretaries – NamibiaTransfer Secretaries (Pty) Limited (Registration number 93/713)Shop 8, Kaiser Krone Centre, Post Street Mall, Windhoek, Namibia(PO Box 2401, Windhoek, Namibia)Tel: +264 61 227 647
SponsorNedbank Corporate and Investment Banking, a division of Nedbank Limited
EnquiriesLethiwe HlatshwayoHead: Group Communication & Investor RelationsTel: +27 11 445 1000Email: [email protected]
wwwFor background information visit www.barloworld.com.
GRI 102-1, 102-3

ONEBarloworld
creating value
www.barloworld.com
Barlo
wo
rld In
tegrated
Rep
ort 2018