
Barge Impact Analysis for Rigid Lock Walls ETL 1110-2-563 · Barge Impact Analysis for Rigid Lock...
35
Barge Impact Analysis for Rigid Lock Walls ETL 1110-2-563 John D. Clarkson, Huntington District Robert C. Patev, New England District
Transcript of Barge Impact Analysis for Rigid Lock Walls ETL 1110-2-563 · Barge Impact Analysis for Rigid Lock...

Barge Impact Analysis forRigid Lock WallsETL 1110-2-563
John D. Clarkson, Huntington District
Robert C. Patev, New England District
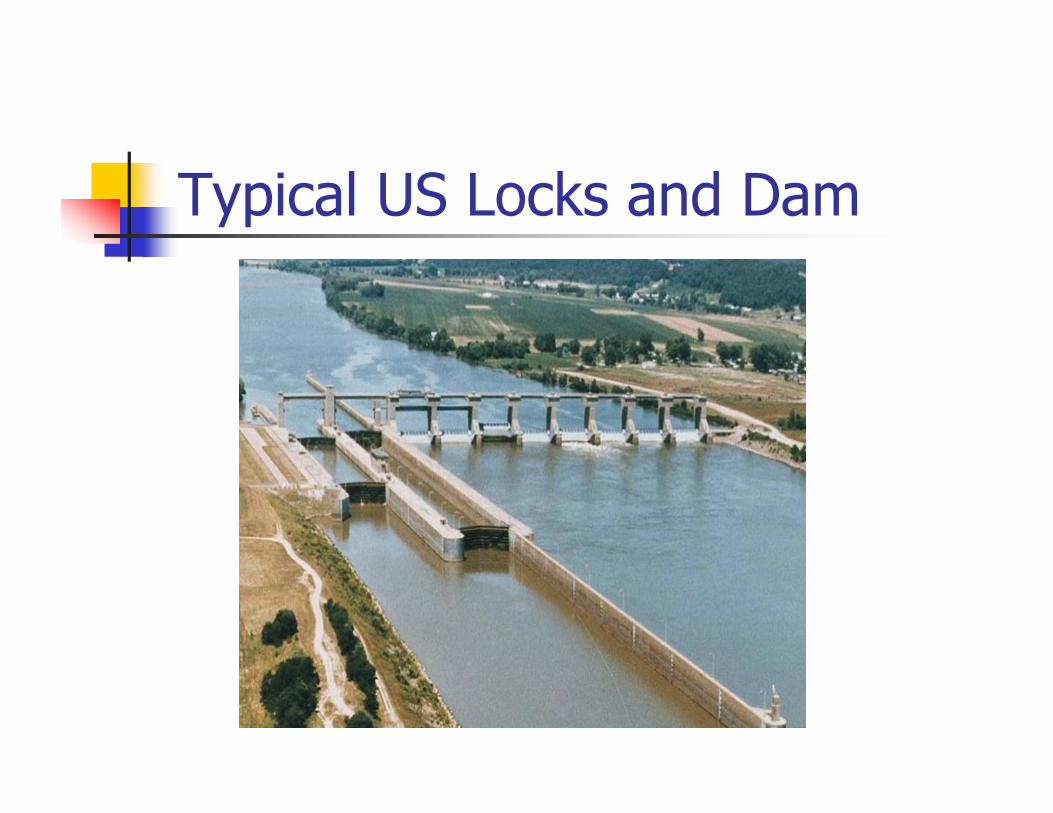
Typical US Locks and Dam
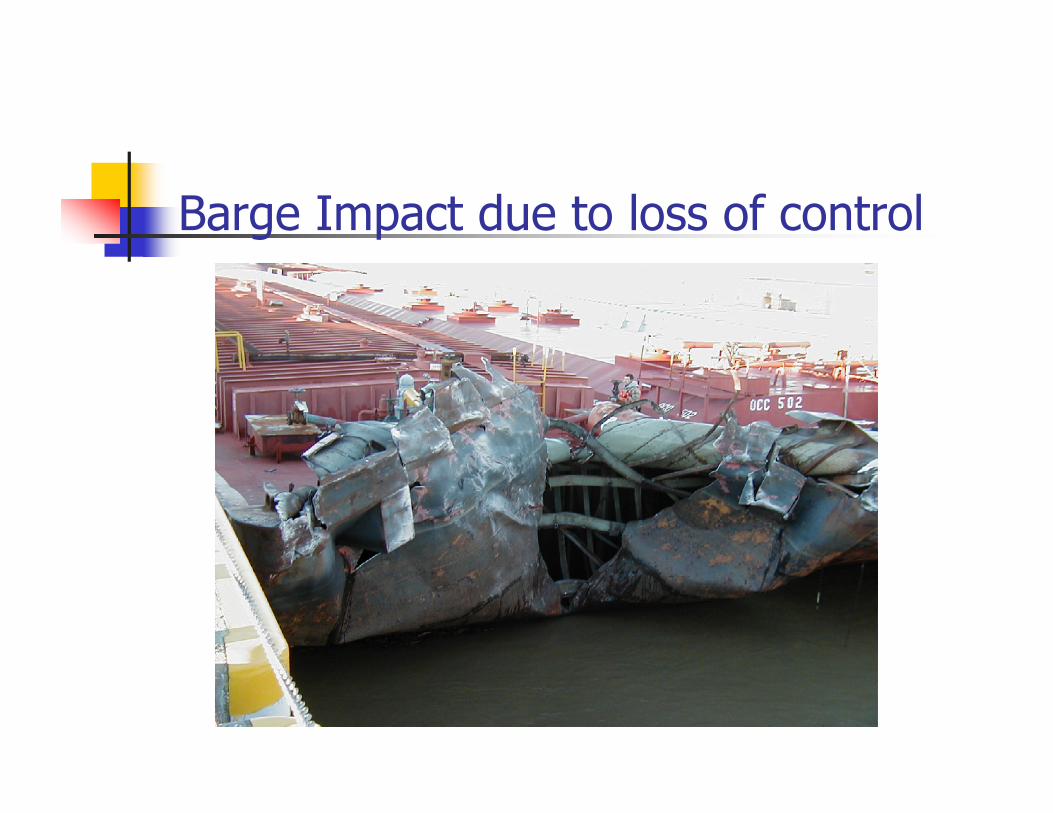
Barge Impact due to loss of control

Topics
� Background on ETL
� Rigid Wall Guidance ETL
� Continuing efforts

Vessel Impact Task Group Members
� Headquarters� Don Dressler� Anjana Chudgar
� Districts� John Clarkson, Huntington� Bob Patev, New England� Joe Kubinski, Detroit� Andy Harkness, Pittsburgh� Terry Sullivan, Louisville� Mark Gonski, New Orleans
� ERDC� Bob Ebeling, ITL� Bruce Barker, ISD

Why write a new ETL?� ETL 1110-2-338 rescinded in 1999
� Method was felt too conservative for design� Uses permanent deformation of barge� Issued interim guidance letter� Yielded unexpected results

Why write a new ETL?Innovations for Navigation Projects (INP) R&D
Barge Impact Efforts� Full-scale experiments
� 4-barge (Prototype – Pittsburgh - ERDC/ITL TechnicalReport ITL-03-2 )
� 15-barge (Full-scale – RC Byrd - ERDC/ITL TechnicalReport ITL-03-8)
� Crushing (New Orleans)
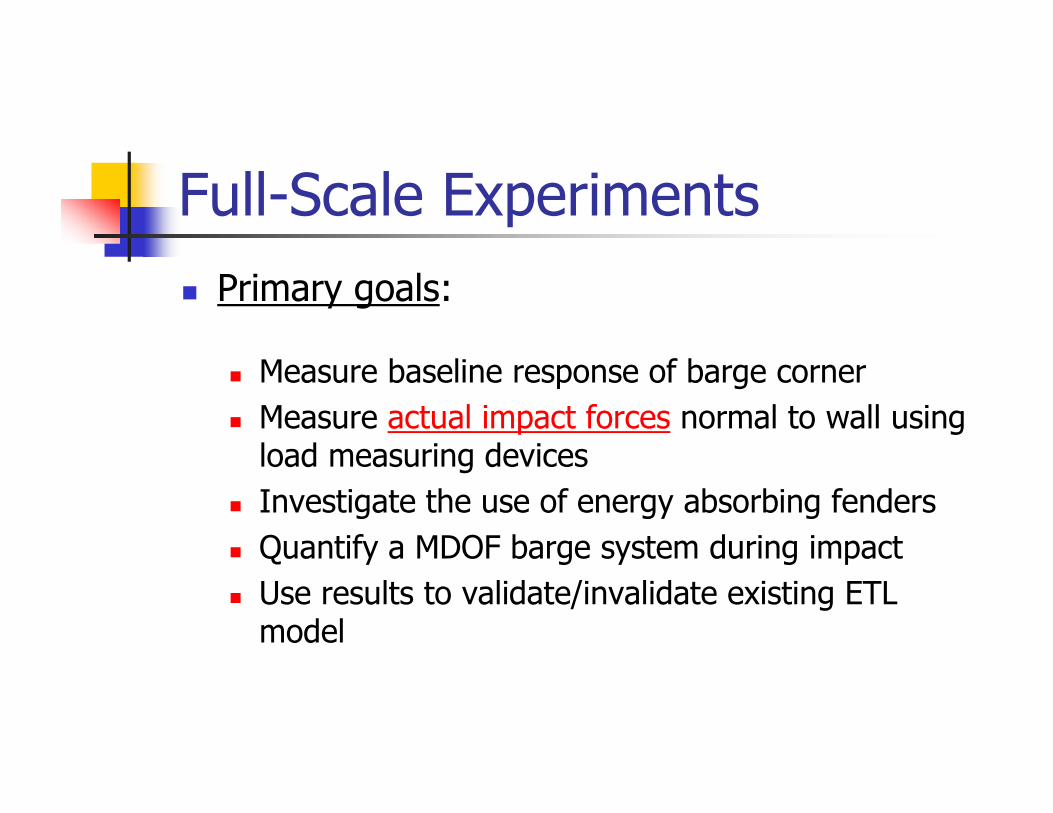
Full-Scale Experiments� Primary goals:
� Measure baseline response of barge corner� Measure actual impact forces normal to wall using
load measuring devices� Investigate the use of energy absorbing fenders� Quantify a MDOF barge system during impact� Use results to validate/invalidate existing ETL
model

Full-Scale Experiments

Full-Scale Experiments� Used a 15 barge commercial tow drafting at 9 feet
� Mass of tow approximately 32,000 tons – 29,000 metric tons
� Impacts on� Upper guide wall� “Prototype” energy absorbing fendering system
� Successfully conducted 44 full-scale impactexperiments
� 12 baseline on concrete� 9 baseline on fendering system� 18 load measurement on concrete� 5 load measurement on fendering systems
� Impacts at:� Velocities from 0.5 to 4.1 feet per second� Angles from 5 to 25 degrees
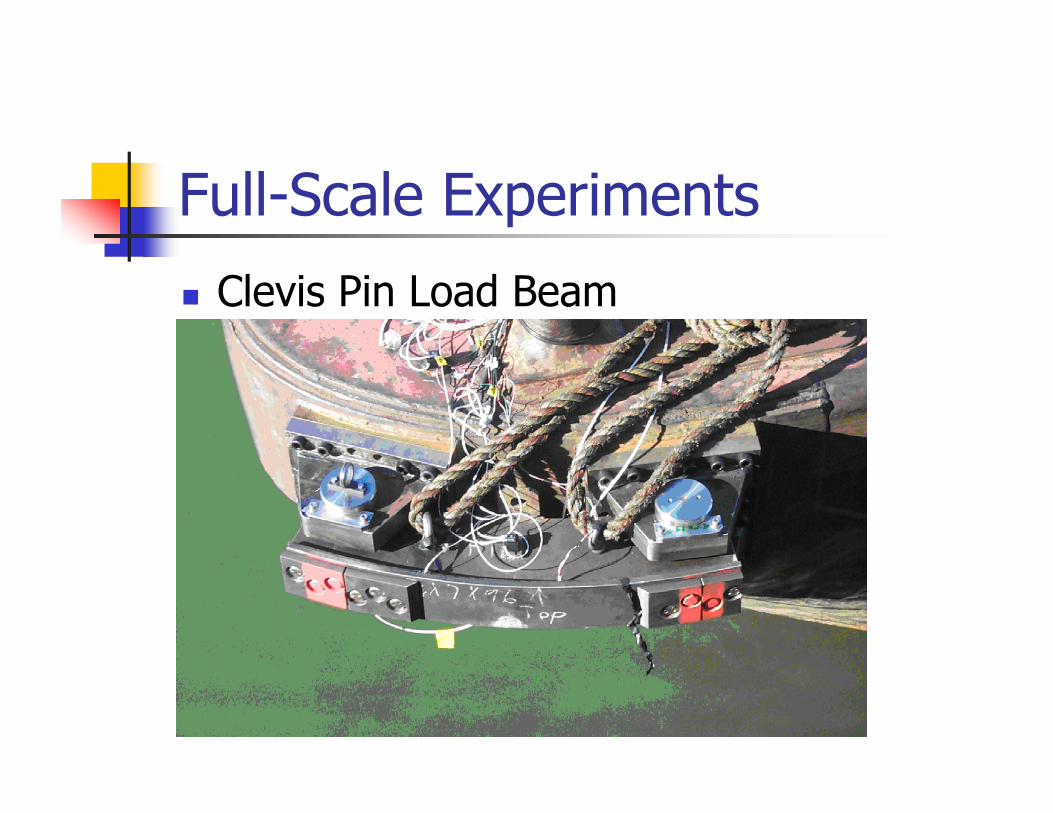
Full-Scale Experiments
� Clevis Pin Load Beam
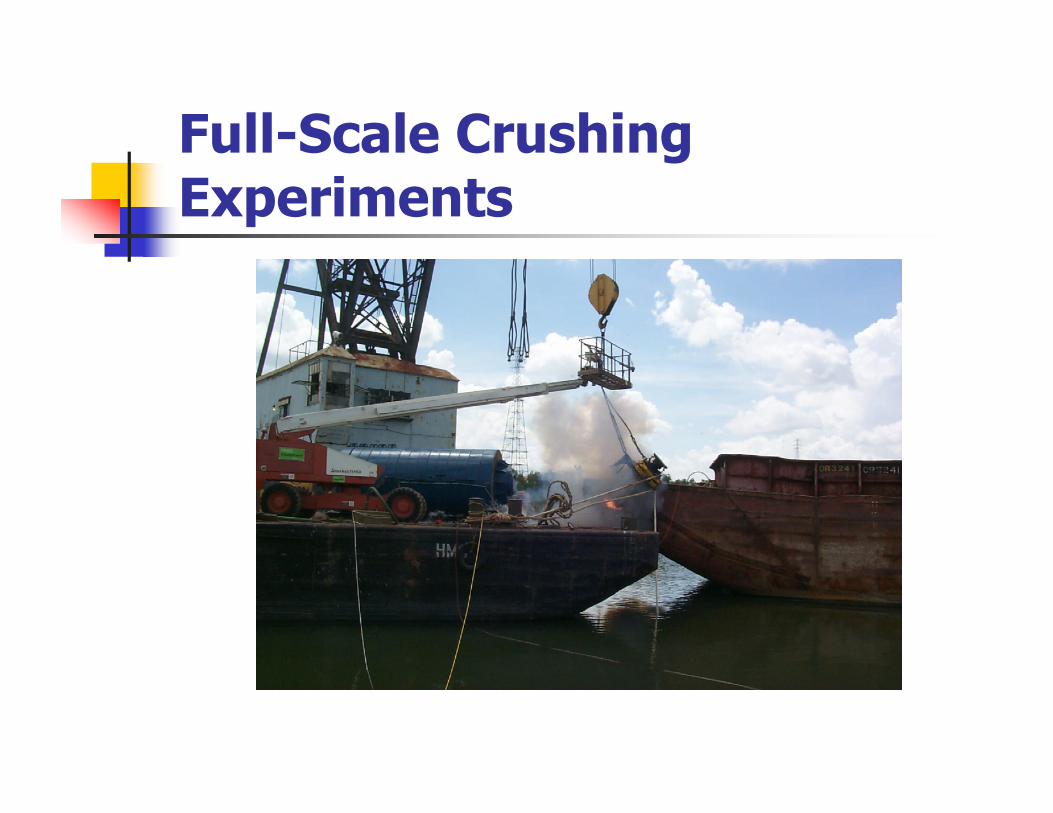
Full-Scale CrushingExperiments
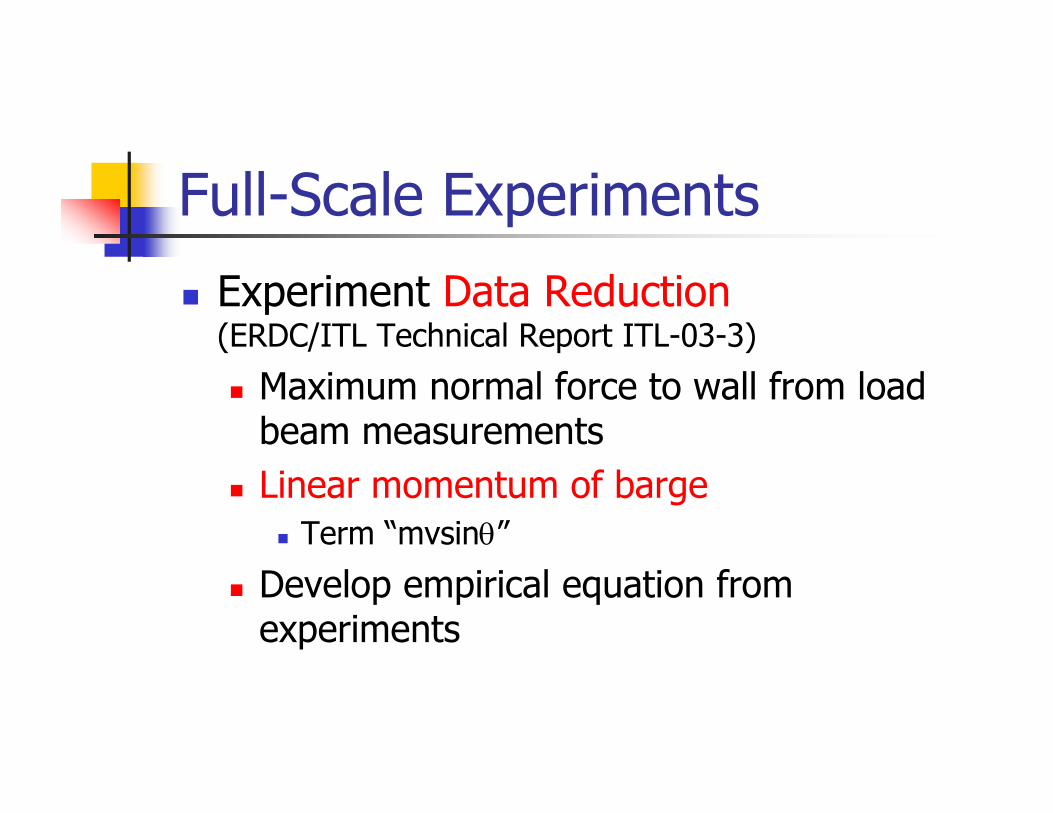
Full-Scale Experiments
� Experiment Data Reduction(ERDC/ITL Technical Report ITL-03-3)
� Maximum normal force to wall from loadbeam measurements
� Linear momentum of barge� Term “mvsinθ”
� Develop empirical equation fromexperiments
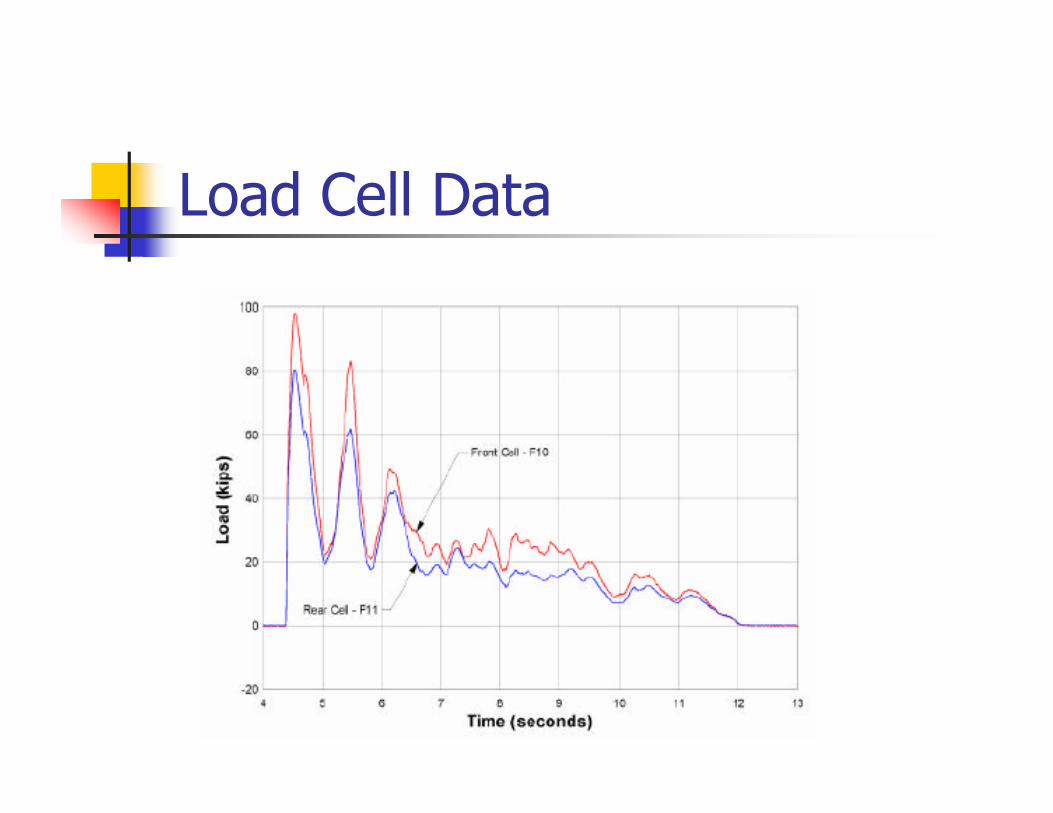
Load Cell Data
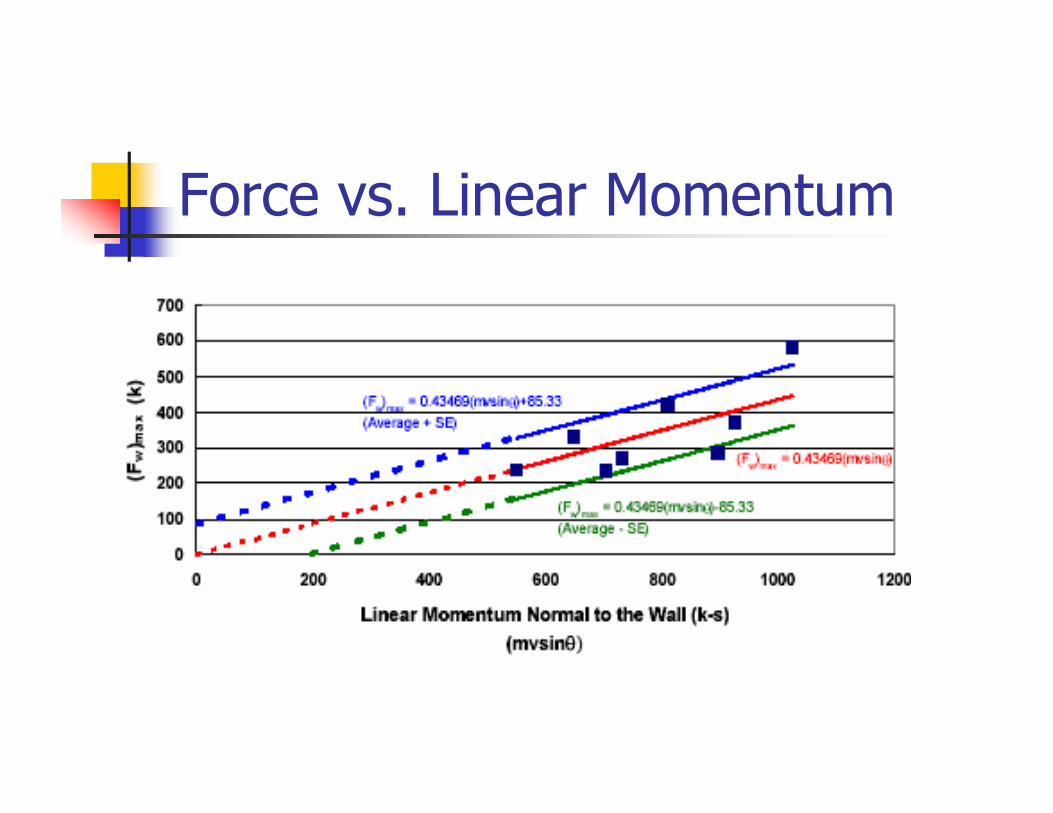
Force vs. Linear Momentum
Full-Scale Experiments
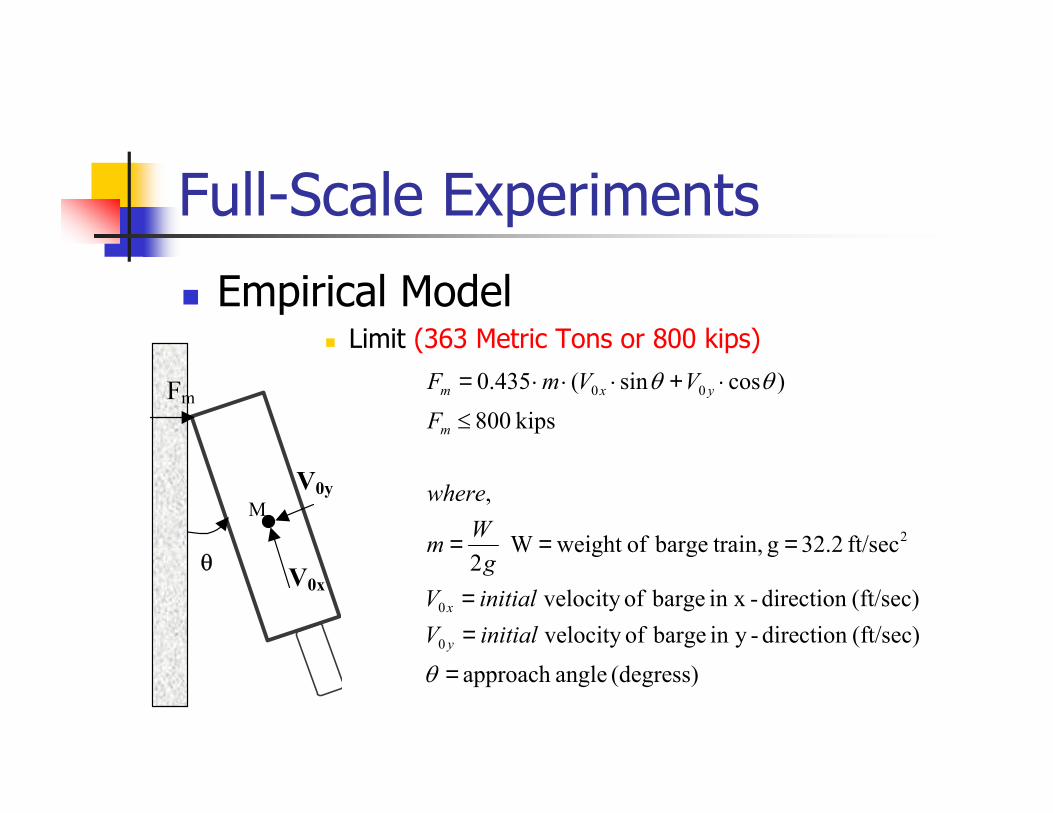
� Empirical Model� Limit (363 Metric Tons or 800 kips)
V0y
θ V0x
M
Fm
(degress)angleapproach
(ft/sec)direction-yinbargeofvelocity(ft/sec)direction-in xbargeofvelocity
ft/sec32.2gtrain,bargeofweightW2
,
kips800
)cossin(435.0
0
0
2
00
=
==
===
≤
⋅+⋅⋅⋅=
θ
θθ
initialVinitialVgWm
where
FVVmF
y
x
m
yxm
ETL 1110-2-563� Goals of ETL 563
� Provide an empirical model calibrated to the fieldexperiments to assist in determining “realistic”impact forces
� Provide guidance for input parameters to empiricalmodel
� Define return periods for barge impact� Provide methodology for determining return
periods using probabilistic procedures
ETL 563� Guidance complete but still a work in
progress, works for most design requirements� Current model based on linear momentum of
controlled impact experiments� Limitations of experiments
� Future empirical or analytical models will accountfor:
� Lashing Failures� Head-on Impacts� Flexible Walls

ETL 563 - Upper Limit
First Lashing Failure600
2000
0 10 300 Return Period
Fw (k
)
USUAL UNUSUAL EXTREME
Linear Momentum
Current limits of ETL
Corner/headlog deformation
Mvsinθ (k-sec)0 1065 1200
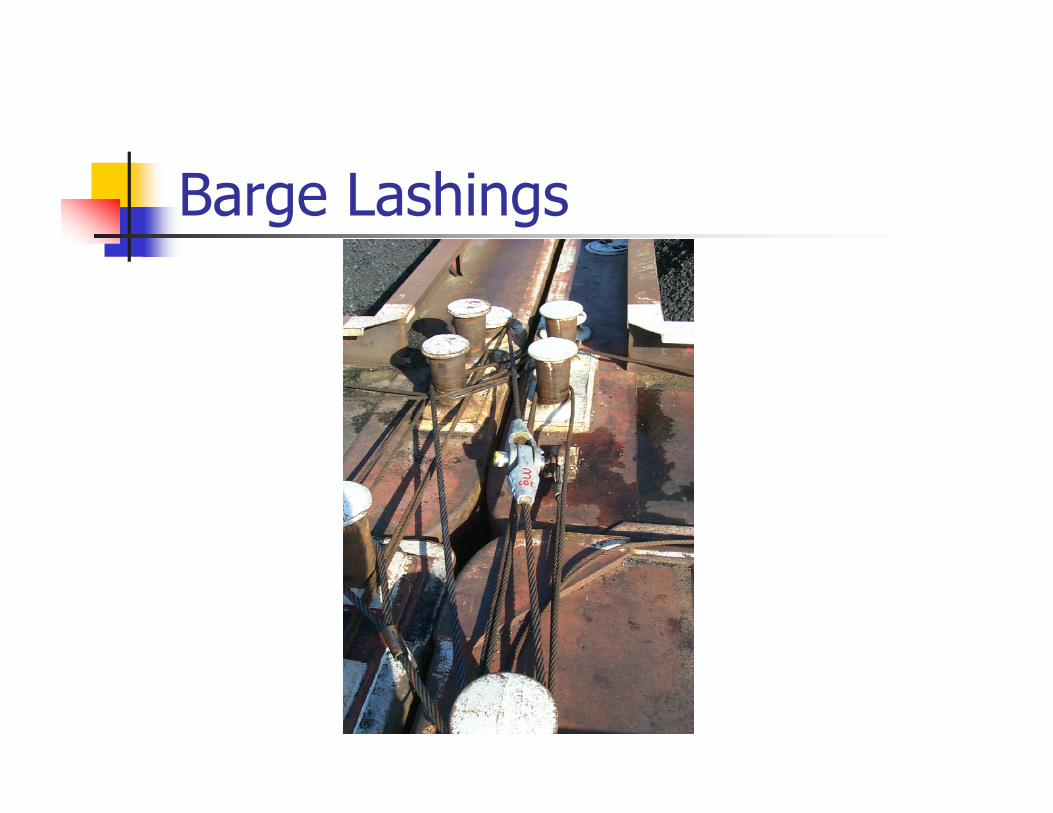
Barge Lashings

Typical Lock Structure
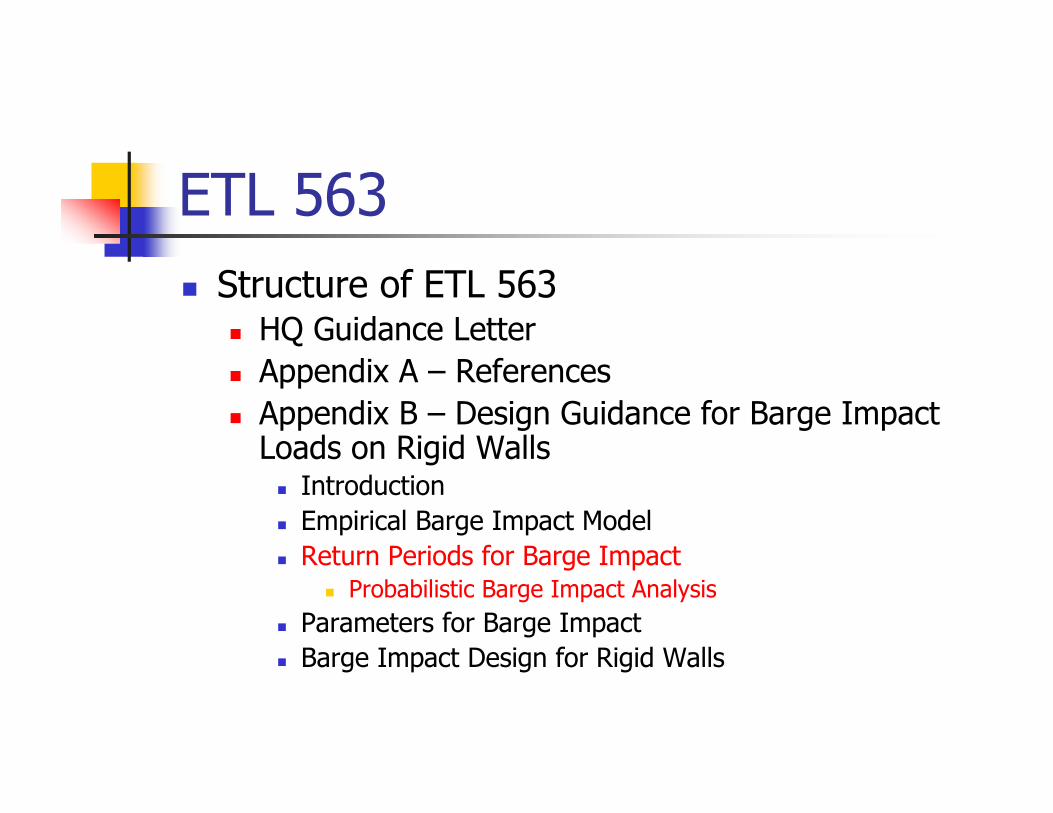
ETL 563� Structure of ETL 563
� HQ Guidance Letter� Appendix A – References� Appendix B – Design Guidance for Barge Impact
Loads on Rigid Walls� Introduction� Empirical Barge Impact Model� Return Periods for Barge Impact
� Probabilistic Barge Impact Analysis� Parameters for Barge Impact� Barge Impact Design for Rigid Walls
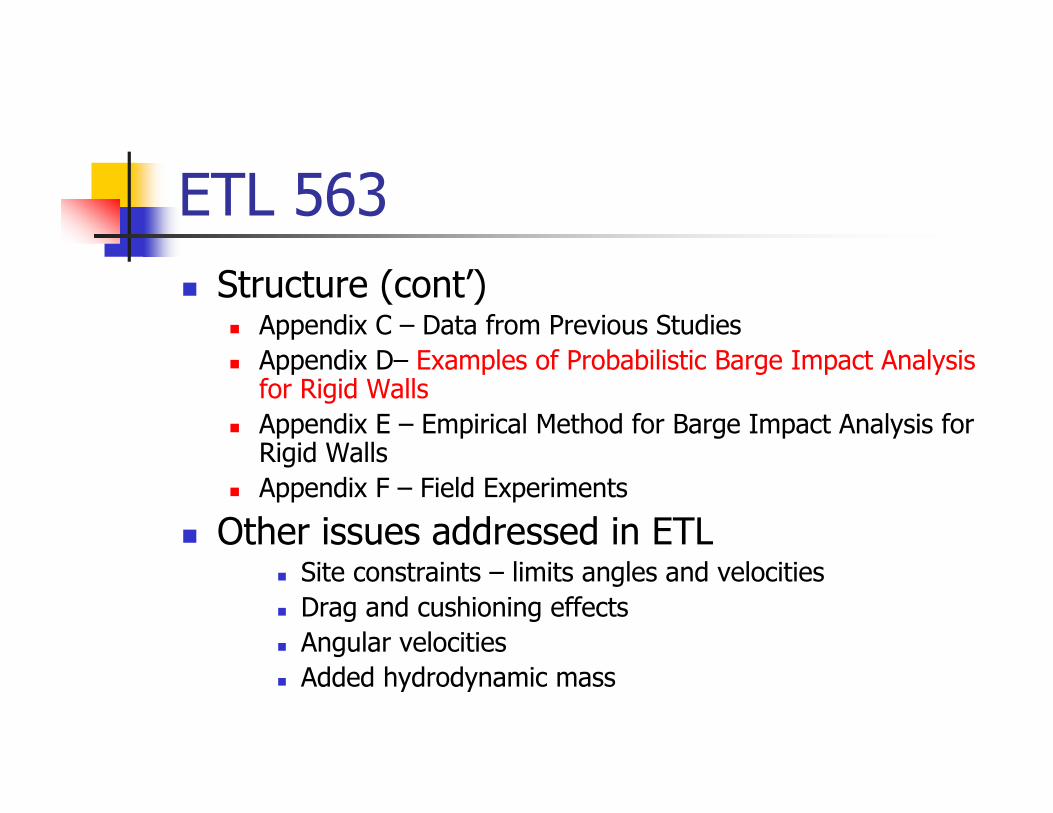
ETL 563� Structure (cont’)
� Appendix C – Data from Previous Studies� Appendix D– Examples of Probabilistic Barge Impact Analysis
for Rigid Walls� Appendix E – Empirical Method for Barge Impact Analysis for
Rigid Walls� Appendix F – Field Experiments
� Other issues addressed in ETL� Site constraints – limits angles and velocities� Drag and cushioning effects� Angular velocities� Added hydrodynamic mass
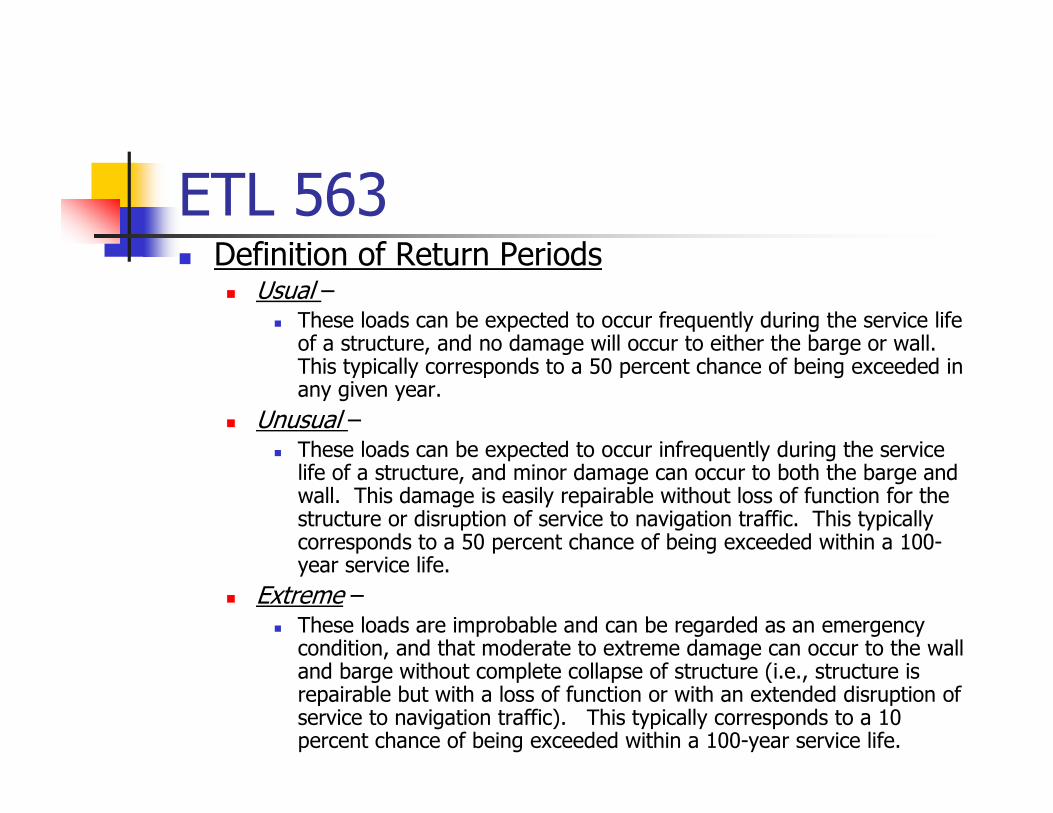
ETL 563� Definition of Return Periods
� Usual –� These loads can be expected to occur frequently during the service life
of a structure, and no damage will occur to either the barge or wall.This typically corresponds to a 50 percent chance of being exceeded inany given year.
� Unusual –� These loads can be expected to occur infrequently during the service
life of a structure, and minor damage can occur to both the barge andwall. This damage is easily repairable without loss of function for thestructure or disruption of service to navigation traffic. This typicallycorresponds to a 50 percent chance of being exceeded within a 100-year service life.
� Extreme –� These loads are improbable and can be regarded as an emergency
condition, and that moderate to extreme damage can occur to the walland barge without complete collapse of structure (i.e., structure isrepairable but with a loss of function or with an extended disruption ofservice to navigation traffic). This typically corresponds to a 10percent chance of being exceeded within a 100-year service life.
ETL 563
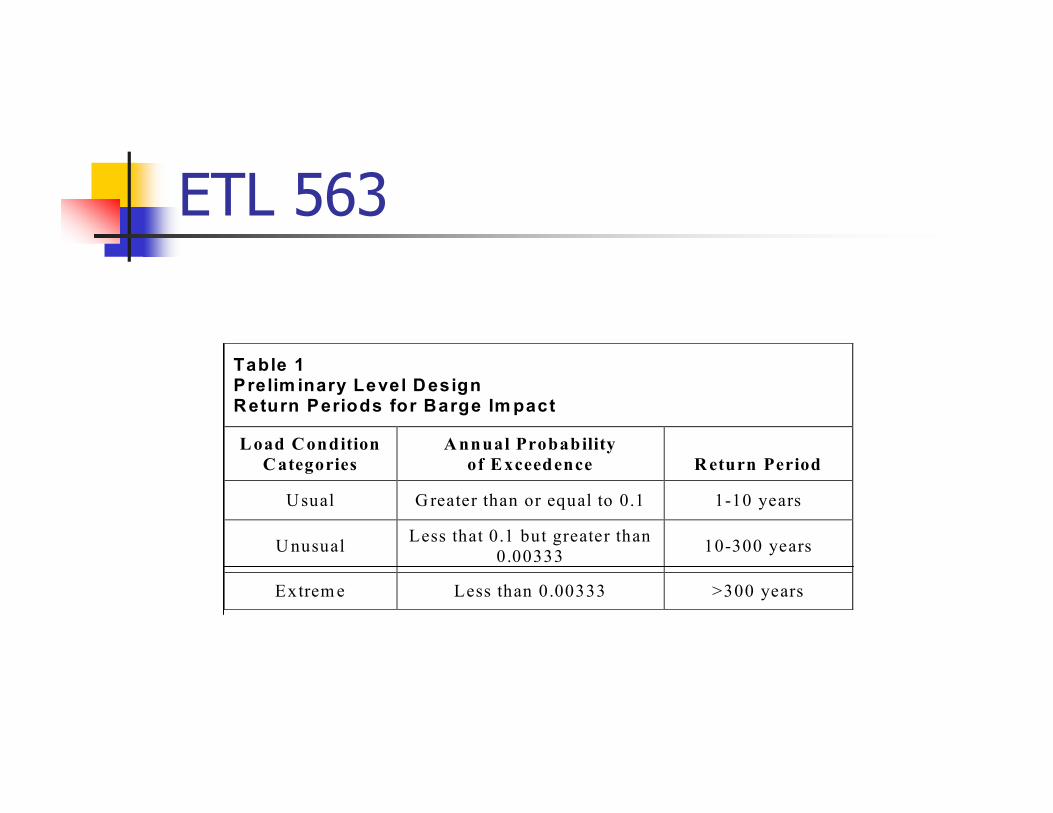
Table 1Prelim inary Level DesignReturn Periods for Barge Im pact
Load ConditionC ategories
A nnual Probabilityof Exceedence R eturn Period
Usual G reater than or equal to 0.1 1-10 years
U nusual Less that 0.1 but greater than0.00333 10-300 years
Extrem e Less than 0.00333 >300 years

ETL 563� Return periods
� Probabilistic Barge Impact Analysis (PBIA)� Similar to Probabilistic Seismic Hazard Analysis (PSHA)� Uses annual probability distributions for velocities, angle
and mass� Uses Monte Carlo Simulation to assists with determining
the return period (RP) or annual probability ofexceedance, P(E)
RP = 1 / P(E)

Examples of impact loads onlock structures
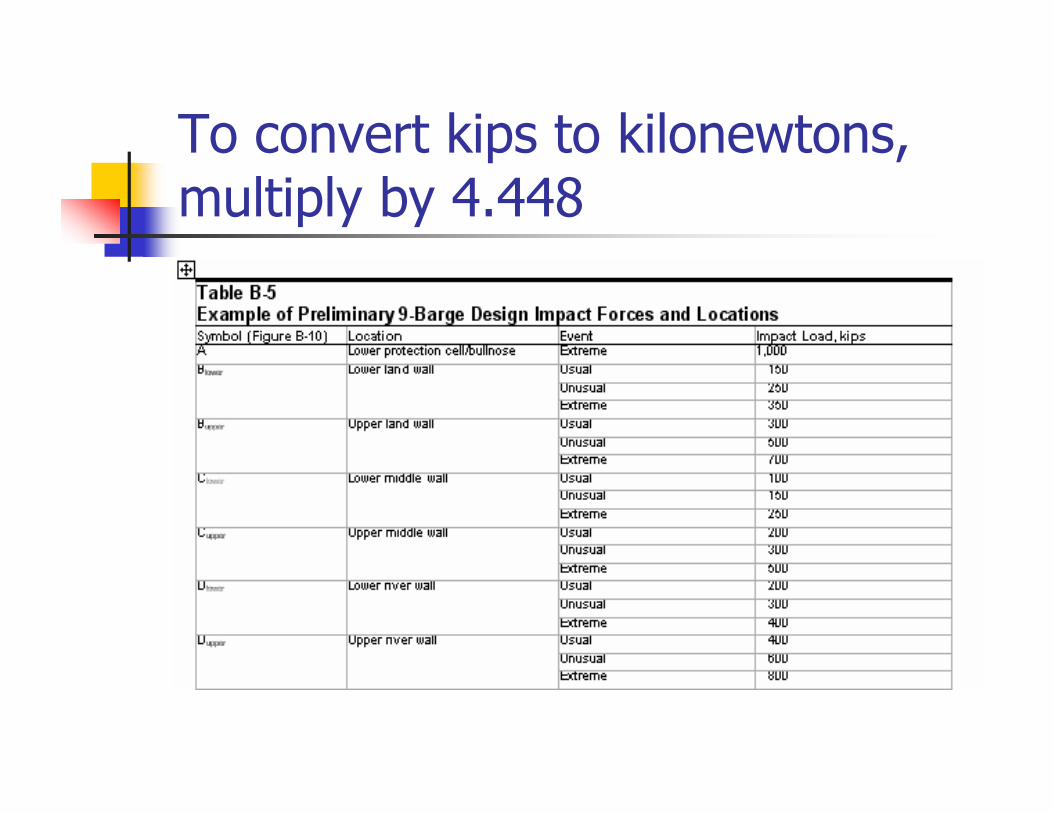
To convert kips to kilonewtons,multiply by 4.448
ETL 563
� Model Parameters� Velocity (x- and y-direction) and Angle
� Scale model testing� Time lapse video
� Mass� LPMS or WBC, Ship Logs
� Site Examples in Appendix C

ETL 563
Angle
X- and Y-Velocities
Mass
Monte Carlo Simulationof Empirical Model
Distribution ofImpact Force
INPUTS OUTPUT
CDF of Impact Force
0
1
Force
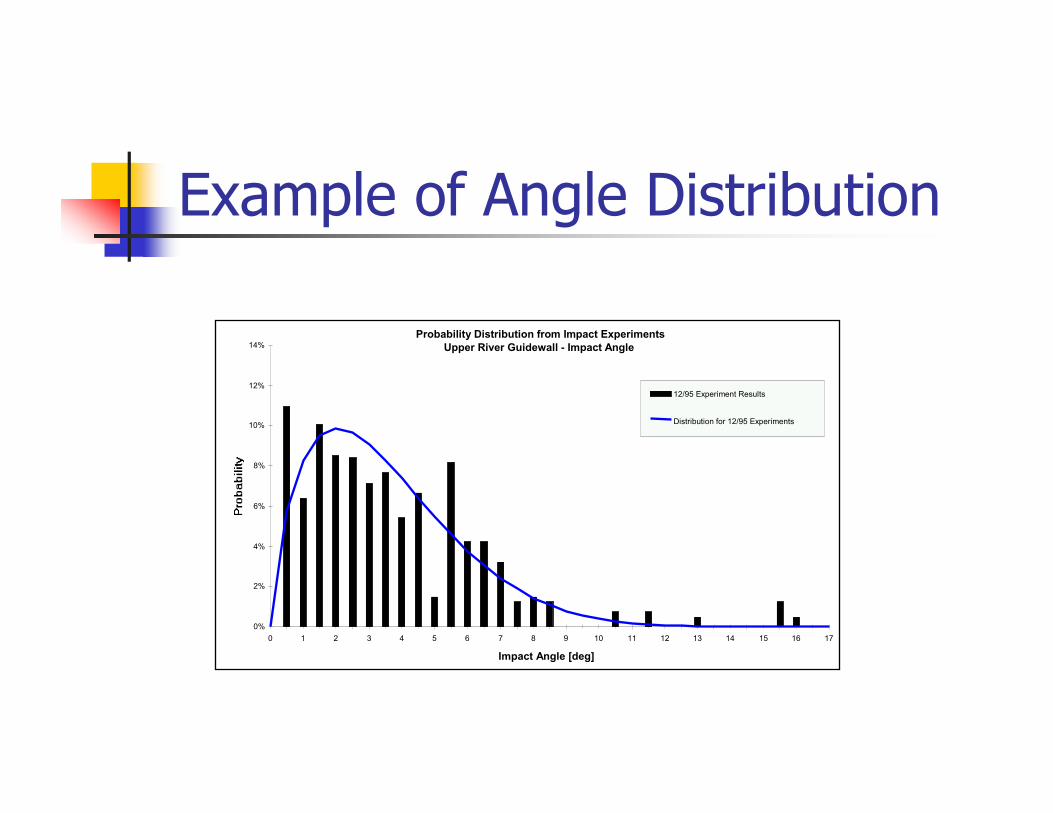
Example of Angle Distribution
Probability Distribution from Impact ExperimentsUpper River Guidewall - Impact Angle
17161514131211109876543210
Impact Angle [deg]
0%
2%
4%
6%
8%
10%
12%
14%
12/95 Experiment Results
Distribution for 12/95 Experiments
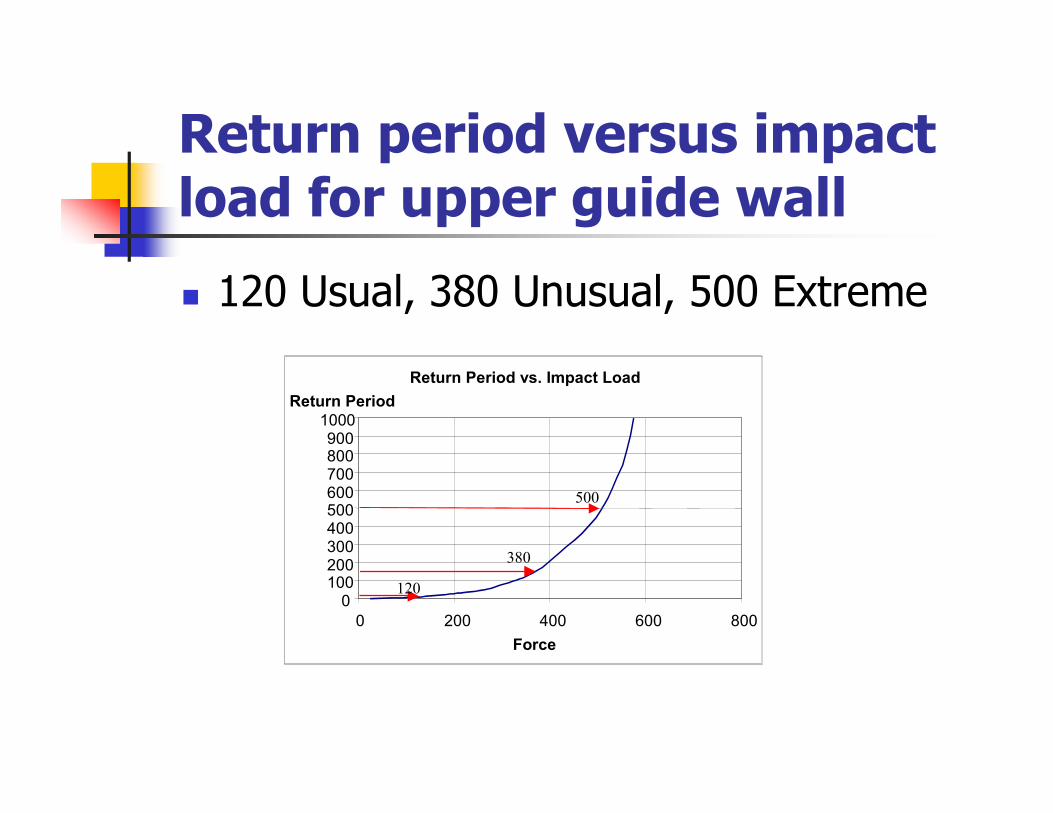
Return period versus impactload for upper guide wall
� 120 Usual, 380 Unusual, 500 Extreme
Return Period vs. Impact Load
0100200300400500600700800900
1000
0 200 400 600 800Force
Return Period
120
380
500
ETL 563� PBIA Example
� Velocities and angles from scale model test resultsat ERDC
� Mass distribution from LPMS or WBC data� Use Monte Carlo Simulation to generate
distribution for impact load� Use Cumulative Distribution Function (CDF) of
impact loads to determine return periods fordesign
� No extrapolation to extreme distributions
Continuing Efforts� Additional limit states
� Lashing failures� Flexible Walls� Head-on impacts
� Updates to ETL or new guidance
� Districts/Division-wide workshops� Hands-on training� Site specific analysis
� Computer programs� @Risk spreadsheet� Development of CASE Program