Barclays Africa Group Limited - ShareData Online · Barclays Africa Group Limited ... building...
158
Barclays Africa Group Limited Financial results for the reporting period ended 31 December 2015
-
Upload
truongdieu -
Category
Documents
-
view
238 -
download
0
Transcript of Barclays Africa Group Limited - ShareData Online · Barclays Africa Group Limited ... building...
Barclays Africa Group LimitedFinancial resultsfor the reporting period ended 31 December 2015
Barclays Africa Group Limited2015 Integrated Report
3590.41_Barclays Integrated_Report_cover_03.indd 1 2016/02/25 3:18 PM
Group performance 4Segment performance 51Risk management 122Appendices 142Administration and contact details IBC
Reporting changes overview
IFC Barclays Africa Group Limited Financial results for the reporting period ended 31 December 2015
The following changes resulted in financial results for the comparative period being restated:
1. Internalreclassifications In terms of the Group’s policy, financial assets with a maturity of less than three months should be reported as "Cash, cash balances and balances with central banks", while financial assets with a maturity of longer than three months are reported as "Investment securities". Based on an analysis performed on the maturity periods of treasury bills, in Rest of Africa, it was established that some treasury bills’ maturity period extended beyond three months and had been reported as “Cash, cash balances and balances with the central banks”. These items are now being reported as “Investment securities”.
2. Business portfolio changes Corporate and Investment Bank (“CIB”) and Retail and Business
Banking (“RBB”) performed a client resegmentation and refined the classification of costs and revenue, which resulted in restatements between the segments.
Costs between RBB, CIB as well as Head Office, Treasury and other operations have been restated due to a change in the allocation methodology.
The Group reassessed funds transfer pricing and the allocation of endowment, resulting in restatements between RBB and CIB in rest of Africa.
RBB – Retail Banking has moved the student loan portfolio, previously reported in Transactional and Deposits to Personal Loans.
CIB has aligned their business portfolios with product ownership between Corporate, Banking and Private Equity.
Certain loan portfolios were transferred from Wealth, Investment Management and Insurance (“WIMI”) – Wealth to RBB – Retail Banking.
Money markets, previously reported in CIB, has been moved to Head Office, Treasury and other operations, due to the centralisation of all treasury functions. Revenue and costs associated with Money markets have therefore been allocated across all segments.
WIMI has provided separate disclosure for products that will be terminated in future.
None of the aforementioned restatements have impacted the overall financial position or net earnings of the Group.
Dividend per shareFinal 550 centsInterim 450 cents
Key datesAnnual general meeting 17 May 2016Financial year-end 31 December 2016Dividend payment 11 April 2016
Shareholder communicationsShareholder information page 145Contact details page IBC
Icons used with this report
Remains the same
negative increase
positive increase
positive decrease
negative decrease
www.barclaysafrica.com Financial results for the reporting period ended 31 December 2015
1
The term Barclays Africa Group or the Group, refers to Barclays Africa Group Limited and its subsidiaries.
This report is printed on recycled paper that is 100% post-consumer waste sourced from either office or printing waste with no harmful chemicals used during the bleaching process. The byproducts of production of the paper are recycled into fertiliser, building materials and heat.
Contents
Reporting changes overview IFC
Group performance 4Group performance overview 4
About Barclays Africa 6
Our presence 8
Consolidated salient features 9
Consolidated salient features by segment 10
Profit and dividend announcement 11
Condensed consolidated statement of comprehensive income 18
Condensed consolidated statement of financial position 20
Condensed consolidated statement of changes in equity 22
Condensed consolidated statement of cash flows 24
Performance indicators and condensed notes to the consolidated financial statements 25
Segment performance 50Segment performance overview 51
Segment report per market segment 56
Segment report per geographical segment 58
Segment report per market and geographical segment 60
RBB 63
CIB 95
WIMI 103
Risk management 121Risk management overview 122
Capital management 129
Appendices 141Transition to Barclays Africa Group Limited 142
Share performance 144
Shareholder information and diary 145
Glossary 146
Abbreviations and acronyms 154
Administration and contact details 155

2 Barclays Africa Group Limited Financial results for the reporting period ended 31 December 2015
This page has been left blank intentionally
Group performanceSegment performanceRisk managementAppendices
www.barclaysafrica.com Financial results for the reporting period ended 31 December 2015
3
Group performance
ContentsGroup performance overview 4
Group overview 6
Our presence 8
Consolidated salient features 9
Consolidated salient features by segment 10
Profit and dividend announcement 11
Condensed consolidated statement of comprehensive income 18
Condensed consolidated statement of financial position 20
Condensed consolidated statement of changes in equity 22
Condensed consolidated statement of cash flows 24
Performance indicators and condensed notes to the consolidated financial statements 25
Barclays Africa Group Limited (1986/003934/06)
Results for the reporting period ended 31 December 2015
Date of publication: 1 March 2016
4 Barclays Africa Group Limited Financial results for the reporting period ended 31 December 2015
Group performance Overview 4Segment performance Salient features 9Risk management Profit and dividend announcement 11Appendices Financials 18Administration and contact details Notes to the financials 25
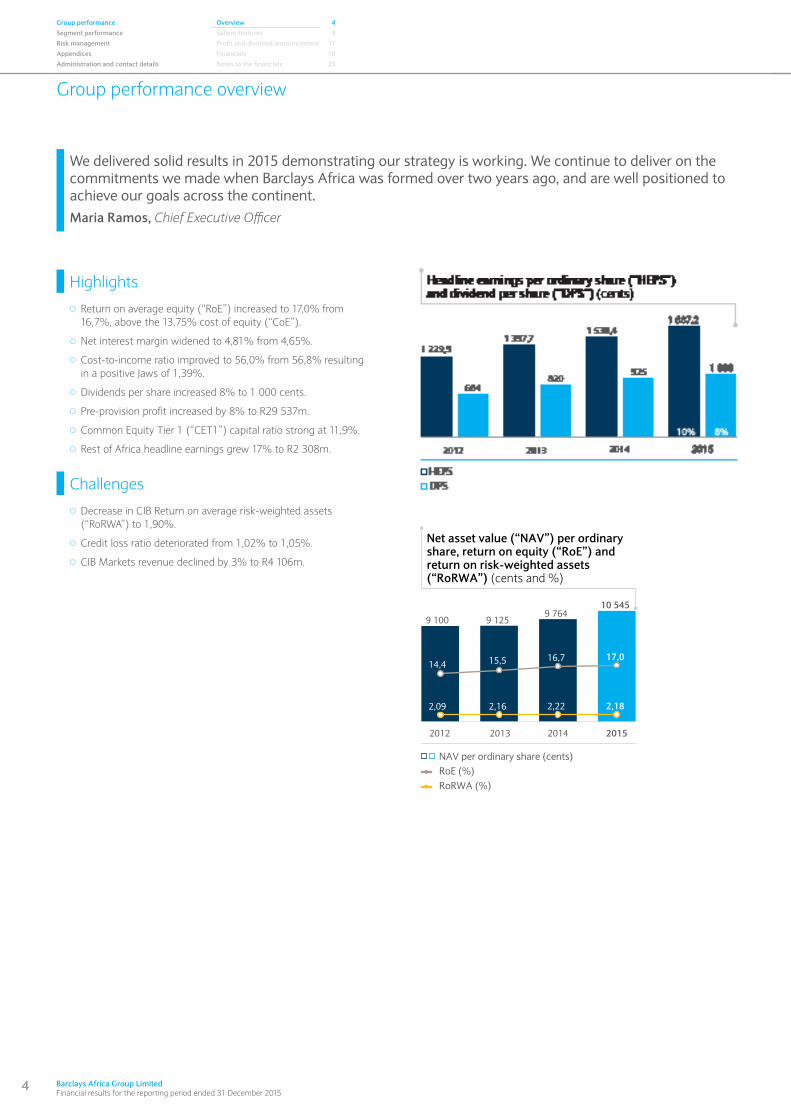
We delivered solid results in 2015 demonstrating our strategy is working. We continue to deliver on the commitments we made when Barclays Africa was formed over two years ago, and are well positioned to achieve our goals across the continent.Maria Ramos, Chief Executive Officer
Highlights
Return on average equity (“RoE”) increased to 17,0% from 16,7%, above the 13,75% cost of equity (“CoE”).
Net interest margin widened to 4,81% from 4,65%.
Cost-to-income ratio improved to 56,0% from 56,8% resulting in a positive Jaws of 1,39%.
Dividends per share increased 8% to 1 000 cents.
Pre-provision profit increased by 8% to R29 537m.
Common Equity Tier 1 (“CET1”) capital ratio strong at 11,9%.
Rest of Africa headline earnings grew 17% to R2 308m.
Challenges
Decrease in CIB Return on average risk-weighted assets (“RoRWA”) to 1,90%.
Credit loss ratio deteriorated from 1,02% to 1,05%.
CIB Markets revenue declined by 3% to R4 106m.
Group performance overview
� � NAV per ordinary share (cents) RoE (%) RoRWA (%)
9 125
10 545
17,0
2,18
9 764
15,5 16,7
2,16 2,22
20152013
9 100
14,4
2,09
2012 2014
Net asset value (“NAV”) per ordinary share, return on equity (“RoE”) and return on risk-weighted assets(“RoRWA”) (cents and %)

www.barclaysafrica.com Financial results for the reporting period ended 31 December 2015
5
This page has been left blank intentionally
6 Barclays Africa Group Limited Financial results for the reporting period ended 31 December 2015
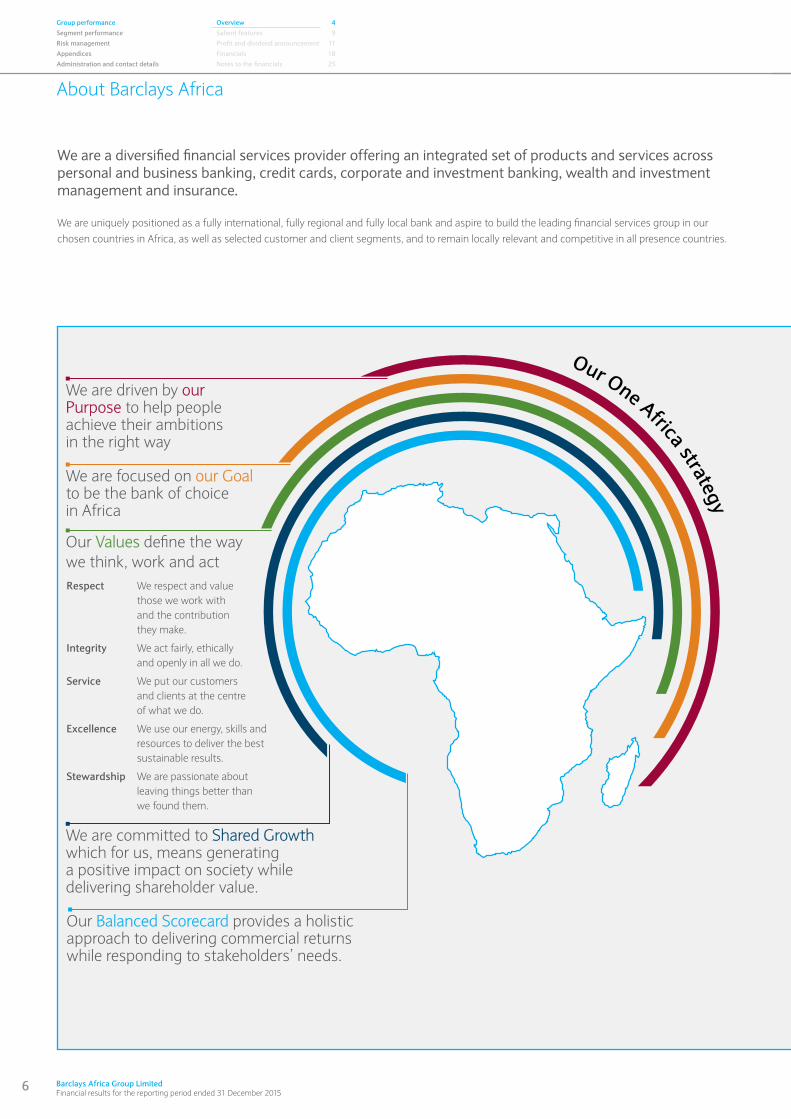
About Barclays Africa
We are a diversified financial services provider offering an integrated set of products and services across personal and business banking, credit cards, corporate and investment banking, wealth and investment management and insurance.
We are uniquely positioned as a fully international, fully regional and fully local bank and aspire to build the leading financial services group in our chosen countries in Africa, as well as selected customer and client segments, and to remain locally relevant and competitive in all presence countries.
Our One Africa strategy
We are driven by our Purpose to help people achieve their ambitions in the right way
We are committed to Shared Growth which for us, means generating a positive impact on society while delivering shareholder value.
Our Balanced Scorecard provides a holistic approach to delivering commercial returns while responding to stakeholders’ needs.
We are focused on our Goal to be the bank of choice in Africa
Our Values define the way we think, work and act Respect We respect and value
those we work with and the contribution they make.
Integrity We act fairly, ethically and openly in all we do.
Service We put our customers and clients at the centre of what we do.
Excellence We use our energy, skills and resources to deliver the best sustainable results.
Stewardship We are passionate about leaving things better than we found them.
Group performance Overview 4Segment performance Salient features 9Risk management Profit and dividend announcement 11Appendices Financials 18Administration and contact details Notes to the financials 25
www.barclaysafrica.com Financial results for the reporting period ended 31 December 2015
7
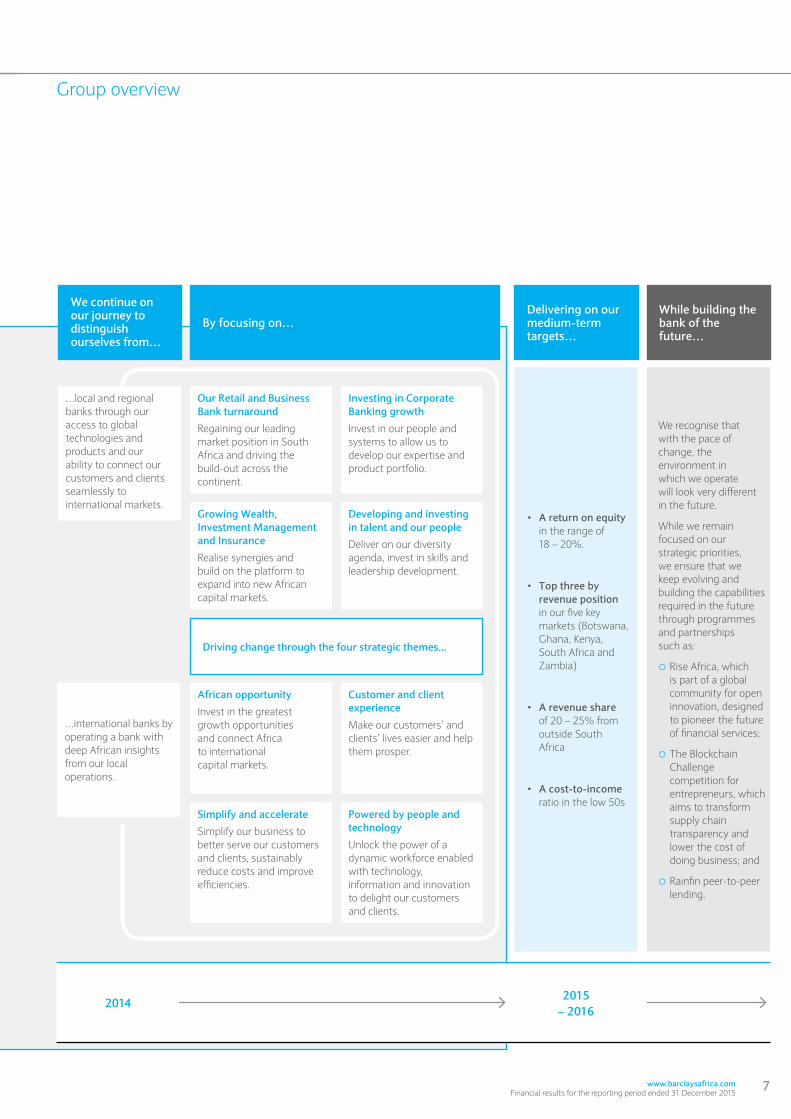
Group overview
We continue on our journey to distinguish ourselves from…
Delivering on our medium-term targets…
While building the bank of the future…
By focusing on…
Driving change through the four strategic themes...
We recognise that with the pace of change, the environment in which we operate will look very different in the future.
While we remain focused on our strategic priorities, we ensure that we keep evolving and building the capabilities required in the future through programmes and partnerships such as:
{{ Rise Africa, which is part of a global community for open innovation, designed to pioneer the future of financial services;
{{ The Blockchain Challenge competition for entrepreneurs, which aims to transform supply chain transparency and lower the cost of doing business; and
{{ Rainfin peer-to-peer lending.
…international banks by operating a bank with deep African insights from our local operations.
…local and regional banks through our access to global technologies and products and our ability to connect our customers and clients seamlessly to international markets.
Growing Wealth, Investment Management and Insurance
Realise synergies and build on the platform to expand into new African capital markets.
Simplify and accelerate
Simplify our business to better serve our customers and clients, sustainably reduce costs and improve efficiencies.
Our Retail and Business Bank turnaround
Regaining our leading market position in South Africa and driving the build-out across the continent.
African opportunity
Invest in the greatest growth opportunities and connect Africa to international capital markets.
Developing and investing in talent and our people
Deliver on our diversity agenda, invest in skills and leadership development.
Powered by people and technology
Unlock the power of a dynamic workforce enabled with technology, information and innovation to delight our customers and clients.
Investing in Corporate Banking growth
Invest in our people and systems to allow us to develop our expertise and product portfolio.
Customer and client experience
Make our customers’ and clients’ lives easier and help them prosper.
• A return on equity in the range of 18 – 20%.
• Top three by revenue position in our five key markets (Botswana, Ghana, Kenya, South Africa and Zambia)
• A revenue share of 20 – 25% from outside South Africa
• A cost-to-income ratio in the low 50s
2015 – 2016
2014
8 Barclays Africa Group Limited Financial results for the reporting period ended 31 December 2015
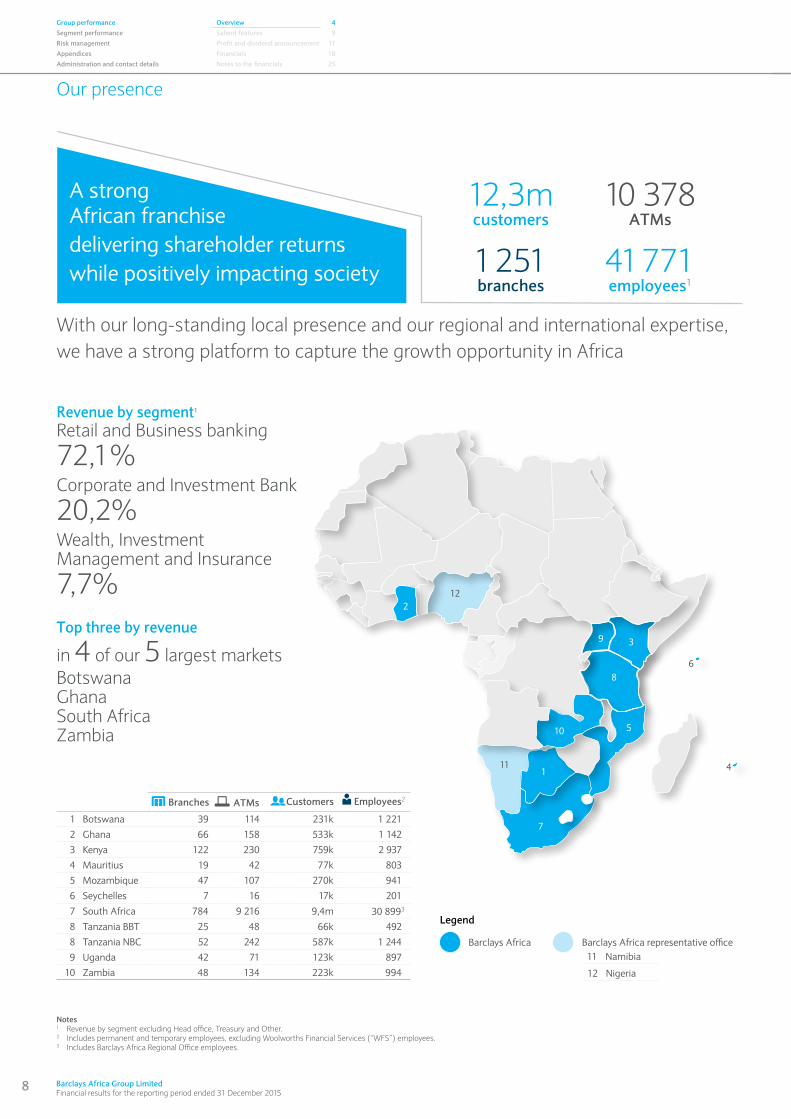
Our presence
Notes1 Revenue by segment excluding Head office, Treasury and Other.2 Includes permanent and temporary employees, excluding Woolworths Financial Services (“WFS”) employees.3 Includes Barclays Africa Regional Office employees.
Branches ATMs Customers
1 Botswana 39 114 231k 1 221
2 Ghana 66 158 533k 1 142
3 Kenya 122 230 759k 2 937
4 Mauritius 19 42 77k 803
5 Mozambique 47 107 270k 941
6 Seychelles 7 16 17k 201
7 South Africa 784 9 216 9,4m 30 8993
8 Tanzania BBT 25 48 66k 492
8 Tanzania NBC 52 242 587k 1 244
9 Uganda 42 71 123k 897
10 Zambia 48 134 223k 994
Employees2
Revenue by segment1
Retail and Business banking
72,1%Corporate and Investment Bank
20,2% Wealth, Investment Management and Insurance
7,7%Top three by revenue
in 4 of our 5 largest marketsBotswana Ghana South Africa Zambia
Legend
Barclays Africa Barclays Africa representative office
12 Nigeria
11 Namibia
2
1
7
10 5
8
9 3
6
4
12
11
With our long-standing local presence and our regional and international expertise, we have a strong platform to capture the growth opportunity in Africa
A strong African franchisedelivering shareholder returnswhile positively impacting society
12,3mcustomers
1 251branches
41 771employees1
10 378ATMs
Group performance Overview 4Segment performance Salient features 9Risk management Profit and dividend announcement 11Appendices Financials 18Administration and contact details Notes to the financials 25
www.barclaysafrica.com Financial results for the reporting period ended 31 December 2015
9
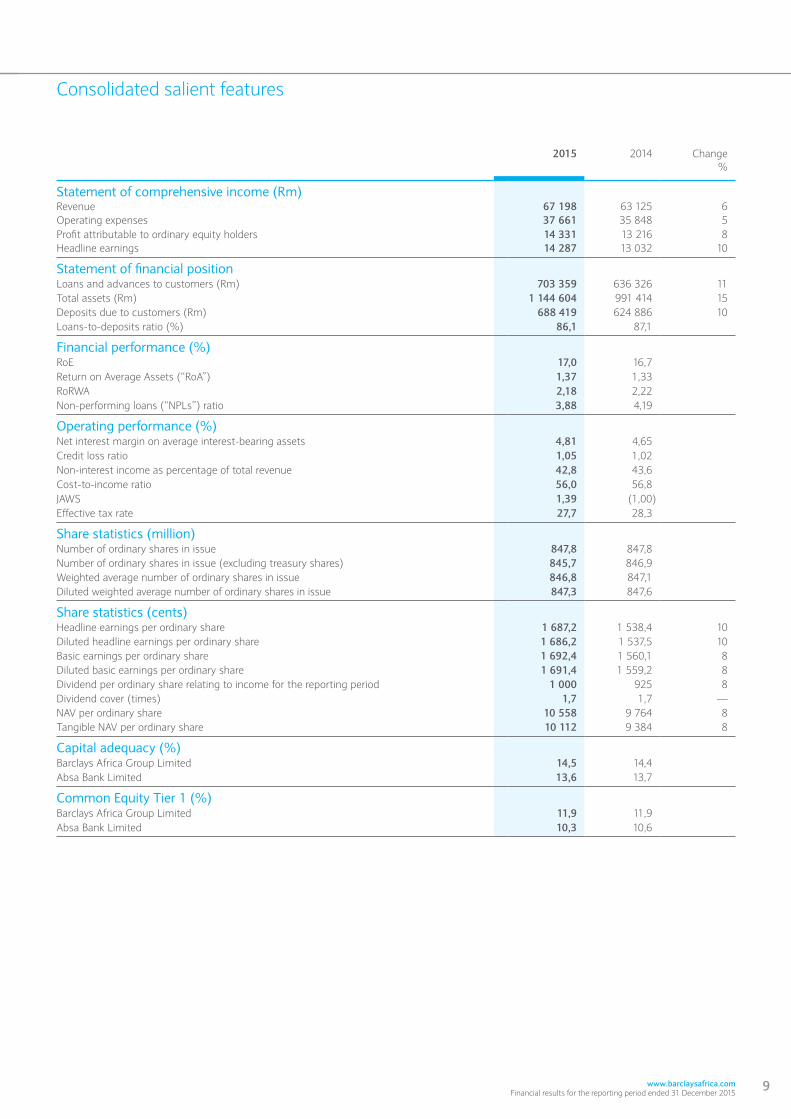
Consolidated salient features
2015 2014 Change%
Statement of comprehensive income (Rm)Revenue 67 198 63 125 6Operating expenses 37 661 35 848 5Profit attributable to ordinary equity holders 14 331 13 216 8Headline earnings 14 287 13 032 10
Statement of financial positionLoans and advances to customers (Rm) 703 359 636 326 11Total assets (Rm) 1 144 604 991 414 15Deposits due to customers (Rm) 688 419 624 886 10Loans-to-deposits ratio (%) 86,1 87,1
Financial performance (%)RoE 17,0 16,7Return on Average Assets (“RoA”) 1,37 1,33RoRWA 2,18 2,22Non-performing loans (“NPLs”) ratio 3,88 4,19
Operating performance (%)Net interest margin on average interest-bearing assets 4,81 4,65Credit loss ratio 1,05 1,02Non-interest income as percentage of total revenue 42,8 43,6Cost-to-income ratio 56,0 56,8JAWS 1,39 (1,00)Effective tax rate 27,7 28,3
Share statistics (million)Number of ordinary shares in issue 847,8 847,8Number of ordinary shares in issue (excluding treasury shares) 845,7 846,9Weighted average number of ordinary shares in issue 846,8 847,1Diluted weighted average number of ordinary shares in issue 847,3 847,6
Share statistics (cents)Headline earnings per ordinary share 1 687,2 1 538,4 10Diluted headline earnings per ordinary share 1 686,2 1 537,5 10Basic earnings per ordinary share 1 692,4 1 560,1 8Diluted basic earnings per ordinary share 1 691,4 1 559,2 8Dividend per ordinary share relating to income for the reporting period 1 000 925 8Dividend cover (times) 1,7 1,7 —NAV per ordinary share 10 558 9 764 8Tangible NAV per ordinary share 10 112 9 384 8
Capital adequacy (%)Barclays Africa Group Limited 14,5 14,4Absa Bank Limited 13,6 13,7
Common Equity Tier 1 (%)Barclays Africa Group Limited 11,9 11,9Absa Bank Limited 10,3 10,6
10 Barclays Africa Group Limited Financial results for the reporting period ended 31 December 2015
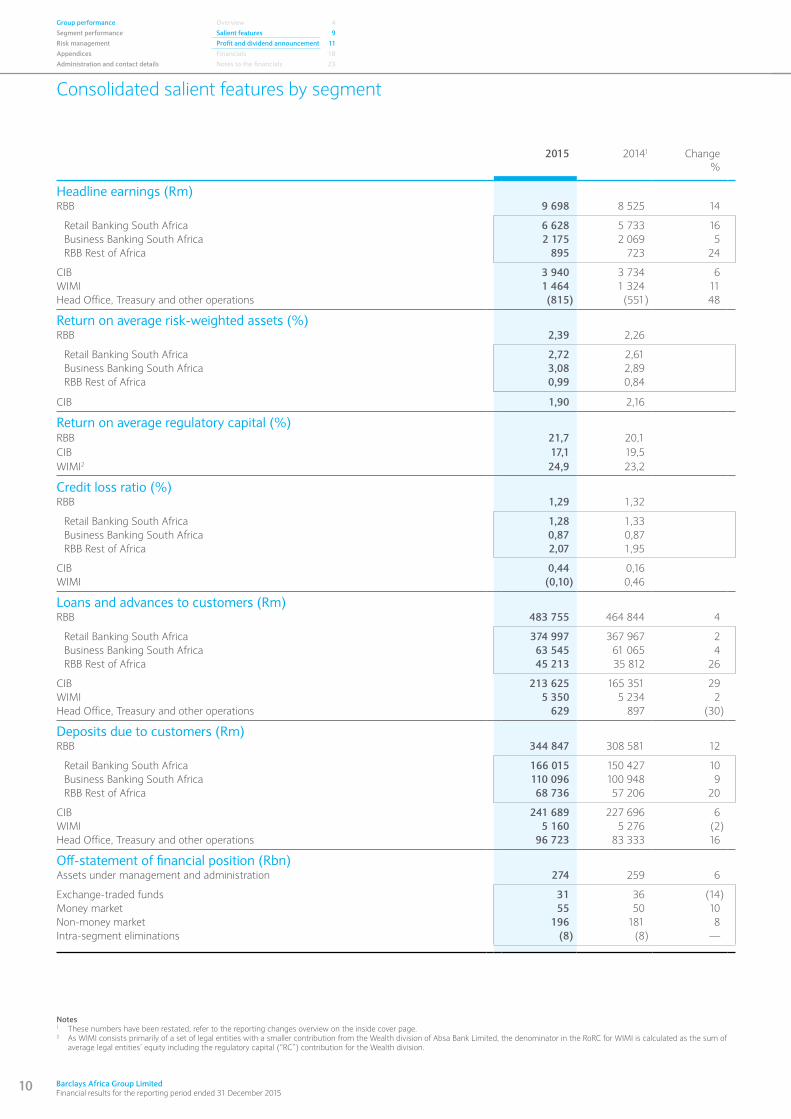
Consolidated salient features by segment
2015 20141 Change%
Headline earnings (Rm)RBB 9 698 8 525 14
Retail Banking South Africa 6 628 5 733 16Business Banking South Africa 2 175 2 069 5RBB Rest of Africa 895 723 24
CIB 3 940 3 734 6WIMI 1 464 1 324 11Head Office, Treasury and other operations (815) (551) 48
Return on average risk-weighted assets (%)RBB 2,39 2,26
Retail Banking South Africa 2,72 2,61Business Banking South Africa 3,08 2,89RBB Rest of Africa 0,99 0,84
CIB 1,90 2,16
Return on average regulatory capital (%)RBB 21,7 20,1CIB 17,1 19,5WIMI2 24,9 23,2
Credit loss ratio (%)RBB 1,29 1,32
Retail Banking South Africa 1,28 1,33Business Banking South Africa 0,87 0,87RBB Rest of Africa 2,07 1,95
CIB 0,44 0,16WIMI (0,10) 0,46
Loans and advances to customers (Rm)RBB 483 755 464 844 4
Retail Banking South Africa 374 997 367 967 2Business Banking South Africa 63 545 61 065 4RBB Rest of Africa 45 213 35 812 26
CIB 213 625 165 351 29WIMI 5 350 5 234 2Head Office, Treasury and other operations 629 897 (30)
Deposits due to customers (Rm)RBB 344 847 308 581 12
Retail Banking South Africa 166 015 150 427 10Business Banking South Africa 110 096 100 948 9RBB Rest of Africa 68 736 57 206 20
CIB 241 689 227 696 6WIMI 5 160 5 276 (2)Head Office, Treasury and other operations 96 723 83 333 16
Off-statement of financial position (Rbn)Assets under management and administration 274 259 6
Exchange-traded funds 31 36 (14)Money market 55 50 10Non-money market 196 181 8Intra-segment eliminations (8) (8) —
Notes1 These numbers have been restated, refer to the reporting changes overview on the inside cover page.2 As WIMI consists primarily of a set of legal entities with a smaller contribution from the Wealth division of Absa Bank Limited, the denominator in the RoRC for WIMI is calculated as the sum of
average legal entities’ equity including the regulatory capital (“RC”) contribution for the Wealth division.
Group performance Overview 4Segment performance Salient features 9Risk management Profit and dividend announcement 11Appendices Financials 18Administration and contact details Notes to the financials 23
www.barclaysafrica.com Financial results for the reporting period ended 31 December 2015
11
Profit and dividend announcement
Salient features Diluted HEPS increased 10% to 1 686 cents.
Declared a DPS of 1 000 cents, up 8%.
Rest of Africa headline earnings grew 17% to R2,3bn and South Africa rose 8% to R12,0bn.
RoE improved to 17,0% from 16,7%.
Pre-provision profit increased 8% to R29,5bn.
Revenue grew 6% to R67,2bn, as net interest income increased 8% and non-interest income rose 5%, while operating expenses grew 5% to R37,7bn.
Credit impairments increased 10% to R6,9bn resulting in a 1,05% credit loss ratio from 1,02%.
Barclays Africa Group Limited’s CET1 ratio of 11,9% remains above regulatory requirements and our board target range.
Overview of resultsBarclays Africa Group Limited’s headline earnings increased 10% to R14 287m from R13 032m. Diluted HEPS also grew 10% to 1 686 cents from 1 538 cents. The Group’s RoE improved to 17,0% from 16,7%, comfortably above its 13,75% CoE for 2015, due to its return on assets rising to 1,37% from 1,33%. Barclays Africa Group declared a 8% higher full year ordinary DPS of 1 000 cents, given its strong CET1 ratio and internal capital generation capacity. NAV per share increased 8% to 10 558 cents.
Pre-provision profit increased 8% to R29,5bn, which drove earnings growth. Non-interest income grew 5% and net interest income 8%, as the Group’s net interest margin (on average interest-bearing assets) improved to 4,81% from 4,65%. Loans and advances to customers grew 11% to R703bn, while deposits due to customers increased 10% to R688bn. The Group’s cost-to-income ratio improved to 56,0% from 56,8% as operating expenses rose 5%. Credit impairments grew 10%, as NPL cover rose marginally and portfolio provisions increased to 0,73% of performing loans from 0,70%. NPLs declined to 3,9% of gross loans and advances to customers from 4,2%.
RBB's headline earnings increased 14% to R9,7bn, as revenue grew 6% and costs rose 4%, with Home Loans and Card earnings growing 15% and 25% respectively. WIMI’s headline earnings increased 11% to R1,5bn, with 14% growth in Life Insurance, while CIB grew 6% to R3,9bn, including 16% higher Corporate earnings.
Revenue from Rest of Africa grew 14% and headline earnings rose 17% to R2,3bn, to contribute 21% and 16% of the total Group respectively.
Operating environmentGlobal markets saw heightened financial volatility, renewed pressure on commodity prices and concerns about growth. We expect global growth of 3,1% in 2015, supported by consumption in advanced economies. Emerging market growth slowed largely led by China, Brazil and Russia. The Federal Reserve raised rates for the first time since 2006. Conversely, monetary policy was eased in the euro area during the year.
South Africa’s growth slowed under the pressure of drought, continued electricity supply challenges and falling commodity prices. Weak consumer confidence and rising interest rates weighed on household spending. Economic growth is forecast to have slowed to 1,3% in 2015 from 1,5% in 2014. The rand lost a quarter of its value against major currencies during the year. Growth in the Barclays Africa Group markets in the rest of Africa moderated further due to lower commodity prices and an adverse external environment. Fiscal and current accounts deteriorated, putting pressure on African currencies and inflation.
12 Barclays Africa Group Limited Financial results for the reporting period ended 31 December 2015
Profit and dividend announcement
Group performance Overview 4Segment performance Salient features 9Risk management Profit and dividend announcement 11Appendices Financials 18Administration and contact details Notes to the financials 25
Group performanceStatement of financial positionTotal Group assets increased 15% to R1 145bn at 31 December 2015, predominantly due to 11% higher loans and advances to customers, while trading portfolio assets grew 52% and loans and advances to banks rose 19%.
Loans and advances to customers
Loans and advances to customers increased 11% to R703bn, or to 7% excluding rand depreciation and growth in reverse repurchase agreements. Retail Banking South Africa’s loans rose 2% to R375bn, given 6% growth in Vehicle and Asset Finance and 8% higher Personal Loans, while Home Loans was flat. Business Banking South Africa’s loans rose 4% to R64bn, including 15% higher term loans and 9% growth in agriculture loans. RBB Rest of Africa’s loans increased 26% to R45bn, in part due to rand depreciation. CIB’s loans increased 29% to R214bn, given strong growth in term loans, preference shares and reverse repurchase agreements.
Funding
The Group maintained its strong liquidity position, growing deposits due to customers 10% to R688bn and improving its loans-to-deposit ratio to 86% from 87%. Deposits due to customers contributed 78% to total funding from 80%. Retail Banking South Africa maintained its leading market share and increased deposits 10% to R166bn. Business Banking South Africa’s deposits grew 9% to R110bn, with 19% higher savings and transmission deposits. RBB’s 12% deposit growth reduced the proportion of more expensive wholesale funding. CIB’s deposits increased 6% to R242bn, given 10% higher cheque account deposits and 8% lower fixed deposits.
Net asset value
The Group’s NAV rose 8% to R89,3bn, as it generated profits of R14,3bn in the period, from which it paid R8,2bn in dividends. Its foreign currency translation reserve grew by R3,0bn to R6,5bn. The Group’s NAV per share also grew 8% to 10 558 cents.
Capital to risk-weighted assets
Group risk-weighted assets (“RWA(s)”) increased 13% to R703bn at 31 December 2015, in line with its asset growth. The Group remains well capitalised, comfortably above minimum regulatory requirements. Barclays Africa Group Limited’s CET1 and Tier 1 capital adequacy ratios were 11,9% and 12,6% respectively (from 11,9% and 12,7%). The Group generated 2,1% of CET1 capital internally during the period. Its total capital adequacy ratio was 14,5%, at the top end of the board target range of 12,5% to 14,5%. Declaring an 8% higher DPS of 1 000 cents – a dividend cover of 1,7 times – was well considered, based on the Group’s strong capital position, internal capital generation, strategy and growth plans.
Statement of comprehensive incomeNet interest income
Net interest income increased 8% to R38 407m from R35 601m, with average interest-bearing assets growing 4%. The Group’s net interest margin improved to 4,81% from 4,65%.
Loan pricing had an 8 basis points (“bps”) positive impact, as improved pricing in Home Loans and Personal Loans offset compression in Vehicle and Asset Finance. The deposit margin was unchanged, as compression in Business Banking offset improved retail spreads and the mix benefit of less wholesale funding.
Higher South African interest rates resulted in an endowment contribution on deposits and equity of 3 bps. Despite releasing R1 110m to the income statement, the benefit from structural hedging declined by 6 bps. The cash flow hedging reserve relating to the structural hedging programme decreased to a R2,1bn debit after tax from a R0,4bn credit. Rest of Africa added 4 bps to the Group margin, as its margin improved by 10 bps and its weighting in the overall composition increased. Changing the funding model for foreign currency loans within CIB added 8 bps to the total margin, partly offset by higher liquid assets.
www.barclaysafrica.com Financial results for the reporting period ended 31 December 2015
13
Profit and dividend announcement
Group performance (continued)
Statement of comprehensive income (continued)
Non-interest income
Non-interest income increased 5% to R28 791m from R27 524m accounting for 43% of total income. Rest of Africa grew 18% to R4 933m, with strong WIMI and RBB growth, to exceed South Africa’s 2% increase to R23 858m. Net fee and commission income rose 8% to R20 155m, with strong growth in credit cards and electronic banking of 37% and 12% respectively, while merchant income decreased 7% to R1 731m due to reduced industry interchange rates.
RBB’s non-interest income grew 7% to R18 238m, 63% of the total. Retail Banking South Africa increased 5% to R12 282m with 2% growth in customers offsetting continued migration to bundled products and electronic channels. Card non-interest income grew 9%, with 14% growth in acquiring volumes, despite new interchange rules reducing revenue by R300m. Business Banking’s non-interest income grew 5% to R3 336m, largely due to 14% higher cheque account income and 10% growth in electronic banking income. Enhanced digital functionality and reclassifying cash-handling device-related costs to non-interest income reduced cash-related transaction income growth by 3%, while cheque payment volumes fell 21%. RBB Rest of Africa’s 21% higher non-interest income of R2 620m reflects increased transaction volumes, particularly in card and foreign exchange.
WIMI’s non-interest income increased 7% to R4 962m, with improved growth in South Africa of 6% and a 24% rise in the Rest of Africa. Net insurance premiums grew 8% and Wealth and Investments by 10% on higher assets under management.
CIB’s non-interest income decreased 9% to R5 926m, largely due to a change in its funding model for foreign currency loans that reduced trading revenue and R202m of negative revaluations in Private Equity. Overall Markets net revenue (revenue including credit impairments) decreased 3% to R4 106m with a 23% decline in Fixed Income and Credit and 19% lower Foreign Exchange and Commodities revenue in South Africa, offset by 23% and 21% growth in Rest of Africa Markets and Equities and Prime Services respectively.
Impairment losses on loans and advances
Credit impairments increased 10% to R6 920m from R6 290m, resulting in a 1,05% credit loss ratio from 1,02%. Total NPL cover improved to 43,2% from 43,0%. Balance sheet portfolio provisions increased 15% to R5,0bn, or 0,73% of performing loans from 0,70%. Group NPLs declined to 3,9% of gross customer loans and advances from 4,2% while increasing 2,2% to R28,0bn.
RBB’s credit impairments grew 1% to R6,1bn, a 1,29% credit loss ratio from 1,32%. Retail Banking South Africa’s charge declined 2% to R4,8bn, as lower mortgage credit impairments outweighed a 6% rise in Vehicle and Asset Finance (“VAF”).
Home Loans’ charge decreased 20% to R689m, a 0,30% credit loss ratio, given improved collections processes and the high quality of new business written in recent years. Mortgage NPLs fell 11% to R9,3bn, 4,0% of gross loans. NPL cover in mortgages decreased to 22,1% from 25,3%, as aged NPLs were written off. VAF's credit loss ratio improved to 0,98% from 1,01%. Instalment credit agreements NPLs increased to 2,2% of gross loans and its NPL cover declined to 38,8%, due to accelerating write-offs of aged legal accounts, which reduced the NPL book’s average age.
Credit card’s charge increased 4% to R2 344m, a 6,07% credit loss ratio from 6,19%. The Edcon portfolio’s charge declined 15% to R893m, a 10,18% credit loss ratio. The credit loss ratio for the remainder of the Card book increased 20% to R1 451m, reflecting the operating environment and seasoning of recent growth. Personal Loans’ credit loss ratio improved to 5,64% from 6,06% reflecting lending to lower risk existing customers and enhanced collections.
Business Banking South Africa’s credit impairments grew 4% to R548m, a flat 0,87% credit loss ratio. A 70% lower charge for CPF and mortgages was the driver, while term loan impairments increased significantly. NPLs fell 16% to R3 306m or 5,1% of gross loans. Performing loan cover increased further to 1,07%. RBB Rest of Africa’s credit impairments rose 21% to R777m, increasing its credit loss ratio to 2,07% from 1,95%. Its NPLs increased 9% to R3 573m, while performing loan cover increased to 1,12% from 0,95%. CIB’s credit impairments increased 220% off a low base to R793m, reflecting maturation of its loan growth and deterioration in some sectors. NPLs rose 72% to R2 834m, while portfolio provisions increased to 0,36% of performing loans.
14 Barclays Africa Group Limited Financial results for the reporting period ended 31 December 2015
Profit and dividend announcement
Group performance Overview 4Segment performance Salient features 9Risk management Profit and dividend announcement 11Appendices Financials 18Administration and contact details Notes to the financials 25
Group performance (continued)
Statement of comprehensive income (continued)
Operating expenses
Operating expenses grew 5% to R37 661m from R35 848m. South Africa’s 4% cost growth was below inflation, while Rest of Africa costs rose 9%, reflecting continued investment spend. Staff costs rose 8% to R20 902m to account for 56% of total expenses. Salaries grew 8% due to higher wage increases for entry level employees and hiring in specialist areas such as Information Technology (“IT”). Incentives rose 5%, as bonuses rose 11% and share-based payments fell 8%.
Non-staff costs grew 1,5% to R16 759m, as structural cost programmes produced efficiency gains that enabled continued investment in growth initiatives. Property-related costs decreased 1% to R5 209m, reflecting portfolio optimisation and lower dilapidation costs. Total IT-related costs increased 7% to R6 675m, 18% of overall costs. Depreciation declined 3% and amortisation of intangible assets decreased 6% due to impairments recognised in 2014. Marketing costs grew 8% to R1 740m, given increased product advertising. Professional fees increased 18% reflecting strategic growth projects. Barclays Bank PLC spent approximately GBP30m on IT in the rest of Africa, which will continue for another two years. Other costs fell 18%, largely due to reduced fraud losses.
RBB and WIMI’s operating expenses increased 4% to R28 168m and 4% to R3 018m respectively. Retail Banking South Africa’s operating expenses grew 3%, driven by operational efficiencies and managing discretionary costs. Despite investing in relationship managers and systems, Business Banking South Africa’s cost growth was contained to 4%. RBB Rest of Africa’s operating expenses grew 7% despite strategic investments and inflationary pressures. CIB’s cost grew 9% to R7 436m, reflecting higher IT spend.
Taxation
The Group’s taxation expense increased 6% to R5 899m, slightly less than the 8% growth in pre-tax profit, resulting in a 27,7% effective tax rate from 28,3%. The decline was largely due to reducing expenses that were not deductible for tax purposes.
Segment performanceGroup earnings remain well diversified by business and product line. RBB accounted for 64% of Group headline earnings excluding head office, eliminations and other central items. CIB contributed 26% and WIMI 10%.
Retail Banking South AfricaHeadline earnings grew 16% to R6 628m, driven by 10% higher pre-provision profits and 2% lower credit impairments. Transactional and Deposits earnings grew 9% to R2 672m, given 14% higher net interest income on 11% deposit growth. Home Loans’ earnings rose 15% to R1 813m, due to 9% lower costs and a 20% reduction in credit impairments. Card earnings increased 25% to R1 678m, as 6% revenue growth exceeded 1% lower costs and its credit loss ratio improved to 6,07%. The Edcon portfolio generated earnings of R123m, from its 2014 loss of R9m, due to far lower credit impairments. Vehicle and Asset Finance earnings declined 3% to R999m, given negative operating Jaws and 6% higher credit impairments. Personal Loans earnings grew 211% to R361m, reflecting 10% revenue growth, while costs and credit impairments fell 10% and 6% respectively. Losses in the ‘Other’ segment grew 13% to R895m, due to increased spending on strategic initiatives. Retail Banking South Africa accounted for 44% of total earnings, excluding the Group centre.
Business Banking South AfricaHeadline earnings increased 5% to R2 175m, reflecting 4% growth in its core franchise and a 17% smaller loss in the non-core equity portfolio. Pre-provision profits grew 3% with 3% revenue growth slightly below 4% higher costs, while its credit loss ratio remained flat at 0,87%. Its RoRC improved to 29,5% excluding equities. Business Banking South Africa generated 14% of overall earnings excluding the Group centre.
Retail and Business Banking Rest of AfricaHeadline earnings grew 24% to R895m or 17% in constant currency. Revenue growth of 12% exceeded 7% higher costs to increase pre-provision profits 28% and reduce its cost to income ratio to 69%. Credit impairments increased 21% resulting in a 2,07% credit loss ratio. RBB Rest of Africa contributed 6% of total earnings excluding the Group centre.
www.barclaysafrica.com Financial results for the reporting period ended 31 December 2015
15
Profit and dividend announcement
Segment performance (continued)
Corporate and Investment BankHeadline earnings rose 6% to R3 940m, due to 6% higher pre-provision profits and 25% lower taxation. Revenues grew 8%, with Rest of Africa increasing 15% and South Africa 4%. Markets revenue declined 3%, with South Africa down 13% while Rest of Africa grew 23%. Costs rose 9%, reflecting continued investment in systems and technology. Credit impairments increased 220%, due to higher portfolio provisions and NPLs. Corporate earnings grew 16% to R1 965m, as 5% positive operating Jaws outweighed higher credit impairments. Corporate revenue grew 11% on 15% higher loans and advances to customers. Investment Bank’s earnings fell 3% to R1 975m, given negative operating Jaws and increased credit impairments. CIB’s RoRC declined to 17,1% from 19,5%, due to higher credit impairments. It contributed 26% of total earnings excluding the Group centre.
Wealth, Investment Management and InsuranceHeadline earnings grew 11% to R1 464m and net operating income increased 16% to R1 924m. Life Insurance earnings rose 14% to R794m, due to 12% higher net premium income and 2% lower costs. Its return on embedded value declined to 22,7%. Life Insurance’s embedded value of new business decreased 4% due to lower volumes in advice products and aligning credit life products and pricing outside South Africa. Wealth and Investment Management’s earnings grew 5% to R438m given 11% gross operating income growth as net assets under management increased 6% to R274bn. Short-term Insurance earnings grew 40% to R237m as its underwriting margin and loss ratio improved. Fiduciary Services earnings increased 17% to R137m, while Distribution returned to profitability. WIMI South Africa’s continuing business lines’ earnings grew 13% to R1 400m, while rest of Africa was flat at R49m. WIMI’s RoE improved to 24,9% from 23,2% and it generated 10% of earnings excluding the Group centre.
ProspectsWhile the risks of a global recession have abated, a meaningful acceleration in growth is unlikely. We forecast 3,3% global growth in 2016, but the outlook remains fragile, with risks tilted to the downside. Global monetary policy is expected to diverge, with tightening in the US while the euro area and China will continue to ease. In South Africa, weak confidence points to low investment and consumption spending in 2016. Inflation is expected to rise sharply, averaging 6,4% due to food inflation and a weaker rand. We forecast a further 75bps of interest rate increases this year and expect GDP growth to slow to 0,9%. Key risks facing South Africa include continued electricity supply disruptions and a potential credit ratings downgrade. Africa’s medium-term outlook remains challenging given global and domestic factors. Overall, we expect economic growth of 5,1% in our presence countries in the rest of Africa.
Against this backdrop, we expect low single digit loan growth, with rest of Africa growing faster than South Africa. The Group’s net interest margin should decline slightly as a higher proportion of CIB lending, a lower contribution from our hedging programme and introducing the National Credit Act caps in May 2016, offset the endowment benefit of higher interest rates. The credit loss ratio is expected to increase, as arrears are rising and we believe NPLs have bottomed. However, continued focus on revenue growth and cost management should improve the Group’s cost-to-income ratio further. The balance sheet is well positioned for a potential deteriorating economic environment given its high level of portfolio provisions and low NPLs, as well as strong capital ratios and liquidity.
Basis of presentationThe Group’s annual financial results have been prepared in accordance with the recognition and measurement requirements of International Financial Reporting Standards (“IFRS”), interpretations issued by the IFRS Interpretations Committee (“IFRS-IC”), the South African Institute of Chartered Accountants’ Financial Reporting Guides as issued by the Accounting Practices Committee, Financial Reporting Pronouncements as issued by the Financial Reporting Standards Council, the JSE Listings Requirements and the requirements of the Companies Act. The principal accounting policies applied are set out in the Group’s most recent audited annual consolidated financial statements.
The information disclosed in the condensed consolidated financial results is derived from the information contained in the audited annual consolidated financial statements and does not contain full or complete disclosure details. Any investment decisions by shareholders should be based on consideration of the audited annual consolidated financial statements, which is available on request.
The preparation of financial information requires the use of estimates and assumptions about future conditions. Use of available information and application of judgement are inherent in the formation of estimates. The accounting policies that are deemed critical to the Group’s results and financial position, in terms of the materiality of the items to which the policies are applied, and which involve a high degree of judgement including the use of assumptions and estimation, are impairment of loans and advances, goodwill impairment, fair value measurements, impairment of available-for-sale financial assets, consolidation of structured or sponsored entities, post-retirement benefits, provisions, income taxes, share-based payments, liabilities arising from claims made under short-term and long-term insurance contracts and offsetting of financial assets and liabilities.
16 Barclays Africa Group Limited Financial results for the reporting period ended 31 December 2015
Profit and dividend announcement
Group performance Overview 4Segment performance Salient features 9Risk management Profit and dividend announcement 11Appendices Financials 18Administration and contact details Notes to the financials 25
Accounting policiesThe accounting policies applied in preparing the condensed consolidated annual financial statements are the same as those in place for the reporting period ended 31 December 2014 except for:
Business portfolio changes between operating segments; and
Internal accounting policy changes.
Auditors' reportPricewaterhouseCoopers Inc. and Ernst & Young Inc., Barclays Africa Group Limited's independent auditors, have audited the consolidated annual financial statements of Barclays Africa Group Limited from which management prepared the condensed consolidated financial results. The auditors have expressed an unqualified audit opinion on the consolidated annual financial statements. The condensed consolidated financial results comprise the condensed consolidated statement of financial position at 31 December 2015, condensed consolidated statement of comprehensive income, condensed consolidated statement of changes in equity and condensed consolidated statement of cash flows for the reporting period then ended and selected explanatory notes, excluding items not indicated as audited. The audit report of the consolidated annual financial statements is available for inspection at Barclays Africa Group Limited's registered office.
Events after the reporting periodThe directors are not aware of any events occurring between the reporting date of 31 December 2015 and the date of authorisation of these condensed consolidated annual financial results as defined in IAS 10 – Events after the Reporting Period (“IAS 10”).
The directors refer shareholders to the Group’s cautionary SENS announcement of 29 February 2016 regarding market speculation surrounding Barclays PLC’s shareholding in Barclays Africa Group Limited.
On behalf of the Board
W E Lucas-Bull M Ramos
Group Chairman Chief Executive Officer
Johannesburg
29 February 2016
www.barclaysafrica.com Financial results for the reporting period ended 31 December 2015
17
Profit and dividend announcement
Declaration of final ordinary dividend number 59Shareholders are advised that an ordinary dividend of 550 cents per ordinary share was approved on 29 February 2016 and declared on 1 March 2016, for the period ended 31 December 2015. The ordinary dividend is payable to shareholders recorded in the register of members of the Company at the close of business on 8 April 2016. The directors of Barclays Africa Group Limited confirm that the Group will satisfy the solvency and liquidity test immediately after completion of the dividend distribution.
The dividend will be subject to local dividends withholding tax at a rate of 15%. In accordance with paragraphs 11.17 (a) (i) to (x) and 11.17 (c) of the JSE Listings Requirements, the following additional information is disclosed:
The dividend has been declared out of income reserves.
The local dividend tax rate is fifteen per cent (15%).
The gross local dividend amount is 550 cents per ordinary share for shareholders exempt from the dividend tax.
The net local dividend amount is 467,50 cents per ordinary share for shareholders liable to pay for the dividend tax.
Barclays Africa Group currently has 847 750 679 ordinary shares in issue (includes 2 025 369 treasury shares).
Barclays Africa Group Limited’s income tax reference number is 9150116714.
In compliance with the requirements of Strate, the electronic settlement and custody system used by the JSE Limited, the following salient dates for the payment of the dividend are applicable:
Last day to trade cum dividend Friday, 1 April 2016
Shares commence trading ex dividend Monday, 4 April 2016
Record date Friday, 8 April 2016
Payment date Monday, 11 April 2016
Share certificates may not be dematerialised or rematerialised between Monday, 4 April 2016 and Friday, 8 April 2016, both dates inclusive. On Monday, 11 April 2016, the dividend will be electronically transferred to the bank accounts of certificated shareholders. The accounts of those shareholders who have dematerialised their shares (which are held at their participant or broker) will also be credited on Monday, 11 April 2016.
On behalf of the Board
N R Drutman
Group Company Secretary
Johannesburg
1 March 2016
Barclays Africa Group Limited is a company domiciled in South Africa. Its registered office is 7th Floor, Barclays Towers West, 15 Troye Street, Johannesburg, 2001.
18 Barclays Africa Group Limited Financial results for the reporting period ended 31 December 2015
Group performance Overview 4Segment performance Salient features 9Risk management Profit and dividend announcement 11Appendices Financials 18Administration and contact details Notes to the financials 25
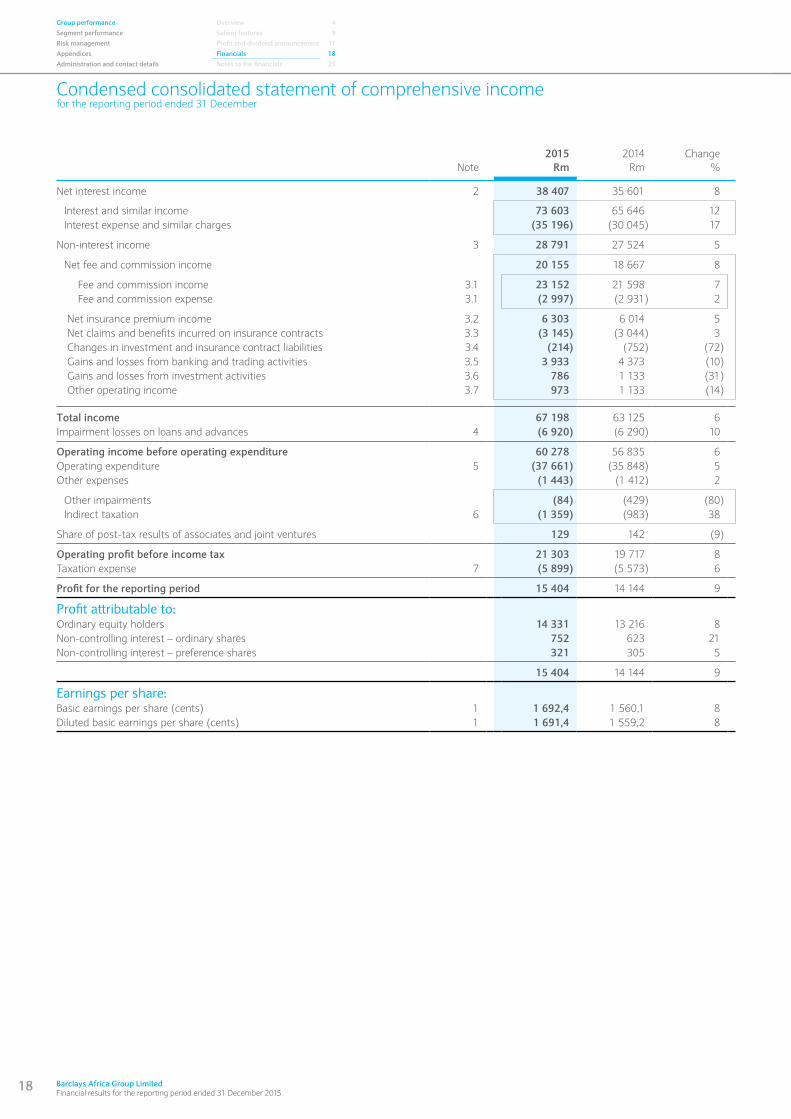
Condensed consolidated statement of comprehensive incomefor the reporting period ended 31 December
2015 2014 ChangeNote Rm Rm %
Net interest income 2 38 407 35 601 8
Interest and similar income 73 603 65 646 12Interest expense and similar charges (35 196) (30 045) 17
Non-interest income 3 28 791 27 524 5
Net fee and commission income 20 155 18 667 8
Fee and commission income 3.1 23 152 21 598 7 Fee and commission expense 3.1 (2 997) (2 931) 2
Net insurance premium income 3.2 6 303 6 014 5 Net claims and benefits incurred on insurance contracts 3.3 (3 145) (3 044) 3 Changes in investment and insurance contract liabilities 3.4 (214) (752) (72) Gains and losses from banking and trading activities 3.5 3 933 4 373 (10) Gains and losses from investment activities 3.6 786 1 133 (31) Other operating income 3.7 973 1 133 (14)
Total income 67 198 63 125 6Impairment losses on loans and advances 4 (6 920) (6 290) 10
Operating income before operating expenditure 60 278 56 835 6Operating expenditure 5 (37 661) (35 848) 5Other expenses (1 443) (1 412) 2
Other impairments (84) (429) (80)Indirect taxation 6 (1 359) (983) 38
Share of post-tax results of associates and joint ventures 129 142 (9)
Operating profit before income tax 21 303 19 717 8Taxation expense 7 (5 899) (5 573) 6
Profit for the reporting period 15 404 14 144 9
Profit attributable to:Ordinary equity holders 14 331 13 216 8Non-controlling interest – ordinary shares 752 623 21Non-controlling interest – preference shares 321 305 5
15 404 14 144 9
Earnings per share:Basic earnings per share (cents) 1 1 692,4 1 560,1 8Diluted basic earnings per share (cents) 1 1 691,4 1 559,2 8
www.barclaysafrica.com Financial results for the reporting period ended 31 December 2015
19
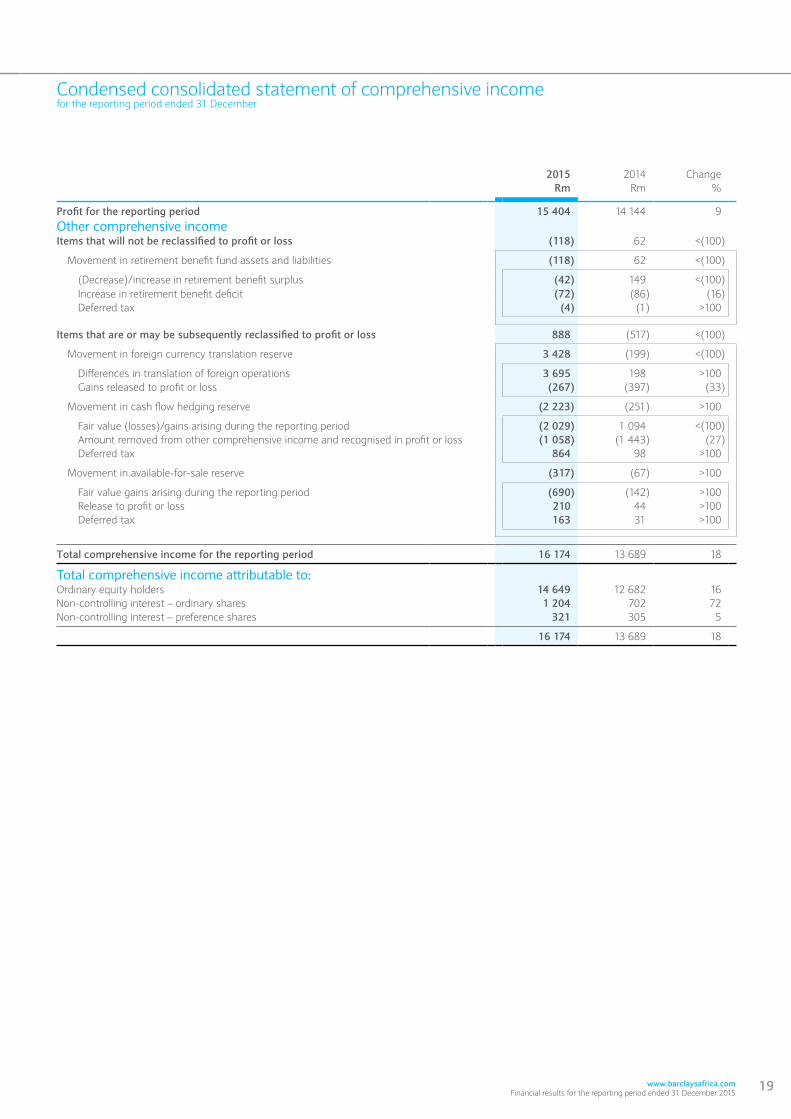
Condensed consolidated statement of comprehensive incomefor the reporting period ended 31 December
2015 2014 ChangeRm Rm %
Profit for the reporting period 15 404 14 144 9Other comprehensive incomeItems that will not be reclassified to profit or loss (118) 62 <(100)
Movement in retirement benefit fund assets and liabilities (118) 62 <(100)
(Decrease)/increase in retirement benefit surplus (42) 149 <(100) Increase in retirement benefit deficit (72) (86) (16) Deferred tax (4) (1) >100
Items that are or may be subsequently reclassified to profit or loss 888 (517) <(100)
Movement in foreign currency translation reserve 3 428 (199) <(100)
Differences in translation of foreign operations 3 695 198 >100 Gains released to profit or loss (267) (397) (33)
Movement in cash flow hedging reserve (2 223) (251) >100
Fair value (losses)/gains arising during the reporting period (2 029) 1 094 <(100) Amount removed from other comprehensive income and recognised in profit or loss (1 058) (1 443) (27) Deferred tax 864 98 >100
Movement in available-for-sale reserve (317) (67) >100
Fair value gains arising during the reporting period (690) (142) >100 Release to profit or loss 210 44 >100 Deferred tax 163 31 >100
Total comprehensive income for the reporting period 16 174 13 689 18
Total comprehensive income attributable to:Ordinary equity holders 14 649 12 682 16Non-controlling interest – ordinary shares 1 204 702 72Non-controlling interest – preference shares 321 305 5
16 174 13 689 18

20 Barclays Africa Group Limited Financial results for the reporting period ended 31 December 2015
Condensed consolidated statement of financial positionas at 31 December
2015 20141 ChangeNote Rm Rm %
AssetsCash, cash balances and balances with central banks 45 904 39 103 17Investment securities 100 965 97 118 4Loans and advances to banks 85 951 72 225 19Trading portfolio assets 137 163 90 498 52Hedging portfolio assets 2 232 2 350 (5)Other assets 25 846 15 514 67Current tax assets 833 381 >100 Non-current assets held for sale 1 700 972 75Loans and advances to customers 8 703 359 636 326 11Reinsurance assets 581 731 (21)Investments linked to investment contracts 19 517 19 317 1Investments in associates and joint ventures 1 000 845 18Investment properties 1 264 727 74Property and equipment 13 252 11 177 19Goodwill and intangible assets 3 772 3 219 17Deferred tax assets 1 265 911 39
Total assets 1 144 604 991 414 15
LiabilitiesDeposits from banks 62 980 52 977 19Trading portfolio liabilities 90 407 49 772 82Hedging portfolio liabilities 4 531 2 577 76Other liabilities 24 982 21 079 19Provisions 3 236 2 943 10Current tax liabilities 242 54 >100 Non-current liabilities held for sale 233 372 (37)Deposits due to customers 9 688 419 624 886 10Debt securities in issue 10 128 683 106 098 21Liabilities under investment contracts 24 209 23 299 4Policyholder liabilities under insurance contracts 4 340 3 871 12Borrowed funds 11 13 151 11 208 17Deferred tax liabilities 544 1 333 (59)
Total liabilities 1 045 957 900 469 16
EquityCapital and reservesAttributable to ordinary equity holders: Share capital 11 1 691 1 694 0 Share premium 11 4 250 4 548 (7) Retained earnings 75 785 70 237 8 Other reserves 7 566 6 211 22
89 292 82 690 8Non-controlling interest – ordinary shares 4 711 3 611 30Non-controlling interest – preference shares 4 644 4 644 —
Total equity 98 647 90 945 8
Total liabilities and equity 1 144 604 991 414 15
Note1 These numbers have been restated, refer to the reporting changes overview on the inside cover page.
Group performance Overview 4Segment performance Salient features 9Risk management Profit and dividend announcement 11Appendices Financials 18Administration and contact details Notes to the financials 25

www.barclaysafrica.com Financial results for the reporting period ended 31 December 2015
21
This page has been left blank intentionally
22 Barclays Africa Group Limited Financial results for the reporting period ended 31 December 2015
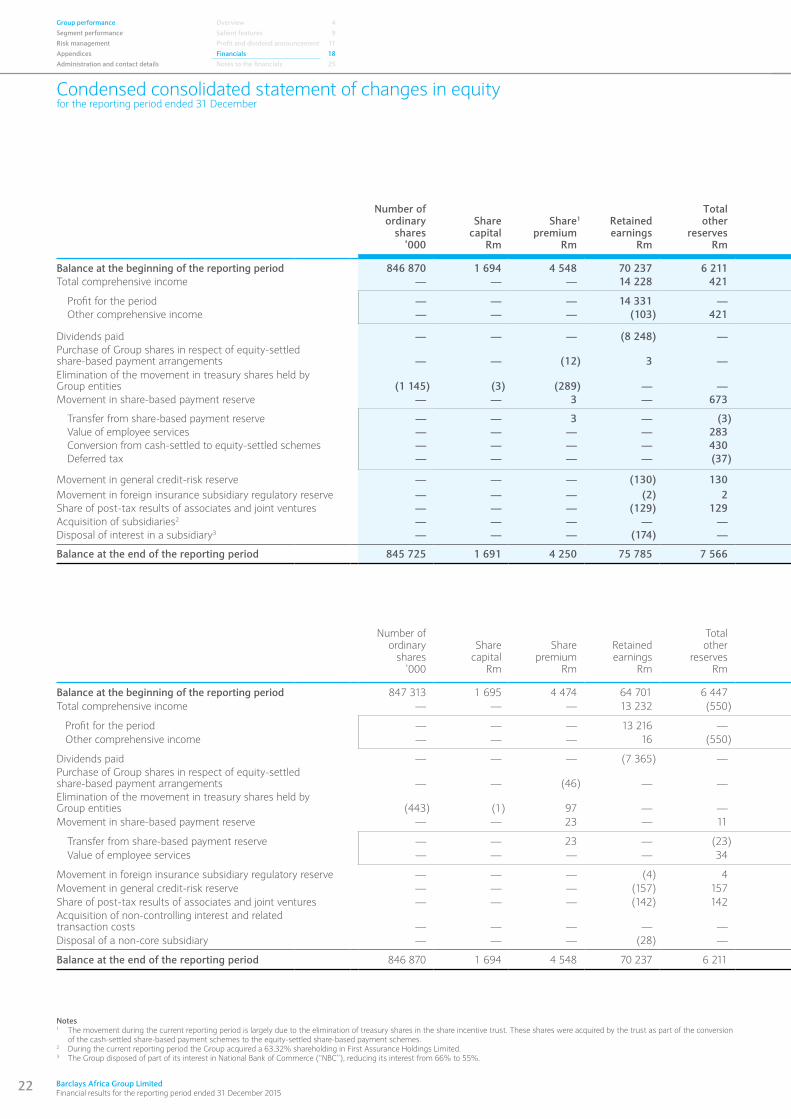
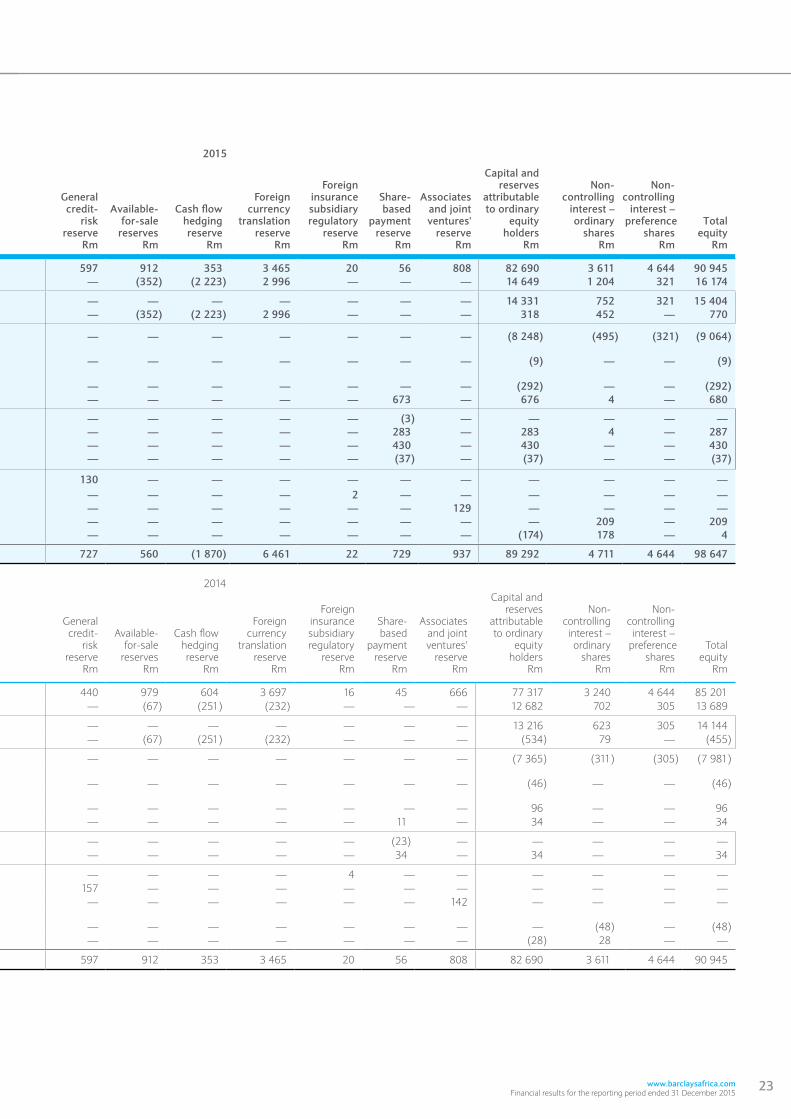
Condensed consolidated statement of changes in equityfor the reporting period ended 31 December
2015
Number of ordinary
shares’000
Sharecapital
Rm
Share1
premiumRm
Retainedearnings
Rm
Totalother
reservesRm
Generalcredit-
riskreserve
Rm
Available-for-sale
reservesRm
Cash flow hedging reserve
Rm
Foreign currency
translation reserve
Rm
Foreign insurance subsidiary
regulatory reserve
Rm
Share-based
payment reserve
Rm
Associates and joint ventures'
reserveRm
Capital and reserves
attributable to ordinary
equityholders
Rm
Non-controlling
interest – ordinary
sharesRm
Non-controlling interest –
preference shares
Rm
Totalequity
Rm
Balance at the beginning of the reporting period 846 870 1 694 4 548 70 237 6 211 597 912 353 3 465 20 56 808 82 690 3 611 4 644 90 945 Total comprehensive income — — — 14 228 421 — (352) (2 223) 2 996 — — — 14 649 1 204 321 16 174
Profit for the period — — — 14 331 — — — — — — — — 14 331 752 321 15 404 Other comprehensive income — — — (103) 421 — (352) (2 223) 2 996 — — — 318 452 — 770
Dividends paid — — — (8 248) — — — — — — — — (8 248) (495) (321) (9 064)Purchase of Group shares in respect of equity-settled share-based payment arrangements — — (12) 3 — — — — — — — — (9) — — (9)Elimination of the movement in treasury shares held by Group entities (1 145) (3) (289) — — — — — — — — — (292) — — (292)Movement in share-based payment reserve — — 3 — 673 — — — — — 673 — 676 4 — 680
Transfer from share-based payment reserve — — 3 — (3) — — — — — (3) — — — — — Value of employee services — — — — 283 — — — — — 283 — 283 4 — 287 Conversion from cash-settled to equity-settled schemes — — — — 430 — — — — — 430 — 430 — — 430 Deferred tax — — — — (37) — — — — — (37) — (37) — — (37)
Movement in general credit-risk reserve — — — (130) 130 130 — — — — — — — — — — Movement in foreign insurance subsidiary regulatory reserve — — — (2) 2 — — — — 2 — — — — — — Share of post-tax results of associates and joint ventures — — — (129) 129 — — — — — — 129 — — — — Acquisition of subsidiaries2 — — — — — — — — — — — — — 209 — 209 Disposal of interest in a subsidiary3 — — — (174) — — — — — — — — (174) 178 — 4
Balance at the end of the reporting period 845 725 1 691 4 250 75 785 7 566 727 560 (1 870) 6 461 22 729 937 89 292 4 711 4 644 98 647
2014
Number of ordinary
shares’000
Sharecapital
Rm
Sharepremium
Rm
Retainedearnings
Rm
Totalother
reservesRm
Generalcredit-
riskreserve
Rm
Available-for-sale
reservesRm
Cash flow hedging reserve
Rm
Foreign currency
translation reserve
Rm
Foreign insurance subsidiary
regulatory reserve
Rm
Share-based
payment reserve
Rm
Associates and joint ventures'
reserveRm
Capital and reserves
attributable to ordinary
equityholders
Rm
Non-controlling
interest – ordinary
sharesRm
Non-controlling interest –
preference shares
Rm
Totalequity
Rm
Balance at the beginning of the reporting period 847 313 1 695 4 474 64 701 6 447 440 979 604 3 697 16 45 666 77 317 3 240 4 644 85 201Total comprehensive income — — — 13 232 (550) — (67) (251) (232) — — — 12 682 702 305 13 689
Profit for the period — — — 13 216 — — — — — — — — 13 216 623 305 14 144 Other comprehensive income — — — 16 (550) — (67) (251) (232) — — — (534) 79 — (455)
Dividends paid — — — (7 365) — — — — — — — — (7 365) (311) (305) (7 981)Purchase of Group shares in respect of equity-settled share-based payment arrangements — — (46) — — — — — — — — — (46) — — (46)Elimination of the movement in treasury shares held by Group entities (443) (1) 97 — — — — — — — — — 96 — — 96Movement in share-based payment reserve — — 23 — 11 — — — — — 11 — 34 — — 34
Transfer from share-based payment reserve — — 23 — (23) — — — — — (23) — — — — — Value of employee services — — — — 34 — — — — — 34 — 34 — — 34
Movement in foreign insurance subsidiary regulatory reserve — — — (4) 4 — — — — 4 — — — — — —Movement in general credit-risk reserve — — — (157) 157 157 — — — — — — — — — —Share of post-tax results of associates and joint ventures — — — (142) 142 — — — — — — 142 — — — —Acquisition of non-controlling interest and related transaction costs — — — — — — — — — — — — — (48) — (48)Disposal of a non-core subsidiary — — — (28) — — — — — — — — (28) 28 — —
Balance at the end of the reporting period 846 870 1 694 4 548 70 237 6 211 597 912 353 3 465 20 56 808 82 690 3 611 4 644 90 945
Notes1 The movement during the current reporting period is largely due to the elimination of treasury shares in the share incentive trust. These shares were acquired by the trust as part of the conversion
of the cash-settled share-based payment schemes to the equity-settled share-based payment schemes.2 During the current reporting period the Group acquired a 63,32% shareholding in First Assurance Holdings Limited.3 The Group disposed of part of its interest in National Bank of Commerce (“NBC”), reducing its interest from 66% to 55%.
Group performance Overview 4Segment performance Salient features 9Risk management Profit and dividend announcement 11Appendices Financials 18Administration and contact details Notes to the financials 25
www.barclaysafrica.com Financial results for the reporting period ended 31 December 2015
23
2015
Number of ordinary
shares’000
Sharecapital
Rm
Share1
premiumRm
Retainedearnings
Rm
Totalother
reservesRm
Generalcredit-
riskreserve
Rm
Available-for-sale
reservesRm
Cash flow hedging reserve
Rm
Foreign currency
translation reserve
Rm
Foreign insurance subsidiary
regulatory reserve
Rm
Share-based
payment reserve
Rm
Associates and joint ventures'
reserveRm
Capital and reserves
attributable to ordinary
equityholders
Rm
Non-controlling
interest – ordinary
sharesRm
Non-controlling interest –
preference shares
Rm
Totalequity
Rm
Balance at the beginning of the reporting period 846 870 1 694 4 548 70 237 6 211 597 912 353 3 465 20 56 808 82 690 3 611 4 644 90 945 Total comprehensive income — — — 14 228 421 — (352) (2 223) 2 996 — — — 14 649 1 204 321 16 174
Profit for the period — — — 14 331 — — — — — — — — 14 331 752 321 15 404 Other comprehensive income — — — (103) 421 — (352) (2 223) 2 996 — — — 318 452 — 770
Dividends paid — — — (8 248) — — — — — — — — (8 248) (495) (321) (9 064)Purchase of Group shares in respect of equity-settled share-based payment arrangements — — (12) 3 — — — — — — — — (9) — — (9)Elimination of the movement in treasury shares held by Group entities (1 145) (3) (289) — — — — — — — — — (292) — — (292)Movement in share-based payment reserve — — 3 — 673 — — — — — 673 — 676 4 — 680
Transfer from share-based payment reserve — — 3 — (3) — — — — — (3) — — — — — Value of employee services — — — — 283 — — — — — 283 — 283 4 — 287 Conversion from cash-settled to equity-settled schemes — — — — 430 — — — — — 430 — 430 — — 430 Deferred tax — — — — (37) — — — — — (37) — (37) — — (37)
Movement in general credit-risk reserve — — — (130) 130 130 — — — — — — — — — — Movement in foreign insurance subsidiary regulatory reserve — — — (2) 2 — — — — 2 — — — — — — Share of post-tax results of associates and joint ventures — — — (129) 129 — — — — — — 129 — — — — Acquisition of subsidiaries2 — — — — — — — — — — — — — 209 — 209 Disposal of interest in a subsidiary3 — — — (174) — — — — — — — — (174) 178 — 4
Balance at the end of the reporting period 845 725 1 691 4 250 75 785 7 566 727 560 (1 870) 6 461 22 729 937 89 292 4 711 4 644 98 647
2014
Number of ordinary
shares’000
Sharecapital
Rm
Sharepremium
Rm
Retainedearnings
Rm
Totalother
reservesRm
Generalcredit-
riskreserve
Rm
Available-for-sale
reservesRm
Cash flow hedging reserve
Rm
Foreign currency
translation reserve
Rm
Foreign insurance subsidiary
regulatory reserve
Rm
Share-based
payment reserve
Rm
Associates and joint ventures'
reserveRm
Capital and reserves
attributable to ordinary
equityholders
Rm
Non-controlling
interest – ordinary
sharesRm
Non-controlling interest –
preference shares
Rm
Totalequity
Rm
Balance at the beginning of the reporting period 847 313 1 695 4 474 64 701 6 447 440 979 604 3 697 16 45 666 77 317 3 240 4 644 85 201Total comprehensive income — — — 13 232 (550) — (67) (251) (232) — — — 12 682 702 305 13 689
Profit for the period — — — 13 216 — — — — — — — — 13 216 623 305 14 144 Other comprehensive income — — — 16 (550) — (67) (251) (232) — — — (534) 79 — (455)
Dividends paid — — — (7 365) — — — — — — — — (7 365) (311) (305) (7 981)Purchase of Group shares in respect of equity-settled share-based payment arrangements — — (46) — — — — — — — — — (46) — — (46)Elimination of the movement in treasury shares held by Group entities (443) (1) 97 — — — — — — — — — 96 — — 96Movement in share-based payment reserve — — 23 — 11 — — — — — 11 — 34 — — 34
Transfer from share-based payment reserve — — 23 — (23) — — — — — (23) — — — — — Value of employee services — — — — 34 — — — — — 34 — 34 — — 34
Movement in foreign insurance subsidiary regulatory reserve — — — (4) 4 — — — — 4 — — — — — —Movement in general credit-risk reserve — — — (157) 157 157 — — — — — — — — — —Share of post-tax results of associates and joint ventures — — — (142) 142 — — — — — — 142 — — — —Acquisition of non-controlling interest and related transaction costs — — — — — — — — — — — — — (48) — (48)Disposal of a non-core subsidiary — — — (28) — — — — — — — — (28) 28 — —
Balance at the end of the reporting period 846 870 1 694 4 548 70 237 6 211 597 912 353 3 465 20 56 808 82 690 3 611 4 644 90 945
24 Barclays Africa Group Limited Financial results for the reporting period ended 31 December 2015
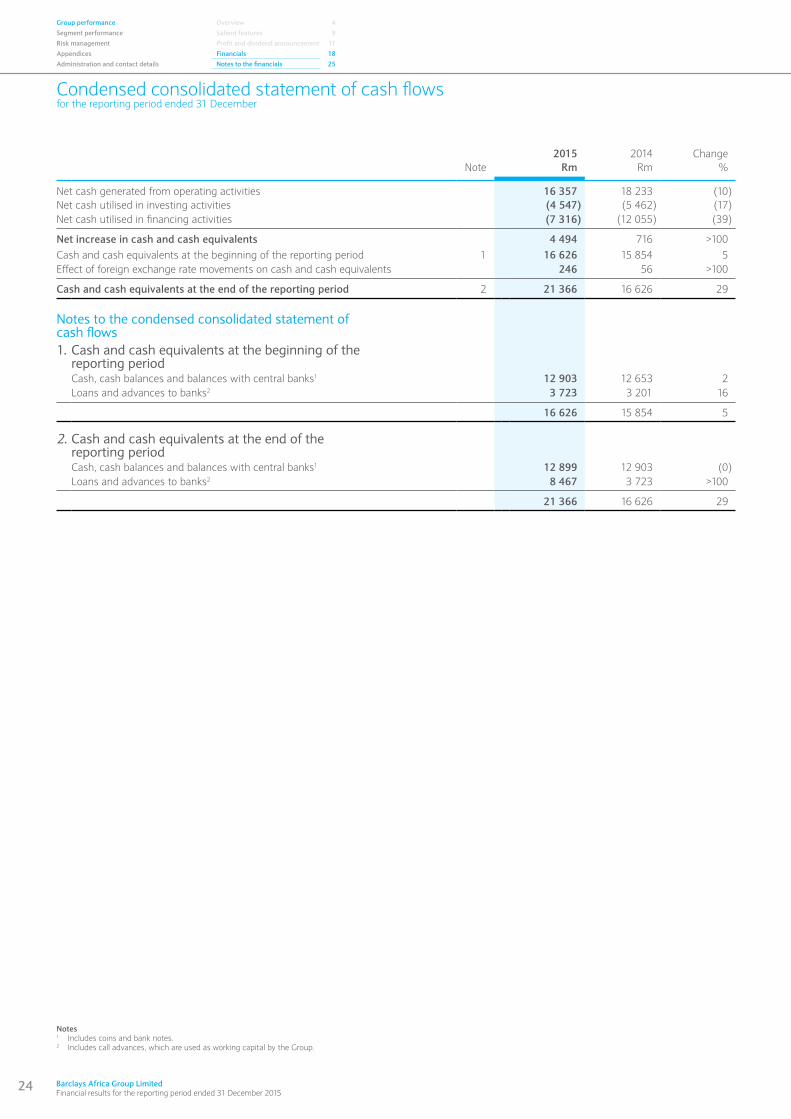
Condensed consolidated statement of cash flowsfor the reporting period ended 31 December
2015 2014 ChangeNote Rm Rm %
Net cash generated from operating activities 16 357 18 233 (10)Net cash utilised in investing activities (4 547) (5 462) (17)Net cash utilised in financing activities (7 316) (12 055) (39)
Net increase in cash and cash equivalents 4 494 716 >100Cash and cash equivalents at the beginning of the reporting period 1 16 626 15 854 5Effect of foreign exchange rate movements on cash and cash equivalents 246 56 >100
Cash and cash equivalents at the end of the reporting period 2 21 366 16 626 29
Notes to the condensed consolidated statement of cash flows1. Cash and cash equivalents at the beginning of the
reporting periodCash, cash balances and balances with central banks1 12 903 12 653 2Loans and advances to banks2 3 723 3 201 16
16 626 15 854 5
2. Cash and cash equivalents at the end of the reporting periodCash, cash balances and balances with central banks1 12 899 12 903 (0)Loans and advances to banks2 8 467 3 723 >100
21 366 16 626 29
Notes 1 Includes coins and bank notes.2 Includes call advances, which are used as working capital by the Group.
Group performance Overview 4Segment performance Salient features 9Risk management Profit and dividend announcement 11Appendices Financials 18Administration and contact details Notes to the financials 25
www.barclaysafrica.com Financial results for the reporting period ended 31 December 2015
25
Performance indicators and condensed notes to the consolidated financial statementsfor the reporting period ended 31 December
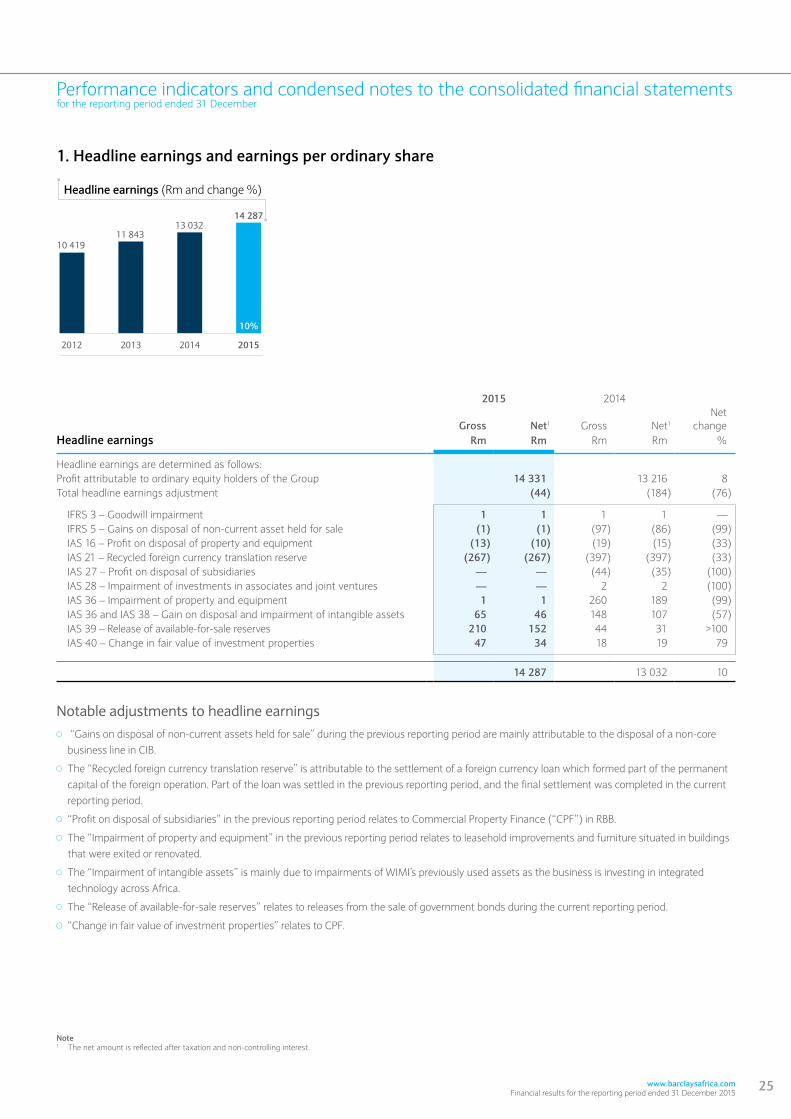
1. Headline earnings and earnings per ordinary share
10%
11 84313 032
201520142013
10 419
2012
Headline earnings (Rm and change %)
14 287
Note1 The net amount is reflected after taxation and non-controlling interest.
Notable adjustments to headline earnings “Gains on disposal of non-current assets held for sale” during the previous reporting period are mainly attributable to the disposal of a non-core
business line in CIB.
The “Recycled foreign currency translation reserve” is attributable to the settlement of a foreign currency loan which formed part of the permanent capital of the foreign operation. Part of the loan was settled in the previous reporting period, and the final settlement was completed in the current reporting period.
“Profit on disposal of subsidiaries” in the previous reporting period relates to Commercial Property Finance (“CPF”) in RBB.
The “Impairment of property and equipment” in the previous reporting period relates to leasehold improvements and furniture situated in buildings that were exited or renovated.
The “Impairment of intangible assets” is mainly due to impairments of WIMI’s previously used assets as the business is investing in integrated technology across Africa.
The “Release of available-for-sale reserves” relates to releases from the sale of government bonds during the current reporting period.
“Change in fair value of investment properties” relates to CPF.
2015 2014
Gross Net1 Gross Net1
Netchange
Headline earnings Rm Rm Rm Rm %
Headline earnings are determined as follows:Profit attributable to ordinary equity holders of the Group 14 331 13 216 8Total headline earnings adjustment (44) (184) (76)
IFRS 3 – Goodwill impairment 1 1 1 1 — IFRS 5 – Gains on disposal of non-current asset held for sale (1) (1) (97) (86) (99) IAS 16 – Profit on disposal of property and equipment (13) (10) (19) (15) (33) IAS 21 – Recycled foreign currency translation reserve (267) (267) (397) (397) (33) IAS 27 – Profit on disposal of subsidiaries — — (44) (35) (100) IAS 28 – Impairment of investments in associates and joint ventures — — 2 2 (100) IAS 36 – Impairment of property and equipment 1 1 260 189 (99) IAS 36 and IAS 38 – Gain on disposal and impairment of intangible assets 65 46 148 107 (57) IAS 39 – Release of available-for-sale reserves 210 152 44 31 >100 IAS 40 – Change in fair value of investment properties 47 34 18 19 79
14 287 13 032 10

26 Barclays Africa Group Limited Financial results for the reporting period ended 31 December 2015
Performance indicators and condensed notes to the consolidated financial statementsfor the reporting period ended 31 December
Group performance Overview 4Segment performance Salient features 9Risk management Profit and dividend announcement 11Appendices Financials 18Administration and contact details Notes to the financials 25
2015
2014
Changevalue/%
Basic earnings per ordinary shareBasic earnings attributable to ordinary equity holders (Rm) 14 331 13 216 8
Weighted average number of ordinary shares in issue (millions) 846,8 847,1 (0,3)
Issued shares at the beginning of the reporting period (millions) 847,8 847,8 —Treasury shares held by Group entities (millions) (1,0) (0,7) (0,3)
Basic earnings per ordinary share (cents) 1 692,4 1 560,1 8
Diluted basic earnings per ordinary shareBasic earnings attributable to ordinary equity holders (Rm) 14 331 13 216 8
Diluted weighted average number of ordinary shares in issue (millions) 847,3 847,6 (0,3)
Weighted average number of ordinary shares in issue (millions) 846,8 847,1 (0,3)Adjustments for share options at no value (millions) 0,5 0,5 —
Diluted basic earnings per ordinary share (cents) 1 691,4 1 559,2 8
Headline earnings per ordinary shareHeadline earnings attributable to ordinary equity holders (Rm) 14 287 13 032 10
Weighted average number of ordinary shares in issue (millions) 846,8 847,1 (0,3)
Headline earnings per ordinary share (cents) 1 687,2 1 538,4 10
Diluted headline earnings per ordinary shareHeadline earnings attributable to ordinary equity holders (Rm) 14 287 13 032 10
Diluted weighted average number of ordinary shares in issue (millions) 847,3 847,6 (0,3)
Diluted headline earnings per ordinary share (cents) 1 686,2 1 537,5 10
1. Headline earnings and earnings per ordinary share (continued)

www.barclaysafrica.com Financial results for the reporting period ended 31 December 2015
27
Performance indicators and condensed notes to the consolidated financial statementsfor the reporting period ended 31 December
2. Net interest income
Net interest margin – after impairment losses on loans and advances1 (%) Net interest margin on average interest-bearing assets1 (%)
� Net interest income (Rm)
32 351
4,46
3,50
4,23
2,94
4,81
8%
38 407
3,95
4,65
35 601
3,83
2015201420132012
29 302
Net interest income and net interest margin (Rm, % and change %)
� NAV per ordinary share (cents) RoE (%) RoRWA (%)
2015 2014Interest Interest
Average Average income/ Average Average income/balance rate (expense) balance2 rate2 (expense)2
Group average statement of financial position1 Rm % Rm Rm % Rm
Assets Cash, cash balances and balances with central banks 950 2,32 22 1 696 2,24 38Investment securities 84 662 8,70 7 365 85 652 8,00 6 853Loans and advances to banks and customers 713 704 9,03 64 450 678 098 8,46 57 389Other interest3 — — 1 766 — — 1 366
Interest-bearing assets 799 316 9,21 73 603 765 445 8,58 65 646Non-interest-bearing assets 245 388 — — 216 444 — —
Total assets 1 044 704 7,05 73 603 981 889 6,69 65 646
LiabilitiesDeposits due to banks and customers 637 454 (4,18) (26 663) 610 205 (4,00) (24 407)Debt securities in issue 119 511 (6,92) (8 271) 106 310 (6,38) (6 785)Borrowed funds 11 891 (12,28) (1 460) 12 674 (10,04) (1 272)Other interest3 — — 1 198 — — 2 419
Interest-bearing liabilities 768 856 (4,58) (35 196) 729 189 (4,12) (30 045)Non-interest-bearing liabilities 181 718 — — 165 583 — —
Total liabilities 950 574 (3,70) (35 196) 894 772 (3,36) (30 045)Total equity 94 130 — — 87 117 — —
Total equity and liabilities 1 044 704 (3,37) (35 196) 981 889 (3,06) (30 045)
Net interest margin on average interest-bearing assets 4,81 4,65
Notes1 Average balances are calculated based on daily weighted average balances.2 These numbers have been restated, refer to the reporting changes overview on the inside cover page.3 ”Other interest” on assets and liabilities includes fair value adjustments on hedging instruments and hedged items.
28 Barclays Africa Group Limited Financial results for the reporting period ended 31 December 2015
Performance indicators and condensed notes to the consolidated financial statementsfor the reporting period ended 31 December
Group performance Overview 4Segment performance Salient features 9Risk management Profit and dividend announcement 11Appendices Financials 18Administration and contact details Notes to the financials 25
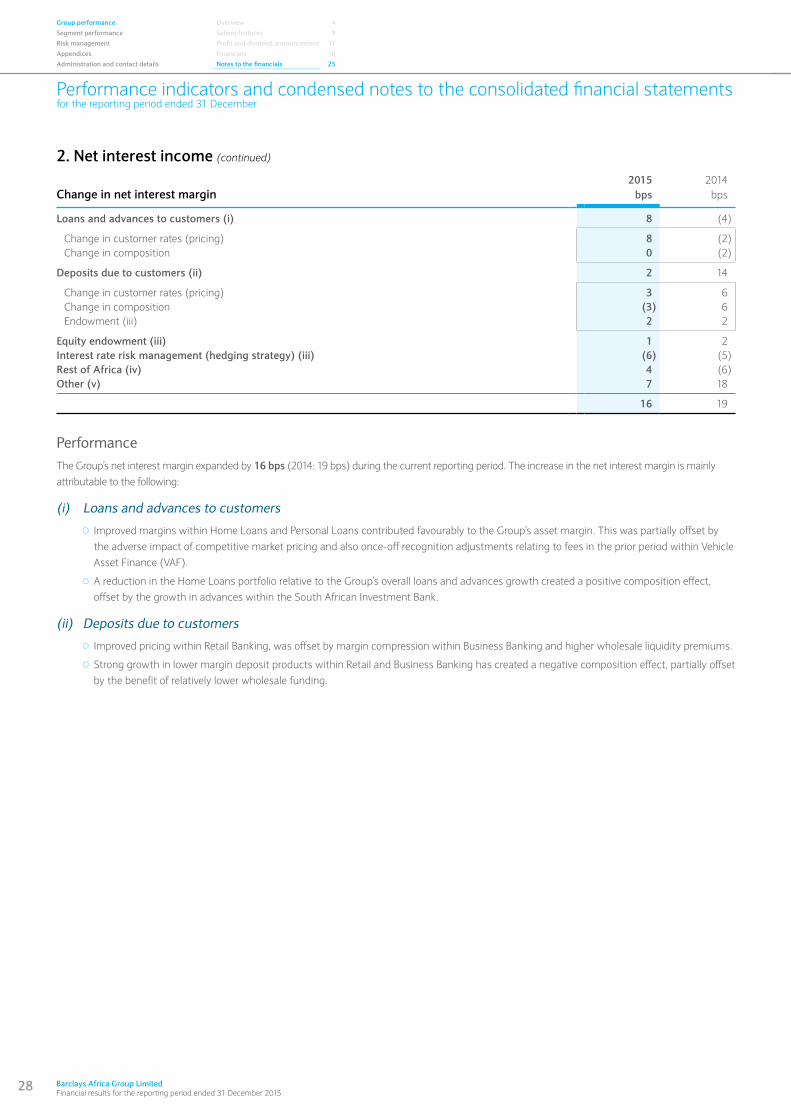
2. Net interest income (continued)
2015 2014Change in net interest margin bps bps
Loans and advances to customers (i) 8 (4)
Change in customer rates (pricing) 8 (2)Change in composition 0 (2)
Deposits due to customers (ii) 2 14
Change in customer rates (pricing) 3 6Change in composition (3) 6Endowment (iii) 2 2
Equity endowment (iii) 1 2Interest rate risk management (hedging strategy) (iii) (6) (5)Rest of Africa (iv) 4 (6)Other (v) 7 18
16 19
PerformanceThe Group’s net interest margin expanded by 16 bps (2014: 19 bps) during the current reporting period. The increase in the net interest margin is mainly attributable to the following:
(i) Loans and advances to customers
Improved margins within Home Loans and Personal Loans contributed favourably to the Group’s asset margin. This was partially offset by the adverse impact of competitive market pricing and also once-off recognition adjustments relating to fees in the prior period within Vehicle Asset Finance (VAF).
A reduction in the Home Loans portfolio relative to the Group’s overall loans and advances growth created a positive composition effect, offset by the growth in advances within the South African Investment Bank.
(ii) Deposits due to customers
Improved pricing within Retail Banking, was offset by margin compression within Business Banking and higher wholesale liquidity premiums.
Strong growth in lower margin deposit products within Retail and Business Banking has created a negative composition effect, partially offset by the benefit of relatively lower wholesale funding.
www.barclaysafrica.com Financial results for the reporting period ended 31 December 2015
29
Performance indicators and condensed notes to the consolidated financial statementsfor the reporting period ended 31 December
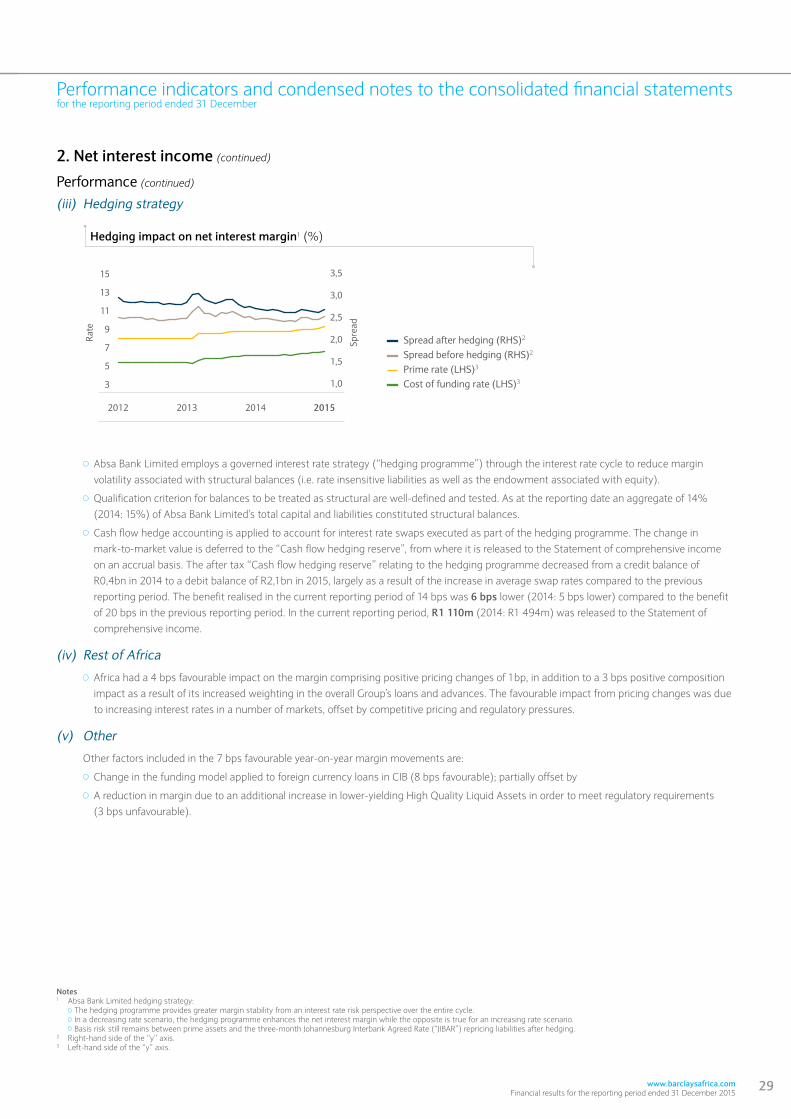
2. Net interest income (continued)
3
5
7
9
11
13
15
Spread after hedging (RHS)2
Spread before hedging (RHS)2
Prime rate (LHS)3
Cost of funding rate (LHS)3
Rate
Spre
ad
1,0
1,5
2,0
2,5
3,0
3,5
Hedging impact on net interest margin1 (%)
2015201420132012
Performance (continued)
(iii) Hedging strategy
Notes1 Absa Bank Limited hedging strategy: The hedging programme provides greater margin stability from an interest rate risk perspective over the entire cycle. In a decreasing rate scenario, the hedging programme enhances the net interest margin while the opposite is true for an increasing rate scenario. Basis risk still remains between prime assets and the three-month Johannesburg Interbank Agreed Rate (“JIBAR”) repricing liabilities after hedging.2 Right-hand side of the “y” axis.3 Left-hand side of the “y” axis.
Absa Bank Limited employs a governed interest rate strategy (“hedging programme”) through the interest rate cycle to reduce margin volatility associated with structural balances (i.e. rate insensitive liabilities as well as the endowment associated with equity).
Qualification criterion for balances to be treated as structural are well-defined and tested. As at the reporting date an aggregate of 14% (2014: 15%) of Absa Bank Limited’s total capital and liabilities constituted structural balances.
Cash flow hedge accounting is applied to account for interest rate swaps executed as part of the hedging programme. The change in mark-to-market value is deferred to the “Cash flow hedging reserve”, from where it is released to the Statement of comprehensive income on an accrual basis. The after tax “Cash flow hedging reserve” relating to the hedging programme decreased from a credit balance of R0,4bn in 2014 to a debit balance of R2,1bn in 2015, largely as a result of the increase in average swap rates compared to the previous reporting period. The benefit realised in the current reporting period of 14 bps was 6 bps lower (2014: 5 bps lower) compared to the benefit of 20 bps in the previous reporting period. In the current reporting period, R1 110m (2014: R1 494m) was released to the Statement of comprehensive income.
(iv) Rest of Africa
Africa had a 4 bps favourable impact on the margin comprising positive pricing changes of 1bp, in addition to a 3 bps positive composition impact as a result of its increased weighting in the overall Group’s loans and advances. The favourable impact from pricing changes was due to increasing interest rates in a number of markets, offset by competitive pricing and regulatory pressures.
(v) Other
Other factors included in the 7 bps favourable year-on-year margin movements are:
Change in the funding model applied to foreign currency loans in CIB (8 bps favourable); partially offset by
A reduction in margin due to an additional increase in lower-yielding High Quality Liquid Assets in order to meet regulatory requirements (3 bps unfavourable).
30 Barclays Africa Group Limited Financial results for the reporting period ended 31 December 2015
Performance indicators and condensed notes to the consolidated financial statementsfor the reporting period ended 31 December
Group performance Overview 4Segment performance Salient features 9Risk management Profit and dividend announcement 11Appendices Financials 18Administration and contact details Notes to the financials 25
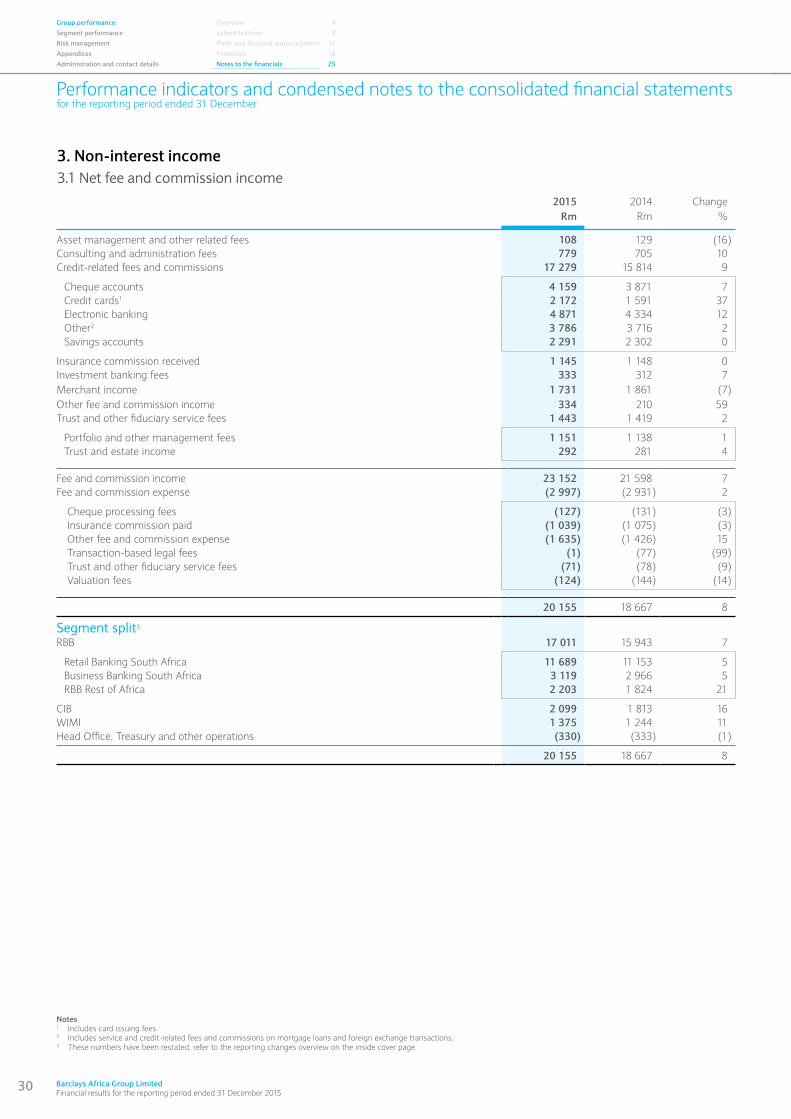
3. Non-interest income3.1 Net fee and commission income
2015 2014 ChangeRm Rm %
Asset management and other related fees 108 129 (16)Consulting and administration fees 779 705 10Credit-related fees and commissions 17 279 15 814 9
Cheque accounts 4 159 3 871 7Credit cards1 2 172 1 591 37Electronic banking 4 871 4 334 12Other2 3 786 3 716 2Savings accounts 2 291 2 302 0
Insurance commission received 1 145 1 148 0Investment banking fees 333 312 7Merchant income 1 731 1 861 (7)Other fee and commission income 334 210 59Trust and other fiduciary service fees 1 443 1 419 2
Portfolio and other management fees 1 151 1 138 1Trust and estate income 292 281 4
Fee and commission income 23 152 21 598 7Fee and commission expense (2 997) (2 931) 2
Cheque processing fees (127) (131) (3) Insurance commission paid (1 039) (1 075) (3) Other fee and commission expense (1 635) (1 426) 15 Transaction-based legal fees (1) (77) (99) Trust and other fiduciary service fees (71) (78) (9) Valuation fees (124) (144) (14)
20 155 18 667 8
Segment split3
RBB 17 011 15 943 7
Retail Banking South Africa 11 689 11 153 5Business Banking South Africa 3 119 2 966 5RBB Rest of Africa 2 203 1 824 21
CIB 2 099 1 813 16WIMI 1 375 1 244 11Head Office, Treasury and other operations (330) (333) (1)
20 155 18 667 8
Notes1 Includes card issuing fees.2 Includes service and credit-related fees and commissions on mortgage loans and foreign exchange transactions.3 These numbers have been restated, refer to the reporting changes overview on the inside cover page.
www.barclaysafrica.com Financial results for the reporting period ended 31 December 2015
31
Performance indicators and condensed notes to the consolidated financial statementsfor the reporting period ended 31 December
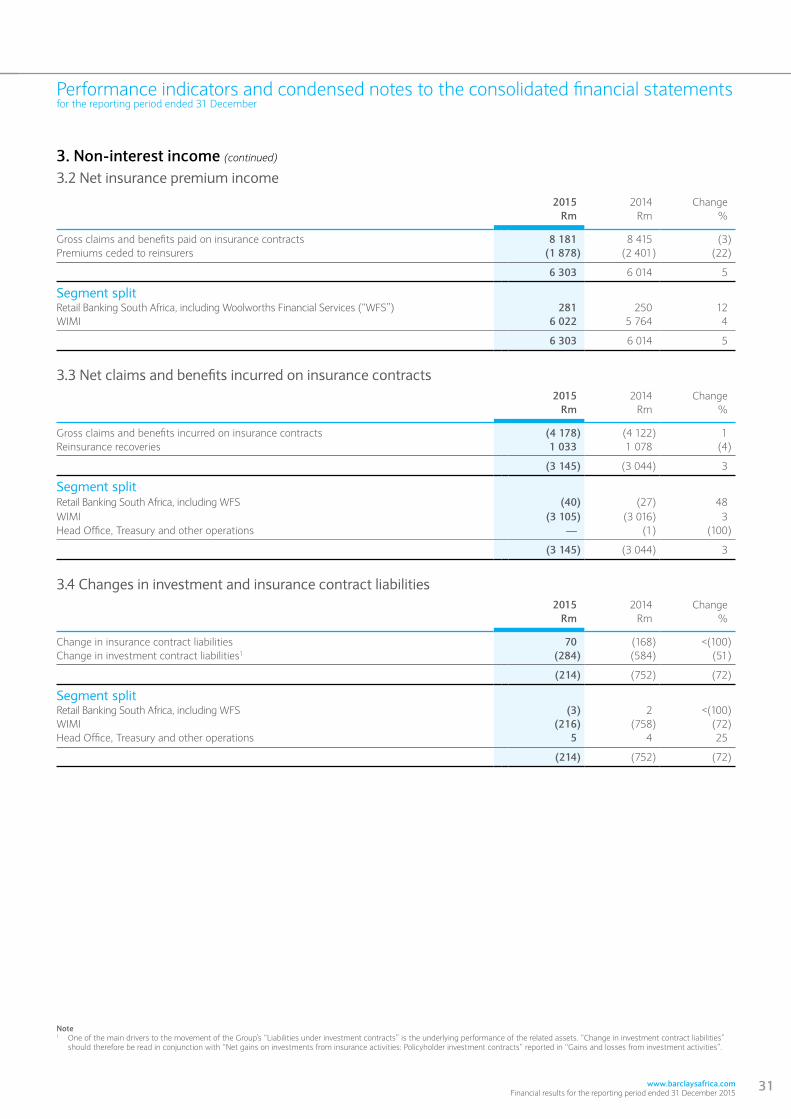
3. Non-interest income (continued)
3.2 Net insurance premium income
2015 2014 ChangeRm Rm %
Gross claims and benefits paid on insurance contracts 8 181 8 415 (3)Premiums ceded to reinsurers (1 878) (2 401) (22)
6 303 6 014 5
Segment splitRetail Banking South Africa, including Woolworths Financial Services (“WFS”) 281 250 12WIMI 6 022 5 764 4
6 303 6 014 5
3.3 Net claims and benefits incurred on insurance contracts2015 2014 Change
Rm Rm %
Gross claims and benefits incurred on insurance contracts (4 178) (4 122) 1Reinsurance recoveries 1 033 1 078 (4)
(3 145) (3 044) 3
Segment splitRetail Banking South Africa, including WFS (40) (27) 48WIMI (3 105) (3 016) 3Head Office, Treasury and other operations — (1) (100)
(3 145) (3 044) 3
3.4 Changes in investment and insurance contract liabilities2015 2014 Change
Rm Rm %
Change in insurance contract liabilities 70 (168) <(100)Change in investment contract liabilities1 (284) (584) (51)
(214) (752) (72)
Segment splitRetail Banking South Africa, including WFS (3) 2 <(100)WIMI (216) (758) (72)Head Office, Treasury and other operations 5 4 25
(214) (752) (72)
Note1 One of the main drivers to the movement of the Group’s “Liabilities under investment contracts” is the underlying performance of the related assets. “Change in investment contract liabilities”
should therefore be read in conjunction with “Net gains on investments from insurance activities: Policyholder investment contracts” reported in “Gains and losses from investment activities”.

32 Barclays Africa Group Limited Financial results for the reporting period ended 31 December 2015
Performance indicators and condensed notes to the consolidated financial statementsfor the reporting period ended 31 December
Group performance Overview 4Segment performance Salient features 9Risk management Profit and dividend announcement 11Appendices Financials 18Administration and contact details Notes to the financials 25
3. Non-interest income (continued)
3.5 Gains and losses from banking and trading activities2015 2014 Change
Rm Rm %
Net losses on investments (225) (91) >100
Debt instruments designated at fair value through profit or loss 18 7 >100Equity instruments designated at fair value through profit or loss (33) (54) (39)Available-for-sale unwind from reserves (210) (44) >100
Net trading result 4 103 4 246 (3)
Net trading income excluding the impact of hedge accounting 4 253 4 493 (5)Ineffective portion of hedges (150) (247) (39)
Cash flow hedges (188) (239) (21)Fair value hedges 38 (8) <(100)
Other gains 55 174 (68)Profit on sale of subsidiaries1 — 44 (100)
3 933 4 373 (10)
Segment split2
RBB 546 356 53
Retail Banking South Africa 129 64 >100 Business Banking South Africa 15 (19) >100 RBB Rest of Africa 402 311 29
CIB 3 706 4 503 (18)WIMI 1 4 (75)Head Office, Treasury and other operations (320) (490) (35)
3 933 4 373 (10)
3.6 Gains and losses from investment activities2015 2014 Change
Rm Rm %
Net gains on investments from insurance activities 679 1 090 (38)
Policyholder insurance contracts 85 299 (72)Policyholder investment contracts3 337 508 (34)Shareholders’ funds 257 283 (9)
Other gains 107 43 >100
786 1 133 (31)
Segment splitCIB 1 7 (86)WIMI 698 1 313 (47)Head Office, Treasury and other operations 87 (187) <(100)
786 1 133 (31)
Notes1 The Group sold its investment in a non-core subsidiary on 2 January 2014. The disposal resulted in the derecognition of the subsidiary and a non-headline earnings profit of R44m.2 These numbers have been restated, refer to the reporting changes overview on the inside cover page. 3 One of the main drivers to the movement of the Group’s “Liabilities under investment contracts” is the underlying performance of the related assets. “Net gains on investments from insurance
activities: Policyholder investment contracts” should therefore be read in conjunction with “Change in investment contracts” reported in “Changes in investment and insurance contract liabilities.
www.barclaysafrica.com Financial results for the reporting period ended 31 December 2015
33
Performance indicators and condensed notes to the consolidated financial statementsfor the reporting period ended 31 December
3. Non-interest income (continued)
3.7 Other operating income2015 2014 Change
Rm Rm %
Property-related income 281 318 (12)
Income from investment properties 144 185 (22)
Change in fair value 35 13 >100Rentals 109 172 (37)
Profit on disposal of property and equipment 14 19 (26)Profit on sale of developed properties 31 31 —Profit on sale of repossessed properties 13 32 (59)Rental income 79 51 55
Other operating income 692 815 (15)
Foreign exchange differences, including recycle from other comprehensive income 327 403 (19)Income from maintenance contracts 30 28 7Profit/(loss) on disposal of intangible assets 7 (2) <(100)Sundry income1 328 386 (15)
973 1 133 (14)
Segment split2
Property-related income 280 318 (12)
RBB 226 273 (17)
Retail Banking South Africa 25 76 (67)Business Banking South Africa 194 192 1RBB Rest of Africa 7 5 40
CIB — 3 (100)WIMI 30 18 67
Head Office, Treasury and other operations 24 24 —
Other operating income 693 815 (15)
RBB 217 226 (5)
Retail Banking South Africa 201 182 10Business Banking South Africa 8 27 (70)RBB Rest of Africa 8 17 (53)
CIB 120 176 (32)WIMI 157 59 >100
Head Office, Treasury and other operations 199 354 (44)
973 1 133 (14)
Notes1 Includes service fees levied on asset finance as well as the profit on disposal of sundry non-core business activities.2 These numbers have been restated, refer to the reporting changes overview on the inside cover page.
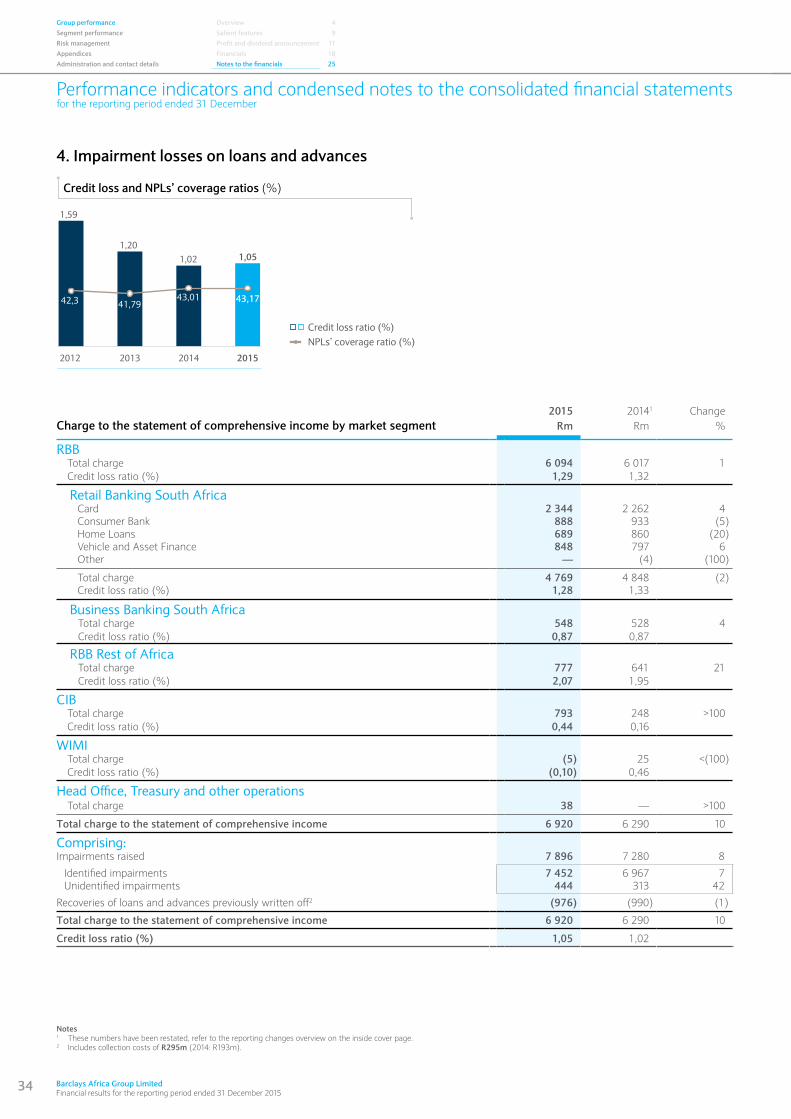
34 Barclays Africa Group Limited Financial results for the reporting period ended 31 December 2015
Performance indicators and condensed notes to the consolidated financial statementsfor the reporting period ended 31 December
Group performance Overview 4Segment performance Salient features 9Risk management Profit and dividend announcement 11Appendices Financials 18Administration and contact details Notes to the financials 25
2015201420132012
� Credit loss ratio (%) NPLs’ coverage ratio (%)
Credit loss and NPLs’ coverage ratios (%)
41,79 43,17
1,05
43,01
1,201,02
42,3
1,59
4. Impairment losses on loans and advances
2015 20141 ChangeCharge to the statement of comprehensive income by market segment Rm Rm %
RBB Total charge 6 094 6 017 1 Credit loss ratio (%) 1,29 1,32
Retail Banking South AfricaCard 2 344 2 262 4Consumer Bank 888 933 (5)Home Loans 689 860 (20)Vehicle and Asset Finance 848 797 6Other — (4) (100)
Total charge 4 769 4 848 (2)Credit loss ratio (%) 1,28 1,33
Business Banking South Africa Total charge 548 528 4 Credit loss ratio (%) 0,87 0,87
RBB Rest of Africa Total charge 777 641 21 Credit loss ratio (%) 2,07 1,95
CIB Total charge 793 248 >100 Credit loss ratio (%) 0,44 0,16
WIMI Total charge (5) 25 <(100) Credit loss ratio (%) (0,10) 0,46
Head Office, Treasury and other operations Total charge 38 — >100
Total charge to the statement of comprehensive income 6 920 6 290 10
Comprising:Impairments raised 7 896 7 280 8
Identified impairments 7 452 6 967 7Unidentified impairments 444 313 42
Recoveries of loans and advances previously written off2 (976) (990) (1)
Total charge to the statement of comprehensive income 6 920 6 290 10
Credit loss ratio (%) 1,05 1,02
Notes1 These numbers have been restated, refer to the reporting changes overview on the inside cover page.2 Includes collection costs of R295m (2014: R193m).
www.barclaysafrica.com Financial results for the reporting period ended 31 December 2015
35
Performance indicators and condensed notes to the consolidated financial statementsfor the reporting period ended 31 December
Note1 Includes commercial property loans and loans to associates and joint ventures.
2015 2014 ChangeCharge to the statement of comprehensive income by geographical segment Rm Rm %
South Africa 5 706 5 565 3Credit loss ratio (%) 0,97 1,00
Rest of Africa 1 214 725 67Credit loss ratio (%) 1,70 1,17
2015Performing loans Non-performing loans
Impair- Coverage Impair- Coverage Net totalExposure ment ratio Exposure ment ratio exposure
Loans and advances to customers Rm Rm % Rm Rm % Rm
RBB 473 956 4 184 0,88 25 077 11 094 44,24 483 755
Retail Banking South Africa 367 475 3 024 0,82 18 198 7 652 42,05 374 997
Credit cards 36 390 724 1,99 5 014 3 532 70,44 37 148Instalment credit agreements 72 426 548 0,76 1 602 621 38,76 72 859Loans to associates and joint ventures 16 176 — — — — — 16 176Mortgages 222 315 1 243 0,56 9 341 2 064 22,10 228 349Other loans and advances 367 — — — — — 367Overdrafts 2 781 34 1,22 172 99 57,56 2 820Personal and term loans 17 020 475 2,79 2 069 1 336 64,57 17 278
Business Banking South Africa 62 052 661 1,07 3 306 1 152 34,85 63 545
Mortgages1 30 016 190 0,63 1 620 586 36,17 30 860Overdrafts 17 844 271 1,52 960 370 38,54 18 163Term loans 14 192 200 1,41 726 196 27,00 14 522
RBB Rest of Africa 44 429 499 1,12 3 573 2 290 64,09 45 213
CIB 212 508 766 0,36 2 834 951 33,56 213 625
WIMI 5 346 32 0,60 69 33 47,83 5 350Head Office, Treasury and other operations 669 40 5,98 — — — 629
692 479 5 022 0,73 27 980 12 078 43,17 703 359
4. Impairment losses on loans and advances (continued)
36 Barclays Africa Group Limited Financial results for the reporting period ended 31 December 2015
Performance indicators and condensed notes to the consolidated financial statementsfor the reporting period ended 31 December
Group performance Overview 4Segment performance Salient features 9Risk management Profit and dividend announcement 11Appendices Financials 18Administration and contact details Notes to the financials 25
20141
Performing loans Non-performing loans Impair- Coverage Impair- Coverage Net total
Exposure ment ratio Exposure ment ratio exposure Loans and advances to customers Rm Rm % Rm Rm % Rm
RBB 454 475 3 942 0,87 25 663 11 352 44,23 464 844
Retail Banking South Africa 360 427 2 989 0,83 18 452 7 923 42,94 367 967
Credit cards 35 814 699 1,95 4 808 3 439 71,53 36 484 Instalment credit agreements 70 654 479 0,68 1 195 551 46,11 70 819 Loans to associates and joint ventures 13 012 — — — — — 13 012 Mortgages 222 562 1 376 0,62 10 492 2 655 25,30 229 023 Other loans and advances 410 — — — — — 410 Overdrafts 2 247 32 1,42 122 83 68,03 2 254 Personal and term loans 15 728 403 2,56 1 835 1 195 65,12 15 965
Business Banking South Africa 59 168 621 1,05 3 925 1 407 35,85 61 065
Mortgages2 29 514 269 0,91 1 827 777 42,53 30 295 Overdrafts 17 804 216 1,21 921 358 38,87 18 151 Term loans 11 850 136 1,15 1 177 272 23,11 12 619
RBB Rest of Africa 34 880 332 0,95 3 286 2 022 61,53 35 812
CIB 164 453 373 0,23 1 652 381 23,06 165 351WIMI 5 263 44 0,84 53 38 71,70 5 234Head Office, Treasury and other operations 897 — — — — — 897
625 088 4 359 0,70 27 368 11 771 43,01 636 326
4. Impairment losses on loans and advances (continued)
Notes1 These numbers have been restated, refer to the reporting changes overview on the inside cover page.2 Includes commercial property loans and loans to associates and joint ventures.
www.barclaysafrica.com Financial results for the reporting period ended 31 December 2015
37
Performance indicators and condensed notes to the consolidated financial statementsfor the reporting period ended 31 December
4. Impairment losses on loans and advances (continued)
Reconciliation of allowance for impairment losses on loans and advances to customers
2015
Retail Banking
South Africa
Rm
Business Banking
South Africa
Rm
RBBRest ofAfrica
RmCIBRm
WIMIRm
HeadOffice,
Treasuryand other
operationsRm
TotalRm
Balance at the beginning of the reporting period 10 912 2 028 2 354 754 82 — 16 130Net present value unwind on non-performing book (594) (130) — — — — (724)Exchange differences — — 300 136 — — 436Transfer between segments — — (86) 86 — — —Amounts written off (5 063) (784) (719) (57) (15) — (6 638)Impairment raised – identified 5 464 572 870 545 (1) 2 7 452Impairment raised – unidentified (43) 127 70 253 (1) 38 444
Balance at the end of the reporting period 10 676 1 813 2 789 1 717 65 40 17 100
Reconciliation of allowance for impairment losses on loans and advances to customers
20141
Retail Banking
South Africa
Rm
Business Banking
South Africa
Rm
RBBRest of
AfricaRm
CIBRm
WIMIRm
HeadOffice,
Treasuryand other
operationsRm
TotalRm
Balance at the beginning of the reporting period 10 509 2 283 2 365 680 102 110 16 049Net present value unwind on non-performing book (497) (147) — — — — (644)Exchange differences — — (76) — — — (76)Amounts written off (4 655) (813) (667) (185) (49) (110) (6 479)Impairment raised – identified 5 430 687 643 199 8 — 6 967Impairment raised – unidentified 125 18 89 60 21 — 313
Balance at the end of the reporting period 10 912 2 028 2 354 754 82 — 16 130
Statement of financial position – identified and unidentified impairments2015 2014 Change
Rm Rm %
Comprising:Identified impairments 14 755 14 318 3
Performing loans 2 682 2 547 5 NPLs 12 073 11 771 3
Unidentified impairments 2 345 1 812 29
Model driven 1 260 1 145 10 Macroeconomic 1 085 667 63
17 100 16 130 6
Note1 These numbers have been restated, refer to the reporting changes overview on the inside cover page.
38 Barclays Africa Group Limited Financial results for the reporting period ended 31 December 2015
Performance indicators and condensed notes to the consolidated financial statementsfor the reporting period ended 31 December
Group performance Overview 4Segment performance Salient features 9Risk management Profit and dividend announcement 11Appendices Financials 18Administration and contact details Notes to the financials 25
4. Impairment losses on loans and advances (continued)
PerformanceImpairment losses on loans and advances increased from 102 bps to 105 bps relative to the prior reporting period. This is due to an increase in macro-economic provisions of R418m and higher defaults in the rest of Africa portfolio. Offsetting this is an improvement in the Mortgage portfolio construct and improved recoveries in consumer lending. The write-off of legal cases and a slowdown of CPF defaults resulted in a reduction of the NPLs’ coverage ratio from 35,85% to 34,85%.
Given the current economic environment in which the Group operates, performing loan coverage increased from 0,70% to 0,73%. The NPL coverage ratio increased from 43,01% to 43,17% due to specific provisions raised in CIB and increased inflow into debt counselling, which was offset by a decline in the mortgage legal book.
RBBRetail Banking South Africa ( 2%)
NPLs reduced as a result of accelerated legal strategies and enhanced collection process, while the coverage ratio on performing loans changed due to the following:
Home loans’ impairments improved due to the lower inflows into defaults and continued focus on the underlying workout process.
Offsetting this is an increase Card’s impairment which is line with expectations and risk appetite.
General coverage was increased by Vehicle and Asset Finance as well as on Personal and Term loans, as customers remain under strain, which is evidenced by high inflows from debt counselling.
Business Banking South Africa ( 4%)
The credit losses ratio remained unchanged at 87 bps due to a R115m increase in the macroeconomic provision as well as increased default experience in the commercial segment, offset by little default within CPF. The additional macroeconomic provision also resulted in the increase of the coverage ratio of performing loans from 105 bps to 107 bps. The write-off of legal cases and a slowdown of CPF defaults also resulted in a reduction of the NPLs’ coverage ratio from 35,85% to 34,85%.
RBB Rest of Africa ( 21%)
Credit impairment increased by 21% to R777m resulting in a credit loss ratio of 2,07% (2014: 1,95%). The increase was due to new defaults in the Business Banking portfolio, emergence period adjustments from three to six months and performance deterioration in the Retail portfolio.
CIB ( >100%)
Credit impairments increased more than 100% to R793m (2014: R248m) resulting in a credit loss ratio of 0,44% (2014: 0,16%).
Credit impairments in CIB South Africa increased more than 100% to R356m (2014: R165m) resulting in a credit loss ratio of 0,24% (2014: 0,13%):
The performing loans’ coverage ratio increased from 0,20% to 0,32% as a result of increased risk on exposures mainly in the retail and commodity sectors.
Additional impairment provisions on existing NPLs resulted in an increase of the coverage ratio to 66% (2014: 48%).
Credit impairments in CIB Rest of Africa increased more than 100% to R437m (2014: R83m) resulting in a credit loss ratio of 1,29% (2014: 0,29%):
The performing loans’ coverage ratio increased to 0,51% (2014: 0,38%) mainly as a result of more prudent assumptions being applied in the impairment models.
The NPLs’ coverage ratios increased to 30% (2014: 18%) due to additional NPLs with lower expected recovery rates.
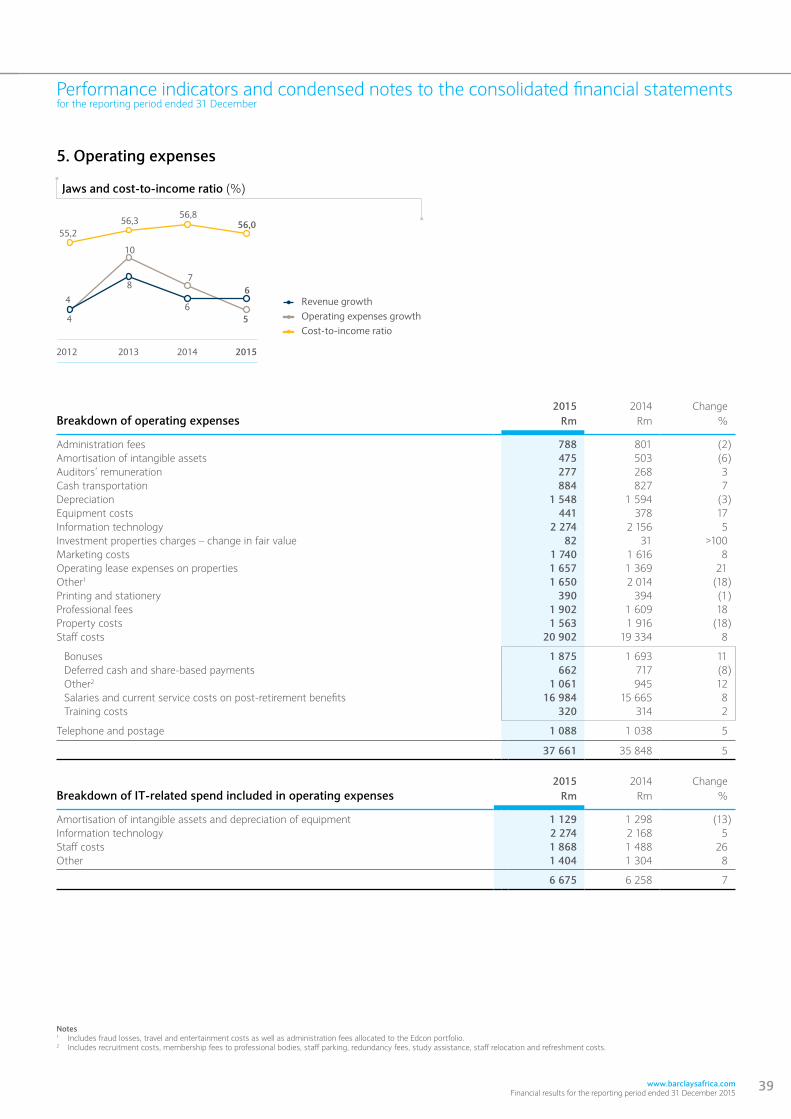
www.barclaysafrica.com Financial results for the reporting period ended 31 December 2015
39
Performance indicators and condensed notes to the consolidated financial statementsfor the reporting period ended 31 December
5. Operating expenses
2015 2014 ChangeBreakdown of operating expenses Rm Rm %
Administration fees 788 801 (2)Amortisation of intangible assets 475 503 (6)Auditors’ remuneration 277 268 3Cash transportation 884 827 7Depreciation 1 548 1 594 (3)Equipment costs 441 378 17Information technology 2 274 2 156 5Investment properties charges – change in fair value 82 31 >100Marketing costs 1 740 1 616 8Operating lease expenses on properties 1 657 1 369 21Other1 1 650 2 014 (18)Printing and stationery 390 394 (1)Professional fees 1 902 1 609 18Property costs 1 563 1 916 (18)Staff costs 20 902 19 334 8
Bonuses 1 875 1 693 11Deferred cash and share-based payments 662 717 (8)Other2 1 061 945 12Salaries and current service costs on post-retirement benefits 16 984 15 665 8Training costs 320 314 2
Telephone and postage 1 088 1 038 5
37 661 35 848 5
Breakdown of IT-related spend included in operating expenses2015 2014 Change
Rm Rm %
Amortisation of intangible assets and depreciation of equipment 1 129 1 298 (13)Information technology 2 274 2 168 5Staff costs 1 868 1 488 26Other 1 404 1 304 8
6 675 6 258 7
5
10
78 6
56,3 56,056,8
201520142013
4
4
55,2
2012
6 Revenue growth Operating expenses growth Cost-to-income ratio
Jaws and cost-to-income ratio (%)
Notes1 Includes fraud losses, travel and entertainment costs as well as administration fees allocated to the Edcon portfolio.2 Includes recruitment costs, membership fees to professional bodies, staff parking, redundancy fees, study assistance, staff relocation and refreshment costs.
40 Barclays Africa Group Limited Financial results for the reporting period ended 31 December 2015
Performance indicators and condensed notes to the consolidated financial statementsfor the reporting period ended 31 December
Group performance Overview 4Segment performance Salient features 9Risk management Profit and dividend announcement 11Appendices Financials 18Administration and contact details Notes to the financials 25
5. Operating expenses (continued)
The Group maintained its focus on actively managing the cost base, resulting in operating expenses growing below inflation. Major drivers of cost are constantly evaluated for increased optimisation, with the resulting focus on property, IT and headcount. Staff costs have continued to outpace inflation, which reflects the underlying strategy of increasing skills levels and specialised services across the Group. As per the terms of the purchase agreement, some operating expenses of the African entities acquired during 2013 are still being funded by Barclays Bank PLC.
Operating expenses increased 5% to R37 661m (2014: R35 848m), improving the Group’s cost-to-income ratio to 56,0% from 56,8%. Staff costs increased 8%, while non-staff-related cost growth was kept well below inflation at 1%. Operating expenses include R299m (2014: R526m) of investment into rightsizing the branch network and integrating IT across Africa:
Professional fees grew by 18%, with continued investment in strategic projects and IT infrastructure.
Equipment costs increased 17% primarily due to continued investment into rest of Africa.
Staff costs grew by 8% to R20 902m (2014: R19 334m), due to higher wage increases for entry-level employees together with increases in headcount in specialist areas such as IT. The total bonus and share-based payment expense as a percentage of salaries has remained consistent year on year at 15,9% (2014: 16,3%). Other staff costs increased 12% to R1 061m (2014: R945m) driven by increased staff mobility costs across the Group as we develop our talent across Africa.
Marketing costs increased 8% in line with revenue growth.
Cash transportation costs grew 7%, driven by volume increases and a reclassification of costs following the transfer of the cash centres to SBV in August 2015.
Amortisation of intangible assets declined 6% due to the impairments recognised in the prior reporting period, while administration fees decreased 2% following the effect of once-off costs incurred in 2014.
Other operating costs decreased by 18% to R1 650m (2014: R2 013m) as a result of lower frauds losses, a decrease in sundry expenses and larger recoveries for services provided to other Barclays Bank PLC entities.
Continued optimisation of corporate and branch property costs resulted in property costs and operating lease expenses reducing 2% to R3 220m (2014: R3 285m) in spite of above-inflation increases in rates and utility costs.
Depreciation fell 2% aided by reductions in property-related depreciation and legacy computer equipment being impaired.
Efficiency gains limited IT cost growth to 5%, in spite of the currency depreciation which impacted on imported goods and services.
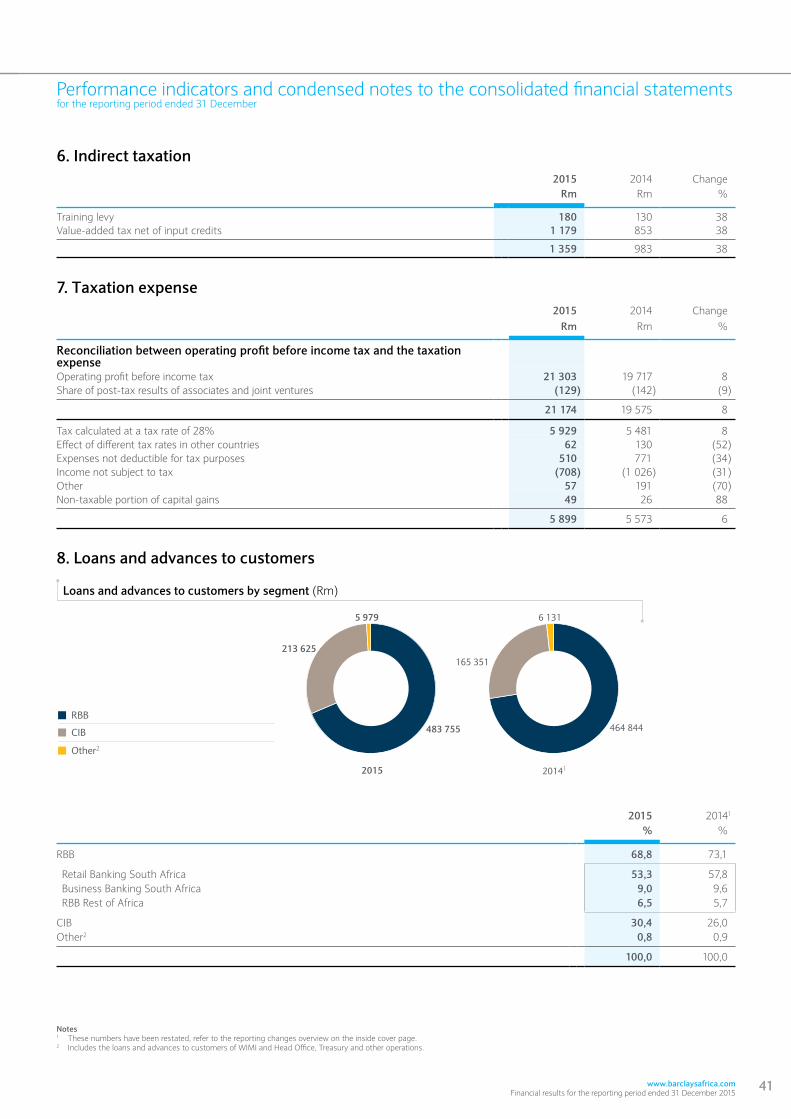
www.barclaysafrica.com Financial results for the reporting period ended 31 December 2015
41
Performance indicators and condensed notes to the consolidated financial statementsfor the reporting period ended 31 December
Notes1 These numbers have been restated, refer to the reporting changes overview on the inside cover page.2 Includes the loans and advances to customers of WIMI and Head Office, Treasury and other operations.
6. Indirect taxation2015 2014 Change
Rm Rm %
Training levy 180 130 38Value-added tax net of input credits 1 179 853 38
1 359 983 38
7. Taxation expense2015 2014 Change
Rm Rm %
Reconciliation between operating profit before income tax and the taxation expenseOperating profit before income tax 21 303 19 717 8Share of post-tax results of associates and joint ventures (129) (142) (9)
21 174 19 575 8
Tax calculated at a tax rate of 28% 5 929 5 481 8Effect of different tax rates in other countries 62 130 (52)Expenses not deductible for tax purposes 510 771 (34)Income not subject to tax (708) (1 026) (31)Other 57 191 (70)Non-taxable portion of capital gains 49 26 88
5 899 5 573 6
2015
5 979
20141
464 844
165 351
6 131
213 625
483 755
Loans and advances to customers by segment (Rm)
� RBB
� CIB
� Other2
8. Loans and advances to customers
2015 20141
% %
RBB 68,8 73,1
Retail Banking South Africa 53,3 57,8 Business Banking South Africa 9,0 9,6 RBB Rest of Africa 6,5 5,7
CIB 30,4 26,0Other2 0,8 0,9
100,0 100,0
42 Barclays Africa Group Limited Financial results for the reporting period ended 31 December 2015
Performance indicators and condensed notes to the consolidated financial statementsfor the reporting period ended 31 December
Group performance Overview 4Segment performance Salient features 9Risk management Profit and dividend announcement 11Appendices Financials 18Administration and contact details Notes to the financials 25
8. Loans and advances to customers (continued)
2015 20141 ChangeLoans and advances to customers by segment Rm Rm %
RBBGross loans and advances to customers 499 033 480 138 4Impairment losses on loans and advances (15 278) (15 294) (0)
483 755 464 844 4
Retail Banking South AfricaCredit cards 41 404 40 622 2Instalment credit agreements 74 028 71 849 3Loans to associates and joint ventures 16 176 13 012 24Mortgages 231 656 233 054 (1)Other loans and advances 367 410 (10)Overdrafts 2 953 2 369 25Personal and term loans 19 089 17 563 9
Gross loans and advances to customers 385 673 378 879 2Impairment losses on loans and advances (10 676) (10 912) (2)
374 997 367 967 2
Business Banking South AfricaMortgages (including CPF) 31 636 31 341 1Overdrafts 18 804 18 725 0Term loans 14 918 13 027 15
Gross loans and advances to customers 65 358 63 093 4Impairment losses on loans and advances (1 813) (2 028) (11)
63 545 61 065 4
RBB Rest of AfricaGross loans and advances to customers 48 002 38 166 26Impairment losses on loans and advances (2 789) (2 354) 18
45 213 35 812 26
CIBForeign currency loans 22 970 22 086 4Mortgages 8 915 3 718 >100Term loans 105 022 77 777 35Overdrafts 11 793 10 257 15Overnight finance 14 152 17 622 (20)Preference shares 16 137 11 850 36Reverse repurchase agreements 20 310 5 819 >100Other loans and advances 16 043 16 976 (5)
Gross loans and advances to customers 215 342 166 105 30Impairment losses on loans and advances (1 717) (754) >100
213 625 165 351 29
Note1 These numbers have been restated, refer to the reporting changes overview on the inside cover page.
www.barclaysafrica.com Financial results for the reporting period ended 31 December 2015
43
Performance indicators and condensed notes to the consolidated financial statementsfor the reporting period ended 31 December
8. Loans and advances to customers (continued)
2015 20141 ChangeLoans and advances to customers by segment (continued) Rm Rm %
WIMICPF 865 947 (9)Overdrafts 2 890 2 701 7Other loans and advances 1 660 1 668 0
Gross loans and advances to customers 5 415 5 316 2Impairment losses on loans and advances (65) (82) (21)
5 350 5 234 2
Head Office, Treasury and other operationsGross loans and advances to customers 669 897 (25)Impairment losses on loans and advances (40) — <(100)
629 897 (30)
Total loans and advances to customersGross loans and advances to customers 720 459 652 456 10Impairment losses on loans and advances (17 100) (16 130) 6
Net loans and advances to customers 703 359 636 326 11
2015 20141
Total funding mix % %
Deposits due to customers 78,2 79,7
RBB 39,2 39,4
Retail Banking South Africa 18,9 19,2 Business Banking South Africa 12,5 12,9 RBB Rest of Africa 7,8 7,3
CIB 27,4 29,0 Other2 11,6 11,3
Deposits from banks 7,2 6,8Debt securities in issue 14,6 13,5
100,0 100,0
9. Deposits due to customers
101 883
344 847
241 689
88 609
308 581
227 696
2015 20141
Deposits due to customers by segment (Rm)
� RBB
� CIB
� Other2
Notes 1 These numbers have been restated, refer to the reporting changes overview on the inside cover page. 2 Includes the deposits due to customers of WIMI and Head Office, Treasury and other operations.
44 Barclays Africa Group Limited Financial results for the reporting period ended 31 December 2015
Performance indicators and condensed notes to the consolidated financial statementsfor the reporting period ended 31 December
Group performance Overview 4Segment performance Salient features 9Risk management Profit and dividend announcement 11Appendices Financials 18Administration and contact details Notes to the financials 25
2015 20141 ChangeDeposits due to customers by segment Rm Rm %
RBB 344 847 308 581 12
Retail Banking South Africa 166 015 150 427 10
Call deposits 286 297 (4) Cheque account deposits 24 030 22 435 7 Credit card deposits 2 002 1 932 4 Fixed deposits 36 835 32 357 14 Investment products 58 103 49 736 17 Notice deposits 10 941 10 152 8 Other deposits 599 492 22 Savings and transmission deposits 33 219 33 026 1
Business Banking South Africa 110 096 100 948 9
Call deposits 11 151 9 707 15 Cheque account deposits 47 629 46 692 2 Fixed deposits 22 255 19 939 12 Notice deposits 1 356 1 277 6 Savings and transmission deposits 27 705 23 333 19
RBB Rest of Africa 68 736 57 206 20
CIB 241 689 227 696 6
Call deposits 28 613 24 705 16 Cheque account deposits 99 744 90 750 10 Fixed deposits 72 285 78 994 (8) Foreign currency deposits 18 293 18 897 (3) Investment products 1 499 822 82 Notice deposits 1 314 259 >100 Other deposits 12 490 8 508 47 Repurchase agreements with non-banks 4 620 2 165 >100 Savings and transmission deposits 2 831 2 596 9
WIMI 5 160 5 276 (2)
Call deposits 322 274 18 Cheque account deposits 2 300 2 306 0 Fixed deposits 465 826 (44) Foreign currency deposits 180 114 58 Notice deposits 20 20 — Savings and transmission deposits 1 873 1 736 8
Head Office, Treasury and other operations 96 723 83 333 16
Total deposits due to customers 688 419 624 886 10
9. Deposits due to customers (continued)
Note1 These numbers have been restated, refer to the reporting changes overview on the inside cover page.
www.barclaysafrica.com Financial results for the reporting period ended 31 December 2015
45
Performance indicators and condensed notes to the consolidated financial statementsfor the reporting period ended 31 December
2015 2014 ChangeDebt securities in issue Rm Rm %
Commercial paper 2 096 — 100Credit-linked notes 11 597 8 823 31Floating rate notes 54 801 41 524 32Liabilities arising from securitised structured entities — 496 (100)Negotiable certificates of deposit 32 767 29 504 11Other 549 217 >100Promissory notes 1 232 949 30Structured notes and bonds 725 1 187 (39)Senior notes 24 916 23 398 6
128 683 106 098 21
Segment split1
RBB 2 054 3 071 (33)
Retail Banking South Africa 1 561 2 191 (29) RBB Rest of Africa 493 880 (44)
CIB 16 401 11 545 42Head Office, Treasury and other operations 110 228 91 482 20
128 683 106 098 21
2015 2014 ChangeRm Rm %
Authorised880 567 500 (2014: 880 467 500) ordinary shares of R2,00 each 1 761 1 761 —
Issued847 750 679 (2014: 847 750 679) ordinary shares of R2,00 each 1 696 1 696 —2 025 369 (2014: 880 000) treasury shares held by Group entities (3) (2) 50
1 691 1 694 (0)
Total issued capitalShare capital 1 691 1 694 0Share premium2 4 250 4 548 (7)
5 941 6 242 (5)
Number of ordinary shares in issue (after deduction of treasury shares) at the reporting date
2015Number of
shares
2014Number of
shares Change(million) (million) %
Ordinary shares in issue of R2,00 each 847,8 847,8 —Treasury shares held by Group entities (2,1) (0,9) <(100)
845,7 846,9 (0)
11. Equity and borrowed funds
10. Debt securities in issue
Note1 These numbers have been restated, refer to the reporting changes overview on the inside cover page.2 Refer to Statement of changes in equity, footnote 1 for details on movement.
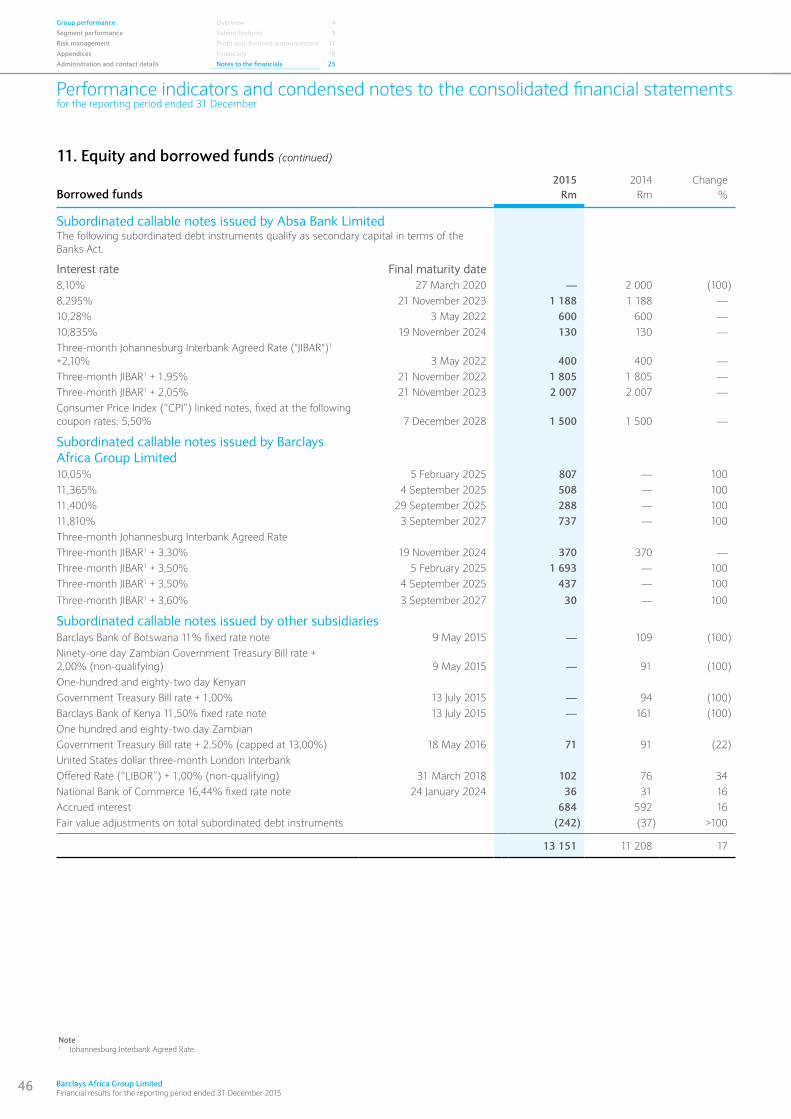
46 Barclays Africa Group Limited Financial results for the reporting period ended 31 December 2015
Performance indicators and condensed notes to the consolidated financial statementsfor the reporting period ended 31 December
Group performance Overview 4Segment performance Salient features 9Risk management Profit and dividend announcement 11Appendices Financials 18Administration and contact details Notes to the financials 25
11. Equity and borrowed funds (continued)
2015 2014 ChangeBorrowed funds Rm Rm %
Subordinated callable notes issued by Absa Bank LimitedThe following subordinated debt instruments qualify as secondary capital in terms of the Banks Act.
Interest rate Final maturity date8,10% 27 March 2020 — 2 000 (100)8,295% 21 November 2023 1 188 1 188 —10,28% 3 May 2022 600 600 —10,835% 19 November 2024 130 130 —Three-month Johannesburg Interbank Agreed Rate ("JIBAR")1 +2,10% 3 May 2022 400 400 —Three-month JIBAR1 + 1,95% 21 November 2022 1 805 1 805 —Three-month JIBAR1 + 2,05% 21 November 2023 2 007 2 007 —Consumer Price Index (“CPI”) linked notes, fixed at the following coupon rates: 5,50% 7 December 2028 1 500 1 500 —
Subordinated callable notes issued by Barclays Africa Group Limited10,05% 5 February 2025 807 — 10011,365% 4 September 2025 508 — 10011,400% 29 September 2025 288 — 10011,810% 3 September 2027 737 — 100Three-month Johannesburg Interbank Agreed RateThree-month JIBAR1 + 3,30% 19 November 2024 370 370 —Three-month JIBAR1 + 3,50% 5 February 2025 1 693 — 100Three-month JIBAR1 + 3,50% 4 September 2025 437 — 100
Three-month JIBAR1 + 3,60% 3 September 2027 30 — 100
Subordinated callable notes issued by other subsidiariesBarclays Bank of Botswana 11% fixed rate note 9 May 2015 — 109 (100)Ninety-one day Zambian Government Treasury Bill rate + 2,00% (non-qualifying) 9 May 2015 — 91 (100)One-hundred and eighty-two day KenyanGovernment Treasury Bill rate + 1,00% 13 July 2015 — 94 (100)Barclays Bank of Kenya 11,50% fixed rate note 13 July 2015 — 161 (100)One hundred and eighty-two day ZambianGovernment Treasury Bill rate + 2,50% (capped at 13,00%) 18 May 2016 71 91 (22)United States dollar three-month London InterbankOffered Rate (“LIBOR”) + 1,00% (non-qualifying) 31 March 2018 102 76 34National Bank of Commerce 16,44% fixed rate note 24 January 2024 36 31 16Accrued interest 684 592 16Fair value adjustments on total subordinated debt instruments (242) (37) >100
13 151 11 208 17
Note1 Johannesburg Interbank Agreed Rate.
www.barclaysafrica.com Financial results for the reporting period ended 31 December 2015
47
Performance indicators and condensed notes to the consolidated financial statementsfor the reporting period ended 31 December
11. Equity and borrowed funds (continued)
9 125
1,45 1,36
8%
10 558
1,86
9 764
201520142013
9 101
1,80
2012
� NAV per share (cents) Closing price/NAV per share (price-to-book) (%)
NAV per share and closing price/NAV per share (cents and %)
� RoE RoRWARoA
15,517,0
2,16 2,182,22
16,7
201520142013
1,29
14,4
2,09
2012
1,161,371,33
RoE, RoA and RoRWA (%)
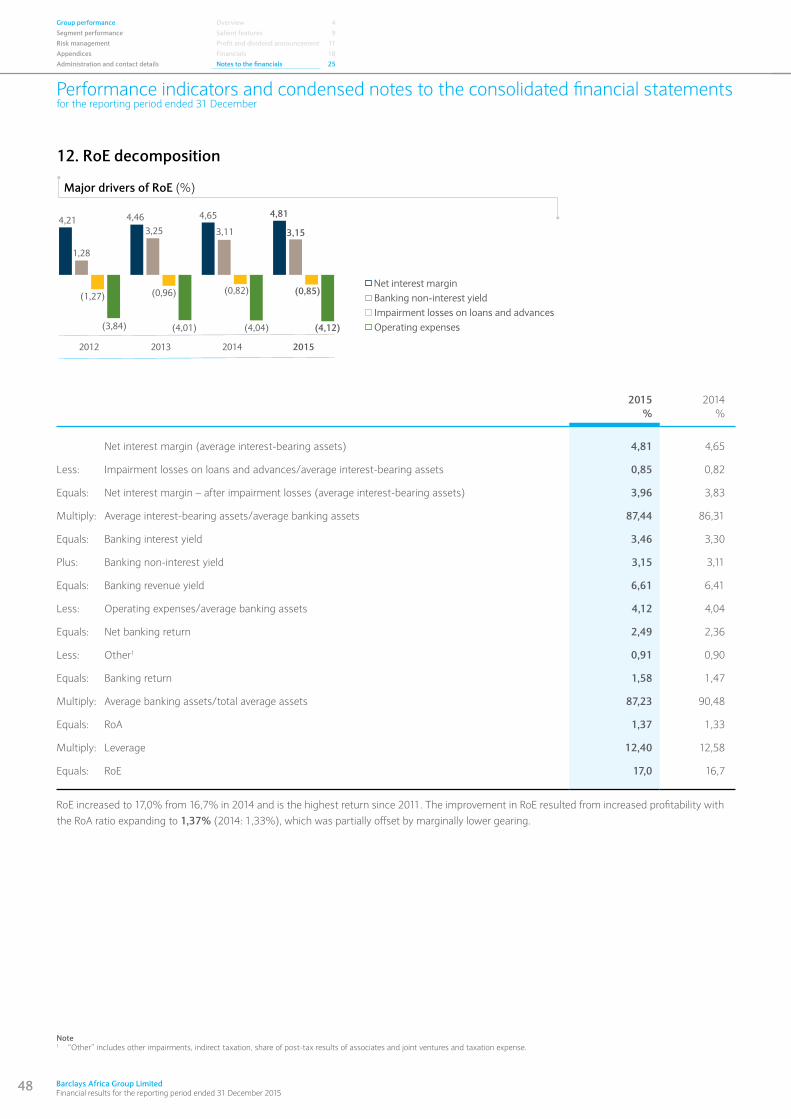
48 Barclays Africa Group Limited Financial results for the reporting period ended 31 December 2015
Performance indicators and condensed notes to the consolidated financial statementsfor the reporting period ended 31 December
Group performance Overview 4Segment performance Salient features 9Risk management Profit and dividend announcement 11Appendices Financials 18Administration and contact details Notes to the financials 25
12. RoE decomposition
2015 2014% %
Net interest margin (average interest-bearing assets) 4,81 4,65
Less: Impairment losses on loans and advances/average interest-bearing assets 0,85 0,82
Equals: Net interest margin – after impairment losses (average interest-bearing assets) 3,96 3,83
Multiply: Average interest-bearing assets/average banking assets 87,44 86,31
Equals: Banking interest yield 3,46 3,30
Plus: Banking non-interest yield 3,15 3,11
Equals: Banking revenue yield 6,61 6,41
Less: Operating expenses/average banking assets 4,12 4,04
Equals: Net banking return 2,49 2,36
Less: Other1 0,91 0,90
Equals: Banking return 1,58 1,47
Multiply: Average banking assets/total average assets 87,23 90,48
Equals: RoA 1,37 1,33
Multiply: Leverage 12,40 12,58
Equals: RoE 17,0 16,7
RoE increased to 17,0% from 16,7% in 2014 and is the highest return since 2011. The improvement in RoE resulted from increased profitability with the RoA ratio expanding to 1,37% (2014: 1,33%), which was partially offset by marginally lower gearing.
(0,82)
(4,04)
4,65
3,11
(0,85)
(4,12)
4,81
3,15
201520142013
(0,96)
(4,01)
4,463,25
2012
(1,27)
(3,84)
4,21
1,28
Major drivers of RoE (%)
� Net interest margin� Banking non-interest yield� Impairment losses on loans and advances� Operating expenses
Note1 “Other” includes other impairments, indirect taxation, share of post-tax results of associates and joint ventures and taxation expense.
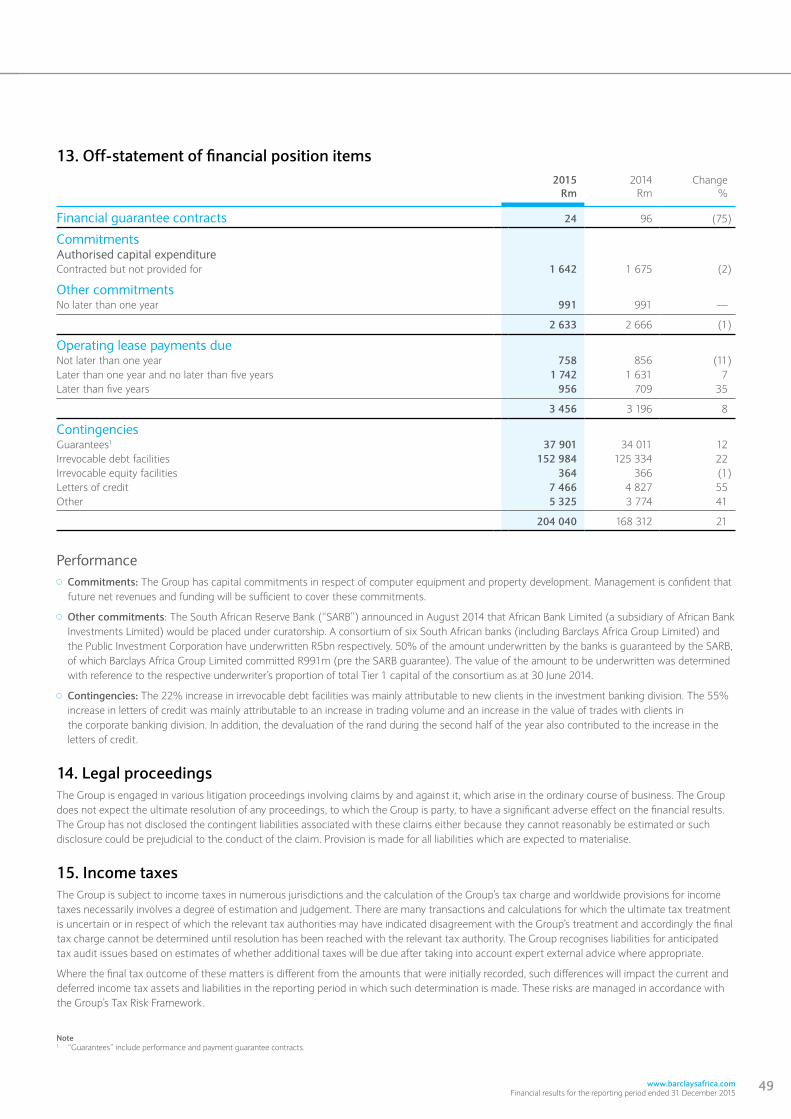
www.barclaysafrica.com Financial results for the reporting period ended 31 December 2015
49
2015Rm
2014Rm
Change%
Financial guarantee contracts 24 96 (75)
CommitmentsAuthorised capital expenditureContracted but not provided for 1 642 1 675 (2)
Other commitmentsNo later than one year 991 991 —
2 633 2 666 (1)
Operating lease payments dueNot later than one year 758 856 (11)Later than one year and no later than five years 1 742 1 631 7Later than five years 956 709 35
3 456 3 196 8
ContingenciesGuarantees1 37 901 34 011 12Irrevocable debt facilities 152 984 125 334 22Irrevocable equity facilities 364 366 (1)Letters of credit 7 466 4 827 55Other 5 325 3 774 41
204 040 168 312 21
Performance Commitments: The Group has capital commitments in respect of computer equipment and property development. Management is confident that
future net revenues and funding will be sufficient to cover these commitments.
Other commitments: The South African Reserve Bank (“SARB”) announced in August 2014 that African Bank Limited (a subsidiary of African Bank Investments Limited) would be placed under curatorship. A consortium of six South African banks (including Barclays Africa Group Limited) and the Public Investment Corporation have underwritten R5bn respectively. 50% of the amount underwritten by the banks is guaranteed by the SARB, of which Barclays Africa Group Limited committed R991m (pre the SARB guarantee). The value of the amount to be underwritten was determined with reference to the respective underwriter’s proportion of total Tier 1 capital of the consortium as at 30 June 2014.
Contingencies: The 22% increase in irrevocable debt facilities was mainly attributable to new clients in the investment banking division. The 55% increase in letters of credit was mainly attributable to an increase in trading volume and an increase in the value of trades with clients in the corporate banking division. In addition, the devaluation of the rand during the second half of the year also contributed to the increase in the letters of credit.
14. Legal proceedingsThe Group is engaged in various litigation proceedings involving claims by and against it, which arise in the ordinary course of business. The Group does not expect the ultimate resolution of any proceedings, to which the Group is party, to have a significant adverse effect on the financial results. The Group has not disclosed the contingent liabilities associated with these claims either because they cannot reasonably be estimated or such disclosure could be prejudicial to the conduct of the claim. Provision is made for all liabilities which are expected to materialise.
15. Income taxesThe Group is subject to income taxes in numerous jurisdictions and the calculation of the Group’s tax charge and worldwide provisions for income taxes necessarily involves a degree of estimation and judgement. There are many transactions and calculations for which the ultimate tax treatment is uncertain or in respect of which the relevant tax authorities may have indicated disagreement with the Group’s treatment and accordingly the final tax charge cannot be determined until resolution has been reached with the relevant tax authority. The Group recognises liabilities for anticipated tax audit issues based on estimates of whether additional taxes will be due after taking into account expert external advice where appropriate.
Where the final tax outcome of these matters is different from the amounts that were initially recorded, such differences will impact the current and deferred income tax assets and liabilities in the reporting period in which such determination is made. These risks are managed in accordance with the Group’s Tax Risk Framework.
13. Off-statement of financial position items
Note1 “Guarantees” include performance and payment guarantee contracts.
Segment performance
ContentsSegment performance overview 51
Segment report per market segment 56
Segment report per geographical segment 58
Segment report per market and geographical segment 60
RBB 63
CIB 95
WIMI 103
50 Barclays Africa Group Limited Financial results for the reporting period ended 31 December 2015
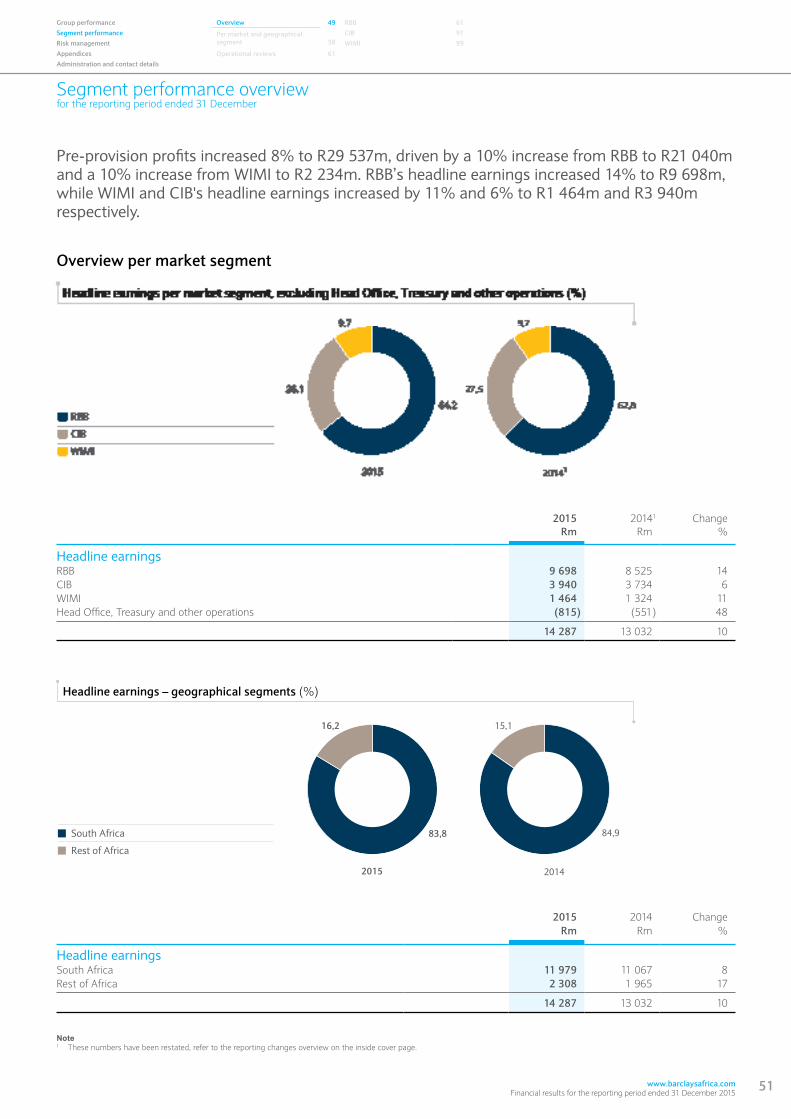
www.barclaysafrica.com Financial results for the reporting period ended 31 December 2015
51
Segment performance overviewfor the reporting period ended 31 December
Pre-provision profits increased 8% to R29 537m, driven by a 10% increase from RBB to R21 040m and a 10% increase from WIMI to R2 234m. RBB’s headline earnings increased 14% to R9 698m, while WIMI and CIB's headline earnings increased by 11% and 6% to R1 464m and R3 940m respectively.
Overview per market segment
2015Rm
20141
RmChange
%
Headline earningsRBB 9 698 8 525 14CIB 3 940 3 734 6WIMI 1 464 1 324 11Head Office, Treasury and other operations (815) (551) 48
14 287 13 032 10
Note1 These numbers have been restated, refer to the reporting changes overview on the inside cover page.
2015 2014 ChangeRm Rm %
Headline earningsSouth Africa 11 979 11 067 8Rest of Africa 2 308 1 965 17
14 287 13 032 10
84,9
15,1
83,8
16,2
2015 2014
Headline earnings – geographical segments (%)
� South Africa
� Rest of Africa
Group performance Overview 49 RBB 61Segment performance Per market and geographical
segment
58CIB 91
Risk management WIMI 99Appendices Operational reviews 61Administration and contact details
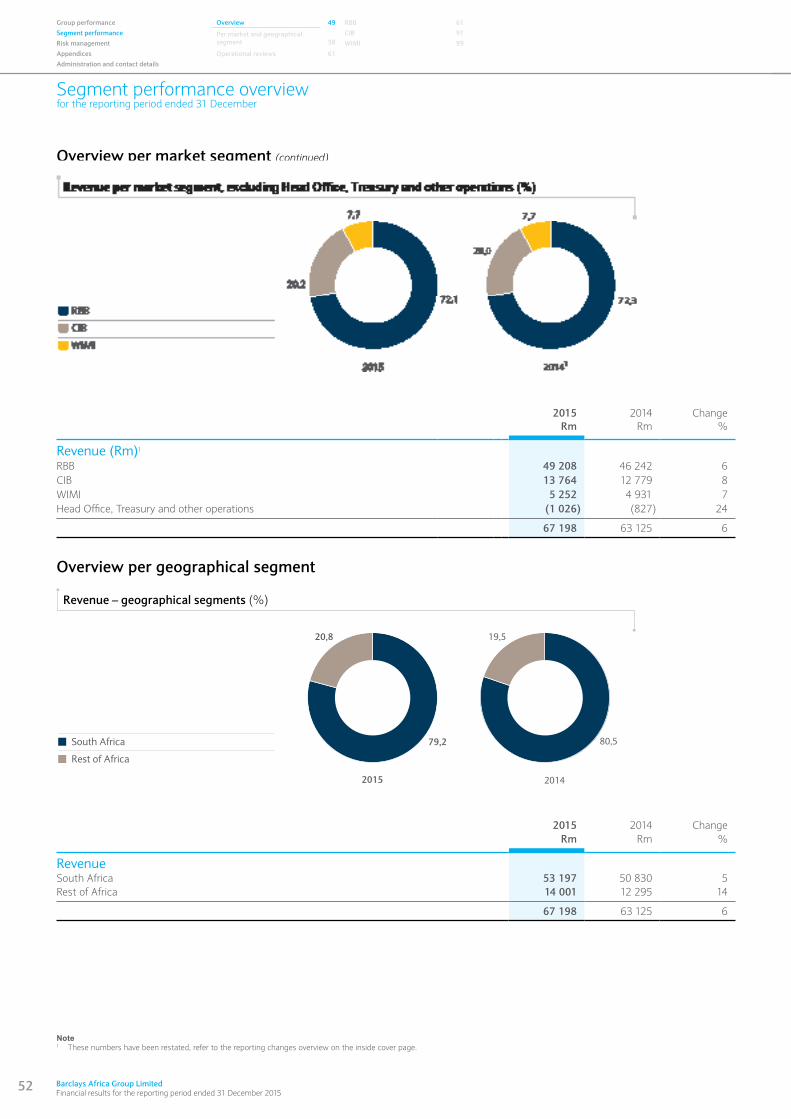
52 Barclays Africa Group Limited Financial results for the reporting period ended 31 December 2015
Segment performance overviewfor the reporting period ended 31 December
Group performance Overview 49 RBB 61Segment performance Per market and geographical
segment
58CIB 91
Risk management WIMI 99Appendices Operational reviews 61Administration and contact details
Overview per geographical segment
2015 2014 ChangeRm Rm %
RevenueSouth Africa 53 197 50 830 5Rest of Africa 14 001 12 295 14
67 198 63 125 6
80,5
19,5
79,2
20,8
2015 2014
Revenue – geographical segments (%)
� South Africa
� Rest of Africa
Overview per market segment (continued)
2015Rm
2014Rm
Change%
Revenue (Rm)1
RBB 49 208 46 242 6CIB 13 764 12 779 8WIMI 5 252 4 931 7Head Office, Treasury and other operations (1 026) (827) 24
67 198 63 125 6
Note1 These numbers have been restated, refer to the reporting changes overview on the inside cover page.
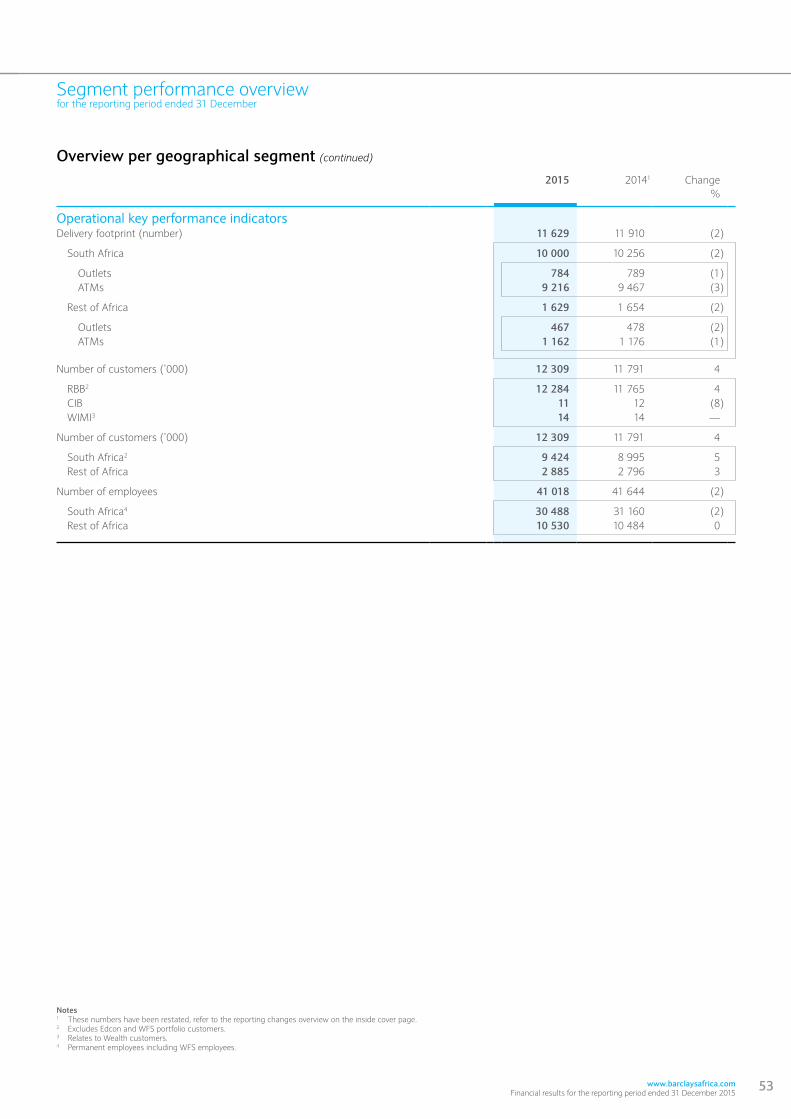
www.barclaysafrica.com Financial results for the reporting period ended 31 December 2015
53
Segment performance overviewfor the reporting period ended 31 December
Notes1 These numbers have been restated, refer to the reporting changes overview on the inside cover page.2 Excludes Edcon and WFS portfolio customers.3 Relates to Wealth customers.4 Permanent employees including WFS employees.
2015 20141 Change%
Operational key performance indicatorsDelivery footprint (number) 11 629 11 910 (2)
South Africa 10 000 10 256 (2)
Outlets 784 789 (1) ATMs 9 216 9 467 (3)
Rest of Africa 1 629 1 654 (2)
Outlets 467 478 (2) ATMs 1 162 1 176 (1)
Number of customers (’000) 12 309 11 791 4
RBB2 12 284 11 765 4 CIB 11 12 (8) WIMI3 14 14 —
Number of customers (’000) 12 309 11 791 4
South Africa2 9 424 8 995 5 Rest of Africa 2 885 2 796 3
Number of employees 41 018 41 644 (2)
South Africa4 30 488 31 160 (2) Rest of Africa 10 530 10 484 0
Overview per geographical segment (continued)
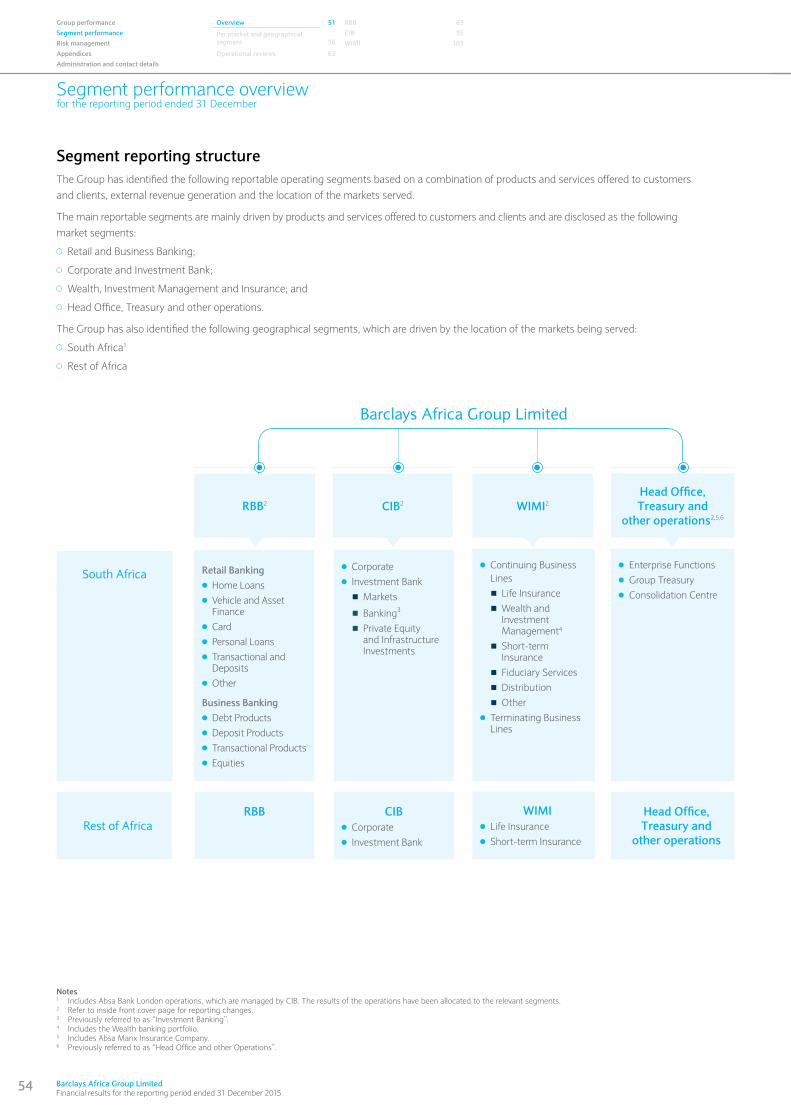
54 Barclays Africa Group Limited Financial results for the reporting period ended 31 December 2015
Segment performance overviewfor the reporting period ended 31 December
Group performance Overview 51 RBB 63Segment performance Per market and geographical
segment
56CIB 95
Risk management WIMI 103Appendices Operational reviews 63Administration and contact details
Notes1 Includes Absa Bank London operations, which are managed by CIB. The results of the operations have been allocated to the relevant segments.2 Refer to inside front cover page for reporting changes. 3 Previously referred to as “Investment Banking”.4 Includes the Wealth banking portfolio.5 Includes Absa Manx Insurance Company.6 Previously referred to as “Head Office and other Operations”.
Segment reporting structureThe Group has identified the following reportable operating segments based on a combination of products and services offered to customers and clients, external revenue generation and the location of the markets served.
The main reportable segments are mainly driven by products and services offered to customers and clients and are disclosed as the following market segments:
Retail and Business Banking;
Corporate and Investment Bank;
Wealth, Investment Management and Insurance; and
Head Office, Treasury and other operations.
The Group has also identified the following geographical segments, which are driven by the location of the markets being served:
South Africa1
Rest of Africa
Rest of Africa
Retail Bankingc Home Loans
c Vehicle and Asset Finance
c Card
c Personal Loans
c Transactional and Deposits
c Other
Business Bankingc Debt Products
c Deposit Products
c Transactional Products
c Equities
WIMI
c Life Insurance
c Short-term Insurance
Head Office, Treasury and
other operations
c Continuing Business
Lines
n Life Insurance
n Wealth and Investment Management4
n Short-term Insurance
n Fiduciary Services
n Distribution
n Other
c Terminating Business Lines
c Enterprise Functions
c Group Treasury
c Consolidation Centre
CIB2
CIB
c Corporate
c Investment Bank
RBB
South Africa
WIMI2
Head Office, Treasury and
other operations2,5,6
RBB2
Barclays Africa Group Limited
c Corporate
c Investment Bank
n Markets
n Banking3
n Private Equity and Infrastructure Investments

www.barclaysafrica.com Financial results for the reporting period ended 31 December 2015
55
This page has been left blank intentionally
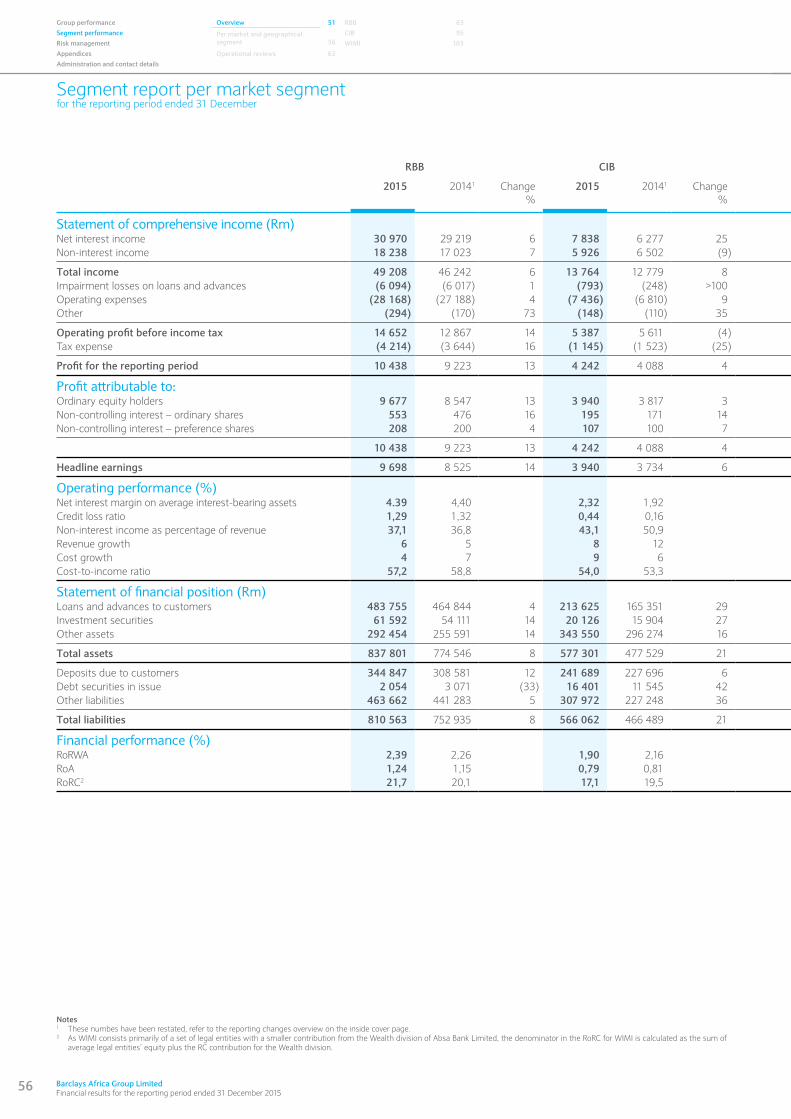
56 Barclays Africa Group Limited Financial results for the reporting period ended 31 December 2015
Group performance Overview 51 RBB 63Segment performance Per market and geographical
segment
56CIB 95
Risk management WIMI 103Appendices Operational reviews 63Administration and contact details
Segment report per market segmentfor the reporting period ended 31 December
Notes1 These numbes have been restated, refer to the reporting changes overview on the inside cover page.2 As WIMI consists primarily of a set of legal entities with a smaller contribution from the Wealth division of Absa Bank Limited, the denominator in the RoRC for WIMI is calculated as the sum of
average legal entities’ equity plus the RC contribution for the Wealth division.
RBB CIB WIMIHead Office, Treasury and
other operations Group
2015 20141 Change%
2015 20141 Change%
2015 20141 Change%
2015 20141 Change%
2015 20141 Change%
Statement of comprehensive income (Rm)Net interest income 30 970 29 219 6 7 838 6 277 25 290 303 (4) (691) (198) >100 38 407 35 601 8Non-interest income 18 238 17 023 7 5 926 6 502 (9) 4 962 4 628 7 (335) (629) (47) 28 791 27 524 5
Total income 49 208 46 242 6 13 764 12 779 8 5 252 4 931 7 (1 026) (827) 24 67 198 63 125 6Impairment losses on loans and advances (6 094) (6 017) 1 (793) (248) >100 5 (25) <(100) (38) — >100 (6 920) (6 290) 10Operating expenses (28 168) (27 188) 4 (7 436) (6 810) 9 (3 018) (2 899) 4 961 1 049 (8) (37 661) (35 848) 5Other (294) (170) 73 (148) (110) 35 (204) (143) >100 (668) (847) (21) (1 314) (1 270) 3
Operating profit before income tax 14 652 12 867 14 5 387 5 611 (4) 2 035 1 864 9 (771) (625) 23 21 303 19 717 8Tax expense (4 214) (3 644) 16 (1 145) (1 523) (25) (608) (549) 11 67 143 (53) (5 899) (5 573) 6
Profit for the reporting period 10 438 9 223 13 4 242 4 088 4 1 427 1 315 9 (704) (482) 46 15 404 14 144 9
Profit attributable to:Ordinary equity holders 9 677 8 547 13 3 940 3 817 3 1 417 1 311 8 (704) (459) 53 14 331 13 216 8Non-controlling interest – ordinary shares 553 476 16 195 171 14 4 (2) >100 — (22) (100) 752 623 21Non-controlling interest – preference shares 208 200 4 107 100 7 6 6 — — (1) (100) 321 305 5
10 438 9 223 13 4 242 4 088 4 1 427 1 315 9 (704) (482) 46 15 404 14 144 9
Headline earnings 9 698 8 525 14 3 940 3 734 6 1 464 1 324 11 (815) (551) 48 14 287 13 032 10
Operating performance (%)Net interest margin on average interest-bearing assets 4.39 4,40 2,32 1,92 n/a n/a n/a n/a 4,81 4,65Credit loss ratio 1,29 1,32 0,44 0,16 (0,10) 0,46 n/a n/a 1,05 1,02Non-interest income as percentage of revenue 37,1 36,8 43,1 50,9 94,5 93,9 n/a n/a 42,8 43,6Revenue growth 6 5 8 12 7 3 n/a n/a 6 6Cost growth 4 7 9 6 4 8 n/a n/a 5 7Cost-to-income ratio 57,2 58,8 54,0 53,3 57,5 58,8 n/a n/a 56,0 56,8
Statement of financial position (Rm)Loans and advances to customers 483 755 464 844 4 213 625 165 351 29 5 350 5 234 2 629 897 (30) 703 359 636 326 11Investment securities 61 592 54 111 14 20 126 15 904 27 4 642 4 981 (7) 14 605 22 122 (34) 100 965 97 118 4Other assets 292 454 255 591 14 343 550 296 274 16 33 928 36 550 (7) (329 652) (330 445) 0 340 280 257 970 32
Total assets 837 801 774 546 8 577 301 477 529 21 43 920 46 765 (6) (314 418) (307 426) 2 1 144 604 991 414 15
Deposits due to customers 344 847 308 581 12 241 689 227 696 6 5 160 5 276 (2) 96 723 83 333 16 688 419 624 886 10Debt securities in issue 2 054 3 071 (33) 16 401 11 545 42 — — — 110 228 91 482 20 128 683 106 098 21Other liabilities 463 662 441 283 5 307 972 227 248 36 33 236 36 422 (9) (576 015) (535 468) 8 228 855 169 485 35
Total liabilities 810 563 752 935 8 566 062 466 489 21 38 396 41 698 (8) (369 064) (360 653) 2 1 045 957 900 469 16
Financial performance (%)RoRWA 2,39 2,26 1,90 2,16 n/a n/a n/a n/a 2,18 2,22RoA 1,24 1,15 0,79 0,81 3,37 2,84 n/a n/a 1,37 1,33RoRC2 21,7 20,1 17,1 19,5 24,9 23,2 n/a n/a n/a n/a
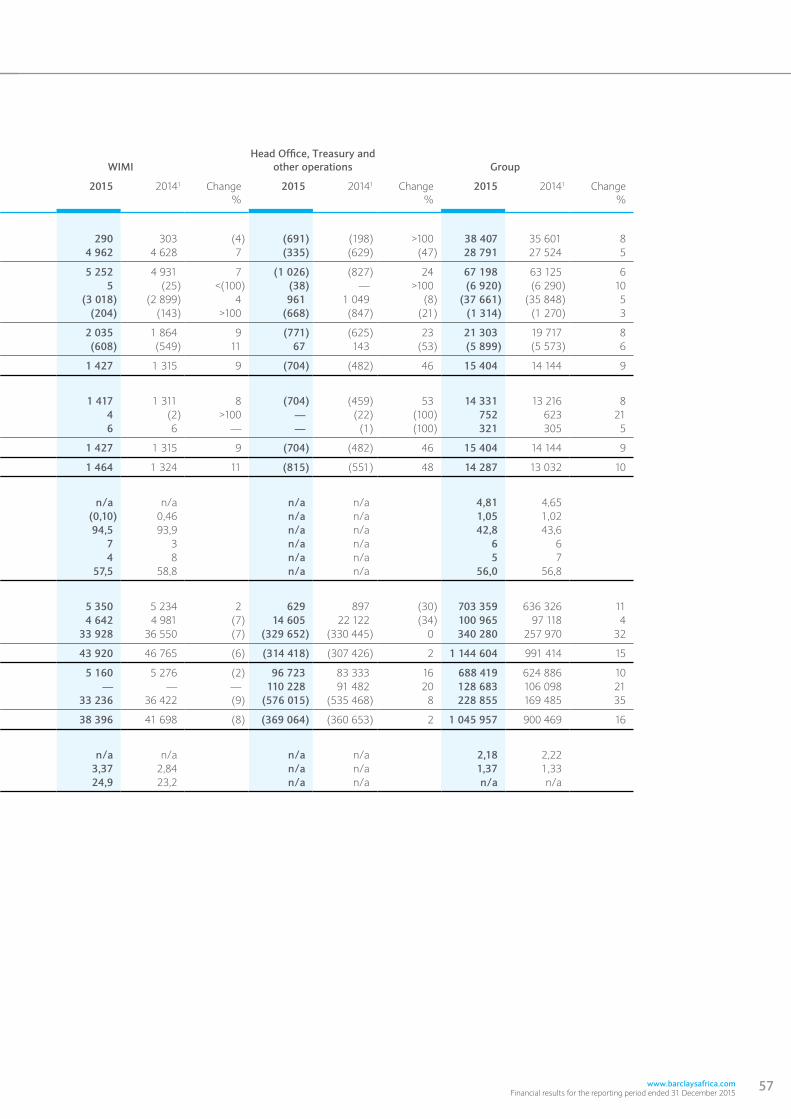
www.barclaysafrica.com Financial results for the reporting period ended 31 December 2015
57
RBB CIB WIMIHead Office, Treasury and
other operations Group
2015 20141 Change%
2015 20141 Change%
2015 20141 Change%
2015 20141 Change%
2015 20141 Change%
Statement of comprehensive income (Rm)Net interest income 30 970 29 219 6 7 838 6 277 25 290 303 (4) (691) (198) >100 38 407 35 601 8Non-interest income 18 238 17 023 7 5 926 6 502 (9) 4 962 4 628 7 (335) (629) (47) 28 791 27 524 5
Total income 49 208 46 242 6 13 764 12 779 8 5 252 4 931 7 (1 026) (827) 24 67 198 63 125 6Impairment losses on loans and advances (6 094) (6 017) 1 (793) (248) >100 5 (25) <(100) (38) — >100 (6 920) (6 290) 10Operating expenses (28 168) (27 188) 4 (7 436) (6 810) 9 (3 018) (2 899) 4 961 1 049 (8) (37 661) (35 848) 5Other (294) (170) 73 (148) (110) 35 (204) (143) >100 (668) (847) (21) (1 314) (1 270) 3
Operating profit before income tax 14 652 12 867 14 5 387 5 611 (4) 2 035 1 864 9 (771) (625) 23 21 303 19 717 8Tax expense (4 214) (3 644) 16 (1 145) (1 523) (25) (608) (549) 11 67 143 (53) (5 899) (5 573) 6
Profit for the reporting period 10 438 9 223 13 4 242 4 088 4 1 427 1 315 9 (704) (482) 46 15 404 14 144 9
Profit attributable to:Ordinary equity holders 9 677 8 547 13 3 940 3 817 3 1 417 1 311 8 (704) (459) 53 14 331 13 216 8Non-controlling interest – ordinary shares 553 476 16 195 171 14 4 (2) >100 — (22) (100) 752 623 21Non-controlling interest – preference shares 208 200 4 107 100 7 6 6 — — (1) (100) 321 305 5
10 438 9 223 13 4 242 4 088 4 1 427 1 315 9 (704) (482) 46 15 404 14 144 9
Headline earnings 9 698 8 525 14 3 940 3 734 6 1 464 1 324 11 (815) (551) 48 14 287 13 032 10
Operating performance (%)Net interest margin on average interest-bearing assets 4.39 4,40 2,32 1,92 n/a n/a n/a n/a 4,81 4,65Credit loss ratio 1,29 1,32 0,44 0,16 (0,10) 0,46 n/a n/a 1,05 1,02Non-interest income as percentage of revenue 37,1 36,8 43,1 50,9 94,5 93,9 n/a n/a 42,8 43,6Revenue growth 6 5 8 12 7 3 n/a n/a 6 6Cost growth 4 7 9 6 4 8 n/a n/a 5 7Cost-to-income ratio 57,2 58,8 54,0 53,3 57,5 58,8 n/a n/a 56,0 56,8
Statement of financial position (Rm)Loans and advances to customers 483 755 464 844 4 213 625 165 351 29 5 350 5 234 2 629 897 (30) 703 359 636 326 11Investment securities 61 592 54 111 14 20 126 15 904 27 4 642 4 981 (7) 14 605 22 122 (34) 100 965 97 118 4Other assets 292 454 255 591 14 343 550 296 274 16 33 928 36 550 (7) (329 652) (330 445) 0 340 280 257 970 32
Total assets 837 801 774 546 8 577 301 477 529 21 43 920 46 765 (6) (314 418) (307 426) 2 1 144 604 991 414 15
Deposits due to customers 344 847 308 581 12 241 689 227 696 6 5 160 5 276 (2) 96 723 83 333 16 688 419 624 886 10Debt securities in issue 2 054 3 071 (33) 16 401 11 545 42 — — — 110 228 91 482 20 128 683 106 098 21Other liabilities 463 662 441 283 5 307 972 227 248 36 33 236 36 422 (9) (576 015) (535 468) 8 228 855 169 485 35
Total liabilities 810 563 752 935 8 566 062 466 489 21 38 396 41 698 (8) (369 064) (360 653) 2 1 045 957 900 469 16
Financial performance (%)RoRWA 2,39 2,26 1,90 2,16 n/a n/a n/a n/a 2,18 2,22RoA 1,24 1,15 0,79 0,81 3,37 2,84 n/a n/a 1,37 1,33RoRC2 21,7 20,1 17,1 19,5 24,9 23,2 n/a n/a n/a n/a
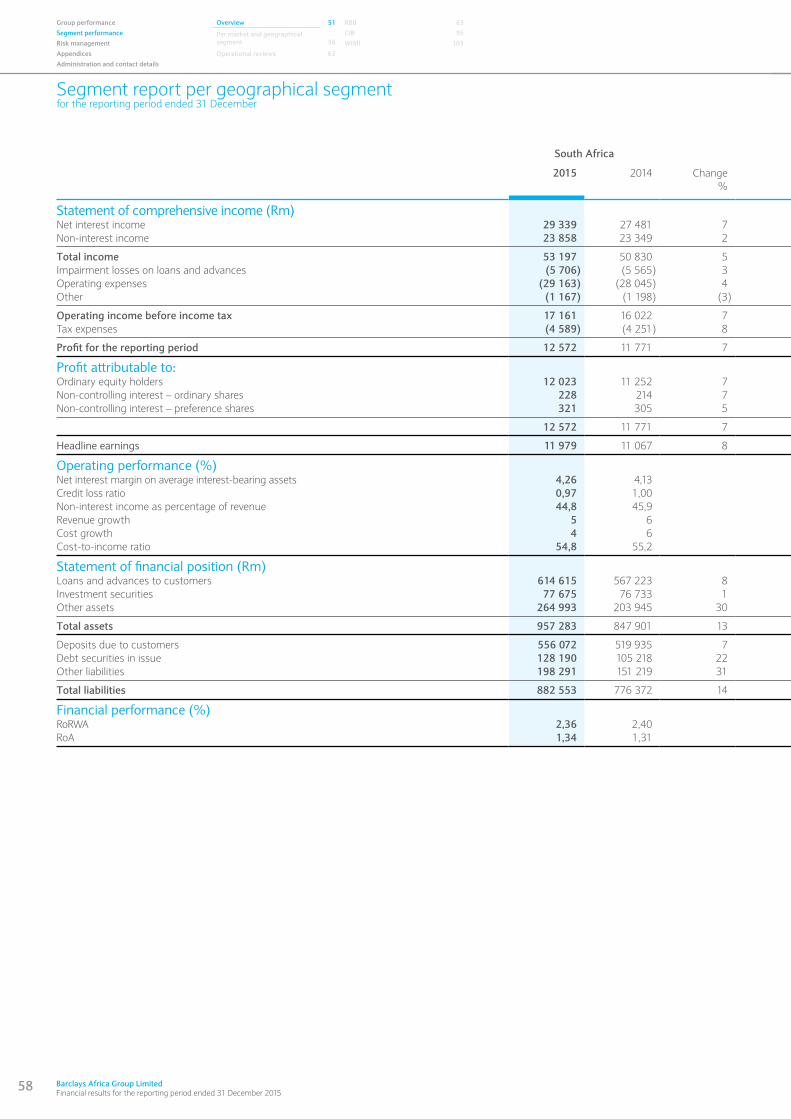
58 Barclays Africa Group Limited Financial results for the reporting period ended 31 December 2015
Group performance Overview 51 RBB 63Segment performance Per market and geographical
segment
56CIB 95
Risk management WIMI 103Appendices Operational reviews 63Administration and contact details
Segment report per geographical segmentfor the reporting period ended 31 December
South Africa Rest of Africa Group
2015 2014 Change%
2015 2014 Change%
2015 2014 Change%
Statement of comprehensive income (Rm)Net interest income 29 339 27 481 7 9 068 8 120 12 38 407 35 601 8Non-interest income 23 858 23 349 2 4 933 4 175 18 28 791 27 524 5
Total income 53 197 50 830 5 14 001 12 295 14 67 198 63 125 6Impairment losses on loans and advances (5 706) (5 565) 3 (1 214) (725) 67 (6 920) (6 290) 10Operating expenses (29 163) (28 045) 4 (8 498) (7 803) 9 (37 661) (35 848) 5Other (1 167) (1 198) (3) (147) (72) >100 (1 314) (1 270) 4
Operating income before income tax 17 161 16 022 7 4 142 3 695 12 21 303 19 717 8Tax expenses (4 589) (4 251) 8 (1 310) (1 322) (1) (5 899) (5 573) 6
Profit for the reporting period 12 572 11 771 7 2 832 2 373 19 15 404 14 144 9
Profit attributable to:Ordinary equity holders 12 023 11 252 7 2 308 1 964 18 14 331 13 216 8Non-controlling interest – ordinary shares 228 214 7 524 409 28 752 623 21Non-controlling interest – preference shares 321 305 5 — — — 321 305 5
12 572 11 771 7 2 832 2 373 19 15 404 14 144 9
Headline earnings 11 979 11 067 8 2 308 1 965 17 14 287 13 032 10
Operating performance (%)Net interest margin on average interest-bearing assets 4,26 4,13 8,23 8,13 4,81 4,65Credit loss ratio 0,97 1,00 1,70 1,17 1,05 1,02Non-interest income as percentage of revenue 44,8 45,9 35,2 34,0 42,8 43,6Revenue growth 5 6 14 9 6 6Cost growth 4 6 9 10 5 7Cost-to-income ratio 54,8 55,2 60,7 63,5 56,0 56,8
Statement of financial position (Rm)Loans and advances to customers 614 615 567 223 8 88 744 69 103 28 703 359 636 326 11Investment securities 77 675 76 733 1 23 290 20 385 14 100 965 97 118 4Other assets 264 993 203 945 30 75 287 54 025 39 340 280 257 970 32
Total assets 957 283 847 901 13 187 321 143 513 31 1 144 604 991 414 15
Deposits due to customers 556 072 519 935 7 132 347 104 951 26 688 419 624 886 10Debt securities in issue 128 190 105 218 22 493 880 (44) 128 683 106 098 21Other liabilities 198 291 151 219 31 30 564 18 266 67 228 855 169 485 35
Total liabilities 882 553 776 372 14 163 404 124 097 32 1 045 957 900 469 16
Financial performance (%)RoRWA 2,36 2,40 1,55 1,54 2,18 2,22RoA 1,34 1,31 1,53 1,42 1,37 1,33
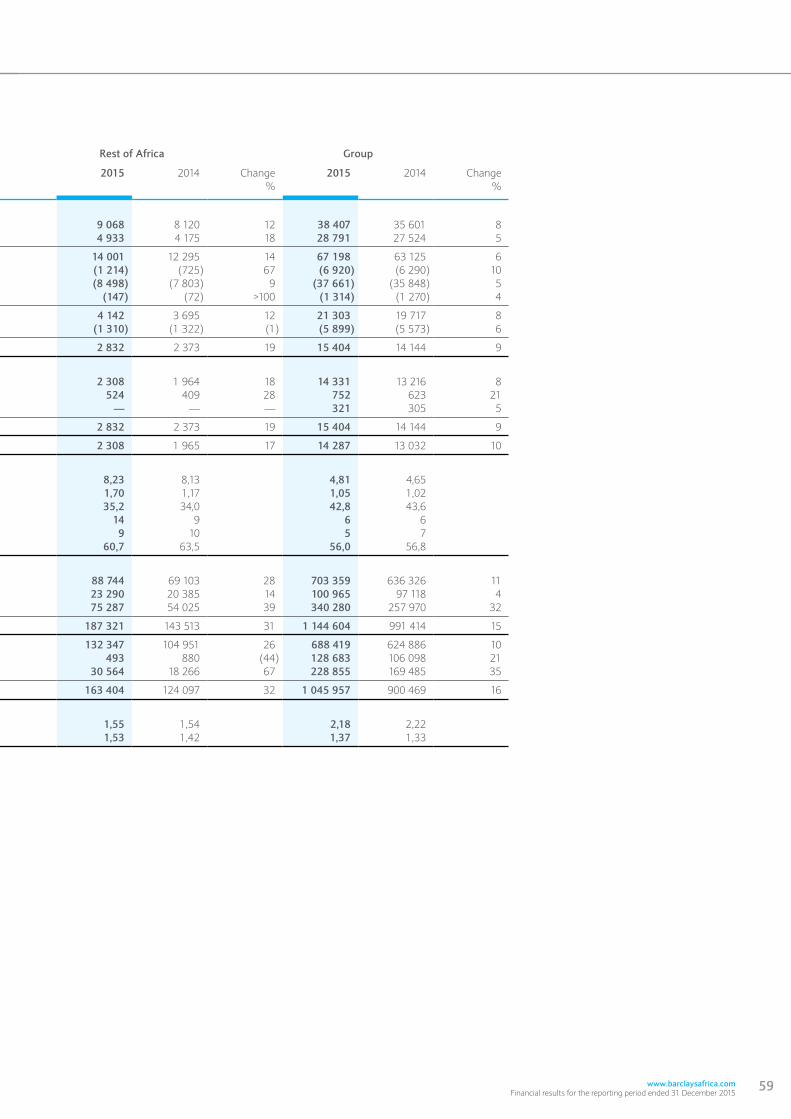
www.barclaysafrica.com Financial results for the reporting period ended 31 December 2015
59
South Africa Rest of Africa Group
2015 2014 Change%
2015 2014 Change%
2015 2014 Change%
Statement of comprehensive income (Rm)Net interest income 29 339 27 481 7 9 068 8 120 12 38 407 35 601 8Non-interest income 23 858 23 349 2 4 933 4 175 18 28 791 27 524 5
Total income 53 197 50 830 5 14 001 12 295 14 67 198 63 125 6Impairment losses on loans and advances (5 706) (5 565) 3 (1 214) (725) 67 (6 920) (6 290) 10Operating expenses (29 163) (28 045) 4 (8 498) (7 803) 9 (37 661) (35 848) 5Other (1 167) (1 198) (3) (147) (72) >100 (1 314) (1 270) 4
Operating income before income tax 17 161 16 022 7 4 142 3 695 12 21 303 19 717 8Tax expenses (4 589) (4 251) 8 (1 310) (1 322) (1) (5 899) (5 573) 6
Profit for the reporting period 12 572 11 771 7 2 832 2 373 19 15 404 14 144 9
Profit attributable to:Ordinary equity holders 12 023 11 252 7 2 308 1 964 18 14 331 13 216 8Non-controlling interest – ordinary shares 228 214 7 524 409 28 752 623 21Non-controlling interest – preference shares 321 305 5 — — — 321 305 5
12 572 11 771 7 2 832 2 373 19 15 404 14 144 9
Headline earnings 11 979 11 067 8 2 308 1 965 17 14 287 13 032 10
Operating performance (%)Net interest margin on average interest-bearing assets 4,26 4,13 8,23 8,13 4,81 4,65Credit loss ratio 0,97 1,00 1,70 1,17 1,05 1,02Non-interest income as percentage of revenue 44,8 45,9 35,2 34,0 42,8 43,6Revenue growth 5 6 14 9 6 6Cost growth 4 6 9 10 5 7Cost-to-income ratio 54,8 55,2 60,7 63,5 56,0 56,8
Statement of financial position (Rm)Loans and advances to customers 614 615 567 223 8 88 744 69 103 28 703 359 636 326 11Investment securities 77 675 76 733 1 23 290 20 385 14 100 965 97 118 4Other assets 264 993 203 945 30 75 287 54 025 39 340 280 257 970 32
Total assets 957 283 847 901 13 187 321 143 513 31 1 144 604 991 414 15
Deposits due to customers 556 072 519 935 7 132 347 104 951 26 688 419 624 886 10Debt securities in issue 128 190 105 218 22 493 880 (44) 128 683 106 098 21Other liabilities 198 291 151 219 31 30 564 18 266 67 228 855 169 485 35
Total liabilities 882 553 776 372 14 163 404 124 097 32 1 045 957 900 469 16
Financial performance (%)RoRWA 2,36 2,40 1,55 1,54 2,18 2,22RoA 1,34 1,31 1,53 1,42 1,37 1,33
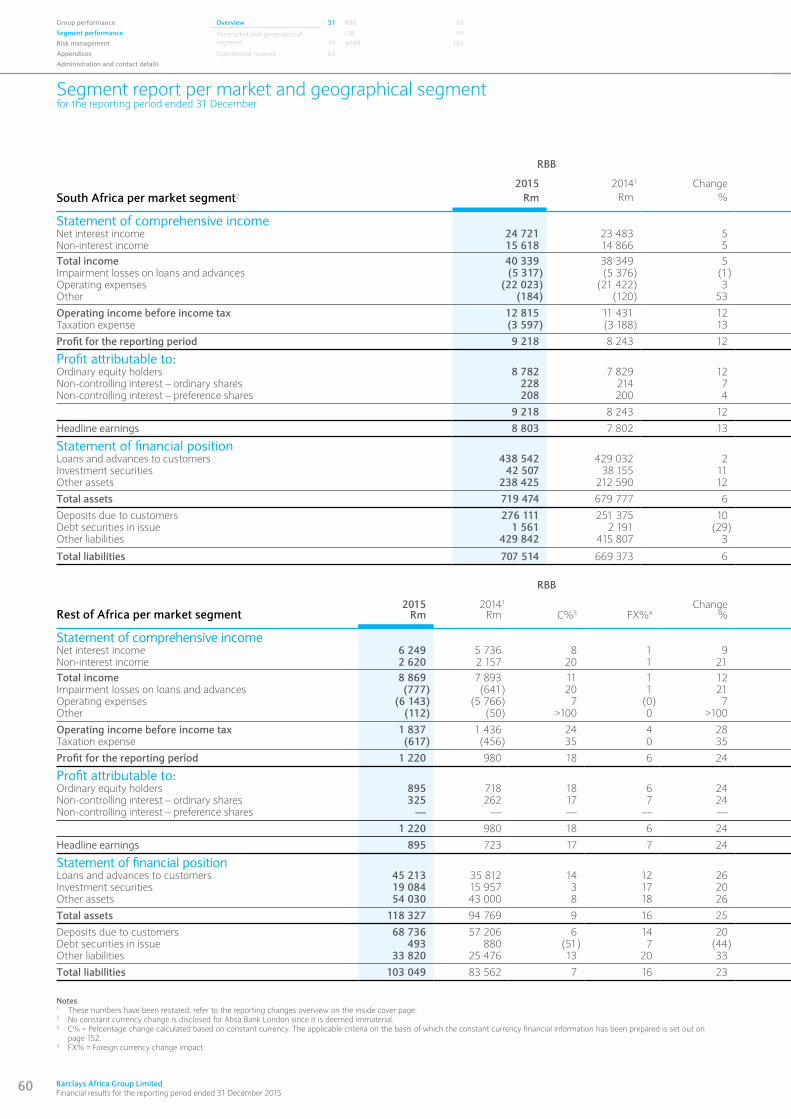
60 Barclays Africa Group Limited Financial results for the reporting period ended 31 December 2015
Segment report per market and geographical segmentfor the reporting period ended 31 December
RBB
CIB
WIMI
Head Office, Treasury and other operations
Total South Africa
2015 20141 Change 2015 20141 Change 2015 20141 Change 2015 20141 Change 2015 2014 ChangeSouth Africa per market segment2 Rm Rm % Rm Rm % Rm Rm % Rm Rm % Rm Rm %
Statement of comprehensive incomeNet interest income 24 721 23 483 5 5 032 3 860 30 289 301 (4) (703) (163) >100 29 339 27 481 7Non-interest income 15 618 14 866 5 3 928 4 731 (17) 4 631 4 360 6 (319) (608) (48) 23 858 23 349 2Total income 40 339 38 349 5 8 960 8 591 4 4 920 4 661 6 (1 022) (771) 33 53 197 50 830 5Impairment losses on loans and advances (5 317) (5 376) (1) (356) (165) >100 5 (25) <(100) (38) 1 <(100) (5 706) (5 565) 3Operating expenses (22 023) (21 422) 3 (5 304) (4 875) 9 (2 793) (2 725) 2 957 977 (2) (29 163) (28 045) 4Other (184) (120) 53 (123) (101) 22 (195) (130) 50 (665) (847) (21) (1 167) (1 198) (3)
Operating income before income tax 12 815 11 431 12 3 177 3 450 (8) 1 937 1 781 9 (768) (640) 20 17 161 16 022 7Taxation expense (3 597) (3 188) 13 (595) (751) (21) (563) (515) 9 166 203 (18) (4 589) (4 251) 8
Profit for the reporting period 9 218 8 243 12 2 582 2 699 (4) 1 374 1 266 9 (602) (437) 38 12 572 11 771 7
Profit attributable to:Ordinary equity holders 8 782 7 829 12 2 476 2 600 (5) 1 368 1 260 9 (602) (437) 38 12 023 11 252 7Non-controlling interest – ordinary shares 228 214 7 — (1) (100) — — — — 1 (100) 228 214 7Non-controlling interest – preference shares 208 200 4 107 100 7 6 6 — — (1) (100) 321 305 5
9 218 8 243 12 2 583 2 699 (4) 1 374 1 266 9 (602) (437) 38 12 572 11 771 7
Headline earnings 8 803 7 802 13 2 475 2 519 (2) 1 415 1 275 11 (715) (529) 35 11 979 11 067 8
Statement of financial positionLoans and advances to customers 438 542 429 032 2 170 094 132 060 29 5 350 5 234 2 629 897 (30) 614 615 567 223 8Investment securities 42 507 38 155 11 20 124 15 900 27 4 347 4 900 (11) 10 697 17 778 (40) 77 675 76 733 1Other assets 238 425 212 590 12 305 710 268 743 14 31 470 35 458 (11) (310 612) (312 846) (1) 264 993 203 945 30
Total assets 719 474 679 777 6 495 928 416 703 19 41 167 45 592 (10) (299 286) (294 171) 2 957 283 847 901 13
Deposits due to customers 276 111 251 375 10 178 078 180 127 (1) 5 160 5 276 (2) 96 723 83 157 16 556 072 519 935 7Debt securities in issue 1 561 2 191 (29) 16 401 11 545 42 — — — 110 228 91 482 20 128 190 105 218 22Other liabilities 429 842 415 807 3 295 457 219 802 34 31 566 35 727 (12) (558 574) (520 117) 7 198 291 151 219 32
Total liabilities 707 514 669 373 6 489 936 411 474 19 36 726 41 003 (10) (351 623) (345 478) 2 882 553 776 372 14
RBB CIB WIMI Head Office, Treasury and other operations Total Rest of Africa
Rest of Africa per market segment2015
Rm20141
Rm C%3 FX%4Change
%2015
Rm20141
Rm C%3 FX%4Change
%2015
Rm2014
Rm C%3 FX%4Change
%2015
Rm20141
Rm C%3 FX%4Change
%2015
Rm2014
Rm C%3 FX%4Change
%
Statement of comprehensive incomeNet interest income 6 249 5 736 8 1 9 2 806 2 417 14 2 16 1 2 (50) — (50) 12 (35) <(100) 2 >100 9 068 8 120 11 1 12Non-interest income 2 620 2 157 20 1 21 1 998 1 771 13 0 13 331 268 13 11 24 (16) (21) (30) 6 (24) 4 933 4 175 17 1 18Total income 8 869 7 893 11 1 12 4 804 4 188 13 2 15 332 270 12 11 23 (4) (56) (93) 0 (93) 14 001 12 295 13 1 14Impairment losses on loans and advances (777) (641) 20 1 21 (437) (83) >100 18 >100 — — — — — — (1) — — (100) (1 214) (725) 65 2 67Operating expenses (6 143) (5 766) 7 (0) 7 (2 132) (1 935) 11 (1) 10 (225) (174) 9 20 29 1 72 (94) 0 (94) (8 498) (7 803) 9 0 9Other (112) (50) >100 0 >100 (25) (9) >100 — >100 (9) (13) (31) — (31) — — — — — (147) (72) >100 0 >100
Operating income before income tax 1 837 1 436 24 4 28 2 210 2 161 (1) 3 2 98 83 27 (9) 18 (3) 15 <(100) 1 <(100) 4 142 3 695 9 3 12Taxation expense (617) (456) 35 0 35 (550) (772) (29) — (29) (45) (34) 22 11 33 (98) (60) 66 (3) 63 (1 310) (1 322) (1) 0 (1)
Profit for the reporting period 1 220 980 18 6 24 1 660 1 389 14 6 20 53 49 32 (24) 8 (101) (45) 98 3 >100 2 832 2 373 14 5 19
Profit attributable to:Ordinary equity holders 895 718 18 6 24 1 465 1 217 14 6 20 49 51 11 (15) (4) (101) (22) >100 (1) >100 2 308 1 964 11 7 18Non-controlling interest – ordinary shares 325 262 17 7 24 195 172 16 5 13 4 (2) >(100) — >(100) — (23) (96) 0 (96) 524 409 22 6 28Non-controlling interest – preference shares — — — — — — — — — — — — — — — — — — — — — — — — —
1 220 980 18 6 24 1 660 1 389 14 6 20 53 49 32 (24) 8 (101) (45) 98 3 >100 2 832 2 373 14 5 19
Headline earnings 895 723 17 7 24 1 465 1 216 14 6 20 49 49 17 (17) 0 (101) (22) >100 (1) >100 2 308 1 965 12 5 17
Statement of financial positionLoans and advances to customers 45 213 35 812 14 12 26 43 531 33 291 11 20 31 — — — — — — — — — — 88 744 69 103 12 16 28Investment securities 19 084 15 957 3 17 20 2 4 (50) — (50) 295 81 >100 96 >100 3 908 4 343 (13) 3 (10) 23 289 20 385 0 14 14Other assets 54 030 43 000 8 18 26 37 840 27 531 15 22 37 2 458 1 092 85 40 >100 (19 040) (17 598) 8 0 8 75 288 54 025 12 27 39
Total assets 118 327 94 769 9 16 25 81 373 60 826 13 21 34 2 753 1 173 91 44 >100 (15 132) (13 255) 15 (1) 14 187 321 143 513 11 20 31
Deposits due to customers 68 736 57 206 6 14 20 63 611 47 569 13 21 34 — — — — — — 176 (100) 0 (100) 132 347 104 951 9 17 26Debt securities in issue 493 880 (51) 7 (44) — — — — — — — — — — — — — — — 493 880 (51) 7 (44)Other liabilities 33 820 25 476 13 20 33 12 515 7 446 43 25 68 1 670 695 92 48 >100 (17 441) (15 351) 14 (0) 14 30 564 18 266 27 40 67
Total liabilities 103 049 83 562 7 16 23 76 126 55 015 17 21 38 1 670 695 92 48 >100 (17 441) (15 175) 15 0 15 163 404 124 097 11 21 32
Notes1 These numbers have been restated, refer to the reporting changes overview on the inside cover page.2 No constant currency change is disclosed for Absa Bank London since it is deemed immaterial.3 C% = Percentage change calculated based on constant currency. The applicable criteria on the basis of which the constant currency financial information has been prepared is set out on
page 152.4 FX% = Foreign currency change impact.
Group performance Overview 51 RBB 63Segment performance Per market and geographical
segment
56CIB 95
Risk management WIMI 103Appendices Operational reviews 63Administration and contact details
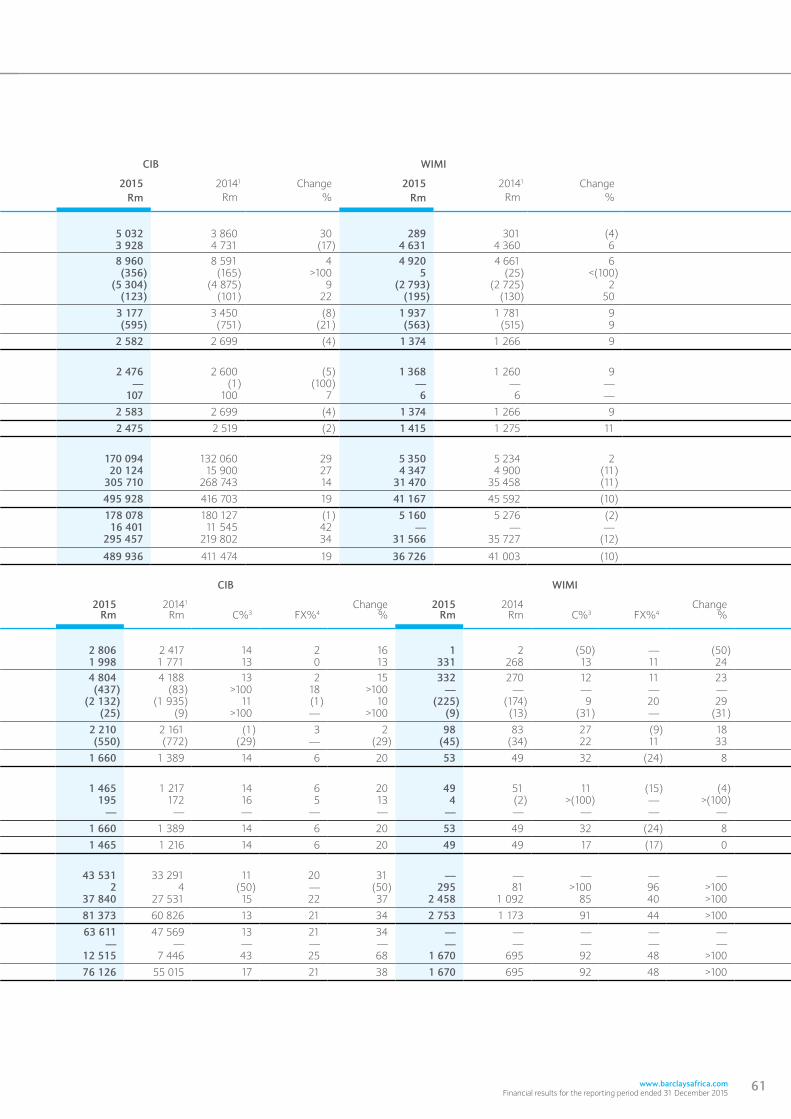
RBB
CIB
WIMI
Head Office, Treasury and other operations
Total South Africa
2015 20141 Change 2015 20141 Change 2015 20141 Change 2015 20141 Change 2015 2014 ChangeSouth Africa per market segment2 Rm Rm % Rm Rm % Rm Rm % Rm Rm % Rm Rm %
Statement of comprehensive incomeNet interest income 24 721 23 483 5 5 032 3 860 30 289 301 (4) (703) (163) >100 29 339 27 481 7Non-interest income 15 618 14 866 5 3 928 4 731 (17) 4 631 4 360 6 (319) (608) (48) 23 858 23 349 2Total income 40 339 38 349 5 8 960 8 591 4 4 920 4 661 6 (1 022) (771) 33 53 197 50 830 5Impairment losses on loans and advances (5 317) (5 376) (1) (356) (165) >100 5 (25) <(100) (38) 1 <(100) (5 706) (5 565) 3Operating expenses (22 023) (21 422) 3 (5 304) (4 875) 9 (2 793) (2 725) 2 957 977 (2) (29 163) (28 045) 4Other (184) (120) 53 (123) (101) 22 (195) (130) 50 (665) (847) (21) (1 167) (1 198) (3)
Operating income before income tax 12 815 11 431 12 3 177 3 450 (8) 1 937 1 781 9 (768) (640) 20 17 161 16 022 7Taxation expense (3 597) (3 188) 13 (595) (751) (21) (563) (515) 9 166 203 (18) (4 589) (4 251) 8
Profit for the reporting period 9 218 8 243 12 2 582 2 699 (4) 1 374 1 266 9 (602) (437) 38 12 572 11 771 7
Profit attributable to:Ordinary equity holders 8 782 7 829 12 2 476 2 600 (5) 1 368 1 260 9 (602) (437) 38 12 023 11 252 7Non-controlling interest – ordinary shares 228 214 7 — (1) (100) — — — — 1 (100) 228 214 7Non-controlling interest – preference shares 208 200 4 107 100 7 6 6 — — (1) (100) 321 305 5
9 218 8 243 12 2 583 2 699 (4) 1 374 1 266 9 (602) (437) 38 12 572 11 771 7
Headline earnings 8 803 7 802 13 2 475 2 519 (2) 1 415 1 275 11 (715) (529) 35 11 979 11 067 8
Statement of financial positionLoans and advances to customers 438 542 429 032 2 170 094 132 060 29 5 350 5 234 2 629 897 (30) 614 615 567 223 8Investment securities 42 507 38 155 11 20 124 15 900 27 4 347 4 900 (11) 10 697 17 778 (40) 77 675 76 733 1Other assets 238 425 212 590 12 305 710 268 743 14 31 470 35 458 (11) (310 612) (312 846) (1) 264 993 203 945 30
Total assets 719 474 679 777 6 495 928 416 703 19 41 167 45 592 (10) (299 286) (294 171) 2 957 283 847 901 13
Deposits due to customers 276 111 251 375 10 178 078 180 127 (1) 5 160 5 276 (2) 96 723 83 157 16 556 072 519 935 7Debt securities in issue 1 561 2 191 (29) 16 401 11 545 42 — — — 110 228 91 482 20 128 190 105 218 22Other liabilities 429 842 415 807 3 295 457 219 802 34 31 566 35 727 (12) (558 574) (520 117) 7 198 291 151 219 32
Total liabilities 707 514 669 373 6 489 936 411 474 19 36 726 41 003 (10) (351 623) (345 478) 2 882 553 776 372 14
RBB CIB WIMI Head Office, Treasury and other operations Total Rest of Africa
Rest of Africa per market segment2015
Rm20141
Rm C%3 FX%4Change
%2015
Rm20141
Rm C%3 FX%4Change
%2015
Rm2014
Rm C%3 FX%4Change
%2015
Rm20141
Rm C%3 FX%4Change
%2015
Rm2014
Rm C%3 FX%4Change
%
Statement of comprehensive incomeNet interest income 6 249 5 736 8 1 9 2 806 2 417 14 2 16 1 2 (50) — (50) 12 (35) <(100) 2 >100 9 068 8 120 11 1 12Non-interest income 2 620 2 157 20 1 21 1 998 1 771 13 0 13 331 268 13 11 24 (16) (21) (30) 6 (24) 4 933 4 175 17 1 18Total income 8 869 7 893 11 1 12 4 804 4 188 13 2 15 332 270 12 11 23 (4) (56) (93) 0 (93) 14 001 12 295 13 1 14Impairment losses on loans and advances (777) (641) 20 1 21 (437) (83) >100 18 >100 — — — — — — (1) — — (100) (1 214) (725) 65 2 67Operating expenses (6 143) (5 766) 7 (0) 7 (2 132) (1 935) 11 (1) 10 (225) (174) 9 20 29 1 72 (94) 0 (94) (8 498) (7 803) 9 0 9Other (112) (50) >100 0 >100 (25) (9) >100 — >100 (9) (13) (31) — (31) — — — — — (147) (72) >100 0 >100
Operating income before income tax 1 837 1 436 24 4 28 2 210 2 161 (1) 3 2 98 83 27 (9) 18 (3) 15 <(100) 1 <(100) 4 142 3 695 9 3 12Taxation expense (617) (456) 35 0 35 (550) (772) (29) — (29) (45) (34) 22 11 33 (98) (60) 66 (3) 63 (1 310) (1 322) (1) 0 (1)
Profit for the reporting period 1 220 980 18 6 24 1 660 1 389 14 6 20 53 49 32 (24) 8 (101) (45) 98 3 >100 2 832 2 373 14 5 19
Profit attributable to:Ordinary equity holders 895 718 18 6 24 1 465 1 217 14 6 20 49 51 11 (15) (4) (101) (22) >100 (1) >100 2 308 1 964 11 7 18Non-controlling interest – ordinary shares 325 262 17 7 24 195 172 16 5 13 4 (2) >(100) — >(100) — (23) (96) 0 (96) 524 409 22 6 28Non-controlling interest – preference shares — — — — — — — — — — — — — — — — — — — — — — — — —
1 220 980 18 6 24 1 660 1 389 14 6 20 53 49 32 (24) 8 (101) (45) 98 3 >100 2 832 2 373 14 5 19
Headline earnings 895 723 17 7 24 1 465 1 216 14 6 20 49 49 17 (17) 0 (101) (22) >100 (1) >100 2 308 1 965 12 5 17
Statement of financial positionLoans and advances to customers 45 213 35 812 14 12 26 43 531 33 291 11 20 31 — — — — — — — — — — 88 744 69 103 12 16 28Investment securities 19 084 15 957 3 17 20 2 4 (50) — (50) 295 81 >100 96 >100 3 908 4 343 (13) 3 (10) 23 289 20 385 0 14 14Other assets 54 030 43 000 8 18 26 37 840 27 531 15 22 37 2 458 1 092 85 40 >100 (19 040) (17 598) 8 0 8 75 288 54 025 12 27 39
Total assets 118 327 94 769 9 16 25 81 373 60 826 13 21 34 2 753 1 173 91 44 >100 (15 132) (13 255) 15 (1) 14 187 321 143 513 11 20 31
Deposits due to customers 68 736 57 206 6 14 20 63 611 47 569 13 21 34 — — — — — — 176 (100) 0 (100) 132 347 104 951 9 17 26Debt securities in issue 493 880 (51) 7 (44) — — — — — — — — — — — — — — — 493 880 (51) 7 (44)Other liabilities 33 820 25 476 13 20 33 12 515 7 446 43 25 68 1 670 695 92 48 >100 (17 441) (15 351) 14 (0) 14 30 564 18 266 27 40 67
Total liabilities 103 049 83 562 7 16 23 76 126 55 015 17 21 38 1 670 695 92 48 >100 (17 441) (15 175) 15 0 15 163 404 124 097 11 21 32
www.barclaysafrica.com Financial results for the reporting period ended 31 December 2015
61
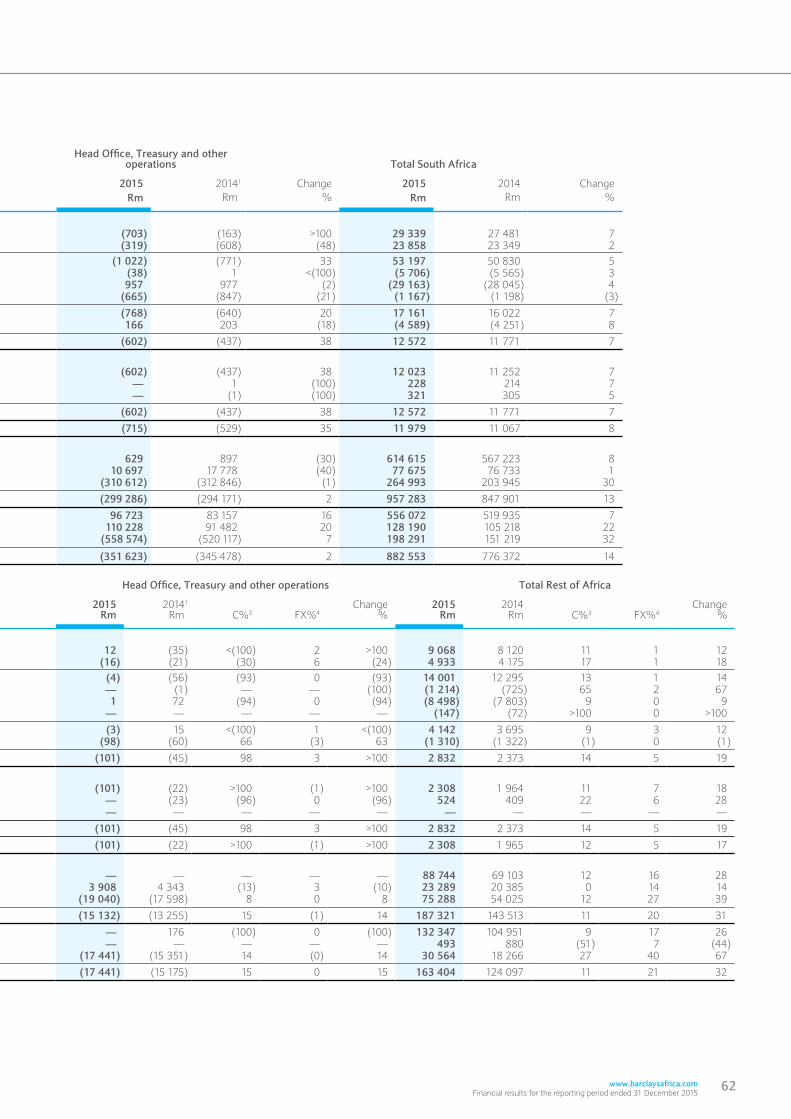
RBB
CIB
WIMI
Head Office, Treasury and other operations
Total South Africa
2015 20141 Change 2015 20141 Change 2015 20141 Change 2015 20141 Change 2015 2014 ChangeSouth Africa per market segment2 Rm Rm % Rm Rm % Rm Rm % Rm Rm % Rm Rm %
Statement of comprehensive incomeNet interest income 24 721 23 483 5 5 032 3 860 30 289 301 (4) (703) (163) >100 29 339 27 481 7Non-interest income 15 618 14 866 5 3 928 4 731 (17) 4 631 4 360 6 (319) (608) (48) 23 858 23 349 2Total income 40 339 38 349 5 8 960 8 591 4 4 920 4 661 6 (1 022) (771) 33 53 197 50 830 5Impairment losses on loans and advances (5 317) (5 376) (1) (356) (165) >100 5 (25) <(100) (38) 1 <(100) (5 706) (5 565) 3Operating expenses (22 023) (21 422) 3 (5 304) (4 875) 9 (2 793) (2 725) 2 957 977 (2) (29 163) (28 045) 4Other (184) (120) 53 (123) (101) 22 (195) (130) 50 (665) (847) (21) (1 167) (1 198) (3)
Operating income before income tax 12 815 11 431 12 3 177 3 450 (8) 1 937 1 781 9 (768) (640) 20 17 161 16 022 7Taxation expense (3 597) (3 188) 13 (595) (751) (21) (563) (515) 9 166 203 (18) (4 589) (4 251) 8
Profit for the reporting period 9 218 8 243 12 2 582 2 699 (4) 1 374 1 266 9 (602) (437) 38 12 572 11 771 7
Profit attributable to:Ordinary equity holders 8 782 7 829 12 2 476 2 600 (5) 1 368 1 260 9 (602) (437) 38 12 023 11 252 7Non-controlling interest – ordinary shares 228 214 7 — (1) (100) — — — — 1 (100) 228 214 7Non-controlling interest – preference shares 208 200 4 107 100 7 6 6 — — (1) (100) 321 305 5
9 218 8 243 12 2 583 2 699 (4) 1 374 1 266 9 (602) (437) 38 12 572 11 771 7
Headline earnings 8 803 7 802 13 2 475 2 519 (2) 1 415 1 275 11 (715) (529) 35 11 979 11 067 8
Statement of financial positionLoans and advances to customers 438 542 429 032 2 170 094 132 060 29 5 350 5 234 2 629 897 (30) 614 615 567 223 8Investment securities 42 507 38 155 11 20 124 15 900 27 4 347 4 900 (11) 10 697 17 778 (40) 77 675 76 733 1Other assets 238 425 212 590 12 305 710 268 743 14 31 470 35 458 (11) (310 612) (312 846) (1) 264 993 203 945 30
Total assets 719 474 679 777 6 495 928 416 703 19 41 167 45 592 (10) (299 286) (294 171) 2 957 283 847 901 13
Deposits due to customers 276 111 251 375 10 178 078 180 127 (1) 5 160 5 276 (2) 96 723 83 157 16 556 072 519 935 7Debt securities in issue 1 561 2 191 (29) 16 401 11 545 42 — — — 110 228 91 482 20 128 190 105 218 22Other liabilities 429 842 415 807 3 295 457 219 802 34 31 566 35 727 (12) (558 574) (520 117) 7 198 291 151 219 32
Total liabilities 707 514 669 373 6 489 936 411 474 19 36 726 41 003 (10) (351 623) (345 478) 2 882 553 776 372 14
RBB CIB WIMI Head Office, Treasury and other operations Total Rest of Africa
Rest of Africa per market segment2015
Rm20141
Rm C%3 FX%4Change
%2015
Rm20141
Rm C%3 FX%4Change
%2015
Rm2014
Rm C%3 FX%4Change
%2015
Rm20141
Rm C%3 FX%4Change
%2015
Rm2014
Rm C%3 FX%4Change
%
Statement of comprehensive incomeNet interest income 6 249 5 736 8 1 9 2 806 2 417 14 2 16 1 2 (50) — (50) 12 (35) <(100) 2 >100 9 068 8 120 11 1 12Non-interest income 2 620 2 157 20 1 21 1 998 1 771 13 0 13 331 268 13 11 24 (16) (21) (30) 6 (24) 4 933 4 175 17 1 18Total income 8 869 7 893 11 1 12 4 804 4 188 13 2 15 332 270 12 11 23 (4) (56) (93) 0 (93) 14 001 12 295 13 1 14Impairment losses on loans and advances (777) (641) 20 1 21 (437) (83) >100 18 >100 — — — — — — (1) — — (100) (1 214) (725) 65 2 67Operating expenses (6 143) (5 766) 7 (0) 7 (2 132) (1 935) 11 (1) 10 (225) (174) 9 20 29 1 72 (94) 0 (94) (8 498) (7 803) 9 0 9Other (112) (50) >100 0 >100 (25) (9) >100 — >100 (9) (13) (31) — (31) — — — — — (147) (72) >100 0 >100
Operating income before income tax 1 837 1 436 24 4 28 2 210 2 161 (1) 3 2 98 83 27 (9) 18 (3) 15 <(100) 1 <(100) 4 142 3 695 9 3 12Taxation expense (617) (456) 35 0 35 (550) (772) (29) — (29) (45) (34) 22 11 33 (98) (60) 66 (3) 63 (1 310) (1 322) (1) 0 (1)
Profit for the reporting period 1 220 980 18 6 24 1 660 1 389 14 6 20 53 49 32 (24) 8 (101) (45) 98 3 >100 2 832 2 373 14 5 19
Profit attributable to:Ordinary equity holders 895 718 18 6 24 1 465 1 217 14 6 20 49 51 11 (15) (4) (101) (22) >100 (1) >100 2 308 1 964 11 7 18Non-controlling interest – ordinary shares 325 262 17 7 24 195 172 16 5 13 4 (2) >(100) — >(100) — (23) (96) 0 (96) 524 409 22 6 28Non-controlling interest – preference shares — — — — — — — — — — — — — — — — — — — — — — — — —
1 220 980 18 6 24 1 660 1 389 14 6 20 53 49 32 (24) 8 (101) (45) 98 3 >100 2 832 2 373 14 5 19
Headline earnings 895 723 17 7 24 1 465 1 216 14 6 20 49 49 17 (17) 0 (101) (22) >100 (1) >100 2 308 1 965 12 5 17
Statement of financial positionLoans and advances to customers 45 213 35 812 14 12 26 43 531 33 291 11 20 31 — — — — — — — — — — 88 744 69 103 12 16 28Investment securities 19 084 15 957 3 17 20 2 4 (50) — (50) 295 81 >100 96 >100 3 908 4 343 (13) 3 (10) 23 289 20 385 0 14 14Other assets 54 030 43 000 8 18 26 37 840 27 531 15 22 37 2 458 1 092 85 40 >100 (19 040) (17 598) 8 0 8 75 288 54 025 12 27 39
Total assets 118 327 94 769 9 16 25 81 373 60 826 13 21 34 2 753 1 173 91 44 >100 (15 132) (13 255) 15 (1) 14 187 321 143 513 11 20 31
Deposits due to customers 68 736 57 206 6 14 20 63 611 47 569 13 21 34 — — — — — — 176 (100) 0 (100) 132 347 104 951 9 17 26Debt securities in issue 493 880 (51) 7 (44) — — — — — — — — — — — — — — — 493 880 (51) 7 (44)Other liabilities 33 820 25 476 13 20 33 12 515 7 446 43 25 68 1 670 695 92 48 >100 (17 441) (15 351) 14 (0) 14 30 564 18 266 27 40 67
Total liabilities 103 049 83 562 7 16 23 76 126 55 015 17 21 38 1 670 695 92 48 >100 (17 441) (15 175) 15 0 15 163 404 124 097 11 21 32
www.barclaysafrica.com Financial results for the reporting period ended 31 December 2015
61 www.barclaysafrica.com Financial results for the reporting period ended 31 December 2015
62
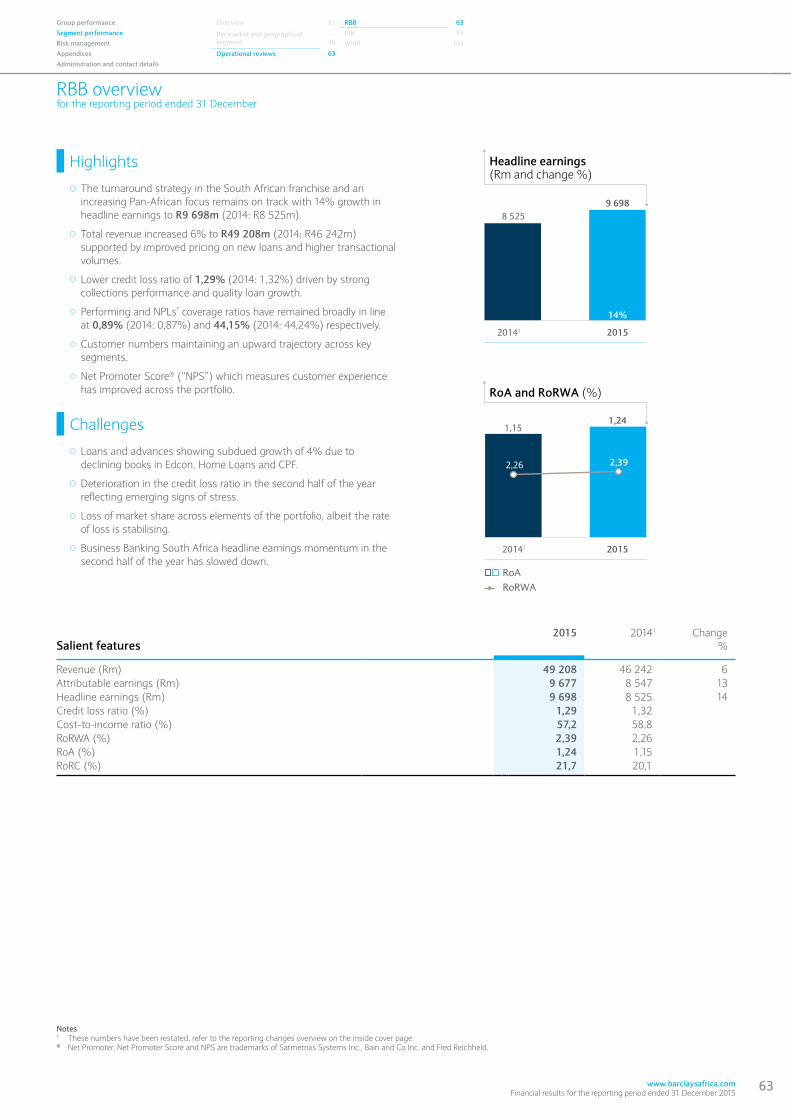
64 Barclays Africa Group Limited Financial results for the reporting period ended 31 December 2015
RBB overviewfor the reporting period ended 31 December
14%
9 6988 525
1,24
2,39
1,15
2,26
� � RoA RoRWA
RoA and RoRWA (%)
Headline earnings(Rm and change %)
20141 2015
20141 2015
Salient features2015 20141 Change
%
Revenue (Rm) 49 208 46 242 6Attributable earnings (Rm) 9 677 8 547 13Headline earnings (Rm) 9 698 8 525 14Credit loss ratio (%) 1,29 1,32Cost-to-income ratio (%) 57,2 58,8RoRWA (%) 2,39 2,26RoA (%) 1,24 1,15RoRC (%) 21,7 20,1
Notes 1 These numbers have been restated, refer to the reporting changes overview on the inside cover page.® Net Promoter, Net Promoter Score and NPS are trademarks of Satmetrixs Systems Inc., Bain and Co Inc. and Fred Reichheld.
www.barclaysafrica.com Financial results for the reporting period ended 31 December 2015
63
Highlights
The turnaround strategy in the South African franchise and an increasing Pan-African focus remains on track with 14% growth in headline earnings to R9 698m (2014: R8 525m).
Total revenue increased 6% to R49 208m (2014: R46 242m) supported by improved pricing on new loans and higher transactional volumes.
Lower credit loss ratio of 1,29% (2014: 1,32%) driven by strong collections performance and quality loan growth.
Performing and NPLs’ coverage ratios have remained broadly in line at 0,89% (2014: 0,87%) and 44,15% (2014: 44,24%) respectively.
Customer numbers maintaining an upward trajectory across key segments.
Net Promoter Score® (“NPS”) which measures customer experience has improved across the portfolio.
Challenges
Loans and advances showing subdued growth of 4% due to declining books in Edcon, Home Loans and CPF.
Deterioration in the credit loss ratio in the second half of the year reflecting emerging signs of stress.
Loss of market share across elements of the portfolio, albeit the rate of loss is stabilising.
Business Banking South Africa headline earnings momentum in the second half of the year has slowed down.
Group performance Overview 51 RBB 63Segment performance Per market and geographical
segment
56CIB 95
Risk management WIMI 103Appendices Operational reviews 63Administration and contact details
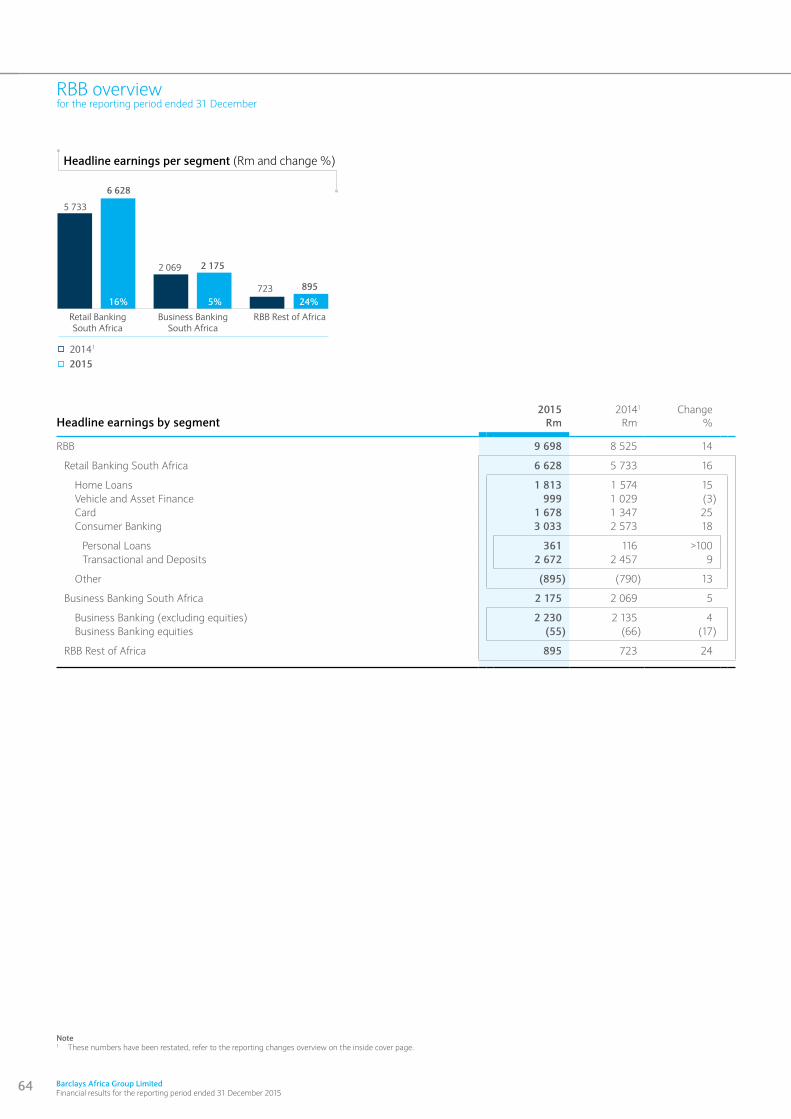
64 Barclays Africa Group Limited Financial results for the reporting period ended 31 December 2015
RBB overviewfor the reporting period ended 31 December
Headline earnings by segment2015
Rm20141
RmChange
%
RBB 9 698 8 525 14
Retail Banking South Africa 6 628 5 733 16
Home Loans 1 813 1 574 15 Vehicle and Asset Finance 999 1 029 (3) Card 1 678 1 347 25 Consumer Banking 3 033 2 573 18
Personal Loans 361 116 >100 Transactional and Deposits 2 672 2 457 9
Other (895) (790) 13
Business Banking South Africa 2 175 2 069 5
Business Banking (excluding equities) 2 230 2 135 4 Business Banking equities (55) (66) (17)
RBB Rest of Africa 895 723 24
6 628
2 069
5 733
723
Business BankingSouth Africa
Retail BankingSouth Africa
RBB Rest of Africa
16%
2 175
5% 24%
895
� 20141
� 2015
Headline earnings per segment (Rm and change %)
Note 1 These numbers have been restated, refer to the reporting changes overview on the inside cover page.
www.barclaysafrica.com Financial results for the reporting period ended 31 December 2015
63
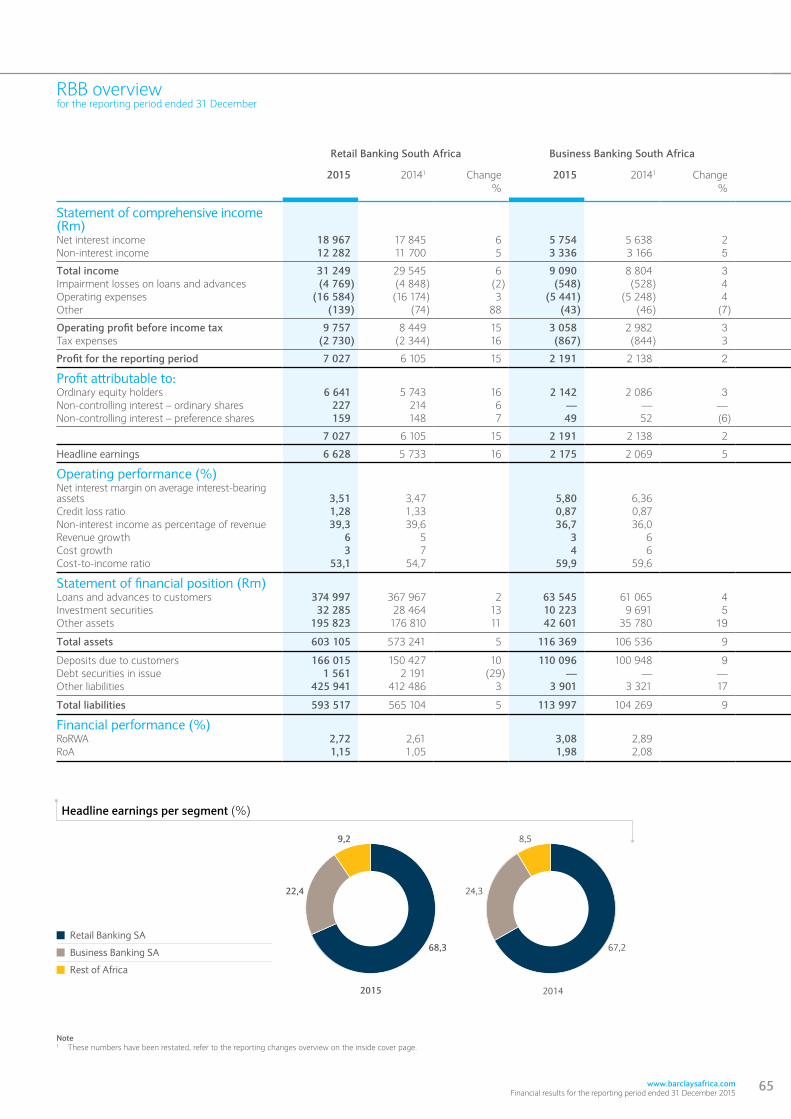
RBB overviewfor the reporting period ended 31 December
Note1 These numbers have been restated, refer to the reporting changes overview on the inside cover page.
Retail Banking South Africa Business Banking South Africa RBB Rest of Africa Total RBB
2015 20141 Change%
2015 20141 Change%
2015 20141 Change%
2015 20141 Change%
Statement of comprehensive income (Rm)Net interest income 18 967 17 845 6 5 754 5 638 2 6 249 5 736 9 30 970 29 219 6Non-interest income 12 282 11 700 5 3 336 3 166 5 2 620 2 157 21 18 238 17 023 7
Total income 31 249 29 545 6 9 090 8 804 3 8 869 7 893 12 49 208 46 242 6Impairment losses on loans and advances (4 769) (4 848) (2) (548) (528) 4 (777) (641) 21 (6 094) (6 017) 1Operating expenses (16 584) (16 174) 3 (5 441) (5 248) 4 (6 143) (5 766) 7 (28 168) (27 188) 4Other (139) (74) 88 (43) (46) (7) (112) (50) >100 (294) (170) 73
Operating profit before income tax 9 757 8 449 15 3 058 2 982 3 1 837 1 436 28 14 652 12 867 14Tax expenses (2 730) (2 344) 16 (867) (844) 3 (617) (456) 35 (4 214) (3 644) 16
Profit for the reporting period 7 027 6 105 15 2 191 2 138 2 1 220 980 24 10 438 9 223 13
Profit attributable to:Ordinary equity holders 6 641 5 743 16 2 142 2 086 3 895 718 24 9 677 8 547 13Non-controlling interest – ordinary shares 227 214 6 — — — 325 262 24 553 476 16Non-controlling interest – preference shares 159 148 7 49 52 (6) — — — 208 200 4
7 027 6 105 15 2 191 2 138 2 1 220 980 24 10 438 9 223 13
Headline earnings 6 628 5 733 16 2 175 2 069 5 895 723 24 9 698 8 525 14
Operating performance (%)Net interest margin on average interest-bearing assets 3,51 3,47 5,80 6,36 9,36 9,38 4,39 4,40Credit loss ratio 1,28 1,33 0,87 0,87 2,07 1,95 1,29 1,32Non-interest income as percentage of revenue 39,3 39,6 36,7 36,0 29,5 27,3 37,1 36,8Revenue growth 6 5 3 6 12 1 6 5Cost growth 3 7 4 6 7 10 4 7Cost-to-income ratio 53,1 54,7 59,9 59,6 69,3 73,1 57,2 58,8
Statement of financial position (Rm)Loans and advances to customers 374 997 367 967 2 63 545 61 065 4 45 213 35 812 26 483 755 464 844 4Investment securities 32 285 28 464 13 10 223 9 691 5 19 084 15 957 20 61 592 54 111 14Other assets 195 823 176 810 11 42 601 35 780 19 54 030 43 000 26 292 454 255 591 14
Total assets 603 105 573 241 5 116 369 106 536 9 118 327 94 769 25 837 801 774 546 8
Deposits due to customers 166 015 150 427 10 110 096 100 948 9 68 736 57 206 20 344 847 308 581 12Debt securities in issue 1 561 2 191 (29) — — — 493 880 (44) 2 054 3 071 (33)Other liabilities 425 941 412 486 3 3 901 3 321 17 33 820 25 476 33 463 662 441 283 5
Total liabilities 593 517 565 104 5 113 997 104 269 9 103 049 83 562 23 810 563 752 935 8
Financial performance (%)RoRWA 2,72 2,61 3,08 2,89 0,99 0,84 2,39 2,26RoA 1,15 1,05 1,98 2,08 0,94 0,75 1,24 1,15
67,2
24,3
8,5
68,3
22,4
9,2
2015 2014
Headline earnings per segment (%)
� Retail Banking SA
� Business Banking SA
� Rest of Africa
www.barclaysafrica.com Financial results for the reporting period ended 31 December 2015
65
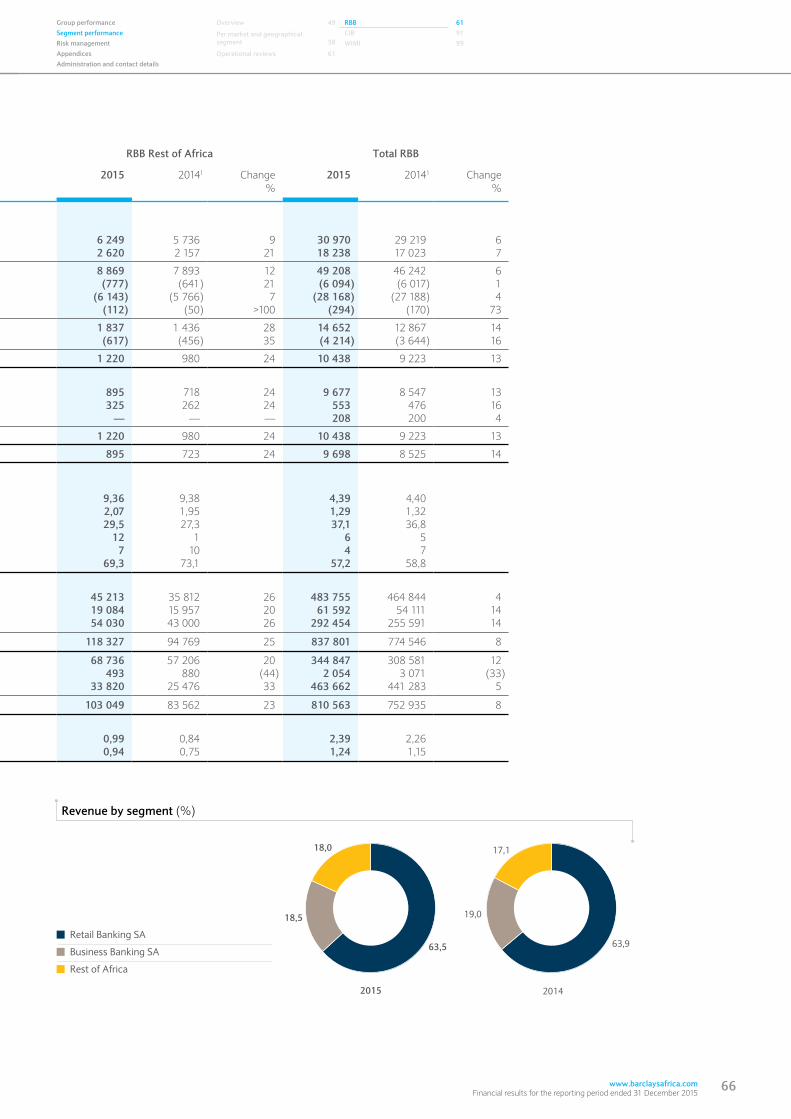
Group performance Overview 49 RBB 61Segment performance Per market and geographical
segment
58CIB 91
Risk management WIMI 99Appendices Operational reviews 61Administration and contact details
Retail Banking South Africa Business Banking South Africa RBB Rest of Africa Total RBB
2015 20141 Change%
2015 20141 Change%
2015 20141 Change%
2015 20141 Change%
Statement of comprehensive income (Rm)Net interest income 18 967 17 845 6 5 754 5 638 2 6 249 5 736 9 30 970 29 219 6Non-interest income 12 282 11 700 5 3 336 3 166 5 2 620 2 157 21 18 238 17 023 7
Total income 31 249 29 545 6 9 090 8 804 3 8 869 7 893 12 49 208 46 242 6Impairment losses on loans and advances (4 769) (4 848) (2) (548) (528) 4 (777) (641) 21 (6 094) (6 017) 1Operating expenses (16 584) (16 174) 3 (5 441) (5 248) 4 (6 143) (5 766) 7 (28 168) (27 188) 4Other (139) (74) 88 (43) (46) (7) (112) (50) >100 (294) (170) 73
Operating profit before income tax 9 757 8 449 15 3 058 2 982 3 1 837 1 436 28 14 652 12 867 14Tax expenses (2 730) (2 344) 16 (867) (844) 3 (617) (456) 35 (4 214) (3 644) 16
Profit for the reporting period 7 027 6 105 15 2 191 2 138 2 1 220 980 24 10 438 9 223 13
Profit attributable to:Ordinary equity holders 6 641 5 743 16 2 142 2 086 3 895 718 24 9 677 8 547 13Non-controlling interest – ordinary shares 227 214 6 — — — 325 262 24 553 476 16Non-controlling interest – preference shares 159 148 7 49 52 (6) — — — 208 200 4
7 027 6 105 15 2 191 2 138 2 1 220 980 24 10 438 9 223 13
Headline earnings 6 628 5 733 16 2 175 2 069 5 895 723 24 9 698 8 525 14
Operating performance (%)Net interest margin on average interest-bearing assets 3,51 3,47 5,80 6,36 9,36 9,38 4,39 4,40Credit loss ratio 1,28 1,33 0,87 0,87 2,07 1,95 1,29 1,32Non-interest income as percentage of revenue 39,3 39,6 36,7 36,0 29,5 27,3 37,1 36,8Revenue growth 6 5 3 6 12 1 6 5Cost growth 3 7 4 6 7 10 4 7Cost-to-income ratio 53,1 54,7 59,9 59,6 69,3 73,1 57,2 58,8
Statement of financial position (Rm)Loans and advances to customers 374 997 367 967 2 63 545 61 065 4 45 213 35 812 26 483 755 464 844 4Investment securities 32 285 28 464 13 10 223 9 691 5 19 084 15 957 20 61 592 54 111 14Other assets 195 823 176 810 11 42 601 35 780 19 54 030 43 000 26 292 454 255 591 14
Total assets 603 105 573 241 5 116 369 106 536 9 118 327 94 769 25 837 801 774 546 8
Deposits due to customers 166 015 150 427 10 110 096 100 948 9 68 736 57 206 20 344 847 308 581 12Debt securities in issue 1 561 2 191 (29) — — — 493 880 (44) 2 054 3 071 (33)Other liabilities 425 941 412 486 3 3 901 3 321 17 33 820 25 476 33 463 662 441 283 5
Total liabilities 593 517 565 104 5 113 997 104 269 9 103 049 83 562 23 810 563 752 935 8
Financial performance (%)RoRWA 2,72 2,61 3,08 2,89 0,99 0,84 2,39 2,26RoA 1,15 1,05 1,98 2,08 0,94 0,75 1,24 1,15
63,9
19,0
17,1
63,5
18,5
18,0
2015 2014
Revenue by segment (%)
� Retail Banking SA
� Business Banking SA
� Rest of Africa
www.barclaysafrica.com Financial results for the reporting period ended 31 December 2015
65 www.barclaysafrica.com Financial results for the reporting period ended 31 December 2015
66

68 Barclays Africa Group Limited Financial results for the reporting period ended 31 December 2015
www.barclaysafrica.com Financial results for the reporting period ended 31 December 2015
67
This page has been left blank intentionally

68 Barclays Africa Group Limited Financial results for the reporting period ended 31 December 2015
RBB – Retail Banking South Africafor the reporting period ended 31 December
Group performance Overview 51 RBB 63Segment performance Per market and geographical
segment
56CIB 95
Risk management WIMI 103Appendices Operational reviews 63Administration and contact details
www.barclaysafrica.com Financial results for the reporting period ended 31 December 2015
67
Salient features 2015 20141
Change%
Revenue (Rm) 31 249 29 545 6Attributable earnings (Rm) 6 641 5 743 16Headline earnings (Rm) 6 628 5 733 16Credit loss ratio (%) 1,28 1,33Cost-to-income ratio (%) 53,1 54,7RoRWA (%) 2,72 2,61RoA (%) 1,15 1,05
Note1 These numbers have been restated, refer to the reporting changes overview on the inside cover page.
Highlights
Strong 16% growth in headline earnings to R6 628m (2014: R5 733m) due to positive Jaws and lower credit impairments.
Net interest income increased 6% following strong deposit growth of 10% and improved pricing on new loans.
Non-interest income growth of 5% on the back of increased transactional activity.
Credit impairments declined by 2% to R4 769m (2014: R4 848m), with the credit loss ratio improving from 1,33% to 1,28%.
Low-cost growth of 3% attributable to benefits from the multi-channel programme and focused cost management.
The Edcon portfolio recorded headline earnings of R123m (2014: R9m loss), largely as a result of focused long-term credit risk management strategies.
Production levels continue to increase across key portfolios with the exception of VAF.
Growth in customer numbers to 8,8m (2014: 8,6m) through strong acquisition of new customers and reduced account closures.
Challenges
Subdued growth in loans and advances of 2% is impacted by lower balances in Edcon and high book run-off in Home Loans.
Non-interest revenue is impacted by the reduced interchange rate following regulatory changes and customer migration to digital channels.
Declining market share across the portfolio, in spite of growth in Home Loans and Personal Loans new business production.
5 733
6 628
16%
1,15
2,72
1,05
2,61
20141 2015
� � RoA RoRWA
RoA and RoRWA (%)
Headline earnings(Rm and change %)
20141 2015
www.barclaysafrica.com Financial results for the reporting period ended 31 December 2015
69
RBB – Retail Banking South Africafor the reporting period ended 31 December
Business profileRetail Banking South Africa offers a comprehensive suite of retail banking products and services to individuals and provides asset finance to commercial customers. It caters for the full spectrum of customers, from those needing basic banking services to those requiring sophisticated financial solutions. The focus is on providing a consistently superior experience across each of the channels, matched closely to the needs and expectations of each customer segment. Customers are served through an extensive branch and self-service terminal network, electronic and mobile channels, relationship managers as well as call centre agents.
Key business areas Home Loans – offers residential property-related finance solutions direct to customers through personalised services (includes Private and
Wealth coverage channels), and a range of electronic channels and intermediaries such as estate agents and originators.
Vehicle and Asset Finance – offers customised vehicle and movable asset finance products and services directly and via dealers through face-to-face engagements, call centre agents and digital channels to both individual and commercial asset finance customers with the latter including marine and aviation financing products, technology finance solutions as well as vehicle fleet management solutions, fleet card management and associated services. Joint ventures with Ford Financial Services and MAN Financial Services are an extension of VAF, with a focus on manufacturer-specific asset financing solutions and offerings. Alliance and preferred supplier agreements are in place with key groups in order to strengthen relationships with our partners and to optimise sales, through focused service offerings.
Card – offers credit cards and merchant acquiring solutions via a mix of Absa-branded and co-branded offerings including British Airways, Avios and Virgin Money. Included within this portfolio are strategic partnerships with Edcon (including the Namibian portfolio), which offers in-store cards and Woolworths Financial Services, which offers in-store store cards, credit cards, personal loans and short-term insurance products.
Personal Loans – offers unsecured instalment loans through face-to-face engagements, call centre agents as well as electronic and mobile channels..
Transactional and Deposits – offers a full range of transactional banking, savings and investment products, rewards programme and services through a variety of channels. These include physical branches, digital channels, ATMs, priority suites, call centres as well as through a third-party retailer PEP (part of the PEPKOR Group).
Other – includes distribution channel costs not recovered from product houses, change management programme and funding costs held centrally for Retail Banking South Africa.
The following organisational changes took place during the current reporting period impacting the reporting structure of Retail Banking South Africa and financial results for comparative period have been restated accordingly:
A material portion of operating expenses previously held in Other was allocated to relevant business units within Retail Banking South Africa.
Student loans included in loans and advances to customers were reallocated from Transactional and Deposits to Personal Loans.
Certain loan account portfolios were transferred from WIMI to Home Loans resulting in a reclassification of loans and advances to customers.
Comparative periods were not restated for the following change:
Sustainable Integrated Residential Developments (“SIDs”) – previously reported in the Retail Banking South Africa segment within Home Loans with a portfolio of R134m, were transferred to Business Banking South Africa.

70 Barclays Africa Group Limited Financial results for the reporting period ended 31 December 2015
RBB – Retail Banking South Africafor the reporting period ended 31 December
Group performance Overview 51 RBB 63Segment performance Per market and geographical
segment
56CIB 95
Risk management WIMI 103Appendices Operational reviews 63Administration and contact details
Home Loans Vehicle and Asset Finance Card1 Consumer Bank Personal Loans Transactional and Deposits Other Total Retail Banking South Africa
2015 20142 Change%
2015 20142 Change%
2015 20142 Change%
2015 20142 Change%
2015 20142 Change%
2015 20142 Change%
2015 20142 Change%
2015 20142 Change%
Statement of comprehensive income (Rm)Net interest income 4 328 4 300 1 2 959 2 901 2 5 090 4 852 5 6 589 5 807 13 1 953 1 746 12 4 636 4 061 14 1 (15) >100 18 967 17 845 6Non-interest income 353 358 (1) 792 736 8 3 313 3 041 9 7 169 6 881 4 322 329 (2) 6 847 6 552 5 655 684 (4) 12 282 11 700 5
Total income 4 681 4 658 0 3 751 3 637 3 8 403 7 893 6 13 758 12 688 8 2 275 2 075 10 11 483 10 613 8 656 669 (2) 31 249 29 545 6Impairment losses on loans and advances (689) (860) (20) (848) (797) 6 (2 344) (2 262) 4 (888) (933) (5) (805) (855) (6) (83) (78) 6 — 4 (100) (4 769) (4 848) (2)Operating expenses (1 455) (1 598) (9) (1 670) (1 573) 6 (3 267) (3 315) (1) (8 649) (8 180) 6 (968) (1 070) (10) (7 681) (7 110) 8 (1 543) (1 508) 2 (16 584) (16 174) 3Other (17) (14) 21 108 118 (8) (119) (104) 14 (7) (2) >100 (1) 11 <(100) (6) (13) (54) (104) (72) 43 (139) (74) 88
Operating income before income tax 2 520 2 186 15 1 341 1 385 (3) 2 673 2 212 21 4 214 3 573 18 501 161 >100 3 713 3 412 9 (991) (907) 31 9 757 8 449 15Tax expenses (707) (613) 15 (342) (350) (2) (758) (636) 19 (1 181) (1 000) 18 (140) (45) >100 (1 041) (955) 9 258 255 1 (2 730) (2 344) 16
Profit for the reporting period 1 813 1 573 15 999 1 035 (3) 1 915 1 576 22 3 033 2 573 18 361 116 >100 2 672 2 457 9 (733) (652) 12 7 027 6 105 15
Profit attributable to:Ordinary equity holders 1 813 1 573 15 999 1 035 (3) 1 678 1 346 25 3 033 2 573 18 361 116 >100 2 672 2 457 9 (882) (784) 13 6 641 5 743 16Non-controlling interest – ordinary shares — — — — — — 227 208 9 — — — — — — — — — — 6 (100) 227 214 6Non-controlling interest – preference shares — — — — — — 10 22 (55) — — — — — — — — — 149 126 18 159 148 7
1 813 1 573 15 999 1 035 (3) 1 915 1 576 22 3 033 2 573 18 361 116 >100 2 672 2 457 9 (733) (652) 12 7 027 6 105 15
Headline earnings 1 813 1 574 15 999 1 029 (3) 1 678 1 347 25 3 033 2 573 18 361 116 >100 2 672 2 457 9 (895) (790) 13 6 628 5 733 16
Operating performance (%) Credit loss ratio 0,30 0,37 0,98 1,01 6,07 6,19 5,26 5,56 5,64 6,06 3,18 2,93 n/a n/a 1,28 1,33Non-interest income as percentage of revenue 7,5 7,7 21,1 20,2 39,4 38,5 52,1 54,2 14,2 15,9 59,6 61,7 n/a n/a 39,3 39,6Revenue growth 0 5 3 9 6 3 8 4 10 7 8 4 n/a n/a 6 5Cost growth (9) — 6 6 (1) 9 6 — (10) 2 8 0 n/a n/a 3 7Cost-to-income ratio 31,1 34,3 44,5 43,2 38,9 42,0 62,9 64,5 42,5 51,6 66,9 67,0 n/a n/a 53,1 54,7
Statement of financial position (Rm)Loans and advances to customers 229 026 229 292 0 89 635 84 510 6 39 022 38 190 2 17 311 15 973 8 15 086 13 917 8 2 225 2 056 8 3 2 50 374 997 367 967 2Investment securities 12 076 9 766 24 4 569 3 473 32 2 024 1 619 25 914 757 21 769 544 41 145 213 (32) 12 702 12 849 (1) 32 285 28 464 13Other assets 7 083 6 393 11 5 183 4 217 23 11 632 11 014 6 166 582 148 733 12 363 313 16 166 219 148 420 12 5 342 6 453 (17) 195 823 176 810 11
Total assets 248 285 245 451 1 99 387 92 200 8 52 678 50 823 4 184 807 165 463 12 16 218 14 774 10 168 589 150 689 12 18 047 19 304 (7) 603 105 573 241 5
Deposits due to customers 2 113 2 021 5 206 163 26 1 998 1 928 4 161 662 146 227 11 12 10 20 161 650 146 217 11 36 88 (59) 166 015 150 427 10Debt securities in issue 1 561 2 191 (29) — — — — — — — — — — — — — — — — — — 1 561 2 191 (29)Other liabilities 242 555 239 533 1 97 059 90 125 8 47 757 46 476 3 20 106 16 654 21 15 845 14 649 8 4 261 2 005 >100 18 464 19 698 (6) 425 941 412 486 3
Total liabilities 246 229 243 745 1 97 265 90 288 8 49 755 48 404 3 181 768 162 881 12 15 857 14 659 8 165 911 148 222 12 18 500 19 786 (6) 593 517 565 104 5
Financial performance (%)RoRWA 2,49 2,25 1,48 1,73 2,56 2,31 8,54 8,82 1,97 0,73 15,56 18,56 n/a n/a 2,72 2,61RoA 0,73 0,64 1,05 1,20 3,20 2,84 1,83 1,74 2,36 0,77 1,78 1,84 n/a n/a 1,15 1,05
Headline earnings (%)
� Home Loans
� Vehicle and Asset Finance
� Card1
� Personal Loans
� Transactional and Deposits
� Other
18,0
23,5
27,5
2,0
42,9
(13,9)
15,1
25,3
27,4
5,4
40,3
(13,5)
201422015
Notes1 Includes WFS and the Edcon portfolio.2 These numbers have been restated, refer to the reporting changes overview on the inside cover page.
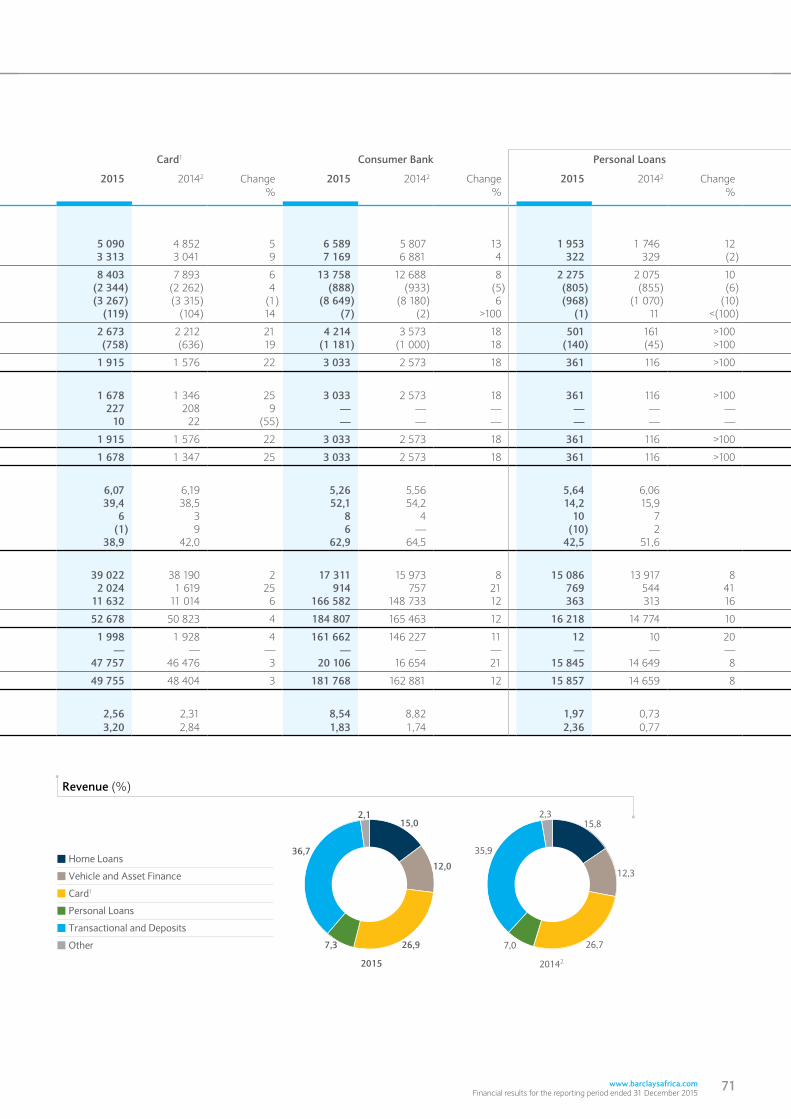
Home Loans Vehicle and Asset Finance Card1 Consumer Bank Personal Loans Transactional and Deposits Other Total Retail Banking South Africa
2015 20142 Change%
2015 20142 Change%
2015 20142 Change%
2015 20142 Change%
2015 20142 Change%
2015 20142 Change%
2015 20142 Change%
2015 20142 Change%
Statement of comprehensive income (Rm)Net interest income 4 328 4 300 1 2 959 2 901 2 5 090 4 852 5 6 589 5 807 13 1 953 1 746 12 4 636 4 061 14 1 (15) >100 18 967 17 845 6Non-interest income 353 358 (1) 792 736 8 3 313 3 041 9 7 169 6 881 4 322 329 (2) 6 847 6 552 5 655 684 (4) 12 282 11 700 5
Total income 4 681 4 658 0 3 751 3 637 3 8 403 7 893 6 13 758 12 688 8 2 275 2 075 10 11 483 10 613 8 656 669 (2) 31 249 29 545 6Impairment losses on loans and advances (689) (860) (20) (848) (797) 6 (2 344) (2 262) 4 (888) (933) (5) (805) (855) (6) (83) (78) 6 — 4 (100) (4 769) (4 848) (2)Operating expenses (1 455) (1 598) (9) (1 670) (1 573) 6 (3 267) (3 315) (1) (8 649) (8 180) 6 (968) (1 070) (10) (7 681) (7 110) 8 (1 543) (1 508) 2 (16 584) (16 174) 3Other (17) (14) 21 108 118 (8) (119) (104) 14 (7) (2) >100 (1) 11 <(100) (6) (13) (54) (104) (72) 43 (139) (74) 88
Operating income before income tax 2 520 2 186 15 1 341 1 385 (3) 2 673 2 212 21 4 214 3 573 18 501 161 >100 3 713 3 412 9 (991) (907) 31 9 757 8 449 15Tax expenses (707) (613) 15 (342) (350) (2) (758) (636) 19 (1 181) (1 000) 18 (140) (45) >100 (1 041) (955) 9 258 255 1 (2 730) (2 344) 16
Profit for the reporting period 1 813 1 573 15 999 1 035 (3) 1 915 1 576 22 3 033 2 573 18 361 116 >100 2 672 2 457 9 (733) (652) 12 7 027 6 105 15
Profit attributable to:Ordinary equity holders 1 813 1 573 15 999 1 035 (3) 1 678 1 346 25 3 033 2 573 18 361 116 >100 2 672 2 457 9 (882) (784) 13 6 641 5 743 16Non-controlling interest – ordinary shares — — — — — — 227 208 9 — — — — — — — — — — 6 (100) 227 214 6Non-controlling interest – preference shares — — — — — — 10 22 (55) — — — — — — — — — 149 126 18 159 148 7
1 813 1 573 15 999 1 035 (3) 1 915 1 576 22 3 033 2 573 18 361 116 >100 2 672 2 457 9 (733) (652) 12 7 027 6 105 15
Headline earnings 1 813 1 574 15 999 1 029 (3) 1 678 1 347 25 3 033 2 573 18 361 116 >100 2 672 2 457 9 (895) (790) 13 6 628 5 733 16
Operating performance (%) Credit loss ratio 0,30 0,37 0,98 1,01 6,07 6,19 5,26 5,56 5,64 6,06 3,18 2,93 n/a n/a 1,28 1,33Non-interest income as percentage of revenue 7,5 7,7 21,1 20,2 39,4 38,5 52,1 54,2 14,2 15,9 59,6 61,7 n/a n/a 39,3 39,6Revenue growth 0 5 3 9 6 3 8 4 10 7 8 4 n/a n/a 6 5Cost growth (9) — 6 6 (1) 9 6 — (10) 2 8 0 n/a n/a 3 7Cost-to-income ratio 31,1 34,3 44,5 43,2 38,9 42,0 62,9 64,5 42,5 51,6 66,9 67,0 n/a n/a 53,1 54,7
Statement of financial position (Rm)Loans and advances to customers 229 026 229 292 0 89 635 84 510 6 39 022 38 190 2 17 311 15 973 8 15 086 13 917 8 2 225 2 056 8 3 2 50 374 997 367 967 2Investment securities 12 076 9 766 24 4 569 3 473 32 2 024 1 619 25 914 757 21 769 544 41 145 213 (32) 12 702 12 849 (1) 32 285 28 464 13Other assets 7 083 6 393 11 5 183 4 217 23 11 632 11 014 6 166 582 148 733 12 363 313 16 166 219 148 420 12 5 342 6 453 (17) 195 823 176 810 11
Total assets 248 285 245 451 1 99 387 92 200 8 52 678 50 823 4 184 807 165 463 12 16 218 14 774 10 168 589 150 689 12 18 047 19 304 (7) 603 105 573 241 5
Deposits due to customers 2 113 2 021 5 206 163 26 1 998 1 928 4 161 662 146 227 11 12 10 20 161 650 146 217 11 36 88 (59) 166 015 150 427 10Debt securities in issue 1 561 2 191 (29) — — — — — — — — — — — — — — — — — — 1 561 2 191 (29)Other liabilities 242 555 239 533 1 97 059 90 125 8 47 757 46 476 3 20 106 16 654 21 15 845 14 649 8 4 261 2 005 >100 18 464 19 698 (6) 425 941 412 486 3
Total liabilities 246 229 243 745 1 97 265 90 288 8 49 755 48 404 3 181 768 162 881 12 15 857 14 659 8 165 911 148 222 12 18 500 19 786 (6) 593 517 565 104 5
Financial performance (%)RoRWA 2,49 2,25 1,48 1,73 2,56 2,31 8,54 8,82 1,97 0,73 15,56 18,56 n/a n/a 2,72 2,61RoA 0,73 0,64 1,05 1,20 3,20 2,84 1,83 1,74 2,36 0,77 1,78 1,84 n/a n/a 1,15 1,05
2,3
7,0
12,3
26,7
35,9
15,815,0
12,0
26,97,3
36,7
2,1
Revenue (%)
� Home Loans
� Vehicle and Asset Finance
� Card1
� Personal Loans
� Transactional and Deposits
� Other
201422015
www.barclaysafrica.com Financial results for the reporting period ended 31 December 2015
71

Home Loans Vehicle and Asset Finance Card1 Consumer Bank Personal Loans Transactional and Deposits Other Total Retail Banking South Africa
2015 20142 Change%
2015 20142 Change%
2015 20142 Change%
2015 20142 Change%
2015 20142 Change%
2015 20142 Change%
2015 20142 Change%
2015 20142 Change%
Statement of comprehensive income (Rm)Net interest income 4 328 4 300 1 2 959 2 901 2 5 090 4 852 5 6 589 5 807 13 1 953 1 746 12 4 636 4 061 14 1 (15) >100 18 967 17 845 6Non-interest income 353 358 (1) 792 736 8 3 313 3 041 9 7 169 6 881 4 322 329 (2) 6 847 6 552 5 655 684 (4) 12 282 11 700 5
Total income 4 681 4 658 0 3 751 3 637 3 8 403 7 893 6 13 758 12 688 8 2 275 2 075 10 11 483 10 613 8 656 669 (2) 31 249 29 545 6Impairment losses on loans and advances (689) (860) (20) (848) (797) 6 (2 344) (2 262) 4 (888) (933) (5) (805) (855) (6) (83) (78) 6 — 4 (100) (4 769) (4 848) (2)Operating expenses (1 455) (1 598) (9) (1 670) (1 573) 6 (3 267) (3 315) (1) (8 649) (8 180) 6 (968) (1 070) (10) (7 681) (7 110) 8 (1 543) (1 508) 2 (16 584) (16 174) 3Other (17) (14) 21 108 118 (8) (119) (104) 14 (7) (2) >100 (1) 11 <(100) (6) (13) (54) (104) (72) 43 (139) (74) 88
Operating income before income tax 2 520 2 186 15 1 341 1 385 (3) 2 673 2 212 21 4 214 3 573 18 501 161 >100 3 713 3 412 9 (991) (907) 31 9 757 8 449 15Tax expenses (707) (613) 15 (342) (350) (2) (758) (636) 19 (1 181) (1 000) 18 (140) (45) >100 (1 041) (955) 9 258 255 1 (2 730) (2 344) 16
Profit for the reporting period 1 813 1 573 15 999 1 035 (3) 1 915 1 576 22 3 033 2 573 18 361 116 >100 2 672 2 457 9 (733) (652) 12 7 027 6 105 15
Profit attributable to:Ordinary equity holders 1 813 1 573 15 999 1 035 (3) 1 678 1 346 25 3 033 2 573 18 361 116 >100 2 672 2 457 9 (882) (784) 13 6 641 5 743 16Non-controlling interest – ordinary shares — — — — — — 227 208 9 — — — — — — — — — — 6 (100) 227 214 6Non-controlling interest – preference shares — — — — — — 10 22 (55) — — — — — — — — — 149 126 18 159 148 7
1 813 1 573 15 999 1 035 (3) 1 915 1 576 22 3 033 2 573 18 361 116 >100 2 672 2 457 9 (733) (652) 12 7 027 6 105 15
Headline earnings 1 813 1 574 15 999 1 029 (3) 1 678 1 347 25 3 033 2 573 18 361 116 >100 2 672 2 457 9 (895) (790) 13 6 628 5 733 16
Operating performance (%) Credit loss ratio 0,30 0,37 0,98 1,01 6,07 6,19 5,26 5,56 5,64 6,06 3,18 2,93 n/a n/a 1,28 1,33Non-interest income as percentage of revenue 7,5 7,7 21,1 20,2 39,4 38,5 52,1 54,2 14,2 15,9 59,6 61,7 n/a n/a 39,3 39,6Revenue growth 0 5 3 9 6 3 8 4 10 7 8 4 n/a n/a 6 5Cost growth (9) — 6 6 (1) 9 6 — (10) 2 8 0 n/a n/a 3 7Cost-to-income ratio 31,1 34,3 44,5 43,2 38,9 42,0 62,9 64,5 42,5 51,6 66,9 67,0 n/a n/a 53,1 54,7
Statement of financial position (Rm)Loans and advances to customers 229 026 229 292 0 89 635 84 510 6 39 022 38 190 2 17 311 15 973 8 15 086 13 917 8 2 225 2 056 8 3 2 50 374 997 367 967 2Investment securities 12 076 9 766 24 4 569 3 473 32 2 024 1 619 25 914 757 21 769 544 41 145 213 (32) 12 702 12 849 (1) 32 285 28 464 13Other assets 7 083 6 393 11 5 183 4 217 23 11 632 11 014 6 166 582 148 733 12 363 313 16 166 219 148 420 12 5 342 6 453 (17) 195 823 176 810 11
Total assets 248 285 245 451 1 99 387 92 200 8 52 678 50 823 4 184 807 165 463 12 16 218 14 774 10 168 589 150 689 12 18 047 19 304 (7) 603 105 573 241 5
Deposits due to customers 2 113 2 021 5 206 163 26 1 998 1 928 4 161 662 146 227 11 12 10 20 161 650 146 217 11 36 88 (59) 166 015 150 427 10Debt securities in issue 1 561 2 191 (29) — — — — — — — — — — — — — — — — — — 1 561 2 191 (29)Other liabilities 242 555 239 533 1 97 059 90 125 8 47 757 46 476 3 20 106 16 654 21 15 845 14 649 8 4 261 2 005 >100 18 464 19 698 (6) 425 941 412 486 3
Total liabilities 246 229 243 745 1 97 265 90 288 8 49 755 48 404 3 181 768 162 881 12 15 857 14 659 8 165 911 148 222 12 18 500 19 786 (6) 593 517 565 104 5
Financial performance (%)RoRWA 2,49 2,25 1,48 1,73 2,56 2,31 8,54 8,82 1,97 0,73 15,56 18,56 n/a n/a 2,72 2,61RoA 0,73 0,64 1,05 1,20 3,20 2,84 1,83 1,74 2,36 0,77 1,78 1,84 n/a n/a 1,15 1,05
www.barclaysafrica.com Financial results for the reporting period ended 31 December 2015
72
www.barclaysafrica.com Financial results for the reporting period ended 31 December 2015
73
RBB – Retail Banking South Africafor the reporting period ended 31 December
Financial performanceHeadline earnings increased 16% to R6 628m (2014: R5 733m) due to 6% revenue growth and low operating expenses growth of 3% reflecting a well-managed cost base. This contributed to positive Jaws of 3,23% and pre-provision profit growth of 10% to R14 666m (2014: R13 372m). This performance was enhanced by 2% lower credit impairments resulting from continued improvement in the quality of the book and a strong collections performance.
Solid revenue growth of 6% to R31 249m (2014: R29 545m) was achieved in a challenging macroeconomic environment. Net interest income growth of 6% was mainly driven by strong deposit balances growth of 10%. Net interest margin improved to 3,51% (2014: 3,47%) reflecting deposits margin expansion, improved pricing on new advances and rolling-off of low margin business, higher average prime interest rates offset by increased funding costs and competitive pricing pressure in VAF. Non-interest income growth of 5% was largely due to increased transactional activity in spite of a reduction in interchange rates following regulatory changes which reduced income by R300m, strong growth in rewards paid to customers, the sale of more affordable products and the continued migration to bundled products and digital channels.
The credit loss ratio improved to 1,28% (2014: 1,33%) reflecting a 2% decline in credit impairments to R4 769m (2014: R4 848m), mainly due to higher recoveries, deployment of credit strategies designed to drive reductions in high-risk balances and support profitable balance growth where appropriate and improved collections performance across the portfolio, partly offset by an increase in VAF credit impairments. While performance is in line with expectations, emerging financial stress has been observed in delinquency cycles including an increase in debt counselling inflows across the portfolio.
Low operating expenses growth of 3% reflects the operational efficiencies resulting from the multichannel programme and continued focus on discretionary cost management. The cost-to-income ratio has improved to 53,1% (2014: 54,7%).
Loans and advances to customers increased by 2% to R375bn (2014: R368bn), largely due to a 6% increase in VAF driven by strong growth in the joint ventures and alliances portfolios, a 6% and 7% increase in Absa Card and WFS balances respectively and an 8% growth in Personal Loans. Growth was negatively impacted by Home Loans, with new business being marginally lower than book run-off and Edcon, where balances declined by 10%.
Deposits due to customers increased by 10% to R166bn (2014: R150bn), largely due to the continued growth in the Depositor Plus investment product and fixed deposits.
Home Loans headline earnings continued to improve with strong growth of 15% to R1 813m (2014: R1 574m), primarily driven by a 20% decline in credit impairments as a result of increased collections and recoveries. Revenue has remained flat, while operating expenses decreased by 9% from lower processing and distribution channel costs.
VAF’s headline earnings decreased by 3% to R999m (2014: R1 029m), as a 6% increase in the credit impairments and 6% operating expense growth offset satisfactory revenue growth of 3%. Operating expense growth was largely driven by the investment in automation in the operational environment with normal business cost remaining well controlled.
Card’s headline earnings growth of 25% to R1 678m (2014: R1 347m) was largely attributable to strong growth in transactional volumes, together with a solid performance in new balances booked in the Absa Card and WFS portfolios which increased by 6% and 7% respectively. The strong volume growth offset a decline in interchange rates as a result of regulatory changes. Continued positive momentum in the Edcon portfolio, particularly in the second half of 2015, as a result of focused credit risk management strategies resulted in a significant improvement in headline earnings to R123m (2014: R9m loss) with the credit loss ratio declining to 10,18% (2014: 11,50%).
Personal Loans reflected exceptional headline earnings growth to R361m (2014: R116m), mainly due to revenue growth of 10% driven by increased new business flow coupled with continued roll-off of lower margin business and a decline of 6% in credit impairments on the back of a strong collections performance. Operating expenses have decreased by 10% as a result of continued cost containment efforts.
Transactional and Deposits headline earnings increased 9% to R2 672m (2014: R2 457m), with revenue and operating expenses both growing by 8%, maintaining a cost-to-income ratio of 66,9% (2014: 67,0%). Strong growth of 14% in net interest income was driven by 11% increase in deposit balances. Operating expenses growth of 8% was driven by investment in people and technology along with the increase in cash-related transactions which generates a good proportion of the revenue.
Operating environmentThe following factors had a key influence on Retail Banking South Africa:
Consumer finances remained under pressure as growth in employment, real household disposable income and consumer expenditure declined further. Consumer credit-risk profiles did not show any significant improvement, impacting access to credit.
Consumer price inflation remained well within the inflation target range, but started to edge up in late 2015 as a result of the impact of the drought on food prices. Interest rates were hiked in July and November by 25bps, impacting the cost and affordability of credit.
Growth in household credit extension remained relatively low at 4,6% across the secured and unsecured advances.
Total new vehicle sales volumes declined by 4,1%.
Consumers remained heavily indebted with the ratio of household debt to disposable income above 78%.
Consumer confidence deteriorated further to its lowest level in many years.
Increase in income tax rates has further eroded disposable income levels, particularly in the affluent customer segments.
The outlook for consumers is increasing levels of financial strain in 2016 in view of continued low economic and employment growth, weakening exchange rates, rising inflation and upward pressure on interest rates.
Continued challenges from the underperformance of utilities, particularly relating to electricity and water supply, are likely to increase pressure on consumers, while leading to direct and indirect cost increases.
74 Barclays Africa Group Limited Financial results for the reporting period ended 31 December 2015
RBB – Retail Banking South Africafor the reporting period ended 31 December
Group performance Overview 51 RBB 63Segment performance Per market and geographical
segment
56CIB 95
Risk management WIMI 103Appendices Operational reviews 63Administration and contact details
Business performance The sustained improvement in the financial performance was underpinned by planned investment initiatives and focused execution against strategic imperatives resulting in the delivery of new and innovative propositions like free Wi-Fi in certain branches and Private Banking for Professionals.
The ongoing investment in digitisation, innovation, developing our people and reinvigorating the branch and ATM networks contributed to the steady rise of new business volumes across most products in a challenging marketplace. The risk profile of new business remains well within business risk appetite and is appropriately priced.
Impairment levels have improved on the back of strong risk management initiatives including the introduction of new scorecards, refinement of pricing and profitability models as well as the continued enhancement of collections and recovery processes.
Overall customer numbers increased to 8,8m (2014: 8,6m) with growth in key segments indicating that the turnaround strategy is yielding both retention and new customer acquisition benefits.
Strong cost management discipline has enabled continued investment in targeted marketing initiatives as well as a multi-year channel transformation programme spanning all key customer-facing channels. Enhanced functionality ATMs and the prevalence of online capable devices, provides the opportunity for the banking sector to simultaneously improve the customer experience and utilise bank resources more efficiently. The programme has focused on positioning the organisation to be the future of banking on the continent and seeks to establish the industry standard by offering new ways to bank that combine great technologies and physical locations with the best face-to-face service. The programme focused on improving the customer experience through investing in functionalities to offer alternative and improved ways for the customer to interact with the bank. Cost management remains a key focus to ensure benefits resulting from the customer adoption of more convenient banking channels are realised.
The channel transformation programme has continued to deliver capabilities that will enable the bank to deliver improved service to our customers, including:
Functionalities to allow customers to perform transactions without being required to visit a branch, including self-registration for customers on the banking app and ensuring that standalone home loan and vehicle finance customers are able to register on internet banking.
Additional functionalities on cash-accepting devices (“CAD(s)”) to improve the customer experience. Customers are increasingly opting to deposit cash through these devices which now make up 50% of deposit volumes.
New branch operating models being tested, including layout, digital in-branch capabilities, multi-skilled staff roles and a customer service training programme.
Refurbishing and repositioning of physical distribution outlets (branches, ATMs and CADs) to improve the customer experience, with 30% of the branch network having been improved. The Absa ATM channel was voted the number one channel in South Africa (SACSI).
Ongoing branch process improvements to enable a quicker and more efficient experience for customers and staff.
Free public Wi-Fi has been deployed at select branches.
Home LoansHeadline earnings increased 15% to R1 813m (2014: R1 574m) on the back of a 20% decrease in credit impairments and 9% decrease in operating expenses, while revenue remained flat.
Net interest income increased by 1% due to an improved yield on the existing book as well as increased contribution of performing loans as a percentage of total book from 95,5% to 96,0%, coupled with the rolling-off of lower margin business. New business pricing improved from 50 bps to 44 bps below prime, while the overall margin increased from 1,82% to 1,85%.
Credit impairments decreased by 20% to R689m (2014: R860m) in spite of a deteriorating economic environment. The decline was supported through increased collection activities and recovery strategies implemented to improve the delinquency construct. This translated into NPLs reducing from R10,5bn to R9,3bn and a continued improvement in the credit loss ratio to 0,30% (2014: 0,37%). Properties in possession remained unchanged at R37m.
Operating expenses remained well controlled with a 9% decrease to R1 455m (2014: R1 598m) largely attributable to lower processing and distribution channel costs. The cost-to-income ratio improved to 31,1% (2014: 34,3%).
Loans and advances to customers decreased marginally by 0,1%, the lowest decline in five years, resulting in a loss of stock market share from 26,4% to 25,5% (as reported in the BA 900). Registrations increased 13,3% (2014: -3,2%), the highest in four years, but still marginally lower than book run-off. Market share of new business flow increased to 20,0% (2014: 19,3%) per Lightstone, while loans not taken up decreased from 16,2% to 14,5%, which resulted in work in progress increasing to a seven-year high. Risk appetite was reviewed and expansions were implemented in higher loan-to-value and lower borrower risk segments, resulting in new business loan-to-values increasing from 75,8% to 77,5%. Registration distribution of lower loan-to-values decreased from 72,9% to 62,1%, with the risk profile of customers remaining unchanged at very low risk. Higher loan to values distribution increased from 27,1% to 37,9%, with an improvement in the risk profile of the very low-risk customer from 71% to 75%, per Lightstone. Home Loans continues to focus on responsible lending and originating good quality loans.
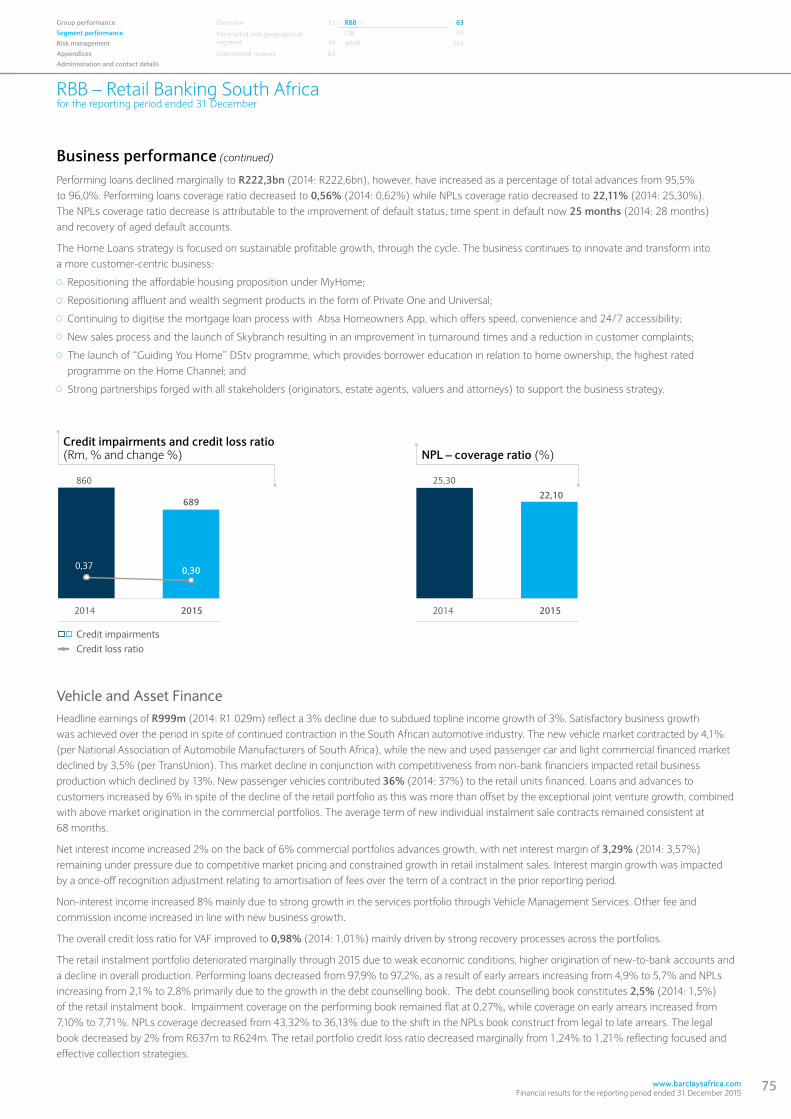
RBB – Retail Banking South Africafor the reporting period ended 31 December
Group performance Overview 51 RBB 63Segment performance Per market and geographical
segment
56CIB 95
Risk management WIMI 103Appendices Operational reviews 63Administration and contact details
Business performance (continued)
Performing loans declined marginally to R222,3bn (2014: R222,6bn), however, have increased as a percentage of total advances from 95,5% to 96,0%. Performing loans coverage ratio decreased to 0,56% (2014: 0,62%) while NPLs coverage ratio decreased to 22,11% (2014: 25,30%). The NPLs coverage ratio decrease is attributable to the improvement of default status, time spent in default now 25 months (2014: 28 months) and recovery of aged default accounts.
The Home Loans strategy is focused on sustainable profitable growth, through the cycle. The business continues to innovate and transform into a more customer-centric business:
Repositioning the affordable housing proposition under MyHome;
Repositioning affluent and wealth segment products in the form of Private One and Universal;
Continuing to digitise the mortgage loan process with Absa Homeowners App, which offers speed, convenience and 24/7 accessibility;
New sales process and the launch of Skybranch resulting in an improvement in turnaround times and a reduction in customer complaints;
The launch of “Guiding You Home” DStv programme, which provides borrower education in relation to home ownership, the highest rated programme on the Home Channel; and
Strong partnerships forged with all stakeholders (originators, estate agents, valuers and attorneys) to support the business strategy.
Vehicle and Asset FinanceHeadline earnings of R999m (2014: R1 029m) reflect a 3% decline due to subdued topline income growth of 3%. Satisfactory business growth was achieved over the period in spite of continued contraction in the South African automotive industry. The new vehicle market contracted by 4,1% (per National Association of Automobile Manufacturers of South Africa), while the new and used passenger car and light commercial financed market declined by 3,5% (per TransUnion). This market decline in conjunction with competitiveness from non-bank financiers impacted retail business production which declined by 13%. New passenger vehicles contributed 36% (2014: 37%) to the retail units financed. Loans and advances to customers increased by 6% in spite of the decline of the retail portfolio as this was more than offset by the exceptional joint venture growth, combined with above market origination in the commercial portfolios. The average term of new individual instalment sale contracts remained consistent at 68 months.
Net interest income increased 2% on the back of 6% commercial portfolios advances growth, with net interest margin of 3,29% (2014: 3,57%) remaining under pressure due to competitive market pricing and constrained growth in retail instalment sales. Interest margin growth was impacted by a once-off recognition adjustment relating to amortisation of fees over the term of a contract in the prior reporting period.
Non-interest income increased 8% mainly due to strong growth in the services portfolio through Vehicle Management Services. Other fee and commission income increased in line with new business growth.
The overall credit loss ratio for VAF improved to 0,98% (2014: 1,01%) mainly driven by strong recovery processes across the portfolios.
The retail instalment portfolio deteriorated marginally through 2015 due to weak economic conditions, higher origination of new-to-bank accounts and a decline in overall production. Performing loans decreased from 97,9% to 97,2%, as a result of early arrears increasing from 4,9% to 5,7% and NPLs increasing from 2,1% to 2,8% primarily due to the growth in the debt counselling book. The debt counselling book constitutes 2,5% (2014: 1,5%) of the retail instalment book. Impairment coverage on the performing book remained flat at 0,27%, while coverage on early arrears increased from 7,10% to 7,71%. NPLs coverage decreased from 43,32% to 36,13% due to the shift in the NPLs book construct from legal to late arrears. The legal book decreased by 2% from R637m to R624m. The retail portfolio credit loss ratio decreased marginally from 1,24% to 1,21% reflecting focused and effective collection strategies.
www.barclaysafrica.com Financial results for the reporting period ended 31 December 2015
75
689
0,30
22,10860
0,37
25,30
� � Credit impairments Credit loss ratio
Credit impairments and credit loss ratio(Rm, % and change %)
2014 2015
NPL – coverage ratio (%)
2014 2015
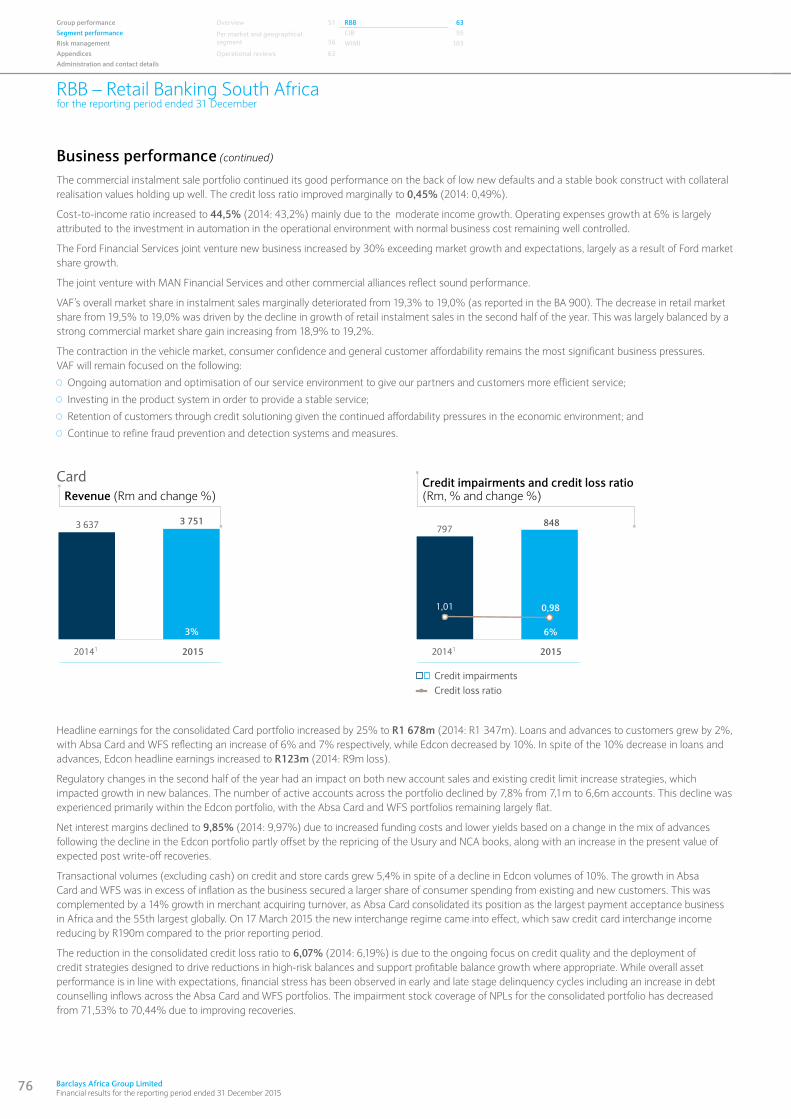
76 Barclays Africa Group Limited Financial results for the reporting period ended 31 December 2015
RBB – Retail Banking South Africafor the reporting period ended 31 December
Group performance Overview 51 RBB 63Segment performance Per market and geographical
segment
56CIB 95
Risk management WIMI 103Appendices Operational reviews 63Administration and contact details
The commercial instalment sale portfolio continued its good performance on the back of low new defaults and a stable book construct with collateral realisation values holding up well. The credit loss ratio improved marginally to 0,45% (2014: 0,49%).
Cost-to-income ratio increased to 44,5% (2014: 43,2%) mainly due to the moderate income growth. Operating expenses growth at 6% is largely attributed to the investment in automation in the operational environment with normal business cost remaining well controlled.
The Ford Financial Services joint venture new business increased by 30% exceeding market growth and expectations, largely as a result of Ford market share growth.
The joint venture with MAN Financial Services and other commercial alliances reflect sound performance.
VAF’s overall market share in instalment sales marginally deteriorated from 19,3% to 19,0% (as reported in the BA 900). The decrease in retail market share from 19,5% to 19,0% was driven by the decline in growth of retail instalment sales in the second half of the year. This was largely balanced by a strong commercial market share gain increasing from 18,9% to 19,2%.
The contraction in the vehicle market, consumer confidence and general customer affordability remains the most significant business pressures. VAF will remain focused on the following:
Ongoing automation and optimisation of our service environment to give our partners and customers more efficient service;
Investing in the product system in order to provide a stable service;
Retention of customers through credit solutioning given the continued affordability pressures in the economic environment; and
Continue to refine fraud prevention and detection systems and measures.
Card
Headline earnings for the consolidated Card portfolio increased by 25% to R1 678m (2014: R1 347m). Loans and advances to customers grew by 2%, with Absa Card and WFS reflecting an increase of 6% and 7% respectively, while Edcon decreased by 10%. In spite of the 10% decrease in loans and advances, Edcon headline earnings increased to R123m (2014: R9m loss).
Regulatory changes in the second half of the year had an impact on both new account sales and existing credit limit increase strategies, which impacted growth in new balances. The number of active accounts across the portfolio declined by 7,8% from 7,1m to 6,6m accounts. This decline was experienced primarily within the Edcon portfolio, with the Absa Card and WFS portfolios remaining largely flat.
Net interest margins declined to 9,85% (2014: 9,97%) due to increased funding costs and lower yields based on a change in the mix of advances following the decline in the Edcon portfolio partly offset by the repricing of the Usury and NCA books, along with an increase in the present value of expected post write-off recoveries.
Transactional volumes (excluding cash) on credit and store cards grew 5,4% in spite of a decline in Edcon volumes of 10%. The growth in Absa Card and WFS was in excess of inflation as the business secured a larger share of consumer spending from existing and new customers. This was complemented by a 14% growth in merchant acquiring turnover, as Absa Card consolidated its position as the largest payment acceptance business in Africa and the 55th largest globally. On 17 March 2015 the new interchange regime came into effect, which saw credit card interchange income reducing by R190m compared to the prior reporting period.
The reduction in the consolidated credit loss ratio to 6,07% (2014: 6,19%) is due to the ongoing focus on credit quality and the deployment of credit strategies designed to drive reductions in high-risk balances and support profitable balance growth where appropriate. While overall asset performance is in line with expectations, financial stress has been observed in early and late stage delinquency cycles including an increase in debt counselling inflows across the Absa Card and WFS portfolios. The impairment stock coverage of NPLs for the consolidated portfolio has decreased from 71,53% to 70,44% due to improving recoveries.
Business performance (continued)
0,981,01
� � Credit impairments Credit loss ratio
3 751
3%
848797
6%
3 637
Credit impairments and credit loss ratio(Rm, % and change %) Revenue (Rm and change %)
20141 201520141 2015
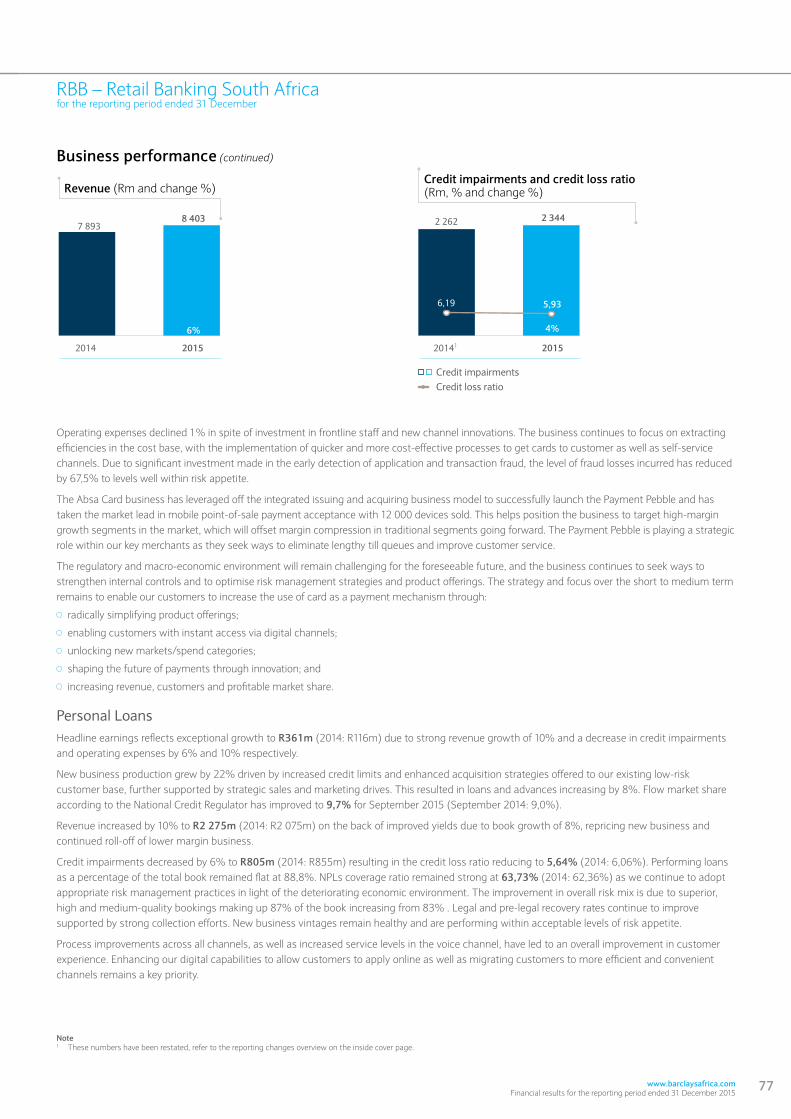
www.barclaysafrica.com Financial results for the reporting period ended 31 December 2015
77
RBB – Retail Banking South Africafor the reporting period ended 31 December
2 344
5,93
2 262
6,19
4%
Credit impairments and credit loss ratio(Rm, % and change %)
20141 2015
� � Credit impairments Credit loss ratio
7 8938 403
6%
Revenue (Rm and change %)
2014 2015
Business performance (continued)
Operating expenses declined 1% in spite of investment in frontline staff and new channel innovations. The business continues to focus on extracting efficiencies in the cost base, with the implementation of quicker and more cost-effective processes to get cards to customer as well as self-service channels. Due to significant investment made in the early detection of application and transaction fraud, the level of fraud losses incurred has reduced by 67,5% to levels well within risk appetite.
The Absa Card business has leveraged off the integrated issuing and acquiring business model to successfully launch the Payment Pebble and has taken the market lead in mobile point-of-sale payment acceptance with 12 000 devices sold. This helps position the business to target high-margin growth segments in the market, which will offset margin compression in traditional segments going forward. The Payment Pebble is playing a strategic role within our key merchants as they seek ways to eliminate lengthy till queues and improve customer service.
The regulatory and macro-economic environment will remain challenging for the foreseeable future, and the business continues to seek ways to strengthen internal controls and to optimise risk management strategies and product offerings. The strategy and focus over the short to medium term remains to enable our customers to increase the use of card as a payment mechanism through:
radically simplifying product offerings;
enabling customers with instant access via digital channels;
unlocking new markets/spend categories;
shaping the future of payments through innovation; and
increasing revenue, customers and profitable market share.
Personal LoansHeadline earnings reflects exceptional growth to R361m (2014: R116m) due to strong revenue growth of 10% and a decrease in credit impairments and operating expenses by 6% and 10% respectively.
New business production grew by 22% driven by increased credit limits and enhanced acquisition strategies offered to our existing low-risk customer base, further supported by strategic sales and marketing drives. This resulted in loans and advances increasing by 8%. Flow market share according to the National Credit Regulator has improved to 9,7% for September 2015 (September 2014: 9,0%).
Revenue increased by 10% to R2 275m (2014: R2 075m) on the back of improved yields due to book growth of 8%, repricing new business and continued roll-off of lower margin business.
Credit impairments decreased by 6% to R805m (2014: R855m) resulting in the credit loss ratio reducing to 5,64% (2014: 6,06%). Performing loans as a percentage of the total book remained flat at 88,8%. NPLs coverage ratio remained strong at 63,73% (2014: 62,36%) as we continue to adopt appropriate risk management practices in light of the deteriorating economic environment. The improvement in overall risk mix is due to superior, high and medium-quality bookings making up 87% of the book increasing from 83% . Legal and pre-legal recovery rates continue to improve supported by strong collection efforts. New business vintages remain healthy and are performing within acceptable levels of risk appetite.
Process improvements across all channels, as well as increased service levels in the voice channel, have led to an overall improvement in customer experience. Enhancing our digital capabilities to allow customers to apply online as well as migrating customers to more efficient and convenient channels remains a key priority.
Note 1 These numbers have been restated, refer to the reporting changes overview on the inside cover page.
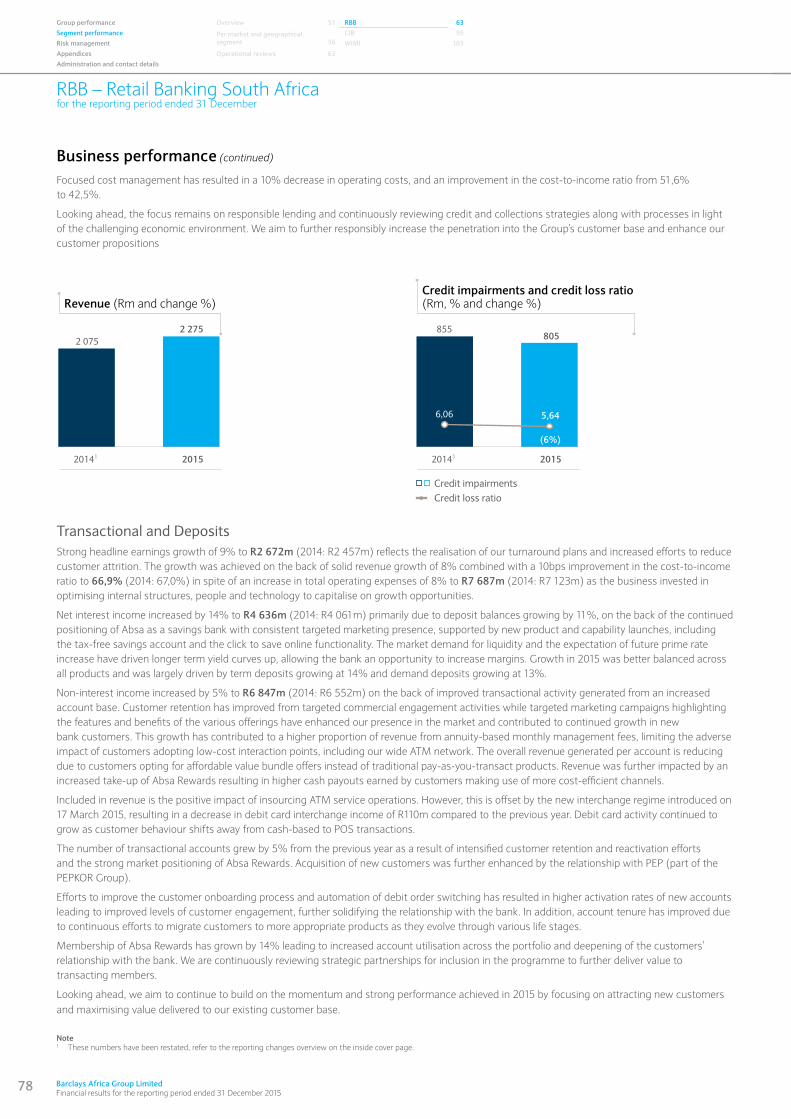
78 Barclays Africa Group Limited Financial results for the reporting period ended 31 December 2015
RBB – Retail Banking South Africafor the reporting period ended 31 December
Group performance Overview 51 RBB 63Segment performance Per market and geographical
segment
56CIB 95
Risk management WIMI 103Appendices Operational reviews 63Administration and contact details
Focused cost management has resulted in a 10% decrease in operating costs, and an improvement in the cost-to-income ratio from 51,6% to 42,5%.
Looking ahead, the focus remains on responsible lending and continuously reviewing credit and collections strategies along with processes in light of the challenging economic environment. We aim to further responsibly increase the penetration into the Group’s customer base and enhance our customer propositions
Transactional and DepositsStrong headline earnings growth of 9% to R2 672m (2014: R2 457m) reflects the realisation of our turnaround plans and increased efforts to reduce customer attrition. The growth was achieved on the back of solid revenue growth of 8% combined with a 10bps improvement in the cost-to-income ratio to 66,9% (2014: 67,0%) in spite of an increase in total operating expenses of 8% to R7 687m (2014: R7 123m) as the business invested in optimising internal structures, people and technology to capitalise on growth opportunities.
Net interest income increased by 14% to R4 636m (2014: R4 061m) primarily due to deposit balances growing by 11%, on the back of the continued positioning of Absa as a savings bank with consistent targeted marketing presence, supported by new product and capability launches, including the tax-free savings account and the click to save online functionality. The market demand for liquidity and the expectation of future prime rate increase have driven longer term yield curves up, allowing the bank an opportunity to increase margins. Growth in 2015 was better balanced across all products and was largely driven by term deposits growing at 14% and demand deposits growing at 13%.
Non-interest income increased by 5% to R6 847m (2014: R6 552m) on the back of improved transactional activity generated from an increased account base. Customer retention has improved from targeted commercial engagement activities while targeted marketing campaigns highlighting the features and benefits of the various offerings have enhanced our presence in the market and contributed to continued growth in new bank customers. This growth has contributed to a higher proportion of revenue from annuity-based monthly management fees, limiting the adverse impact of customers adopting low-cost interaction points, including our wide ATM network. The overall revenue generated per account is reducing due to customers opting for affordable value bundle offers instead of traditional pay-as-you-transact products. Revenue was further impacted by an increased take-up of Absa Rewards resulting in higher cash payouts earned by customers making use of more cost-efficient channels.
Included in revenue is the positive impact of insourcing ATM service operations. However, this is offset by the new interchange regime introduced on 17 March 2015, resulting in a decrease in debit card interchange income of R110m compared to the previous year. Debit card activity continued to grow as customer behaviour shifts away from cash-based to POS transactions.
The number of transactional accounts grew by 5% from the previous year as a result of intensified customer retention and reactivation efforts and the strong market positioning of Absa Rewards. Acquisition of new customers was further enhanced by the relationship with PEP (part of the PEPKOR Group).
Efforts to improve the customer onboarding process and automation of debit order switching has resulted in higher activation rates of new accounts leading to improved levels of customer engagement, further solidifying the relationship with the bank. In addition, account tenure has improved due to continuous efforts to migrate customers to more appropriate products as they evolve through various life stages.
Membership of Absa Rewards has grown by 14% leading to increased account utilisation across the portfolio and deepening of the customers’ relationship with the bank. We are continuously reviewing strategic partnerships for inclusion in the programme to further deliver value to transacting members.
Looking ahead, we aim to continue to build on the momentum and strong performance achieved in 2015 by focusing on attracting new customers and maximising value delivered to our existing customer base.
Note 1 These numbers have been restated, refer to the reporting changes overview on the inside cover page.
Business performance (continued)
2 275805
5,64
855
6,06
(6%)
2 075
Credit impairments and credit loss ratio(Rm, % and change %) Revenue (Rm and change %)
20141 201520141 2015
� � Credit impairments Credit loss ratio
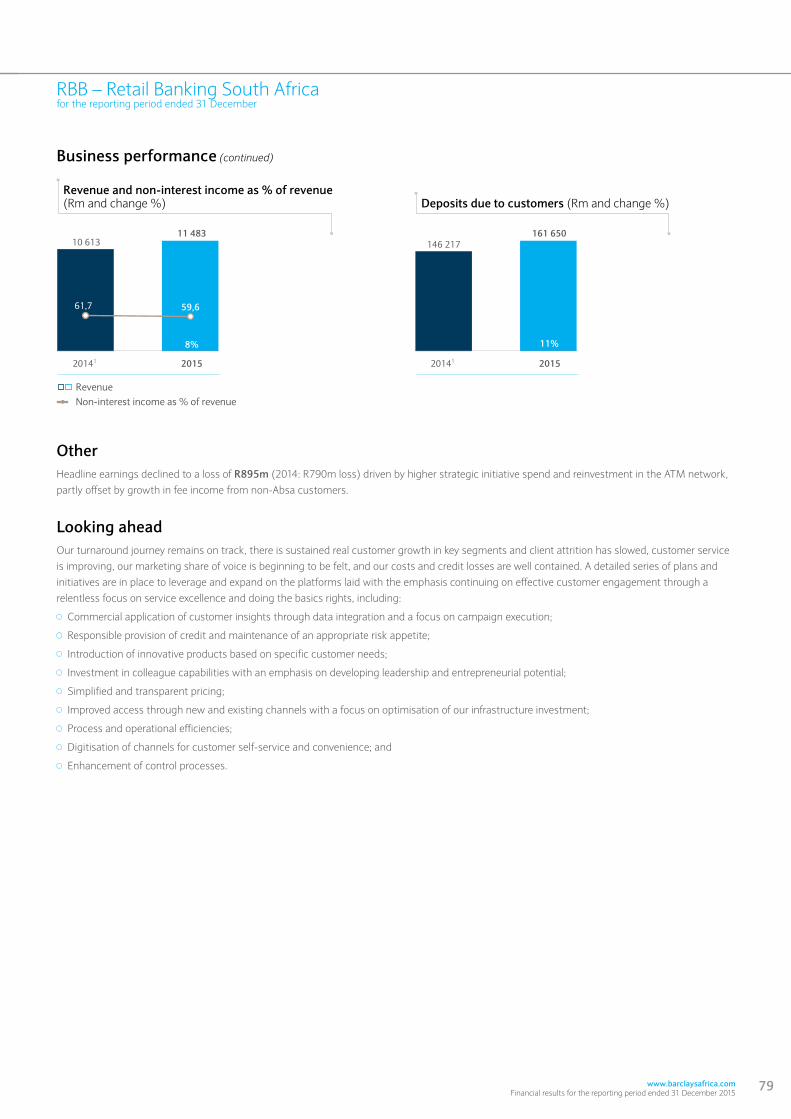
www.barclaysafrica.com Financial results for the reporting period ended 31 December 2015
79
RBB – Retail Banking South Africafor the reporting period ended 31 December
Business performance (continued)
Other Headline earnings declined to a loss of R895m (2014: R790m loss) driven by higher strategic initiative spend and reinvestment in the ATM network, partly offset by growth in fee income from non-Absa customers.
Looking aheadOur turnaround journey remains on track, there is sustained real customer growth in key segments and client attrition has slowed, customer service is improving, our marketing share of voice is beginning to be felt, and our costs and credit losses are well contained. A detailed series of plans and initiatives are in place to leverage and expand on the platforms laid with the emphasis continuing on effective customer engagement through a relentless focus on service excellence and doing the basics rights, including:
Commercial application of customer insights through data integration and a focus on campaign execution;
Responsible provision of credit and maintenance of an appropriate risk appetite;
Introduction of innovative products based on specific customer needs;
Investment in colleague capabilities with an emphasis on developing leadership and entrepreneurial potential;
Simplified and transparent pricing;
Improved access through new and existing channels with a focus on optimisation of our infrastructure investment;
Process and operational efficiencies;
Digitisation of channels for customer self-service and convenience; and
Enhancement of control processes.
59,661,7
� � Revenue Non-interest income as % of revenue
11 483
8%
161 650
11%
10 613 146 217
Deposits due to customers (Rm and change %)Revenue and non-interest income as % of revenue(Rm and change %)
20141 201520141 2015
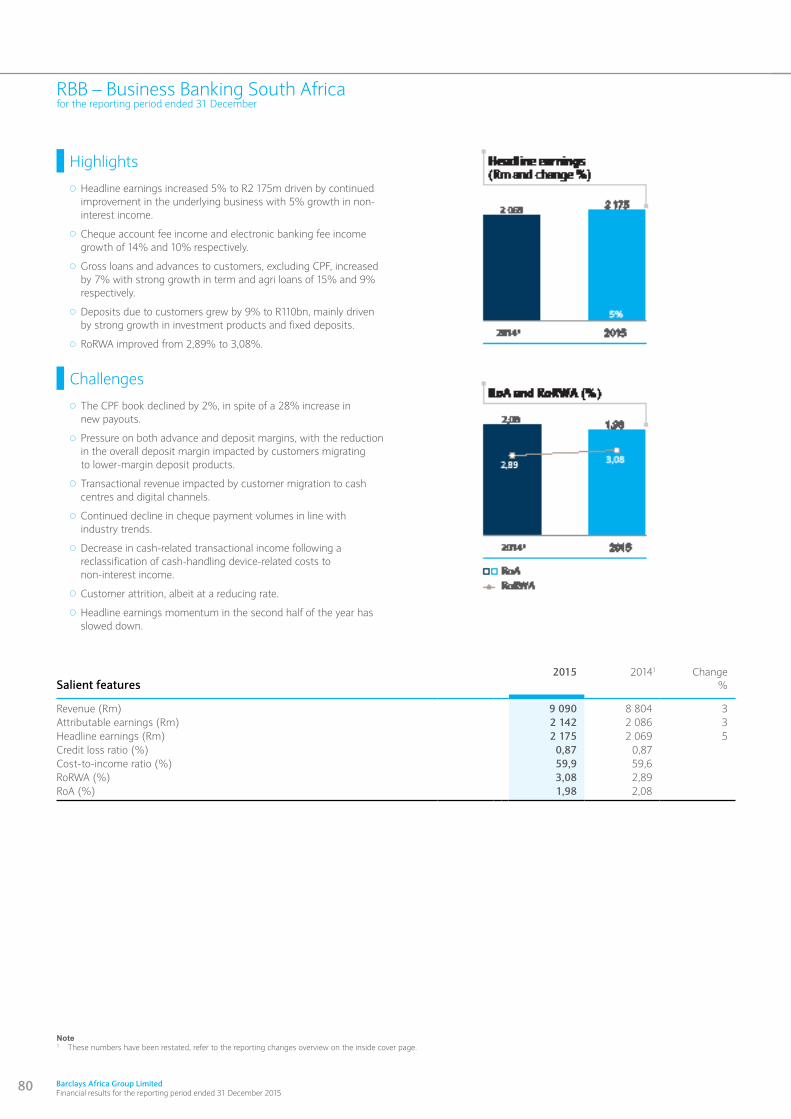
RBB – Business Banking South Africafor the reporting period ended 31 December
Salient features2015 20141 Change
%
Revenue (Rm) 9 090 8 804 3Attributable earnings (Rm) 2 142 2 086 3Headline earnings (Rm) 2 175 2 069 5Credit loss ratio (%) 0,87 0,87Cost-to-income ratio (%) 59,9 59,6RoRWA (%) 3,08 2,89RoA (%) 1,98 2,08
Highlights
Headline earnings increased 5% to R2 175m driven by continued improvement in the underlying business with 5% growth in non-interest income.
Cheque account fee income and electronic banking fee income growth of 14% and 10% respectively.
Gross loans and advances to customers, excluding CPF, increased by 7% with strong growth in term and agri loans of 15% and 9% respectively.
Deposits due to customers grew by 9% to R110bn, mainly driven by strong growth in investment products and fixed deposits.
RoRWA improved from 2,89% to 3,08%.
Challenges
The CPF book declined by 2%, in spite of a 28% increase in new payouts.
Pressure on both advance and deposit margins, with the reduction in the overall deposit margin impacted by customers migrating to lower-margin deposit products.
Transactional revenue impacted by customer migration to cash centres and digital channels.
Continued decline in cheque payment volumes in line with industry trends.
Decrease in cash-related transactional income following a reclassification of cash-handling device-related costs to non-interest income.
Customer attrition, albeit at a reducing rate.
Headline earnings momentum in the second half of the year has slowed down.
Note1 These numbers have been restated, refer to the reporting changes overview on the inside cover page.
80 Barclays Africa Group Limited Financial results for the reporting period ended 31 December 2015

www.barclaysafrica.com Financial results for the reporting period ended 31 December 2015
81
This page has been left blank intentionally
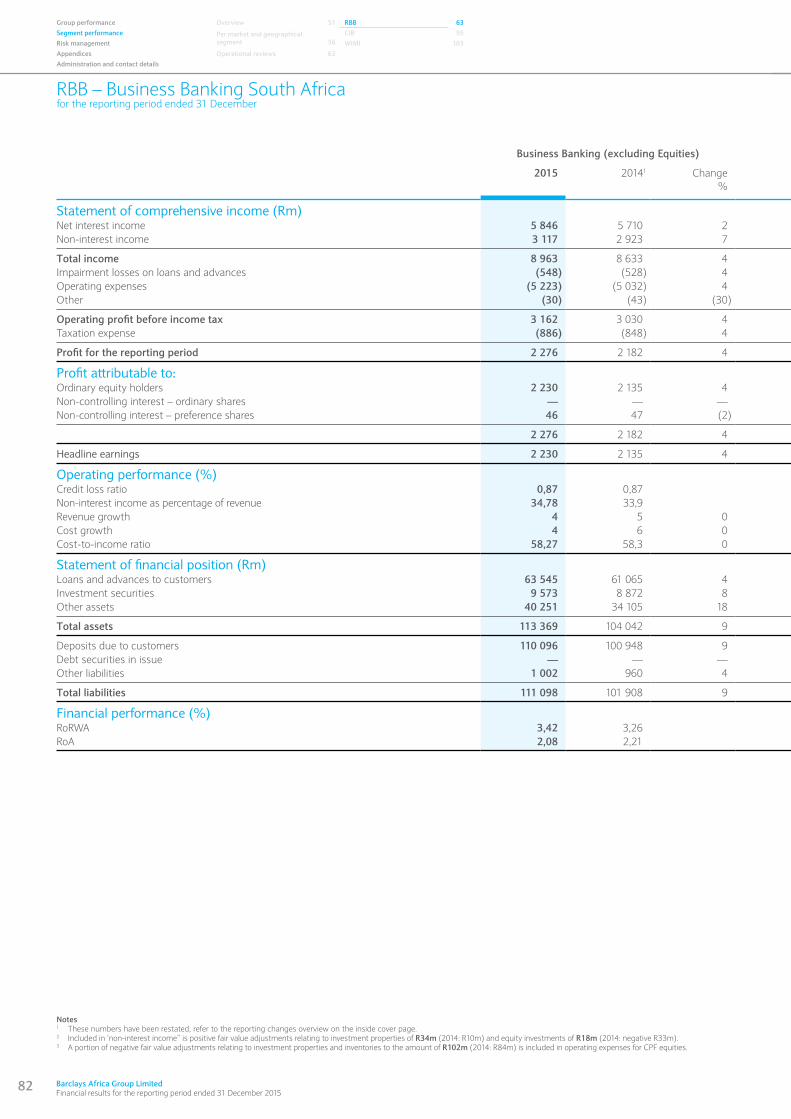
82 Barclays Africa Group Limited Financial results for the reporting period ended 31 December 2015
RBB – Business Banking South Africafor the reporting period ended 31 December
Group performance Overview 51 RBB 63Segment performance Per market and geographical
segment
56CIB 95
Risk management WIMI 103Appendices Operational reviews 63Administration and contact details
Business Banking (excluding Equities) Business Banking Equities Total Business Banking South Africa
2015 20141 Change%
2015 20141 Change%
2015 20141 Change%
Statement of comprehensive income (Rm)Net interest income 5 846 5 710 2 (92) (72) 28 5 754 5 638 2Non-interest income 3 117 2 923 7 2192 2432 (10) 3 336 3 166 5
Total income 8 963 8 633 4 127 171 (26) 9 090 8 804 3Impairment losses on loans and advances (548) (528) 4 0 — >100 (548) (528) 4Operating expenses (5 223) (5 032) 4 (218)3 (216)3 1 (5 441) (5 248) 4Other (30) (43) (30) (13) (3) >100 (43) (46) (7)
Operating profit before income tax 3 162 3 030 4 (104) (48) >100 3 058 2 982 3Taxation expense (886) (848) 4 19 4 >100 (867) (844) 3
Profit for the reporting period 2 276 2 182 4 (85) (44) 93 2 191 2 138 2
Profit attributable to:Ordinary equity holders 2 230 2 135 4 (88) (49) 80 2 142 2 086 3Non-controlling interest – ordinary shares — — — — — — — — —Non-controlling interest – preference shares 46 47 (2) 3 5 (40) 49 52 (6)
2 276 2 182 4 (85) (44) 93 2 191 2 138 2
Headline earnings 2 230 2 135 4 (55) (66) (17) 2 175 2 069 5
Operating performance (%) Credit loss ratio 0,87 0,87 n/a n/a 0,87 0,87Non-interest income as percentage of revenue 34,78 33,9 n/a n/a 36,70 36,0Revenue growth 4 5 0 (26) 138 3,25 6Cost growth 4 6 0 1 (2) 4 6Cost-to-income ratio 58,27 58,3 0 n/a n/a 59,9 59,6
Statement of financial position (Rm)Loans and advances to customers 63 545 61 065 4 — — — 63 545 61 065 4Investment securities 9 573 8 872 8 650 819 (21) 10 223 9 691 5Other assets 40 251 34 105 18 2 350 1 675 40 42 601 35 780 19
Total assets 113 369 104 042 9 3 000 2 494 20 116 369 106 536 9
Deposits due to customers 110 096 100 948 9 — — — 110 096 100 948 9Debt securities in issue — — — — — — — — —Other liabilities 1 002 960 4 2 899 2 361 23 3 901 3 321 17
Total liabilities 111 098 101 908 9 2 899 2 361 23 113 997 104 269 9
Financial performance (%)RoRWA 3,42 3,26 n/a n/a 3,08 2,89RoA 2,08 2,21 (1,91) (2,22) 1,98 2,08
Notes1 These numbers have been restated, refer to the reporting changes overview on the inside cover page.2 Included in ‘non-interest income” is positive fair value adjustments relating to investment properties of R34m (2014: R10m) and equity investments of R18m (2014: negative R33m).3 A portion of negative fair value adjustments relating to investment properties and inventories to the amount of R102m (2014: R84m) is included in operating expenses for CPF equities.
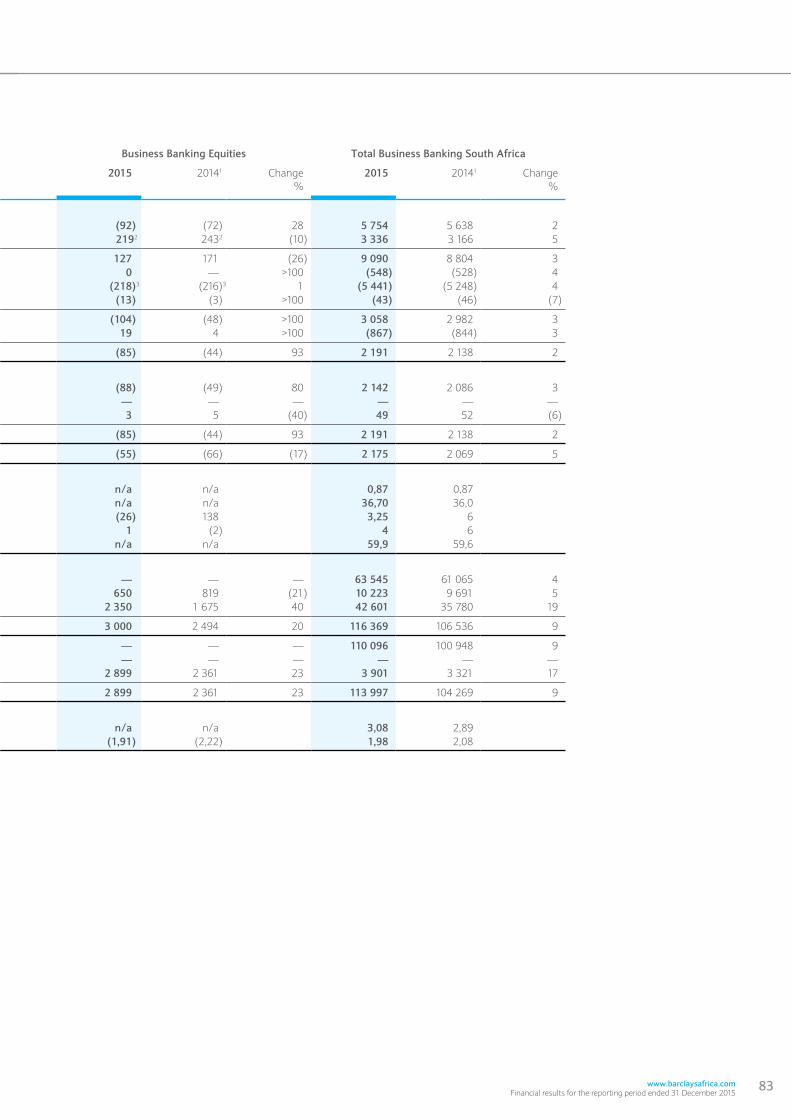
www.barclaysafrica.com Financial results for the reporting period ended 31 December 2015
83
Business Banking (excluding Equities) Business Banking Equities Total Business Banking South Africa
2015 20141 Change%
2015 20141 Change%
2015 20141 Change%
Statement of comprehensive income (Rm)Net interest income 5 846 5 710 2 (92) (72) 28 5 754 5 638 2Non-interest income 3 117 2 923 7 2192 2432 (10) 3 336 3 166 5
Total income 8 963 8 633 4 127 171 (26) 9 090 8 804 3Impairment losses on loans and advances (548) (528) 4 0 — >100 (548) (528) 4Operating expenses (5 223) (5 032) 4 (218)3 (216)3 1 (5 441) (5 248) 4Other (30) (43) (30) (13) (3) >100 (43) (46) (7)
Operating profit before income tax 3 162 3 030 4 (104) (48) >100 3 058 2 982 3Taxation expense (886) (848) 4 19 4 >100 (867) (844) 3
Profit for the reporting period 2 276 2 182 4 (85) (44) 93 2 191 2 138 2
Profit attributable to:Ordinary equity holders 2 230 2 135 4 (88) (49) 80 2 142 2 086 3Non-controlling interest – ordinary shares — — — — — — — — —Non-controlling interest – preference shares 46 47 (2) 3 5 (40) 49 52 (6)
2 276 2 182 4 (85) (44) 93 2 191 2 138 2
Headline earnings 2 230 2 135 4 (55) (66) (17) 2 175 2 069 5
Operating performance (%) Credit loss ratio 0,87 0,87 n/a n/a 0,87 0,87Non-interest income as percentage of revenue 34,78 33,9 n/a n/a 36,70 36,0Revenue growth 4 5 0 (26) 138 3,25 6Cost growth 4 6 0 1 (2) 4 6Cost-to-income ratio 58,27 58,3 0 n/a n/a 59,9 59,6
Statement of financial position (Rm)Loans and advances to customers 63 545 61 065 4 — — — 63 545 61 065 4Investment securities 9 573 8 872 8 650 819 (21) 10 223 9 691 5Other assets 40 251 34 105 18 2 350 1 675 40 42 601 35 780 19
Total assets 113 369 104 042 9 3 000 2 494 20 116 369 106 536 9
Deposits due to customers 110 096 100 948 9 — — — 110 096 100 948 9Debt securities in issue — — — — — — — — —Other liabilities 1 002 960 4 2 899 2 361 23 3 901 3 321 17
Total liabilities 111 098 101 908 9 2 899 2 361 23 113 997 104 269 9
Financial performance (%)RoRWA 3,42 3,26 n/a n/a 3,08 2,89RoA 2,08 2,21 (1,91) (2,22) 1,98 2,08
84 Barclays Africa Group Limited Financial results for the reporting period ended 31 December 2015
RBB – Business Banking South Africafor the reporting period ended 31 December
Group performance Overview 51 RBB 63Segment performance Per market and geographical
segment
56CIB 95
Risk management WIMI 103Appendices Operational reviews 63Administration and contact details
Business profileBusiness Banking South Africa strives to put world-class banking solutions within the reach of every business in its targeted markets. This means putting the customer at the centre of everything we do, and will be achieved through superior customer service and by providing holistic solutions based on unique customer needs.
The journey entails investment in people, digitisation of customer solutions and improvement in customer service as measured through customer satisfaction scores.
Business Banking South Africa operates a well-defined coverage model based on specific customer value propositions. These value propositions align to customer needs and range from direct interactions via multi-channel interfaces such as electronic banking through to a dedicated relationship-based model.
Customers within the enterprise segment, with an annual turnover of up to R20m, are serviced using a direct coverage model with a predominately branch-based service interface.
Customers in the commercial segment, with an annual turnover of between R20m and R500m, are serviced using a relationship-based model, where dedicated sales and service teams provide customised solutions. The relationship-based model includes a sector overlay focusing on the primary sectors of agriculture, public sector, wholesale, retail and franchising.
Key business areasBusiness Banking South Africa offers a diverse range of products based on customers’ needs:
Debt products – CPF, term loans, agricultural loans, overdrafts and overnight finance. Fees earned from debt products include upfront structuring, restructuring, commitment and transactional fees.
Deposit products – transactional deposits (including cheque, and savings and transmission deposits) and investment deposits (including investment products, fixed, call and notice deposits).
Transactional products – electronic banking (internet and mobile), cheque and savings accounts as well as cash-related (cash-related transactions include cash deposits and withdrawals, cardless cash deposits and automated cash-handling devices).
Equities – investment portfolio in property and unlisted equities.
An organisational structure change took place during the current reporting period impacting the reporting structure of Business Banking South Africa:
SIDs (Sustainable Integrated Residential Developments), previously reported in the Retail Banking South Africa segment within Home Loans with a portfolio of R134m, was transferred to Business Banking South Africa and integrated from the beginning of the current reporting period.
www.barclaysafrica.com Financial results for the reporting period ended 31 December 2015
85
RBB – Business Banking South Africafor the reporting period ended 31 December
Financial performanceBusiness Banking South Africa’s headline earnings increased by 5% to R2 175m (2014: R2 069m), mainly due to 5% growth in non-interest income, 2% increase in net interest income and 4% increase in operating expenses.
Net interest income growth reflected pressure on both advance and deposit margins. Advance margins reduced on the back of competitor and funding pressures while deposit margins were largely impacted by a change in the product mix.
The 5% increase in non-interest income to R3 336m (2014: R3 166m) was primarily driven by a 14% growth in cheque account fee income and a 10% growth in electronic banking fee income. This growth was partly offset by a continued decline in cheque payment volumes in line with industry trends and 3% decrease in cash-related transactional income, impacted by the reclassification in the current reporting period of cash-handling device-related costs to non-interest income. Excluding this reclassification, non-interest income increased by 8% while cash-related transactional income increased by 2%.
Although credit impairments increased by 4% to R548m (2014: R528m) largely driven by the commercial portfolio, the credit loss ratio remained in line with the prior reporting period at 0,87%. Impairments held against performing loans increased by 7% to R664m (2014: R622m) resulting in a marginal increase in the performing loan coverage ratio to 1,07% (2014: 1,05%), mostly evident in the commercial portfolio. NPLs continued to improve, decreasing by 16% to R3 306m (2014: R3 925m), particularly in CPF, which reflected a 25% decrease. The NPLs’ coverage ratio reduced to 34,7% (2014: 35,8%), largely due to a reduction in new defaults and an increase in the resolution of older default exposures, with the larger impact evident in the CPF book.
In spite of inflationary pressures and increased investment in relationship managers, operating expense growth was contained at 4% to R5 441m (2014: R5 248m). Cost benefits were derived from the branch network driven by internal cost-efficiencies and lower volumes due to the migration of transactions out of branches.
Gross loans and advances to customers grew by 4%. Solid growth was achieved in term loans and agri loans of 15% and 9% respectively, while the CPF book decreased by 2%. The focus for sustainable growth remains on improving the rate of conversion of leads into deals. The deposit book grew 9% largely driven by a 16% increase in investment deposits coupled with a 2% increase in transactional deposits.
Progress in the long-term orderly reduction of the Equity portfolio was made through planned realisations. The overall portfolio size, however, remained broadly in line with the prior reporting period at R2 148m (2014: R2 183m) due to the impact of the transfer in of SIDs and foreign exchange movements. Excluding these impacts the portfolio reduced by 11% to R1 935m.
Operating environmentThe following factors had a key influence on Business Banking:
Global economic growth slipped in 2015 to 3,1% as low inflation and a somewhat stronger performance among many advanced economies was not sufficient to offset a slowing China and a deeper emerging markets malaise. Commodity prices fell further on weaker demand and a limited response in supply. The US Fed raised interest rates for the first time since 2006, while in Japan and the Euro Union fiscal policy was eased during the year responding to very low inflation and weaker economic recoveries. Higher US policy rates and this monetary policy divergence across major economies had a profound impact on global markets.
Domestically, 2015 was a very challenging year for the economy, with the full-year GDP slipping below 1,5% to 1,3%. Further commodity price drops impacted production and investment in the mining sector. Acute electricity shortages damaged both actual output across sectors and broad business/consumer sentiment.
The SARB was forced to navigate a difficult balance between a very weak economy and modest levels of inflation while also witnessing a sharp fall in the value of the rand and a rise in global risk aversion. Two interest rate hikes, totalling 50bps, were announced during H2, with a clear signal from the Monetary Policy Committee that more is to come even in the face of the weak economic outlook.
Transactional income remains impacted by the industry-wide practice to reduce the utilisation of cheques, and the behaviour of customers to migrate from traditional branches to cash centres and digital transacting platforms.
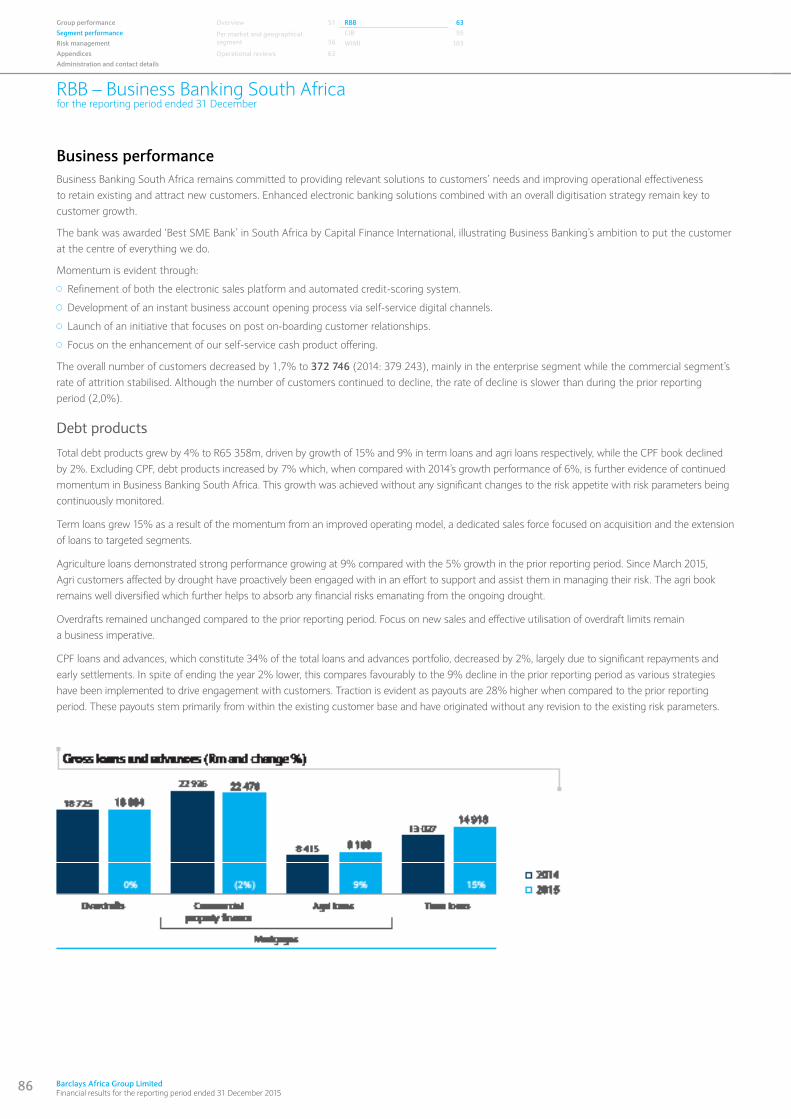
86 Barclays Africa Group Limited Financial results for the reporting period ended 31 December 2015
RBB – Business Banking South Africafor the reporting period ended 31 December
Group performance Overview 51 RBB 63Segment performance Per market and geographical
segment
56CIB 95
Risk management WIMI 103Appendices Operational reviews 63Administration and contact details
Business performanceBusiness Banking South Africa remains committed to providing relevant solutions to customers’ needs and improving operational effectiveness to retain existing and attract new customers. Enhanced electronic banking solutions combined with an overall digitisation strategy remain key to customer growth.
The bank was awarded ‘Best SME Bank’ in South Africa by Capital Finance International, illustrating Business Banking’s ambition to put the customer at the centre of everything we do.
Momentum is evident through:
Refinement of both the electronic sales platform and automated credit-scoring system.
Development of an instant business account opening process via self-service digital channels.
Launch of an initiative that focuses on post on-boarding customer relationships.
Focus on the enhancement of our self-service cash product offering.
The overall number of customers decreased by 1,7% to 372 746 (2014: 379 243), mainly in the enterprise segment while the commercial segment’s rate of attrition stabilised. Although the number of customers continued to decline, the rate of decline is slower than during the prior reporting period (2,0%).
Debt products
Total debt products grew by 4% to R65 358m, driven by growth of 15% and 9% in term loans and agri loans respectively, while the CPF book declined by 2%. Excluding CPF, debt products increased by 7% which, when compared with 2014’s growth performance of 6%, is further evidence of continued momentum in Business Banking South Africa. This growth was achieved without any significant changes to the risk appetite with risk parameters being continuously monitored.
Term loans grew 15% as a result of the momentum from an improved operating model, a dedicated sales force focused on acquisition and the extension of loans to targeted segments.
Agriculture loans demonstrated strong performance growing at 9% compared with the 5% growth in the prior reporting period. Since March 2015, Agri customers affected by drought have proactively been engaged with in an effort to support and assist them in managing their risk. The agri book remains well diversified which further helps to absorb any financial risks emanating from the ongoing drought.
Overdrafts remained unchanged compared to the prior reporting period. Focus on new sales and effective utilisation of overdraft limits remain a business imperative.
CPF loans and advances, which constitute 34% of the total loans and advances portfolio, decreased by 2%, largely due to significant repayments and early settlements. In spite of ending the year 2% lower, this compares favourably to the 9% decline in the prior reporting period as various strategies have been implemented to drive engagement with customers. Traction is evident as payouts are 28% higher when compared to the prior reporting period. These payouts stem primarily from within the existing customer base and have originated without any revision to the existing risk parameters.
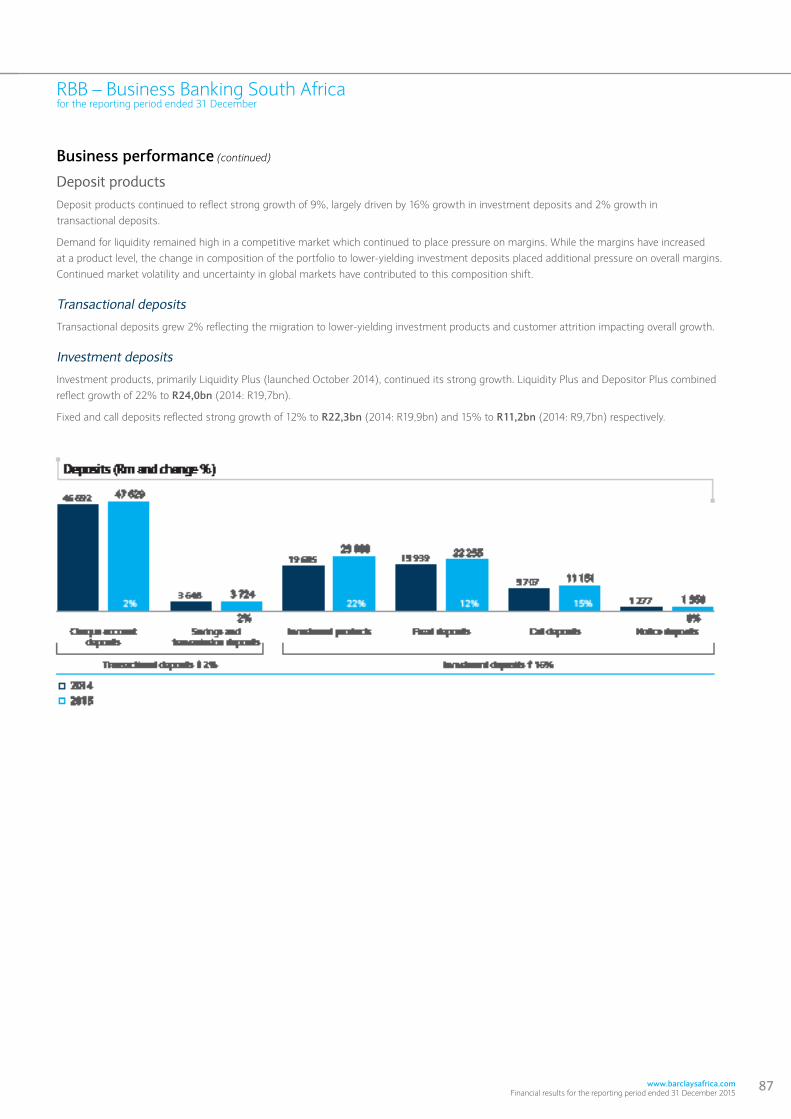
www.barclaysafrica.com Financial results for the reporting period ended 31 December 2015
87
RBB – Business Banking South Africafor the reporting period ended 31 December
Business performance (continued)
Deposit productsDeposit products continued to reflect strong growth of 9%, largely driven by 16% growth in investment deposits and 2% growth in transactional deposits.
Demand for liquidity remained high in a competitive market which continued to place pressure on margins. While the margins have increased at a product level, the change in composition of the portfolio to lower-yielding investment deposits placed additional pressure on overall margins. Continued market volatility and uncertainty in global markets have contributed to this composition shift.
Transactional deposits
Transactional deposits grew 2% reflecting the migration to lower-yielding investment products and customer attrition impacting overall growth.
Investment deposits
Investment products, primarily Liquidity Plus (launched October 2014), continued its strong growth. Liquidity Plus and Depositor Plus combined reflect growth of 22% to R24,0bn (2014: R19,7bn).
Fixed and call deposits reflected strong growth of 12% to R22,3bn (2014: R19,9bn) and 15% to R11,2bn (2014: R9,7bn) respectively.
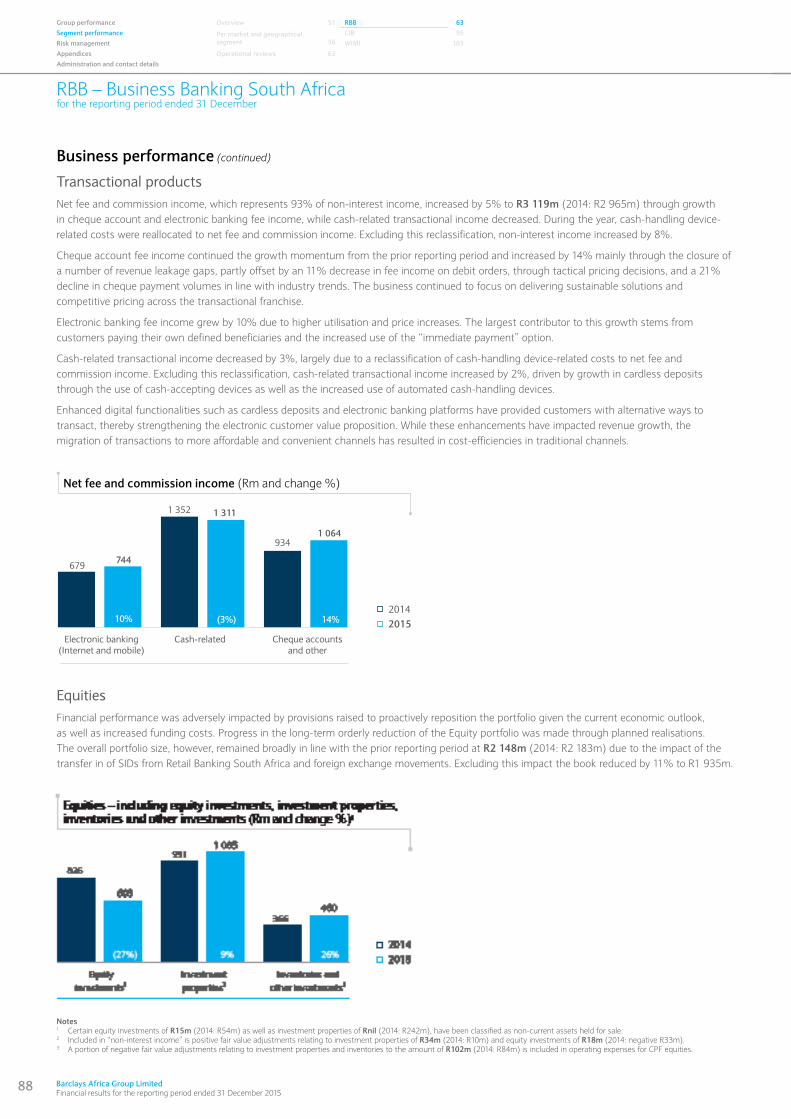
88 Barclays Africa Group Limited Financial results for the reporting period ended 31 December 2015
RBB – Business Banking South Africafor the reporting period ended 31 December
Group performance Overview 51 RBB 63Segment performance Per market and geographical
segment
56CIB 95
Risk management WIMI 103Appendices Operational reviews 63Administration and contact details
Business performance (continued)
EquitiesFinancial performance was adversely impacted by provisions raised to proactively reposition the portfolio given the current economic outlook, as well as increased funding costs. Progress in the long-term orderly reduction of the Equity portfolio was made through planned realisations. The overall portfolio size, however, remained broadly in line with the prior reporting period at R2 148m (2014: R2 183m) due to the impact of the transfer in of SIDs from Retail Banking South Africa and foreign exchange movements. Excluding this impact the book reduced by 11% to R1 935m.
Notes1 Certain equity investments of R15m (2014: R54m) as well as investment properties of Rnil (2014: R242m), have been classified as non-current assets held for sale.2 Included in “non-interest income” is positive fair value adjustments relating to investment properties of R34m (2014: R10m) and equity investments of R18m (2014: negative R33m).3 A portion of negative fair value adjustments relating to investment properties and inventories to the amount of R102m (2014: R84m) is included in operating expenses for CPF equities.
Transactional productsNet fee and commission income, which represents 93% of non-interest income, increased by 5% to R3 119m (2014: R2 965m) through growth in cheque account and electronic banking fee income, while cash-related transactional income decreased. During the year, cash-handling device-related costs were reallocated to net fee and commission income. Excluding this reclassification, non-interest income increased by 8%.
Cheque account fee income continued the growth momentum from the prior reporting period and increased by 14% mainly through the closure of a number of revenue leakage gaps, partly offset by an 11% decrease in fee income on debit orders, through tactical pricing decisions, and a 21% decline in cheque payment volumes in line with industry trends. The business continued to focus on delivering sustainable solutions and competitive pricing across the transactional franchise.
Electronic banking fee income grew by 10% due to higher utilisation and price increases. The largest contributor to this growth stems from customers paying their own defined beneficiaries and the increased use of the “immediate payment” option.
Cash-related transactional income decreased by 3%, largely due to a reclassification of cash-handling device-related costs to net fee and commission income. Excluding this reclassification, cash-related transactional income increased by 2%, driven by growth in cardless deposits through the use of cash-accepting devices as well as the increased use of automated cash-handling devices.
Enhanced digital functionalities such as cardless deposits and electronic banking platforms have provided customers with alternative ways to transact, thereby strengthening the electronic customer value proposition. While these enhancements have impacted revenue growth, the migration of transactions to more affordable and convenient channels has resulted in cost-efficiencies in traditional channels.
934
1 352
679
14%(3%)10%
Cheque accountsand other
Cash-relatedElectronic banking(Internet and mobile)
1 064
1 311
744
Net fee and commission income (Rm and change %)
� 2014� 2015
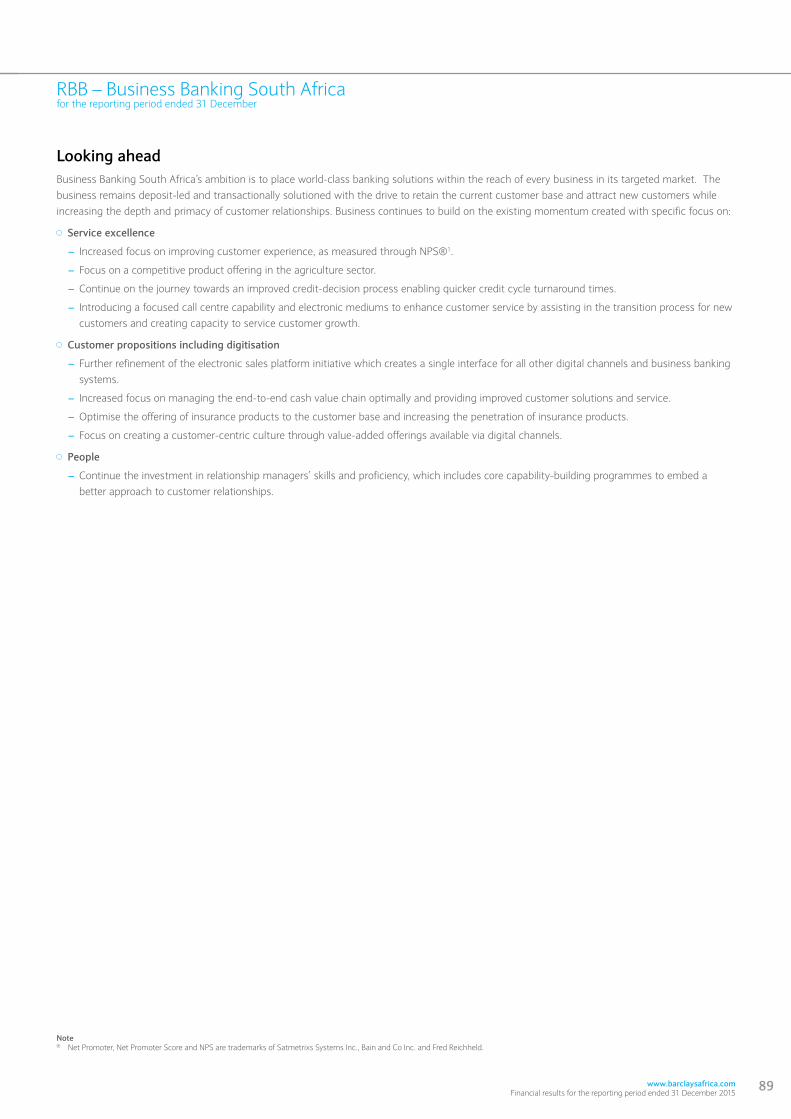
www.barclaysafrica.com Financial results for the reporting period ended 31 December 2015
89
RBB – Business Banking South Africafor the reporting period ended 31 December
Looking aheadBusiness Banking South Africa’s ambition is to place world-class banking solutions within the reach of every business in its targeted market. The business remains deposit-led and transactionally solutioned with the drive to retain the current customer base and attract new customers while increasing the depth and primacy of customer relationships. Business continues to build on the existing momentum created with specific focus on:
Service excellence
– Increased focus on improving customer experience, as measured through NPS®1.
– Focus on a competitive product offering in the agriculture sector.
– Continue on the journey towards an improved credit-decision process enabling quicker credit cycle turnaround times.
– Introducing a focused call centre capability and electronic mediums to enhance customer service by assisting in the transition process for new customers and creating capacity to service customer growth.
Customer propositions including digitisation
– Further refinement of the electronic sales platform initiative which creates a single interface for all other digital channels and business banking systems.
– Increased focus on managing the end-to-end cash value chain optimally and providing improved customer solutions and service.
– Optimise the offering of insurance products to the customer base and increasing the penetration of insurance products.
– Focus on creating a customer-centric culture through value-added offerings available via digital channels.
People
– Continue the investment in relationship managers’ skills and proficiency, which includes core capability-building programmes to embed a better approach to customer relationships.
Note® Net Promoter, Net Promoter Score and NPS are trademarks of Satmetrixs Systems Inc., Bain and Co Inc. and Fred Reichheld.
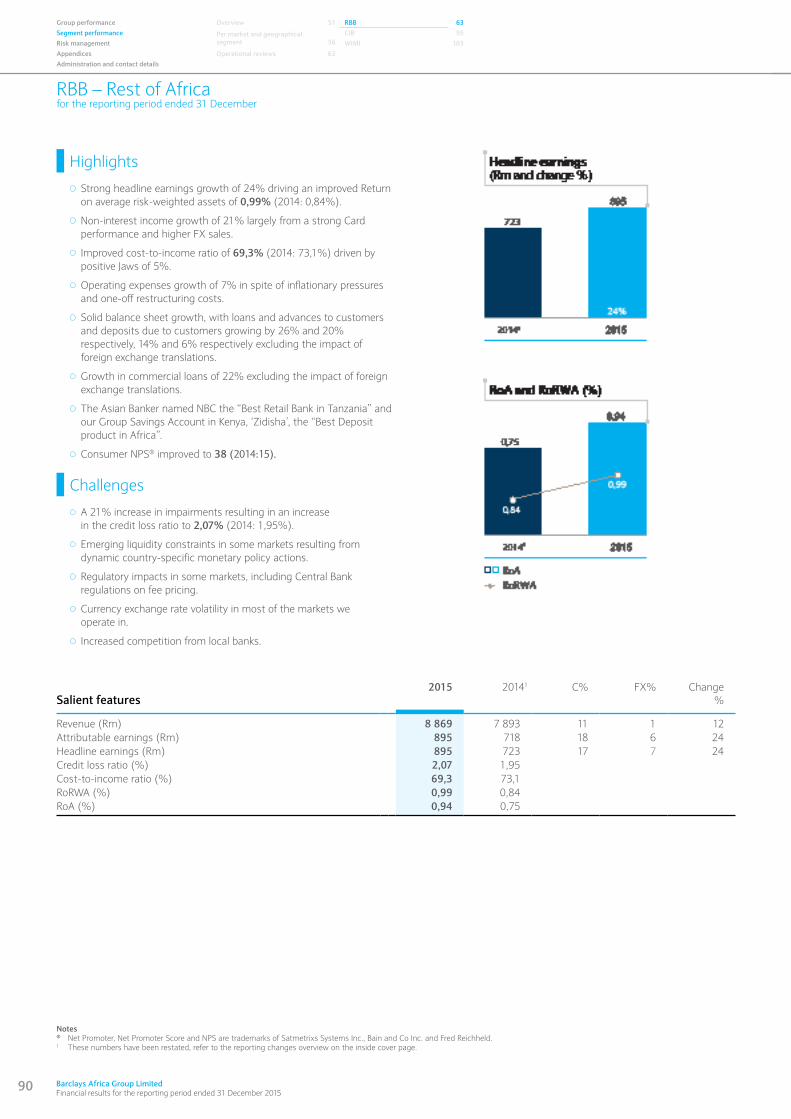
90 Barclays Africa Group Limited Financial results for the reporting period ended 31 December 2015
RBB – Rest of Africafor the reporting period ended 31 December
Group performance Overview 51 RBB 63Segment performance Per market and geographical
segment
56CIB 95
Risk management WIMI 103Appendices Operational reviews 63Administration and contact details
Salient features2015 20141 C% FX% Change
%
Revenue (Rm) 8 869 7 893 11 1 12Attributable earnings (Rm) 895 718 18 6 24Headline earnings (Rm) 895 723 17 7 24Credit loss ratio (%) 2,07 1,95Cost-to-income ratio (%) 69,3 73,1RoRWA (%) 0,99 0,84RoA (%) 0,94 0,75
Notes® Net Promoter, Net Promoter Score and NPS are trademarks of Satmetrixs Systems Inc., Bain and Co Inc. and Fred Reichheld.1 These numbers have been restated, refer to the reporting changes overview on the inside cover page.
Highlights
Strong headline earnings growth of 24% driving an improved Return on average risk-weighted assets of 0,99% (2014: 0,84%).
Non-interest income growth of 21% largely from a strong Card performance and higher FX sales.
Improved cost-to-income ratio of 69,3% (2014: 73,1%) driven by positive Jaws of 5%.
Operating expenses growth of 7% in spite of inflationary pressures and one-off restructuring costs.
Solid balance sheet growth, with loans and advances to customers and deposits due to customers growing by 26% and 20% respectively, 14% and 6% respectively excluding the impact of foreign exchange translations.
Growth in commercial loans of 22% excluding the impact of foreign exchange translations.
The Asian Banker named NBC the “Best Retail Bank in Tanzania” and our Group Savings Account in Kenya, ‘Zidisha’, the “Best Deposit product in Africa”.
Consumer NPS® improved to 38 (2014:15).
Challenges
A 21% increase in impairments resulting in an increase in the credit loss ratio to 2,07% (2014: 1,95%).
Emerging liquidity constraints in some markets resulting from dynamic country-specific monetary policy actions.
Regulatory impacts in some markets, including Central Bank regulations on fee pricing.
Currency exchange rate volatility in most of the markets we operate in.
Increased competition from local banks.
www.barclaysafrica.com Financial results for the reporting period ended 31 December 2015
91
RBB – Rest of Africafor the reporting period ended 31 December
Note1 These numbers have been restated, refer to the reporting changes overview on the inside cover page.
Total RBB Rest of Africa
2015 20141 C% FX% Change%
Statement of comprehensive income (Rm)Net interest income 6 249 5 736 8 1 9Non-interest income 2 620 2 157 20 1 21
Total income 8 869 7 893 11 1 12Impairment losses on loans and advances (777) (641) 20 1 21Operating expenses (6 143) (5 766) 7 (0) 7Other (112) (50) >100 0 >100
Operating profit before income tax 1 837 1 436 24 4 28Taxation expense (617) (456) 35 0 35
Profit for the reporting period 1 220 980 18 6 24
Profit attributable to:Ordinary equity holders 895 718 18 6 24Non-controlling interest – ordinary shares 325 262 17 7 24Non-controlling interest – preference shares — — — — —
1 220 980 18 6 24
Headline earnings 895 723 17 7 24
Operating performance (%) Net interest margin on average interest-bearing assets 9,36 9,38Credit loss ratio 2,07 1,95Non-interest income as percentage of revenue 29,5 27,3Revenue growth 12 1Cost growth 7 10Cost-to-income ratio 69,3 73,1
Statement of financial position (Rm)Loans and advances to customers 45 213 35 812 14 12 26Investment securities 19 084 15 957 3 17 20Other assets 54 030 43 000 8 18 26
Total assets 118 327 94 769 9 16 25
Deposits due to customers 68 736 57 206 6 14 20Debt securities in issue 493 880 (51) 7 (44)Other liabilities 33 820 25 476 13 20 33
Total liabilities 103 049 83 562 7 16 23
92 Barclays Africa Group Limited Financial results for the reporting period ended 31 December 2015
RBB – Rest of Africafor the reporting period ended 31 December
Group performance Overview 51 RBB 63Segment performance Per market and geographical
segment
56CIB 95
Risk management WIMI 103Appendices Operational reviews 63Administration and contact details
Business profileRBB Rest of Africa offers a comprehensive suite of retail and business banking products and services to individual and commercial customers on the
African continent outside of South Africa. A range of solutions are provided to meet customers’ transactional, borrowing, savings, protection and
payments needs. This is facilitated through branch and self-service terminal networks, electronic and mobile telephone channels and a dedicated
relationship-based model. This is achieved within a well-defined coverage model based on specific customer value propositions. These businesses
operate under the Barclays brand, except for National Bank of Commerce (Tanzania) and the Representative Office in Namibia.
Key product/segment areas Premier banking: Represents the affluent retail customer sector bespoke to each market, being offered exclusive banking through dedicated
relationship managers and Premier suites, with tailor-made solutions.
Prestige banking: Represents the emerging affluent retail customer sector bespoke to each market, being offered dedicated banking teams,
affordable products and express service.
Personal banking: Represents the middle-market sector bespoke to each market, being offered convenient banking solutions.
Enterprise banking: Business clients with an annual turnover of up to R50m, being serviced using a direct coverage model with a predominately
branch-based service interface.
Commercial banking: Business clients with an annual turnover of between R50m and R250m, being serviced using a relationship-based model,
where dedicated sales and service teams provide customised solutions.
Commercial and enterprise banking include a sector overlay focusing on the primary sectors of agriculture, construction, manufacturing, transport
and logistics, retail, franchising and other significant sectors specific to each market.
Key business areasA range of products consisting of secured loans, unsecured loans and customer deposits are offered to customers, who are served through the
following businesses:
Barclays Bank of Kenya
Barclays Bank of Botswana
Barclays Bank of Ghana
Barclays Bank Zambia
National Bank of Commerce (Tanzania)
Barclays Bank Mozambique
Barclays Bank Uganda
Barclays Bank Mauritius
Barclays Bank of Tanzania
Barclays Bank Seychelles
Namibia – Representative office
Financial performanceThe business delivered a strong financial performance, with headline earnings growth of 24% to R895m (2014: R723m) including the impact of
foreign exchange translations. Operating profit before tax grew by 28% to R1 837m (2014: R1 436m), from positive Jaws. This strong performance
was achieved mainly on the back of increased efficiency, increased focus on customers through the Customer Lifecycle Management strategy, an
improved suite of product and service offerings, increased usage of digital channels, continued successes in the commercial sector and streamlined
processes designed to improve turnaround time.
Growth in net interest income of 9% is lower than balance sheet growth driven by liquidity constraints in some markets resulting from certain
country-specific monetary policy actions and increased competition from local players in terms of increased risk appetite and more competitive
pricing strategies.
Strong growth of 14%, excluding the impact of foreign exchange translations, was recorded in loans and advances to customers, with credit cards,
mortgages and personal loans contributing most of this growth. Credit card growth was achieved from entry into four additional markets in the
prior year, resulting in a 15% year-on-year growth in the number of credit card accounts. Mortgage and Personal loan growth was driven by the
establishment of mortgage centres and the implementation of targeted client segment strategies in selected markets where loan sizes are
significant enough and risk levels acceptable. Enhanced operating models and strategies with increased customer engagement and life-cycle
management yielded incremental loan sales and timely top-ups. Commercial loans exhibited strong growth of 22% through increased focus on
trade and working capital products as well as the realisation of opportunities in the agricultural sector.
www.barclaysafrica.com Financial results for the reporting period ended 31 December 2015
93
RBB – Rest of Africafor the reporting period ended 31 December
Financial performance (continued)
Deposits grew by 6%, excluding the impact of foreign exchange translations, given liquidity constraints in some markets and increased competition. Current and savings account portfolios continued to be the driver of growth across most markets, with an 8% year on year growth in the number of current and savings accounts.
Non-interest income improved by 21% to R2 620m (2014: R2 157m), driven by higher transaction volumes, with the card business showing robust growth in card-acquiring turnover and a solid increase in transaction volumes. An increase in FX sales also contributed positively to the overall growth in non-interest income. Regulatory impacts, including Central Bank regulations on fee pricing, somewhat moderated this growth.
Following strong recoveries in the prior year, credit impairments increased 21% to R777m (2014: R641m), resulting in a credit loss ratio of 2,07% (2014: 1,95%). The increase in credit impairments was also driven by the deteriorating economic environment in certain markets, leading to an increase in identified impairments. The increase was partially offset by good collection and recovery strategies.
Operating expenses increased by 7% to R6 143m (2014: R5 766m), which is below the average inflation rates of the underlying markets. This low cost growth was achieved through key cost-saving initiatives and operational efficiencies, in spite of inflationary pressures, restructuring costs incurred and key investments made to grow the business.
Operating environmentThe operating environment for 2015 remained promising, confirming its healthy resilience to internal and external shocks. Demand for borrowings remained positive across the continent and most of the economies we operate in showed steady growth. Some headwinds were present in the operating environment, including:
Security concerns impacting particularly the tourism sector;
Adverse weather conditions affecting the agricultural sector;
Weak commodity prices;
Weakened global demand; and
Tight policy stances impacting inflation and interest rates.
Other aspects of the operating environment impacting the business:
Regulatory changes, including a 400 bps increase of the statutory reserve ratio in Zambia;
Liquidity tightening in various markets;
Inflationary pressures, with particularly high inflation in Ghana and Zambia;
A slowdown in transactional activity in some markets;
Increased competition from local and international banks in a number of markets; and
Changing interest rate environments across various markets.
Business performanceUnderlying business performance continued to show good growth with robust increases in loan and current account sales.
Significant progress has been made on the strategic priorities that were set out at the end of 2014 while tactical programmes were executed to enhance the customer service model and optimise the cost to serve to ultimately improve customer experience. Some key highlights include:
Continued optimisation of the branch network to serve customers more economically and efficiently. We have redesigned and streamlined many key processes in order to reduce turnaround times and promote an improved customer experience.
Delivery of “Paperless Banking” continued across branches in Zambia, Botswana, Tanzania, Kenya, NBC and Ghana. This initiative assists with moving towards improved levels of digitisation with safer and more secure methods of customer identification and verification. In addition it significantly reduces the need for manual and paper-intensive operations, thereby improving efficiency and speed of execution to the benefit of customers.
ATMs available 24 hours all year round, with increased functionalities such as cash acceptance, bill payments and Cash Send now available in all markets, except for Seychelles. This further strengthened customer convenience and the self-service enablement capability.
Sustained the digital strategy through the increased promotion of internet banking and other digital solutions, with biller transaction usage growing exponentially during the year. This added to the efficient use of existing channels and provided customers with more convenient banking capabilities.
“Cash Send” on ATMs is a functionality that allows the ability to withdraw cash through any Barclays ATMs without having to present a bank ATM card or having to hold a bank account. Botswana and Kenya have added the functionality of using “Cash Send” via a mobile phone to send money to those without a bank account.
“Service Guarantees” to customers have been launched in Zambia, Tanzania and Uganda. These warrant a certain minimum level of performance on selected services to customers.
The introduction of an automated Identification & Verification system (ID&V) across nine markets. This solution identifies the customer using his debit card, making transacting quicker, easier and safer.
94 Barclays Africa Group Limited Financial results for the reporting period ended 31 December 2015
RBB – Rest of Africafor the reporting period ended 31 December
Group performance Overview 51 RBB 63Segment performance Per market and geographical
segment
56CIB 95
Risk management WIMI 103Appendices Operational reviews 63Administration and contact details
Business performance (continued)
Continued to develop propositions through delivery and enhancement of tailor-made solutions for customers, including:
Credit and debit cards with Worldmiles benefits have been further enhanced by the launch of the Worldmiles Online Travel Portal, which allows for online redemption thereof.
Remote Account Opening, which enables the opening of an account via an iPad at a remote location, has gained momentum across Ghana, Botswana, Mauritius, Zambia and Kenya.
Customers in Seychelles and Zambia are now able to withdraw money via a POS terminal. This is a first to the market in Seychelles.
Contract lending for expats launched in Uganda.
A self-employed lending policy was approved in Kenya, Mauritius and Botswana.
Deposit products have been enhanced by launching Unfixed Deposits and Upfront Fixed Deposits in some markets.
Zambia launched prepaid cards and an exclusive proposition for the youth, which is unique to the market.
Business banking continued to take advantage of collaborative opportunities to build on successes across segments and initiatives, including:
Retail shared distribution model which helps to transform the branch network from a retail-focused sales and service orientation to an all-inclusive retail and business banking capability. The model will ensure that the needs of business banking clients are met in the branch network.
Corporate and Investment Banking customer value chain utilisation, whereby opportunities were unlocked with key suppliers and distributors of these specific clients.
The “My Shoes Are My Office” initiative which has seen colleagues across the organisation mobilised to spend time with clients at their offices. Since the inception of this initiative, it has gone from strength to strength and has been successfully implemented in four markets. This initiative has had the following benefits since inception:
– Increased visibility to the market and demonstrating a commitment to becoming the Bank of choice in Africa;
– Improvement of customer service levels;
– Enhancement of customer relationships through the introduction to senior leadership;
– Deepening the understanding of customer needs and taking time to engage and listen to customers;
– An opportunity to share the Bank’s vision with customers, thereby increasing market engagement; and
– Growth of pipeline and new customer acquisition.
Looking aheadRBB Rest of Africa’s focus remains on making customers’ lives easier, continuing to refresh core customer value propositions for targeted segments and revamping customer solutions. The strategy focuses on:
Tactical Customer Lifecycle Management. This is the approach adopted to further improve the quality of new to franchise customer acquisition and deepen the relationship with existing customers;
Enhanced digital solutions with a focus on mobile solutions;
Talent mobility. Launch of a unique talent mobility programme which identifies talented individuals and gives them the opportunity to participate in a short-term assignment in another country;
Optimised branch operating model. Continue to build fit-for-purpose branches to ensure we are optimally positioned to serve our customers and reduce service costs;
Delivering a multi-channel franchise through the launch of digital products, ATM enhancements and self-service kiosks;
Accelerating customer adoption of new banking models through the ‘Digital Eagles’ programme;
Continuing to enhance and deliver world-class customer solutions with a particular focus on the transactional and borrowing needs of customers;
Targeting Corporate and Investment Banking customer value chain opportunities;
Continuing to embed and enhance the sector focus approach in commercial and enterprise banking;
Migration of commercial customer transactions to Barclays.Net, an online banking platform for cash management, by leveraging off the successes achieved in South Africa; and
Continuing to focus on broadening business banking propositions given the current low level of penetration and the large potential which exists.
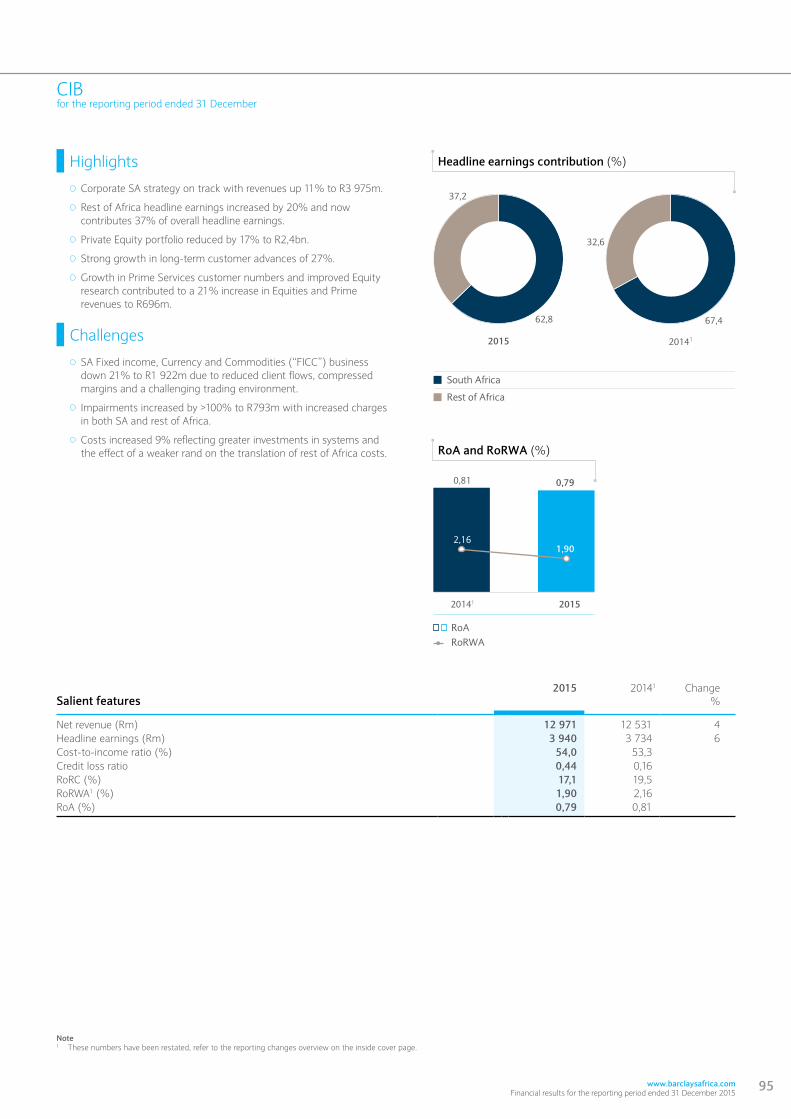
www.barclaysafrica.com Financial results for the reporting period ended 31 December 2015
95
CIBfor the reporting period ended 31 December
Salient features2015 20141 Change
%
Net revenue (Rm) 12 971 12 531 4Headline earnings (Rm) 3 940 3 734 6Cost-to-income ratio (%) 54,0 53,3Credit loss ratio 0,44 0,16RoRC (%) 17,1 19,5RoRWA1 (%) 1,90 2,16RoA (%) 0,79 0,81
Note1 These numbers have been restated, refer to the reporting changes overview on the inside cover page.
0,79
1,90
0,81
2,16
32,6
2015 20141
Headline earnings contribution (%)
� South Africa
� Rest of Africa
62,8
37,2
67,4
RoA and RoRWA (%)
� � RoA RoRWA
20141 2015
Highlights
Corporate SA strategy on track with revenues up 11% to R3 975m.
Rest of Africa headline earnings increased by 20% and now contributes 37% of overall headline earnings.
Private Equity portfolio reduced by 17% to R2,4bn.
Strong growth in long-term customer advances of 27%.
Growth in Prime Services customer numbers and improved Equity research contributed to a 21% increase in Equities and Prime revenues to R696m.
Challenges
SA Fixed income, Currency and Commodities (“FICC”) business down 21% to R1 922m due to reduced client flows, compressed margins and a challenging trading environment.
Impairments increased by >100% to R793m with increased charges in both SA and rest of Africa.
Costs increased 9% reflecting greater investments in systems and the effect of a weaker rand on the translation of rest of Africa costs.
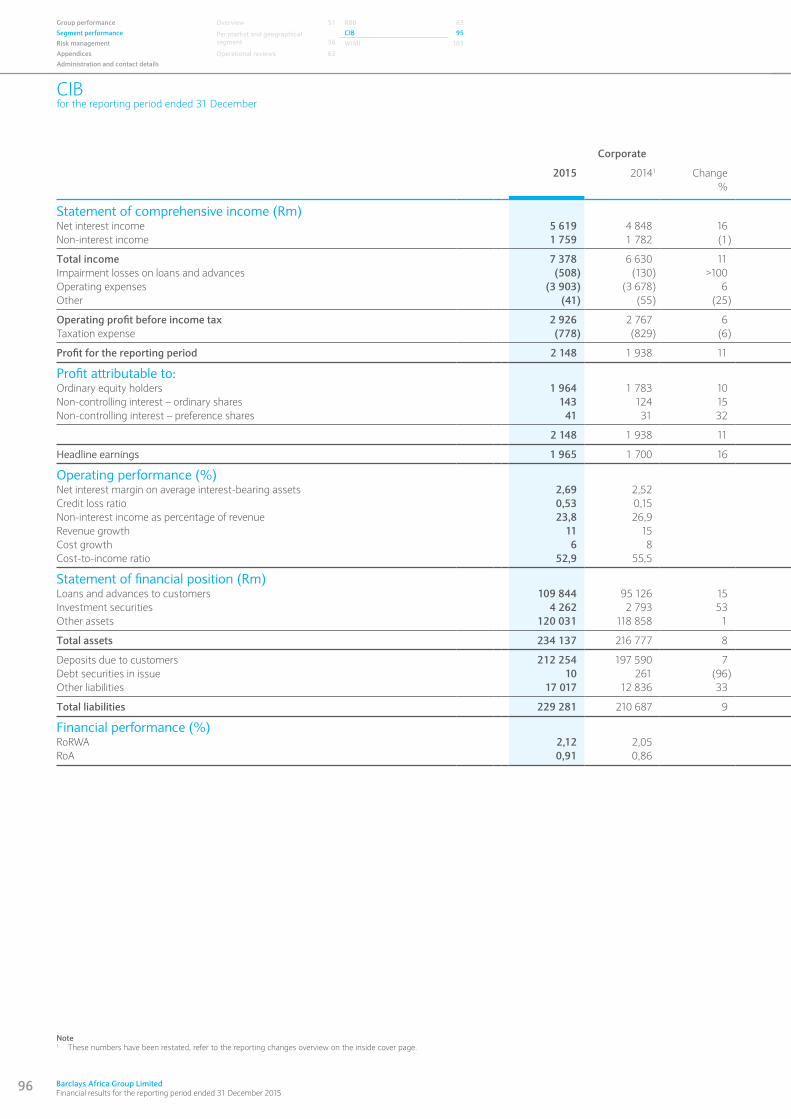
96 Barclays Africa Group Limited Financial results for the reporting period ended 31 December 2015
CIBfor the reporting period ended 31 December
Corporate Investment Bank Total CIB
2015 20141 Change 2015 20141 Change 2015 20141 Change% % %
Statement of comprehensive income (Rm)Net interest income 5 619 4 848 16 2 219 1 429 55 7 838 6 277 25Non-interest income 1 759 1 782 (1) 4 167 4 720 (12) 5 926 6 502 (9)
Total income 7 378 6 630 11 6 386 6 149 4 13 764 12 779 8Impairment losses on loans and advances (508) (130) >100 (285) (118) >100 (793) (248) >100Operating expenses (3 903) (3 678) 6 (3 533) (3 132) 13 (7 436) (6 810) 9Other (41) (55) (25) (107) (55) 95 (148) (110) 35
Operating profit before income tax 2 926 2 767 6 2 461 2 844 (13) 5 387 5 611 (4)Taxation expense (778) (829) (6) (367) (694) (47) (1 145) (1 523) (25)
Profit for the reporting period 2 148 1 938 11 2 094 2 150 (3) 4 242 4 088 4
Profit attributable to:Ordinary equity holders 1 964 1 783 10 1 976 2 034 (3) 3 940 3 817 3Non-controlling interest – ordinary shares 143 124 15 52 47 9 195 171 13Non-controlling interest – preference shares 41 31 32 66 69 (4) 107 100 7
2 148 1 938 11 2 094 2 150 (3) 4 242 4 088 4
Headline earnings 1 965 1 700 16 1 975 2 034 (3) 3 940 3 734 6
Operating performance (%)Net interest margin on average interest-bearing assets 2,69 2,52 1,72 1,06 2,32 1,92Credit loss ratio 0,53 0,15 0,33 0,17 0,44 0,16Non-interest income as percentage of revenue 23,8 26,9 65,3 76,8 43,1 50,9Revenue growth 11 15 4 8 8 12Cost growth 6 8 13 5 9 6Cost-to-income ratio 52,9 55,5 55,3 50,9 54,0 53,3
Statement of financial position (Rm)Loans and advances to customers 109 844 95 126 15 103 781 70 225 48 213 625 165 351 29Investment securities 4 262 2 793 53 15 864 13 111 21 20 126 15 904 27Other assets 120 031 118 858 1 223 519 177 416 26 343 550 296 274 16
Total assets 234 137 216 777 8 343 164 260 752 32 577 301 477 529 21
Deposits due to customers 212 254 197 590 7 29 435 30 106 (2) 241 689 227 696 6Debt securities in issue 10 261 (96) 16 391 11 284 45 16 401 11 545 42Other liabilities 17 017 12 836 33 290 955 214 412 36 307 972 227 248 36
Total liabilities 229 281 210 687 9 336 781 255 802 32 566 062 466 489 21
Financial performance (%)RoRWA 2,12 2,05 1,73 2,27 1,90 2,16RoA 0,91 0,86 0,69 0,78 0,79 0,81
Note1 These numbers have been restated, refer to the reporting changes overview on the inside cover page.
Group performance Overview 51 RBB 63Segment performance Per market and geographical
segment
56CIB 95
Risk management WIMI 103Appendices Operational reviews 63Administration and contact details
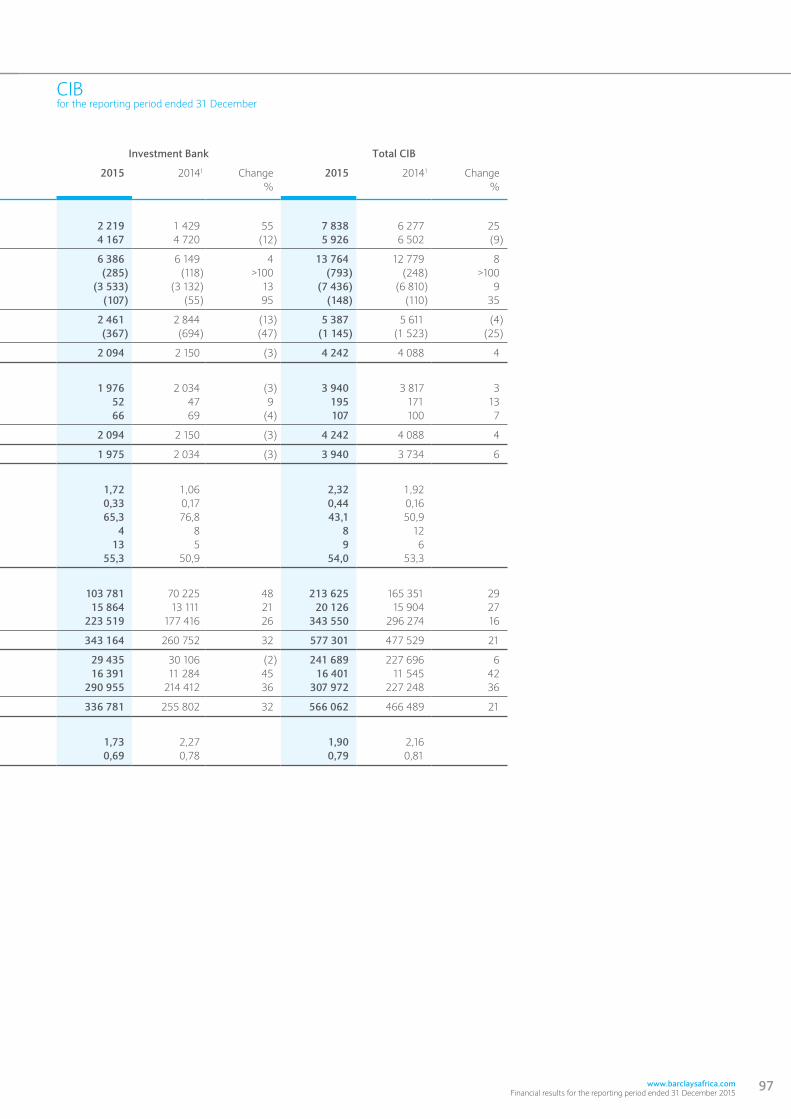
www.barclaysafrica.com Financial results for the reporting period ended 31 December 2015
97
CIBfor the reporting period ended 31 December
Corporate Investment Bank Total CIB
2015 20141 Change 2015 20141 Change 2015 20141 Change% % %
Statement of comprehensive income (Rm)Net interest income 5 619 4 848 16 2 219 1 429 55 7 838 6 277 25Non-interest income 1 759 1 782 (1) 4 167 4 720 (12) 5 926 6 502 (9)
Total income 7 378 6 630 11 6 386 6 149 4 13 764 12 779 8Impairment losses on loans and advances (508) (130) >100 (285) (118) >100 (793) (248) >100Operating expenses (3 903) (3 678) 6 (3 533) (3 132) 13 (7 436) (6 810) 9Other (41) (55) (25) (107) (55) 95 (148) (110) 35
Operating profit before income tax 2 926 2 767 6 2 461 2 844 (13) 5 387 5 611 (4)Taxation expense (778) (829) (6) (367) (694) (47) (1 145) (1 523) (25)
Profit for the reporting period 2 148 1 938 11 2 094 2 150 (3) 4 242 4 088 4
Profit attributable to:Ordinary equity holders 1 964 1 783 10 1 976 2 034 (3) 3 940 3 817 3Non-controlling interest – ordinary shares 143 124 15 52 47 9 195 171 13Non-controlling interest – preference shares 41 31 32 66 69 (4) 107 100 7
2 148 1 938 11 2 094 2 150 (3) 4 242 4 088 4
Headline earnings 1 965 1 700 16 1 975 2 034 (3) 3 940 3 734 6
Operating performance (%)Net interest margin on average interest-bearing assets 2,69 2,52 1,72 1,06 2,32 1,92Credit loss ratio 0,53 0,15 0,33 0,17 0,44 0,16Non-interest income as percentage of revenue 23,8 26,9 65,3 76,8 43,1 50,9Revenue growth 11 15 4 8 8 12Cost growth 6 8 13 5 9 6Cost-to-income ratio 52,9 55,5 55,3 50,9 54,0 53,3
Statement of financial position (Rm)Loans and advances to customers 109 844 95 126 15 103 781 70 225 48 213 625 165 351 29Investment securities 4 262 2 793 53 15 864 13 111 21 20 126 15 904 27Other assets 120 031 118 858 1 223 519 177 416 26 343 550 296 274 16
Total assets 234 137 216 777 8 343 164 260 752 32 577 301 477 529 21
Deposits due to customers 212 254 197 590 7 29 435 30 106 (2) 241 689 227 696 6Debt securities in issue 10 261 (96) 16 391 11 284 45 16 401 11 545 42Other liabilities 17 017 12 836 33 290 955 214 412 36 307 972 227 248 36
Total liabilities 229 281 210 687 9 336 781 255 802 32 566 062 466 489 21
Financial performance (%)RoRWA 2,12 2,05 1,73 2,27 1,90 2,16RoA 0,91 0,86 0,69 0,78 0,79 0,81
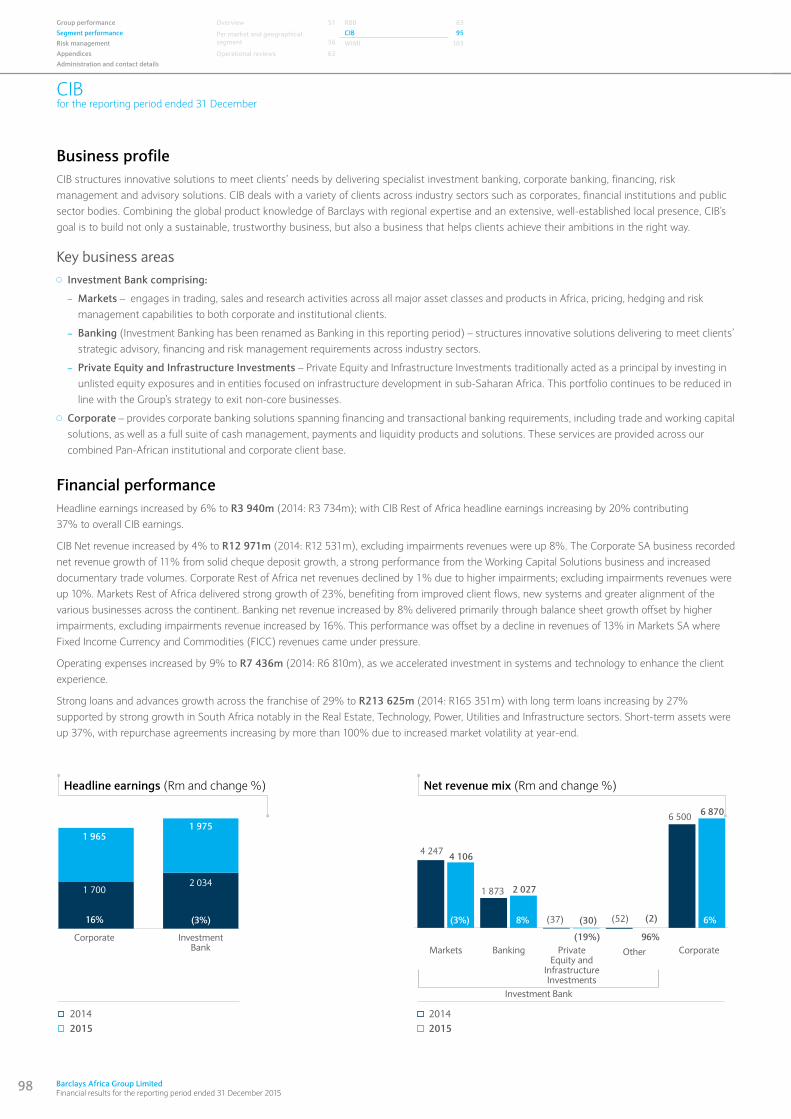
98 Barclays Africa Group Limited Financial results for the reporting period ended 31 December 2015
CIBfor the reporting period ended 31 December
Business profileCIB structures innovative solutions to meet clients’ needs by delivering specialist investment banking, corporate banking, financing, risk management and advisory solutions. CIB deals with a variety of clients across industry sectors such as corporates, financial institutions and public sector bodies. Combining the global product knowledge of Barclays with regional expertise and an extensive, well-established local presence, CIB’s goal is to build not only a sustainable, trustworthy business, but also a business that helps clients achieve their ambitions in the right way.
Key business areas Investment Bank comprising:
– Markets – engages in trading, sales and research activities across all major asset classes and products in Africa, pricing, hedging and risk management capabilities to both corporate and institutional clients.
– Banking (Investment Banking has been renamed as Banking in this reporting period) – structures innovative solutions delivering to meet clients’ strategic advisory, financing and risk management requirements across industry sectors.
– Private Equity and Infrastructure Investments – Private Equity and Infrastructure Investments traditionally acted as a principal by investing in unlisted equity exposures and in entities focused on infrastructure development in sub-Saharan Africa. This portfolio continues to be reduced in line with the Group’s strategy to exit non-core businesses.
Corporate – provides corporate banking solutions spanning financing and transactional banking requirements, including trade and working capital solutions, as well as a full suite of cash management, payments and liquidity products and solutions. These services are provided across our combined Pan-African institutional and corporate client base.
Financial performanceHeadline earnings increased by 6% to R3 940m (2014: R3 734m); with CIB Rest of Africa headline earnings increasing by 20% contributing 37% to overall CIB earnings.
CIB Net revenue increased by 4% to R12 971m (2014: R12 531m), excluding impairments revenues were up 8%. The Corporate SA business recorded net revenue growth of 11% from solid cheque deposit growth, a strong performance from the Working Capital Solutions business and increased documentary trade volumes. Corporate Rest of Africa net revenues declined by 1% due to higher impairments; excluding impairments revenues were up 10%. Markets Rest of Africa delivered strong growth of 23%, benefiting from improved client flows, new systems and greater alignment of the various businesses across the continent. Banking net revenue increased by 8% delivered primarily through balance sheet growth offset by higher impairments, excluding impairments revenue increased by 16%. This performance was offset by a decline in revenues of 13% in Markets SA where Fixed Income Currency and Commodities (FICC) revenues came under pressure.
Operating expenses increased by 9% to R7 436m (2014: R6 810m), as we accelerated investment in systems and technology to enhance the client experience.
Strong loans and advances growth across the franchise of 29% to R213 625m (2014: R165 351m) with long term loans increasing by 27% supported by strong growth in South Africa notably in the Real Estate, Technology, Power, Utilities and Infrastructure sectors. Short-term assets were up 37%, with repurchase agreements increasing by more than 100% due to increased market volatility at year-end.
6 870
(2)(30)
2 027
4 106
6 500
(52)(37)
1 873
4 247
Investment Bank
CorporateOtherPrivateEquity and
InfrastructureInvestments
BankingMarkets96%
6%8%(3%)
(19%)
1 9651 975
1 7002 034
(3%)16%
InvestmentBank
Corporate
� 2014� 2015
� 2014� 2015
Headline earnings (Rm and change %) Net revenue mix (Rm and change %)
Group performance Overview 51 RBB 63Segment performance Per market and geographical
segment
56CIB 95
Risk management WIMI 103Appendices Operational reviews 63Administration and contact details
www.barclaysafrica.com Financial results for the reporting period ended 31 December 2015
99
CIBfor the reporting period ended 31 December
Financial performance (continued)
Operating environment
Global growth looks to have picked up marginally during 2015 to 3,1%, supported by activity in advanced economies, while global inflation remained muted on further falls in commodity prices. The US economy is expected to have grown by 2,4% in the year, and the Federal Reserve announced the first rise in the Fed Funds rate since 2006, ending the zero rate policy in place since late 2008. Conversely, monetary policy was eased in the euro area during the year. Uncertainties over the health of the Chinese economy and market concerns surrounding the US rate rise together generated significant turmoil in global markets during 2015.
South Africa’s quarterly economic growth returned to positive in Q3, alleviating immediate fears of a recession, but with full-year economic growth forecast at just 1,3%, the economy’s performance in 2015 looks to have been the weakest since the 2009 recession. The acute electricity supply problems around mid-year, the worst drought in more than a century and sharply lower base and precious metals prices all impacted the supply side of the economy.
Business confidence faltered further in 2015 across sectors, contributing to weak private sector investment growth and anaemic employment growth. Consumer confidence was similarly weak in the year, impacting consumption and investment plans.
The rand depreciated against major currencies ending the year at R15,47 to the US dollar, having lost a quarter of its value during the year.
Growth in the Barclays Africa markets in the rest of Africa moderated further due to lower commodity prices and an adverse external environment. Fiscal and current account balances remain fragile in a number of countries, which, together with the broader domestic and global environment, resulted in a number of currencies weakening significantly. During 2015 monetary policy rates were raised in Ghana, Kenya, Mozambique, Uganda and Zambia, in response to currency pressures and upward inflation, and cut in Botswana and Mauritius in response to growth concerns.
Business performance
OverviewCIB has made progress on its Pan African strategy with operations in the rest of Africa increasing their contribution to revenue from 33% in 2014 to 34% in 2015. The business has also made significant advancements by upgrading the IT environment through major systems implementations. These achievements were accomplished against the backdrop of a challenging economic climate underpinned by lower commodity prices, considerable market volatility and moderating economic growth in presence countries.
The strategy to grow the Corporate Bank in South Africa is gaining momentum with 2015 being the third successive year of double-digit revenue growth in this business. Barclays.Net, our primary online banking platform for cash management, is now implemented in South Africa and client migrations to the platform are progressing.
During the course of the reporting period, CIB has entrenched client-centricity and technological innovation into the constructs of the firm. The early results of these long-term ambitions are evidenced by the numerous accolades achieved across the various product houses, examples of which are listed below.
Best M&A House both for EMEA & Africa, EMEA Finance.
Best bond house in Africa, EMEA Finance.
Best Emerging Bank in Mauritius for 2015, Global Finance.
Best Africa Debt House, Euromoney Awards for Excellence.
Best Fixed income and Currencies House, JSE Spire Awards.
Best Research House, JSE Spire Awards.
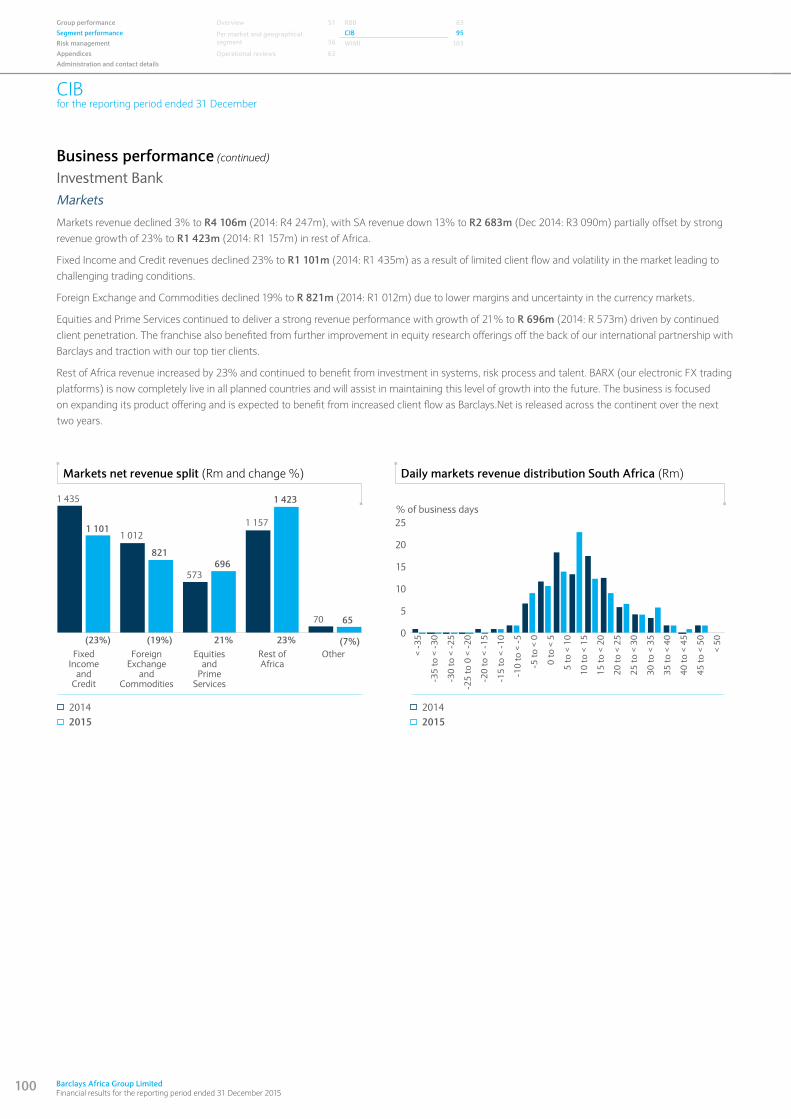
100 Barclays Africa Group Limited Financial results for the reporting period ended 31 December 2015
CIBfor the reporting period ended 31 December
Business performance (continued)
Investment BankMarkets
Markets revenue declined 3% to R4 106m (2014: R4 247m), with SA revenue down 13% to R2 683m (Dec 2014: R3 090m) partially offset by strong revenue growth of 23% to R1 423m (2014: R1 157m) in rest of Africa.
Fixed Income and Credit revenues declined 23% to R1 101m (2014: R1 435m) as a result of limited client flow and volatility in the market leading to challenging trading conditions.
Foreign Exchange and Commodities declined 19% to R 821m (2014: R1 012m) due to lower margins and uncertainty in the currency markets.
Equities and Prime Services continued to deliver a strong revenue performance with growth of 21% to R 696m (2014: R 573m) driven by continued client penetration. The franchise also benefited from further improvement in equity research offerings off the back of our international partnership with Barclays and traction with our top tier clients.
Rest of Africa revenue increased by 23% and continued to benefit from investment in systems, risk process and talent. BARX (our electronic FX trading platforms) is now completely live in all planned countries and will assist in maintaining this level of growth into the future. The business is focused on expanding its product offering and is expected to benefit from increased client flow as Barclays.Net is released across the continent over the next two years.
Rest ofAfrica
OtherEquitiesand
PrimeServices
ForeignExchange
andCommodities
FixedIncome
andCredit
1 423
696821
1 101
0
5
10
15
20
25
< -3
5
-35
to <
-30
-30
to <
-25
-25
to 0
< -
20
-20
to <
-15
-15
to <
-10
-10
to <
-5
-5 to
< 0
0 to
< 5
5 to
< 1
0
10 to
< 1
5
15 to
< 2
0
20 to
< 2
5
25 to
< 3
0
30 to
< 3
5
35 to
< 4
0
40 to
< 4
5
45 to
< 5
0
< 5
0
% of business days
23%21%(19%)(23%)
65
1 157
573
1 012
1 435
70
(7%)
� 2014� 2015
� 2014� 2015
Markets net revenue split (Rm and change %) Daily markets revenue distribution South Africa (Rm)
Group performance Overview 51 RBB 63Segment performance Per market and geographical
segment
56CIB 95
Risk management WIMI 103Appendices Operational reviews 63Administration and contact details
www.barclaysafrica.com Financial results for the reporting period ended 31 December 2015
101
CIBfor the reporting period ended 31 December
Business performance (continued)
Investment Bank (continued)
Banking
Banking delivered a strong performance in 2015, primarily through debt financing for clients, arising from deepened client relationships and high levels of crossborder client activity with net revenue growing 8% to R2 026m (2014: R1 873m). Excluding impairments, gross revenue grew by 16%.
Margin business revenue grew 19% to R1 927m (2014: R1 620m), notably in the DCM, Loans and Preference Share portfolios. Impairments increased as a consequence of the deteriorating economic environment.
Fee business revenue was underpinned by M&A and further renewable energy mandates, offset by Equity Capital Markets. There is a healthy mandated fee pipeline carrying over into 2016.
In the Rest of Africa, fee revenue increased by >100% albeit off a low base, as we invest in our core client relationships, benefiting the wider CIB Africa franchise.
2015 2014 ChangeSalient features %
Gross revenue (Rm) 2 309 1 989 16
Margin business (Rm) 1 927 1 620 19 Fee business (Rm) 382 369 4
Credit impairment (Rm) (283) (116) >100
Net revenue (Rm) 2 026 1 873 8
Average loans and advances (Rbn) 66,7 57,4 16
Private Equity and Infrastructure Investments
Private Equity and Infrastructure Investments reported a net loss of R30m (2014: R37m) primarily driven by negative revaluations affecting certain investments. This was offset by positive realisations as the non-core portfolio continues to be disposed of.
2015 2014 ChangeSalient features %
Revaluations (Rm) (202) (124) 63Realisations, dividends, interest and fees (Rm) 200 125 60Funding (Rm) (28) (38) (26)
Net revenue (Rm) (30) (37) (19)
Total portfolio size (Rbn) 2,4 2,9 (17)
102 Barclays Africa Group Limited Financial results for the reporting period ended 31 December 2015
CIBfor the reporting period ended 31 December
Business performance (continued)
CorporateCorporate net revenue increased by 6% to R6 870m (2014: R6 500m) with SA up 11% and rest of Africa marginally down by 1%.
Net revenue growth in South Africa was driven by higher cheque account deposit balances on the back of increased transactional volumes through client acquisition and retention initiatives, as well as improved margins on Working capital products. Net revenue further benefited from increased market share on import Documentary trade business and Structured trade and commodity finance book growth of more than 100%.
Net revenue in rest of Africa was adversely impacted by higher impairments on mining and commodity exposures. Revenue excluding impairments increased by 10% to R3 332m (2014: R3 017m), driven by strong balance sheet growth.
2015 2014
Salient featuresSouthAfrica
Rest ofAfrica Total
SouthAfrica
Rest ofAfrica Total
Change%
Gross revenue (Rm) 4 046 3 332 7 378 3 613 3 017 6 630 11Credit impairments (Rm) (71) (437) (508) (47) (83) (130) >100
Net revenue (Rm) 3 975 2 895 6 870 3 566 2 934 6 500 6
Average loans and advances to customers (Rbn) 61,3 33,8 95,1 56,4 29,3 85,7 11Average deposits due to customers (Rbn) 147,5 49,7 197,2 142,9 46,3 189,2 4
Looking aheadThe strategy will remain consistent for the year ahead, further emphasizing the principle of keeping clients at the core of our decision-making. We will focus on the following:
The revamped client coverage structure will be fully leveraged to drive client commitment and facilitate more efficient and easier transactions
Further develop the people culture founded on the values of the group to create a diverse and dynamic environment and become the employer of choice for current and future colleagues.
CIB is committing to being more than a bank by developing sustainable solutions for communities in which we operate to help people realise their ambitions.
Building innovative digital solutions and the development of an ‘E-Bank’ which will enable clients to grow and manage their business through cost-effectiveness, transparency and efficiency.
Unlock access to firm’s data and enhance analytic capability for decisions both internally and for clients.
CIB will respond to the challenging economic environment by applying a responsible credit criteria and disciplined cost management.
Continued pursuit to future proof the business ensuring it evolves within the rapidly changing environment.
Group performance Overview 51 RBB 63Segment performance Per market and geographical
segment
56CIB 95
Risk management WIMI 103Appendices Operational reviews 63Administration and contact details
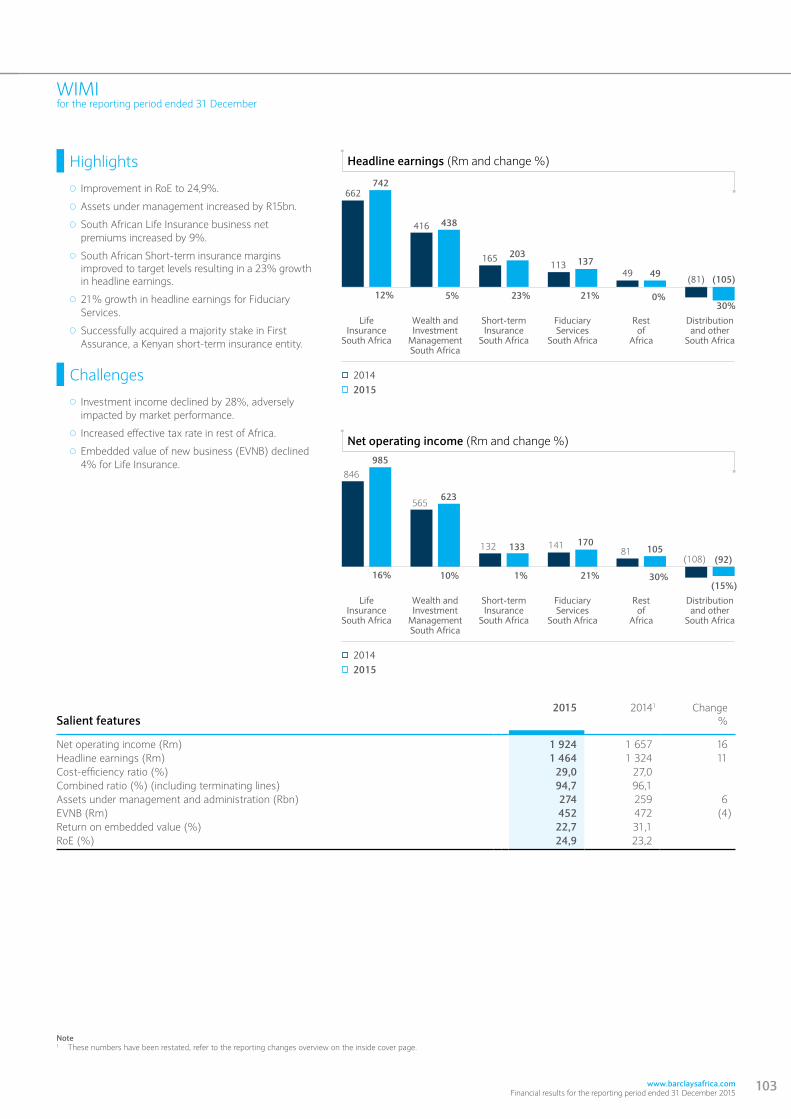
www.barclaysafrica.com Financial results for the reporting period ended 31 December 2015
103
WIMIfor the reporting period ended 31 December
Highlights
Improvement in RoE to 24,9%.
Assets under management increased by R15bn.
South African Life Insurance business net premiums increased by 9%.
South African Short-term insurance margins improved to target levels resulting in a 23% growth in headline earnings.
21% growth in headline earnings for Fiduciary Services.
Successfully acquired a majority stake in First Assurance, a Kenyan short-term insurance entity.
Challenges
Investment income declined by 28%, adversely impacted by market performance.
Increased effective tax rate in rest of Africa.
Embedded value of new business (EVNB) declined 4% for Life Insurance.
662
416
165113
49(81)
742
438
203137
49(105)
Distributionand other
South Africa
Restof
Africa
FiduciaryServices
South Africa
Short-termInsurance
South Africa
Wealth andInvestment
ManagementSouth Africa
LifeInsurance
South Africa
12% 5% 23% 21% 0%30%
� 2014� 2015
Headline earnings (Rm and change %)
846
565
132 14181
(108)
Distributionand other
South Africa
Restof
Africa
FiduciaryServices
South Africa
Short-termInsurance
South Africa
Wealth andInvestment
ManagementSouth Africa
LifeInsurance
South Africa
16% 10% 1% 21% 30%(15%)
� 2014� 2015
Net operating income (Rm and change %)
985
623
133 170105
(92)
Salient features2015 20141 Change
%
Net operating income (Rm) 1 924 1 657 16 Headline earnings (Rm) 1 464 1 324 11 Cost-efficiency ratio (%) 29,0 27,0Combined ratio (%) (including terminating lines) 94,7 96,1Assets under management and administration (Rbn) 274 259 6 EVNB (Rm) 452 472 (4)Return on embedded value (%) 22,7 31,1RoE (%) 24,9 23,2
Note1 These numbers have been restated, refer to the reporting changes overview on the inside cover page.
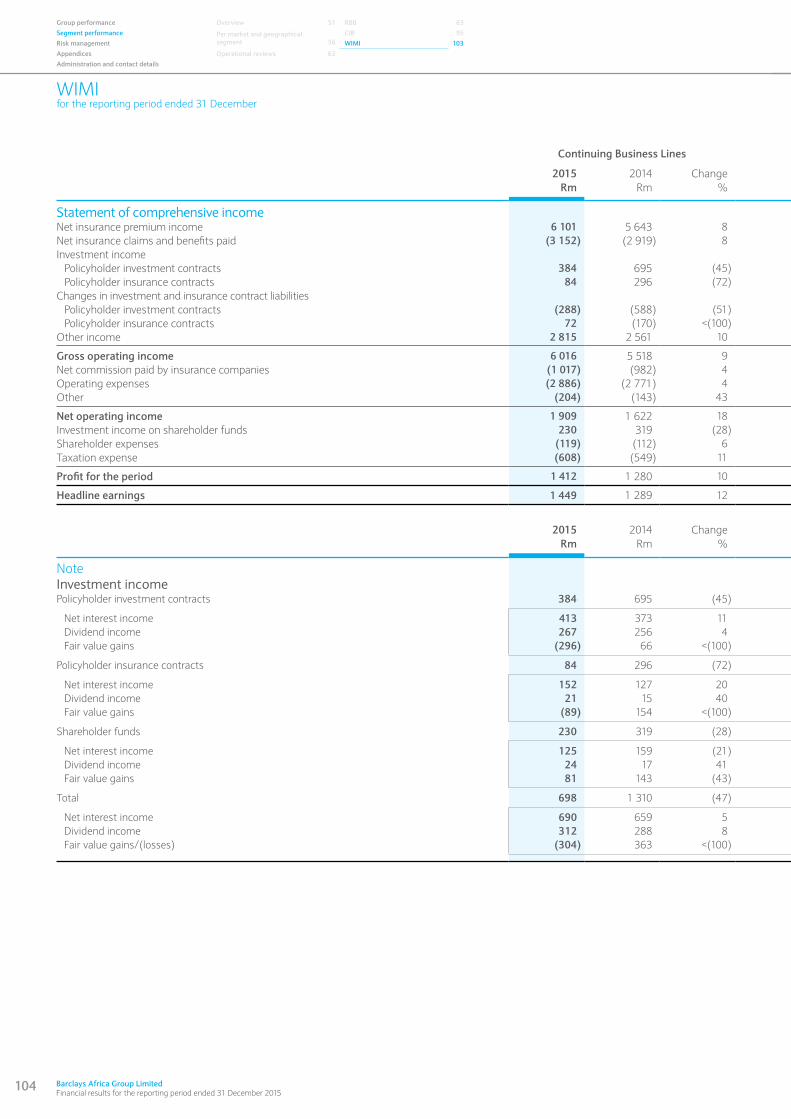
104 Barclays Africa Group Limited Financial results for the reporting period ended 31 December 2015
WIMIfor the reporting period ended 31 December
Group performance Overview 51 RBB 63Segment performance Per market and geographical
segment
56CIB 95
Risk management WIMI 103Appendices Operational reviews 63Administration and contact details
Continuing Business Lines Terminating Business Lines Total WIMI
2015 2014 Change 2015 2014 Change 2015 2014 ChangeRm Rm % Rm Rm % Rm Rm %
Statement of comprehensive income Net insurance premium income 6 101 5 643 8 (79) 121 <(100) 6 022 5 764 4 Net insurance claims and benefits paid (3 152) (2 919) 8 47 (97) <(100) (3 105) (3 016) 3 Investment income
Policyholder investment contracts 384 695 (45) — — — 384 695 (45)Policyholder insurance contracts 84 296 (72) 1 3 (67) 85 299 (72)
Changes in investment and insurance contract liabilitiesPolicyholder investment contracts (288) (588) (51) — — — (288) (588) (51)Policyholder insurance contracts 72 (170) <(100) — — — 72 (170) <(100)
Other income 2 815 2 561 10 5 2 >100 2 820 2 563 10
Gross operating income 6 016 5 518 9 (26) 29 <(100) 5 990 5 547 8 Net commission paid by insurance companies (1 017) (982) 4 54 22 >100 (963) (960) 0Operating expenses (2 886) (2 771) 4 (13) (16) (19) (2 899) (2 787) 4 Other (204) (143) 43 — — — (204) (143) 43
Net operating income 1 909 1 622 18 15 35 (57) 1 924 1 657 16 Investment income on shareholder funds 230 319 (28) — — — 230 319 (28)Shareholder expenses (119) (112) 6 — — — (119) (112) 6 Taxation expense (608) (549) 11 — — — (608) (549) 11
Profit for the period 1 412 1 280 10 15 35 (57) 1 427 1 315 9
Headline earnings 1 449 1 289 12 15 35 (57) 1 464 1 324 11
2015 2014 Change 2015 2014 Change 2015 2014 ChangeRm Rm % Rm Rm % Rm Rm %
Note Investment income Policyholder investment contracts 384 695 (45) — — — 384 695 (45)
Net interest income 413 373 11 — — — 413 373 11 Dividend income 267 256 4 — — — 267 256 4 Fair value gains (296) 66 <(100) — — — (296) 66 <(100)
Policyholder insurance contracts 84 296 (72) 1 3 (67) 85 299 (72)
Net interest income 152 127 20 1 3 (67) 153 130 18 Dividend income 21 15 40 — — — 21 15 40 Fair value gains (89) 154 <(100) — — — (89) 154 <(100)
Shareholder funds 230 319 (28) — — — 230 319 (28)
Net interest income 125 159 (21) — — — 125 159 (21)Dividend income 24 17 41 — — — 24 17 41 Fair value gains 81 143 (43) — — — 81 143 (43)
Total 698 1 310 (47) 1 3 (67) 699 1 313 (47)
Net interest income 690 659 5 1 3 (67) 691 662 4 Dividend income 312 288 8 — — — 312 288 8 Fair value gains/(losses) (304) 363 <(100) — — — (304) 363 < (100)
www.barclaysafrica.com Financial results for the reporting period ended 31 December 2015
105

This page has been left blank intentionally
www.barclaysafrica.com Financial results for the reporting period ended 31 December 2015
106
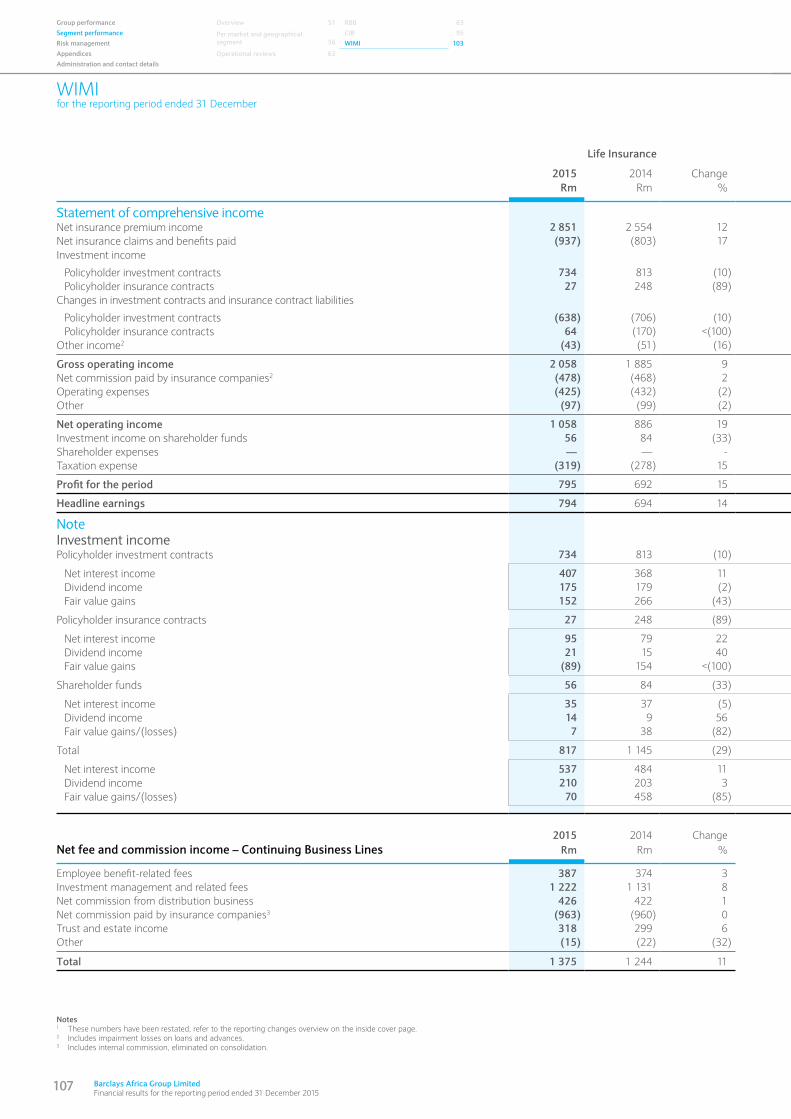
WIMIfor the reporting period ended 31 December
Group performance Overview 51 RBB 63Segment performance Per market and geographical
segment
56CIB 95
Risk management WIMI 103Appendices Operational reviews 63Administration and contact details
Notes 1 These numbers have been restated, refer to the reporting changes overview on the inside cover page.2 Includes impairment losses on loans and advances.3 Includes internal commission, eliminated on consolidation.
108 Barclays Africa Group Limited Financial results for the reporting period ended 31 December 2015
107 Barclays Africa Group Limited Financial results for the reporting period ended 31 December 2015
Life Insurance Wealth and Investment Management Short-term Insurance Fiduciary Services Distribution Other Total Continuing Business Lines
2015 2014 Change 2015 20141 Change 2015 20141 Change 2015 2014 Change 2015 2014 Change 2015 2014 Change 2015 20141 ChangeRm Rm % Rm Rm % Rm Rm % Rm Rm % Rm Rm % Rm Rm % Rm Rm %
Statement of comprehensive income Net insurance premium income 2 851 2 554 12 — — — 3 246 3 080 5 4 9 (56) — — — — — — 6 101 5 643 8Net insurance claims and benefits paid (937) (803) 17 — — — (2 214) (2 115) 5 (1) (1) — — — — — — — (3 152) (2 919) 8Investment income
Policyholder investment contracts 734 813 (10) — — — — — — — — — — — — (350) (118) >100 384 695 (45)Policyholder insurance contracts 27 248 (89) — — — 57 48 19 — — — — — — — — — 84 296 (72)
Changes in investment contracts and insurance contract liabilities
Policyholder investment contracts (638) (706) (10) — — — — — — — — — — — — 350 118 >100 (288) (588) (51)Policyholder insurance contracts 64 (170) <(100) — — — — — — — — — — — — 8 — — 72 (170) <(100)
Other income2 (43) (51) (16) 1 590 1 430 11 73 52 40 706 674 5 487 452 8 2 4 (50) 2 815 2 561 10
Gross operating income 2 058 1 885 9 1 590 1 430 11 1 162 1 065 9 709 682 4 487 452 8 10 4 >100 6 016 5 518 9Net commission paid by insurance companies2 (478) (468) 2 — — — (538) (513) 5 — (1) <(100) — — — — — — (1 017) (982) 4Operating expenses (425) (432) (2) (957) (856) 12 (349) (382) (9) (528) (534) (1) (475) (501) (5) (153) (66) >100 (2 886) (2 771) 6Other (97) (99) (2) (10) (9) 11 (74) (10) >100 (11) (2) >100 (9) (11) (18) (3) (12) (75) (204) (143) 43
Net operating income 1 058 886 19 623 565 10 201 160 26 170 145 17 3 (60) <(100) (146) (74) 97 1 909 1 622 18Investment income on shareholder funds 56 84 (33) (3) 21 <(100) 76 84 (10) 20 15 33 6 5 20 75 110 (32) 230 319 (28)Shareholder expenses — — - — — — — — — — — — — — — (119) (112) (6) (119) (112) 6Taxation expense (319) (278) 15 (176) (164) 7 (83) (79) 5 (54) (43) 26 — (1) <(100) 24 16 50 (608) (549) 11
Profit for the period 795 692 15 444 422 5 194 165 18 136 117 16 9 (56) <(100) (166) (60) >100 1 412 1 280 10
Headline earnings 794 694 14 438 416 5 237 169 40 137 117 17 9 (56) <(100) (166) (51) >100 1 449 1 289 12
NoteInvestment incomePolicyholder investment contracts 734 813 (10) — — — — — — — — — — — — (350) (118) >100 384 695 (45)
Net interest income 407 368 11 — — — — — — — — — — — — 6 5 20 413 373 11Dividend income 175 179 (2) — — — — — — — — — — — — 92 77 19 267 256 4Fair value gains 152 266 (43) — — — — — — — — — — — — (448) (200) >100 (296) 66 <(100)
Policyholder insurance contracts 27 248 (89) — — — 57 48 19 — — — — — — — — — 84 296 (71)
Net interest income 95 79 22 — — — 57 48 19 — — — — — — — — — 152 127 20Dividend income 21 15 40 — — — — — — — — — — — — — — — 21 15 40Fair value gains (89) 154 <(100) — — — — — — — — — — — — — — — (89) 154 <(100)
Shareholder funds 56 84 (33) (3) 21 <(100) 76 84 (10) 20 15 33 6 5 20 75 110 (32) 230 319 (28)
Net interest income 35 37 (5) (7) 26 <(100) 80 80 — 4 3 33 — — — 13 13 — 125 159 (21)Dividend income 14 9 56 — — — 10 8 25 — — — — — — — — — 24 17 41Fair value gains/(losses) 7 38 (82) 4 (5) <(100) (14) (4) >100 16 12 33 6 5 20 62 97 (36) 81 143 (43)
Total 817 1 145 (29) (3) 21 <(100) 133 132 1 20 15 33 6 5 20 (275) (8) >100 698 1 310 (47)
Net interest income 537 484 11 (7) 26 <(100) 137 128 7 4 3 33 — — — 19 18 6 690 659 5Dividend income 210 203 3 — — — 10 8 25 — — — — — — 92 77 19 312 288 8Fair value gains/(losses) 70 458 (85) 4 (5) <(100) (14) (4) >100 16 12 33 6 5 20 (386) (103) >100 (304) 363 <(100)
2015 2014 ChangeNet fee and commission income – Continuing Business Lines Rm Rm %
Employee benefit-related fees 387 374 3Investment management and related fees 1 222 1 131 8Net commission from distribution business 426 422 1Net commission paid by insurance companies3 (963) (960) 0Trust and estate income 318 299 6Other (15) (22) (32)
Total 1 375 1 244 11
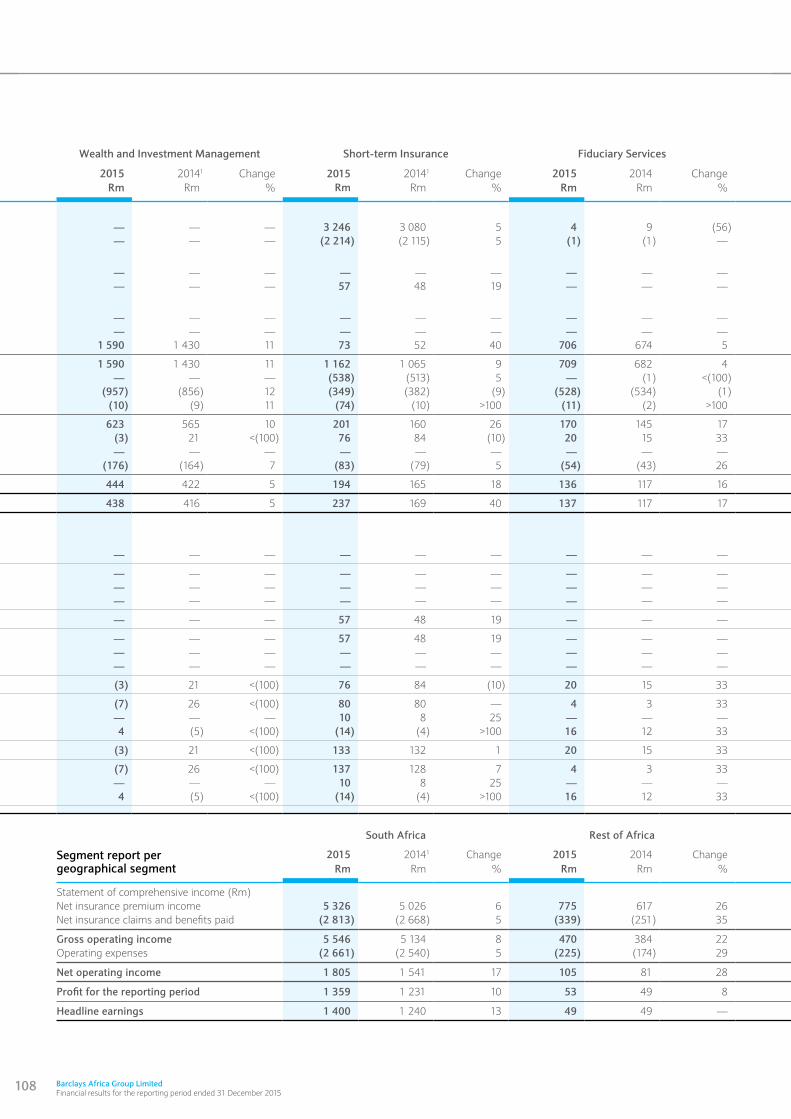
108 Barclays Africa Group Limited Financial results for the reporting period ended 31 December 2015
Life Insurance Wealth and Investment Management Short-term Insurance Fiduciary Services Distribution Other Total Continuing Business Lines
2015 2014 Change 2015 20141 Change 2015 20141 Change 2015 2014 Change 2015 2014 Change 2015 2014 Change 2015 20141 ChangeRm Rm % Rm Rm % Rm Rm % Rm Rm % Rm Rm % Rm Rm % Rm Rm %
Statement of comprehensive income Net insurance premium income 2 851 2 554 12 — — — 3 246 3 080 5 4 9 (56) — — — — — — 6 101 5 643 8Net insurance claims and benefits paid (937) (803) 17 — — — (2 214) (2 115) 5 (1) (1) — — — — — — — (3 152) (2 919) 8Investment income
Policyholder investment contracts 734 813 (10) — — — — — — — — — — — — (350) (118) >100 384 695 (45)Policyholder insurance contracts 27 248 (89) — — — 57 48 19 — — — — — — — — — 84 296 (72)
Changes in investment contracts and insurance contract liabilities
Policyholder investment contracts (638) (706) (10) — — — — — — — — — — — — 350 118 >100 (288) (588) (51)Policyholder insurance contracts 64 (170) <(100) — — — — — — — — — — — — 8 — — 72 (170) <(100)
Other income2 (43) (51) (16) 1 590 1 430 11 73 52 40 706 674 5 487 452 8 2 4 (50) 2 815 2 561 10
Gross operating income 2 058 1 885 9 1 590 1 430 11 1 162 1 065 9 709 682 4 487 452 8 10 4 >100 6 016 5 518 9Net commission paid by insurance companies2 (478) (468) 2 — — — (538) (513) 5 — (1) <(100) — — — — — — (1 017) (982) 4Operating expenses (425) (432) (2) (957) (856) 12 (349) (382) (9) (528) (534) (1) (475) (501) (5) (153) (66) >100 (2 886) (2 771) 6Other (97) (99) (2) (10) (9) 11 (74) (10) >100 (11) (2) >100 (9) (11) (18) (3) (12) (75) (204) (143) 43
Net operating income 1 058 886 19 623 565 10 201 160 26 170 145 17 3 (60) <(100) (146) (74) 97 1 909 1 622 18Investment income on shareholder funds 56 84 (33) (3) 21 <(100) 76 84 (10) 20 15 33 6 5 20 75 110 (32) 230 319 (28)Shareholder expenses — — - — — — — — — — — — — — — (119) (112) (6) (119) (112) 6Taxation expense (319) (278) 15 (176) (164) 7 (83) (79) 5 (54) (43) 26 — (1) <(100) 24 16 50 (608) (549) 11
Profit for the period 795 692 15 444 422 5 194 165 18 136 117 16 9 (56) <(100) (166) (60) >100 1 412 1 280 10
Headline earnings 794 694 14 438 416 5 237 169 40 137 117 17 9 (56) <(100) (166) (51) >100 1 449 1 289 12
NoteInvestment incomePolicyholder investment contracts 734 813 (10) — — — — — — — — — — — — (350) (118) >100 384 695 (45)
Net interest income 407 368 11 — — — — — — — — — — — — 6 5 20 413 373 11Dividend income 175 179 (2) — — — — — — — — — — — — 92 77 19 267 256 4Fair value gains 152 266 (43) — — — — — — — — — — — — (448) (200) >100 (296) 66 <(100)
Policyholder insurance contracts 27 248 (89) — — — 57 48 19 — — — — — — — — — 84 296 (71)
Net interest income 95 79 22 — — — 57 48 19 — — — — — — — — — 152 127 20Dividend income 21 15 40 — — — — — — — — — — — — — — — 21 15 40Fair value gains (89) 154 <(100) — — — — — — — — — — — — — — — (89) 154 <(100)
Shareholder funds 56 84 (33) (3) 21 <(100) 76 84 (10) 20 15 33 6 5 20 75 110 (32) 230 319 (28)
Net interest income 35 37 (5) (7) 26 <(100) 80 80 — 4 3 33 — — — 13 13 — 125 159 (21)Dividend income 14 9 56 — — — 10 8 25 — — — — — — — — — 24 17 41Fair value gains/(losses) 7 38 (82) 4 (5) <(100) (14) (4) >100 16 12 33 6 5 20 62 97 (36) 81 143 (43)
Total 817 1 145 (29) (3) 21 <(100) 133 132 1 20 15 33 6 5 20 (275) (8) >100 698 1 310 (47)
Net interest income 537 484 11 (7) 26 <(100) 137 128 7 4 3 33 — — — 19 18 6 690 659 5Dividend income 210 203 3 — — — 10 8 25 — — — — — — 92 77 19 312 288 8Fair value gains/(losses) 70 458 (85) 4 (5) <(100) (14) (4) >100 16 12 33 6 5 20 (386) (103) >100 (304) 363 <(100)
Total Continuing Business LinesSouth Africa Rest of Africa
Segment report per geographical segment
2015 20141 Change 2015 2014 Change 2015 20141 ChangeRm Rm % Rm Rm % Rm Rm %
Statement of comprehensive income (Rm)Net insurance premium income 5 326 5 026 6 775 617 26 6 101 5 643 8 Net insurance claims and benefits paid (2 813) (2 668) 5 (339) (251) 35 (3 152) (2 919) 8
Gross operating income 5 546 5 134 8 470 384 22 6 012 5 518 9 Operating expenses (2 661) (2 540) 5 (225) (174) 29 (2 887) (2 771) 4
Net operating income 1 805 1 541 17 105 81 28 1 909 1 622 18
Profit for the reporting period 1 359 1 231 10 53 49 8 1 412 1 280 10
Headline earnings 1 400 1 240 13 49 49 — 1 449 1 289 12
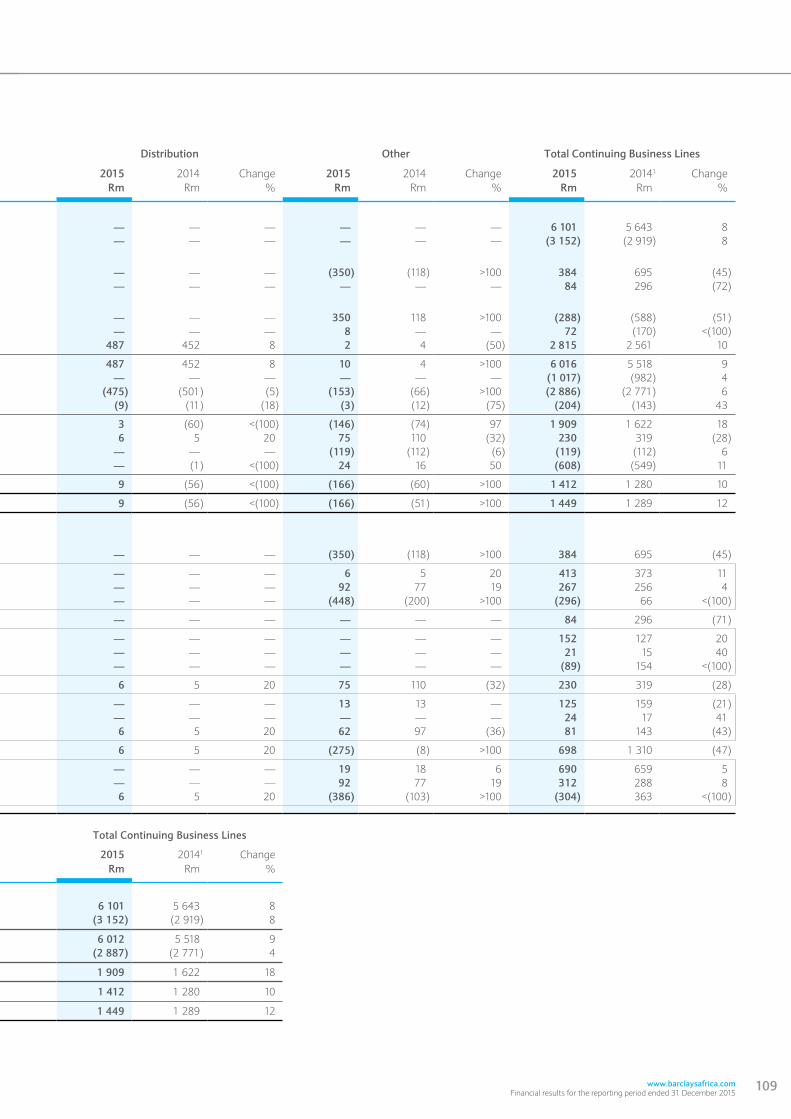
www.barclaysafrica.com Financial results for the reporting period ended 31 December 2015
109
Life Insurance Wealth and Investment Management Short-term Insurance Fiduciary Services Distribution Other Total Continuing Business Lines
2015 2014 Change 2015 20141 Change 2015 20141 Change 2015 2014 Change 2015 2014 Change 2015 2014 Change 2015 20141 ChangeRm Rm % Rm Rm % Rm Rm % Rm Rm % Rm Rm % Rm Rm % Rm Rm %
Statement of comprehensive income Net insurance premium income 2 851 2 554 12 — — — 3 246 3 080 5 4 9 (56) — — — — — — 6 101 5 643 8Net insurance claims and benefits paid (937) (803) 17 — — — (2 214) (2 115) 5 (1) (1) — — — — — — — (3 152) (2 919) 8Investment income
Policyholder investment contracts 734 813 (10) — — — — — — — — — — — — (350) (118) >100 384 695 (45)Policyholder insurance contracts 27 248 (89) — — — 57 48 19 — — — — — — — — — 84 296 (72)
Changes in investment contracts and insurance contract liabilities
Policyholder investment contracts (638) (706) (10) — — — — — — — — — — — — 350 118 >100 (288) (588) (51)Policyholder insurance contracts 64 (170) <(100) — — — — — — — — — — — — 8 — — 72 (170) <(100)
Other income2 (43) (51) (16) 1 590 1 430 11 73 52 40 706 674 5 487 452 8 2 4 (50) 2 815 2 561 10
Gross operating income 2 058 1 885 9 1 590 1 430 11 1 162 1 065 9 709 682 4 487 452 8 10 4 >100 6 016 5 518 9Net commission paid by insurance companies2 (478) (468) 2 — — — (538) (513) 5 — (1) <(100) — — — — — — (1 017) (982) 4Operating expenses (425) (432) (2) (957) (856) 12 (349) (382) (9) (528) (534) (1) (475) (501) (5) (153) (66) >100 (2 886) (2 771) 6Other (97) (99) (2) (10) (9) 11 (74) (10) >100 (11) (2) >100 (9) (11) (18) (3) (12) (75) (204) (143) 43
Net operating income 1 058 886 19 623 565 10 201 160 26 170 145 17 3 (60) <(100) (146) (74) 97 1 909 1 622 18Investment income on shareholder funds 56 84 (33) (3) 21 <(100) 76 84 (10) 20 15 33 6 5 20 75 110 (32) 230 319 (28)Shareholder expenses — — - — — — — — — — — — — — — (119) (112) (6) (119) (112) 6Taxation expense (319) (278) 15 (176) (164) 7 (83) (79) 5 (54) (43) 26 — (1) <(100) 24 16 50 (608) (549) 11
Profit for the period 795 692 15 444 422 5 194 165 18 136 117 16 9 (56) <(100) (166) (60) >100 1 412 1 280 10
Headline earnings 794 694 14 438 416 5 237 169 40 137 117 17 9 (56) <(100) (166) (51) >100 1 449 1 289 12
NoteInvestment incomePolicyholder investment contracts 734 813 (10) — — — — — — — — — — — — (350) (118) >100 384 695 (45)
Net interest income 407 368 11 — — — — — — — — — — — — 6 5 20 413 373 11Dividend income 175 179 (2) — — — — — — — — — — — — 92 77 19 267 256 4Fair value gains 152 266 (43) — — — — — — — — — — — — (448) (200) >100 (296) 66 <(100)
Policyholder insurance contracts 27 248 (89) — — — 57 48 19 — — — — — — — — — 84 296 (71)
Net interest income 95 79 22 — — — 57 48 19 — — — — — — — — — 152 127 20Dividend income 21 15 40 — — — — — — — — — — — — — — — 21 15 40Fair value gains (89) 154 <(100) — — — — — — — — — — — — — — — (89) 154 <(100)
Shareholder funds 56 84 (33) (3) 21 <(100) 76 84 (10) 20 15 33 6 5 20 75 110 (32) 230 319 (28)
Net interest income 35 37 (5) (7) 26 <(100) 80 80 — 4 3 33 — — — 13 13 — 125 159 (21)Dividend income 14 9 56 — — — 10 8 25 — — — — — — — — — 24 17 41Fair value gains/(losses) 7 38 (82) 4 (5) <(100) (14) (4) >100 16 12 33 6 5 20 62 97 (36) 81 143 (43)
Total 817 1 145 (29) (3) 21 <(100) 133 132 1 20 15 33 6 5 20 (275) (8) >100 698 1 310 (47)
Net interest income 537 484 11 (7) 26 <(100) 137 128 7 4 3 33 — — — 19 18 6 690 659 5Dividend income 210 203 3 — — — 10 8 25 — — — — — — 92 77 19 312 288 8Fair value gains/(losses) 70 458 (85) 4 (5) <(100) (14) (4) >100 16 12 33 6 5 20 (386) (103) >100 (304) 363 <(100)
Total Continuing Business LinesSouth Africa Rest of Africa
Segment report per geographical segment
2015 20141 Change 2015 2014 Change 2015 20141 ChangeRm Rm % Rm Rm % Rm Rm %
Statement of comprehensive income (Rm)Net insurance premium income 5 326 5 026 6 775 617 26 6 101 5 643 8 Net insurance claims and benefits paid (2 813) (2 668) 5 (339) (251) 35 (3 152) (2 919) 8
Gross operating income 5 546 5 134 8 470 384 22 6 012 5 518 9 Operating expenses (2 661) (2 540) 5 (225) (174) 29 (2 887) (2 771) 4
Net operating income 1 805 1 541 17 105 81 28 1 909 1 622 18
Profit for the reporting period 1 359 1 231 10 53 49 8 1 412 1 280 10
Headline earnings 1 400 1 240 13 49 49 — 1 449 1 289 12
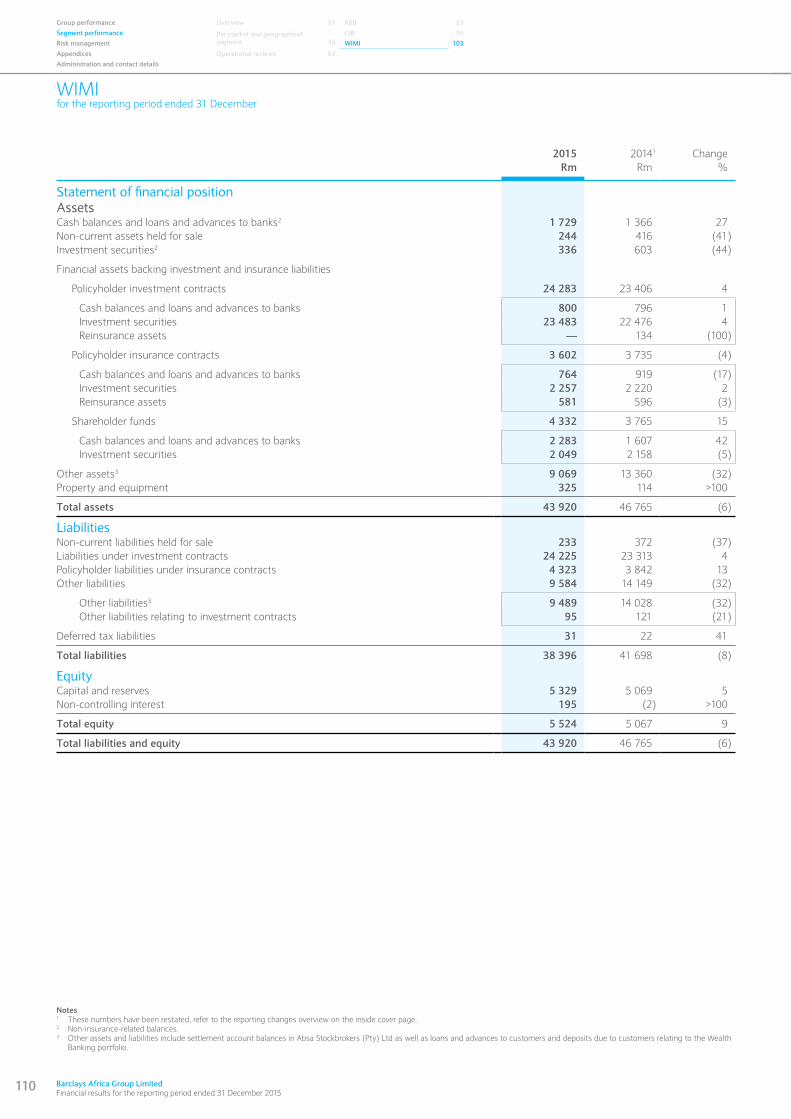
110 Barclays Africa Group Limited Financial results for the reporting period ended 31 December 2015
WIMIfor the reporting period ended 31 December
Group performance Overview 51 RBB 63Segment performance Per market and geographical
segment
56CIB 95
Risk management WIMI 103Appendices Operational reviews 63Administration and contact details
Notes1 These numbers have been restated, refer to the reporting changes overview on the inside cover page.2 Non-insurance-related balances. 3 Other assets and liabilities include settlement account balances in Absa Stockbrokers (Pty) Ltd as well as loans and advances to customers and deposits due to customers relating to the Wealth
Banking portfolio.
2015 20141 ChangeRm Rm %
Statement of financial positionAssetsCash balances and loans and advances to banks2 1 729 1 366 27Non-current assets held for sale 244 416 (41)Investment securities2 336 603 (44)
Financial assets backing investment and insurance liabilities
Policyholder investment contracts 24 283 23 406 4
Cash balances and loans and advances to banks 800 796 1Investment securities 23 483 22 476 4Reinsurance assets — 134 (100)
Policyholder insurance contracts 3 602 3 735 (4)
Cash balances and loans and advances to banks 764 919 (17)Investment securities 2 257 2 220 2Reinsurance assets 581 596 (3)
Shareholder funds 4 332 3 765 15
Cash balances and loans and advances to banks 2 283 1 607 42Investment securities 2 049 2 158 (5)
Other assets3 9 069 13 360 (32)Property and equipment 325 114 >100
Total assets 43 920 46 765 (6)
LiabilitiesNon-current liabilities held for sale 233 372 (37)Liabilities under investment contracts 24 225 23 313 4Policyholder liabilities under insurance contracts 4 323 3 842 13Other liabilities 9 584 14 149 (32)
Other liabilities3 9 489 14 028 (32)Other liabilities relating to investment contracts 95 121 (21)
Deferred tax liabilities 31 22 41
Total liabilities 38 396 41 698 (8)
EquityCapital and reserves 5 329 5 069 5Non-controlling interest 195 (2) >100
Total equity 5 524 5 067 9
Total liabilities and equity 43 920 46 765 (6)

www.barclaysafrica.com Financial results for the reporting period ended 31 December 2015
111
WIMIfor the reporting period ended 31 December
2015Inter-segment
WIMI elimination Other1 GroupReconciliation with Group Rm Rm Rm Rm
Statement of financial position2
Investment securitiesInvestments linked to investment contracts 23 483 (3 966) — 19 517
Policyholder liabilities under insurance contract 4 323 (1) 18 4 340
Statement of comprehensive income2
Net insurance premium income 6 022 — 281 6 303 Net insurance claims and benefits paid (3 105) (6) (34) (3 145)Gains and losses from investment activities – net gains on investments from insurance activities – policyholder investment contracts 384 (47) — 337
2014Inter-segment
WIMI eliminations Other1 GroupReconciliation with Group Rm Rm Rm Rm
Statement of financial position2
Investment securitiesInvestments linked to investment contracts 22 476 (3 159) — 19 317
Policyholder liabilities under insurance contract 3 842 (25) 53 3 870
Statement of comprehensive income2
Net insurance premium income 5 764 — 251 6 015Net insurance claims and benefits paid (3 016) 5 (32) (3 043)Gains and losses from investment activities – net gains on investments from insurance activities – policyholder investment contracts 695 (187) — 508
Notes1 Consists of Absa Manx Insurance Company and Woolworths Financial Services.2 Debit amounts are disclosed as positive, credit amounts are disclosed as negative.
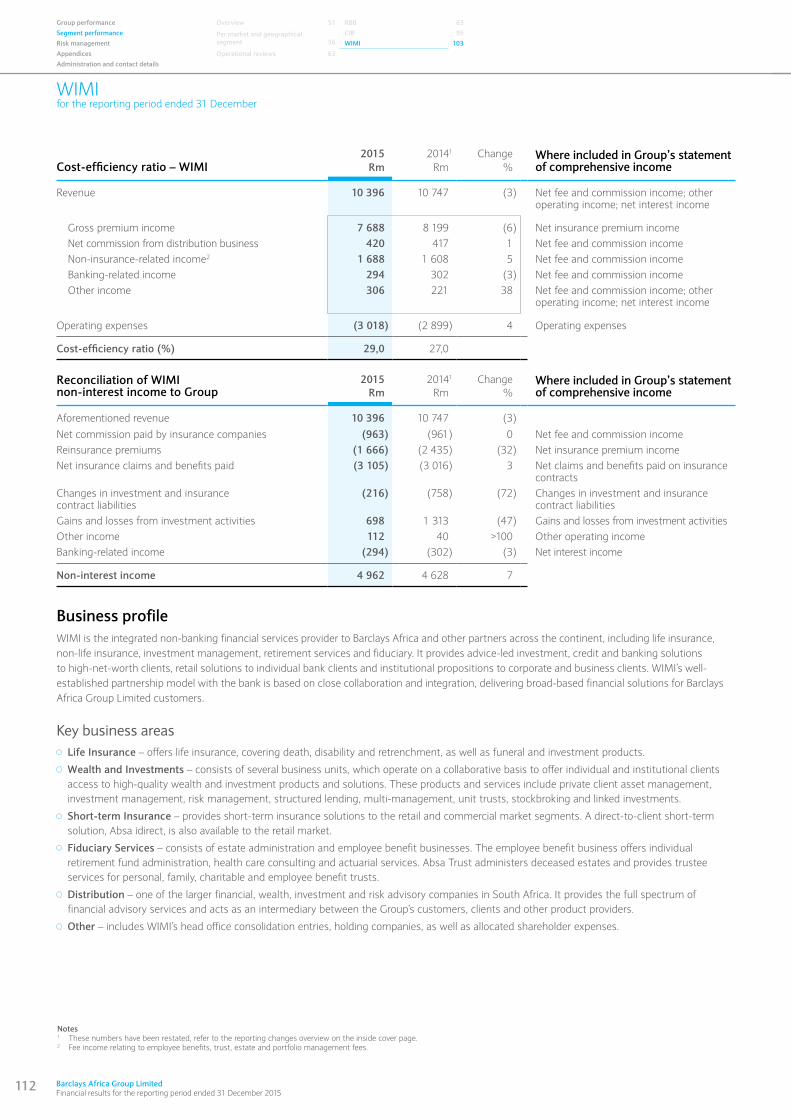
112 Barclays Africa Group Limited Financial results for the reporting period ended 31 December 2015
WIMIfor the reporting period ended 31 December
Group performance Overview 51 RBB 63Segment performance Per market and geographical
segment
56CIB 95
Risk management WIMI 103Appendices Operational reviews 63Administration and contact details
Cost-efficiency ratio – WIMI2015 20141 Change Where included in Group’s statement
of comprehensive income Rm Rm %
Revenue 10 396 10 747 (3) Net fee and commission income; other operating income; net interest income
Gross premium income 7 688 8 199 (6) Net insurance premium incomeNet commission from distribution business 420 417 1 Net fee and commission incomeNon-insurance-related income2 1 688 1 608 5 Net fee and commission incomeBanking-related income 294 302 (3) Net fee and commission incomeOther income 306 221 38 Net fee and commission income; other
operating income; net interest income
Operating expenses (3 018) (2 899) 4 Operating expenses
Cost-efficiency ratio (%) 29,0 27,0
Reconciliation of WIMI non-interest income to Group
2015 20141 Change Where included in Group’s statement of comprehensive incomeRm Rm %
Aforementioned revenue 10 396 10 747 (3)
Net commission paid by insurance companies (963) (961) 0 Net fee and commission incomeReinsurance premiums (1 666) (2 435) (32) Net insurance premium incomeNet insurance claims and benefits paid (3 105) (3 016) 3 Net claims and benefits paid on insurance
contractsChanges in investment and insurance contract liabilities
(216) (758) (72) Changes in investment and insurance contract liabilities
Gains and losses from investment activities 698 1 313 (47) Gains and losses from investment activitiesOther income 112 40 >100 Other operating incomeBanking-related income (294) (302) (3) Net interest income
Non-interest income 4 962 4 628 7
Business profile WIMI is the integrated non-banking financial services provider to Barclays Africa and other partners across the continent, including life insurance, non-life insurance, investment management, retirement services and fiduciary. It provides advice-led investment, credit and banking solutions to high-net-worth clients, retail solutions to individual bank clients and institutional propositions to corporate and business clients. WIMI’s well-established partnership model with the bank is based on close collaboration and integration, delivering broad-based financial solutions for Barclays Africa Group Limited customers.
Key business areas Life Insurance – offers life insurance, covering death, disability and retrenchment, as well as funeral and investment products.
Wealth and Investments – consists of several business units, which operate on a collaborative basis to offer individual and institutional clients access to high-quality wealth and investment products and solutions. These products and services include private client asset management, investment management, risk management, structured lending, multi-management, unit trusts, stockbroking and linked investments.
Short-term Insurance – provides short-term insurance solutions to the retail and commercial market segments. A direct-to-client short-term solution, Absa idirect, is also available to the retail market.
Fiduciary Services – consists of estate administration and employee benefit businesses. The employee benefit business offers individual retirement fund administration, health care consulting and actuarial services. Absa Trust administers deceased estates and provides trustee services for personal, family, charitable and employee benefit trusts.
Distribution – one of the larger financial, wealth, investment and risk advisory companies in South Africa. It provides the full spectrum of financial advisory services and acts as an intermediary between the Group’s customers, clients and other product providers.
Other – includes WIMI’s head office consolidation entries, holding companies, as well as allocated shareholder expenses.
Notes1 These numbers have been restated, refer to the reporting changes overview on the inside cover page. 2 Fee income relating to employee benefits, trust, estate and portfolio management fees.
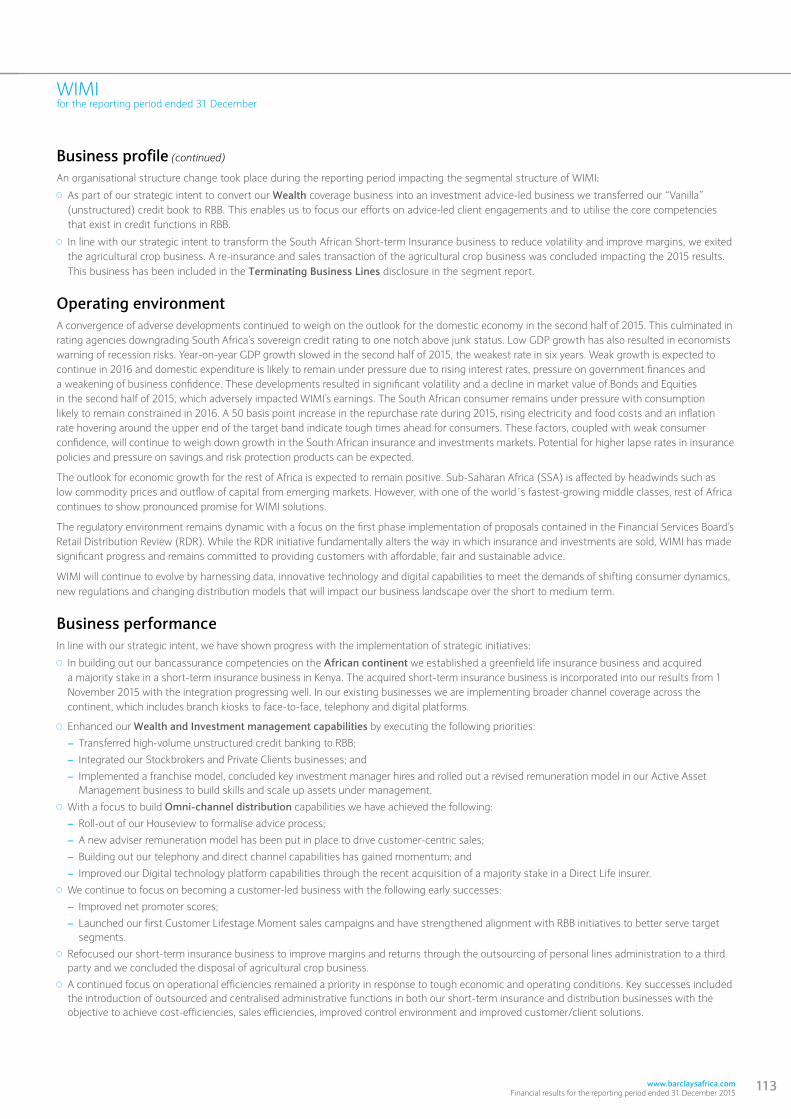
www.barclaysafrica.com Financial results for the reporting period ended 31 December 2015
113
WIMIfor the reporting period ended 31 December
Business profile (continued)
An organisational structure change took place during the reporting period impacting the segmental structure of WIMI:
As part of our strategic intent to convert our Wealth coverage business into an investment advice-led business we transferred our “Vanilla” (unstructured) credit book to RBB. This enables us to focus our efforts on advice-led client engagements and to utilise the core competencies that exist in credit functions in RBB.
In line with our strategic intent to transform the South African Short-term Insurance business to reduce volatility and improve margins, we exited the agricultural crop business. A re-insurance and sales transaction of the agricultural crop business was concluded impacting the 2015 results. This business has been included in the Terminating Business Lines disclosure in the segment report.
Operating environmentA convergence of adverse developments continued to weigh on the outlook for the domestic economy in the second half of 2015. This culminated in rating agencies downgrading South Africa’s sovereign credit rating to one notch above junk status. Low GDP growth has also resulted in economists warning of recession risks. Year-on-year GDP growth slowed in the second half of 2015, the weakest rate in six years. Weak growth is expected to continue in 2016 and domestic expenditure is likely to remain under pressure due to rising interest rates, pressure on government finances and a weakening of business confidence. These developments resulted in significant volatility and a decline in market value of Bonds and Equities in the second half of 2015, which adversely impacted WIMI’s earnings. The South African consumer remains under pressure with consumption likely to remain constrained in 2016. A 50 basis point increase in the repurchase rate during 2015, rising electricity and food costs and an inflation rate hovering around the upper end of the target band indicate tough times ahead for consumers. These factors, coupled with weak consumer confidence, will continue to weigh down growth in the South African insurance and investments markets. Potential for higher lapse rates in insurance policies and pressure on savings and risk protection products can be expected.
The outlook for economic growth for the rest of Africa is expected to remain positive. Sub-Saharan Africa (SSA) is affected by headwinds such as low commodity prices and outflow of capital from emerging markets. However, with one of the world´s fastest-growing middle classes, rest of Africa continues to show pronounced promise for WIMI solutions.
The regulatory environment remains dynamic with a focus on the first phase implementation of proposals contained in the Financial Services Board’s Retail Distribution Review (RDR). While the RDR initiative fundamentally alters the way in which insurance and investments are sold, WIMI has made significant progress and remains committed to providing customers with affordable, fair and sustainable advice.
WIMI will continue to evolve by harnessing data, innovative technology and digital capabilities to meet the demands of shifting consumer dynamics, new regulations and changing distribution models that will impact our business landscape over the short to medium term.
Business performanceIn line with our strategic intent, we have shown progress with the implementation of strategic initiatives:
In building out our bancassurance competencies on the African continent we established a greenfield life insurance business and acquired a majority stake in a short-term insurance business in Kenya. The acquired short-term insurance business is incorporated into our results from 1 November 2015 with the integration progressing well. In our existing businesses we are implementing broader channel coverage across the continent, which includes branch kiosks to face-to-face, telephony and digital platforms.
Enhanced our Wealth and Investment management capabilities by executing the following priorities:
– Transferred high-volume unstructured credit banking to RBB;
– Integrated our Stockbrokers and Private Clients businesses; and
– Implemented a franchise model, concluded key investment manager hires and rolled out a revised remuneration model in our Active Asset Management business to build skills and scale up assets under management.
With a focus to build Omni-channel distribution capabilities we have achieved the following:
– Roll-out of our Houseview to formalise advice process;
– A new adviser remuneration model has been put in place to drive customer-centric sales;
– Building out our telephony and direct channel capabilities has gained momentum; and
– Improved our Digital technology platform capabilities through the recent acquisition of a majority stake in a Direct Life insurer.
We continue to focus on becoming a customer-led business with the following early successes:
– Improved net promoter scores;
– Launched our first Customer Lifestage Moment sales campaigns and have strengthened alignment with RBB initiatives to better serve target segments.
Refocused our short-term insurance business to improve margins and returns through the outsourcing of personal lines administration to a third party and we concluded the disposal of agricultural crop business.
A continued focus on operational efficiencies remained a priority in response to tough economic and operating conditions. Key successes included the introduction of outsourced and centralised administrative functions in both our short-term insurance and distribution businesses with the objective to achieve cost-efficiencies, sales efficiencies, improved control environment and improved customer/client solutions.
114 Barclays Africa Group Limited Financial results for the reporting period ended 31 December 2015
WIMIfor the reporting period ended 31 December
Group performance Overview 51 RBB 63Segment performance Per market and geographical
segment
56CIB 95
Risk management WIMI 103Appendices Operational reviews 63Administration and contact details
Business performance (continued)
WIMI accolades and key product launches include:
– Bank.Invest.Insure.Prosper awareness campaign;
– Affinity product in Absa Life (data insights enabled predictive underwriting product);
– Awarded Top SA Private Bank Award in the Family Office segment by Moneyweb Intellidex in 2015;
– Absa Employee Benefits won Actuarial Firm of the Year at the 2015 Imbasa Yegolide Awards;
– Wealth and Investment Management (WIM) won 3 Raging Bull Awards - with the Absa Property Equity Fund and Absa Multi-managed Bond Fund taking top honours;
– Launched Barclays Life Assurance in Kenya in May 2015; and
– Acquired majority share in First Assurance, Kenya.
Financial performanceWIMI delivered strong performance with headline earnings increasing by 11% to R1 464m (2014: R1 324m), and net operating income increasing by 16% to R1 924m (2014: R1 657m).
The performance is a result of the implementation of the strategic focus areas with the following key features:
Building out our bancassurance competencies on the African continent has contributed to a 22% growth in revenue. Headline earning remained flat at R49m, largely due to increased minority interest in profits and the impact of disallowed tax deduction for pre-incorporation costs in Kenya.
Total assets under management and administration increased by R15bn to R274bn (2014: R259bn), driven by a significant (R19bn) improvement in net flows from institutional money market and segregated mandates, as well as increased activity within protection overlay and synthetic asset allocation strategies.
Life insurance SA achieved strong headline earnings growth of 12% on the back of a 9% net premium income growth and a 5% decline in operating expenses.
Transforming the South African Short-term Insurance business to improve margins has resulted in an improvement in underwriting margin1 to 4,9% (2014: 3,1%) and a 23% improvement in headline earnings.
In building out our omni-channel Distribution capabilities, we faced further adviser attrition, however, net revenue grew by 8%, and cost growth was contained to 5%, which contributed to the business achieving a R9m profit before tax.
Fiduciary Services margins continued to improve resulting in a 21% increase in earnings. The continued improved margin is driven by lower operational losses and continued operational efficiencies.
Our focus on operating effectiveness has resulted in operating expenses growth being contained to 4% with total cost of R2 899m (2014: R2 787m). The South African operations increased by 2%, while operations in the rest of Africa recorded an increase of 29%, partly due to investments undertaken to implement our African expansion strategy and foreign exchange differences. Excluding the impact of foreign exchange translations, operating expenses increased by 9%.
In line with industry trends we experienced subdued growth in risk new business volumes in South Africa. In the rest of Africa, we experienced lower EVNB per policy due to alignment of credit life practices, products and pricing. As a result EVNB decreased by 4% to R452m (2014: 472m).
As part of our annual impairment assessment for intangible assets, an impairment of R72m was recognised during the reporting period. The impairment was required as a result of the strategic decision to outsource the personal lines intermediated businesses administration to a third party as well as an expected decline in future cash flows related to the planned action to be taken on the commercial intermediated business.
In addition the volatile economic environment adversely impacted market performance, which resulted in income from shareholder’ funds declining by 28% to R230m (2014: R319m).
Note1 Underwriting margin is reported before adjusting for the once-off systems impairments and excludes Agricultural crop business reported under “Terminating lines of business”.
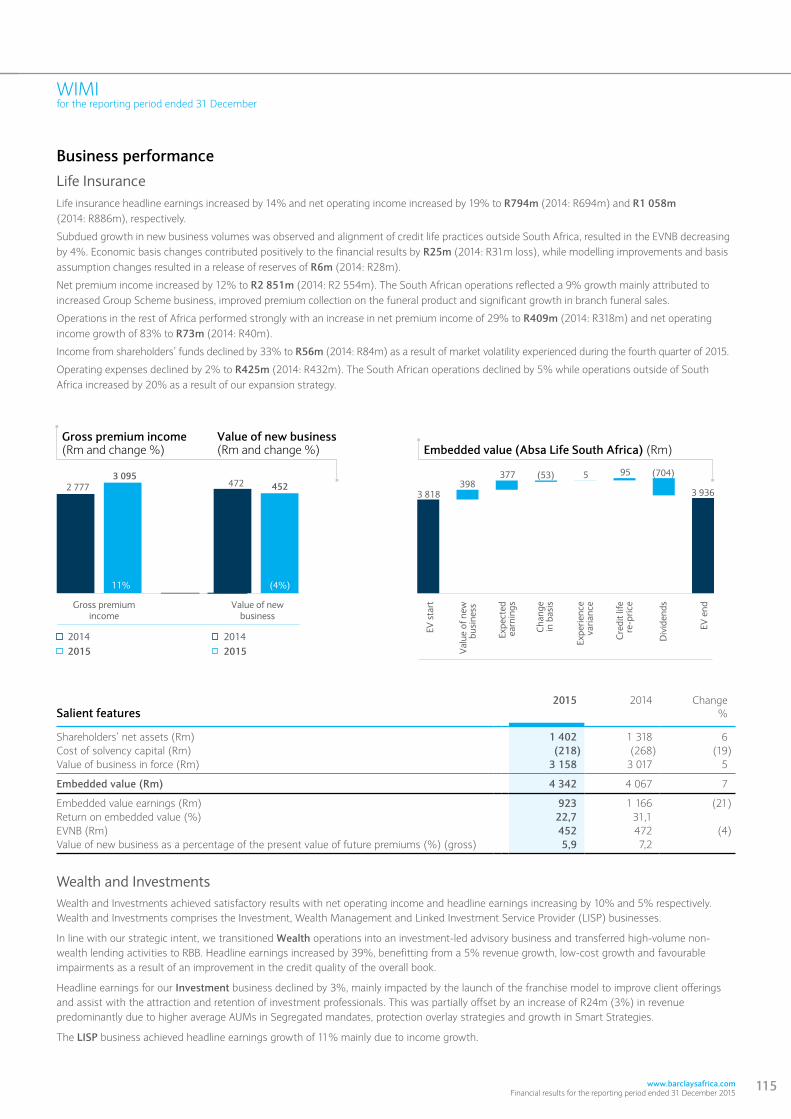
www.barclaysafrica.com Financial results for the reporting period ended 31 December 2015
115
WIMIfor the reporting period ended 31 December
Business performanceLife InsuranceLife insurance headline earnings increased by 14% and net operating income increased by 19% to R794m (2014: R694m) and R1 058m (2014: R886m), respectively.
Subdued growth in new business volumes was observed and alignment of credit life practices outside South Africa, resulted in the EVNB decreasing by 4%. Economic basis changes contributed positively to the financial results by R25m (2014: R31m loss), while modelling improvements and basis assumption changes resulted in a release of reserves of R6m (2014: R28m).
Net premium income increased by 12% to R2 851m (2014: R2 554m). The South African operations reflected a 9% growth mainly attributed to increased Group Scheme business, improved premium collection on the funeral product and significant growth in branch funeral sales.
Operations in the rest of Africa performed strongly with an increase in net premium income of 29% to R409m (2014: R318m) and net operating income growth of 83% to R73m (2014: R40m).
Income from shareholders’ funds declined by 33% to R56m (2014: R84m) as a result of market volatility experienced during the fourth quarter of 2015.
Operating expenses declined by 2% to R425m (2014: R432m). The South African operations declined by 5% while operations outside of South Africa increased by 20% as a result of our expansion strategy.
Salient features2015 2014 Change
%
Shareholders’ net assets (Rm) 1 402 1 318 6Cost of solvency capital (Rm) (218) (268) (19)Value of business in force (Rm) 3 158 3 017 5
Embedded value (Rm) 4 342 4 067 7
Embedded value earnings (Rm) 923 1 166 (21)Return on embedded value (%) 22,7 31,1EVNB (Rm) 452 472 (4)Value of new business as a percentage of the present value of future premiums (%) (gross) 5,9 7,2
EV s
tart
Val
ue o
f new
busi
ness
Expe
cted
earn
ings
Cha
nge
in b
asis
Expe
rienc
eva
rianc
e
Cre
dit l
ifere
-pric
e
Div
iden
ds
EV e
nd
3 818398
377 (53) 5 95
3 936
(704)452
3 095
4%
Value of newbusiness
Gross premiumincome
2 777 472
(23%)
Gross premium income (Rm and change %)
Value of new business (Rm and change %) Embedded value (Absa Life South Africa) (Rm)
� 2014� 2015
� 2014� 2015
11% (4%)
Wealth and InvestmentsWealth and Investments achieved satisfactory results with net operating income and headline earnings increasing by 10% and 5% respectively. Wealth and Investments comprises the Investment, Wealth Management and Linked Investment Service Provider (LISP) businesses.
In line with our strategic intent, we transitioned Wealth operations into an investment-led advisory business and transferred high-volume non-wealth lending activities to RBB. Headline earnings increased by 39%, benefitting from a 5% revenue growth, low-cost growth and favourable impairments as a result of an improvement in the credit quality of the overall book.
Headline earnings for our Investment business declined by 3%, mainly impacted by the launch of the franchise model to improve client offerings and assist with the attraction and retention of investment professionals. This was partially offset by an increase of R24m (3%) in revenue predominantly due to higher average AUMs in Segregated mandates, protection overlay strategies and growth in Smart Strategies.
The LISP business achieved headline earnings growth of 11% mainly due to income growth.
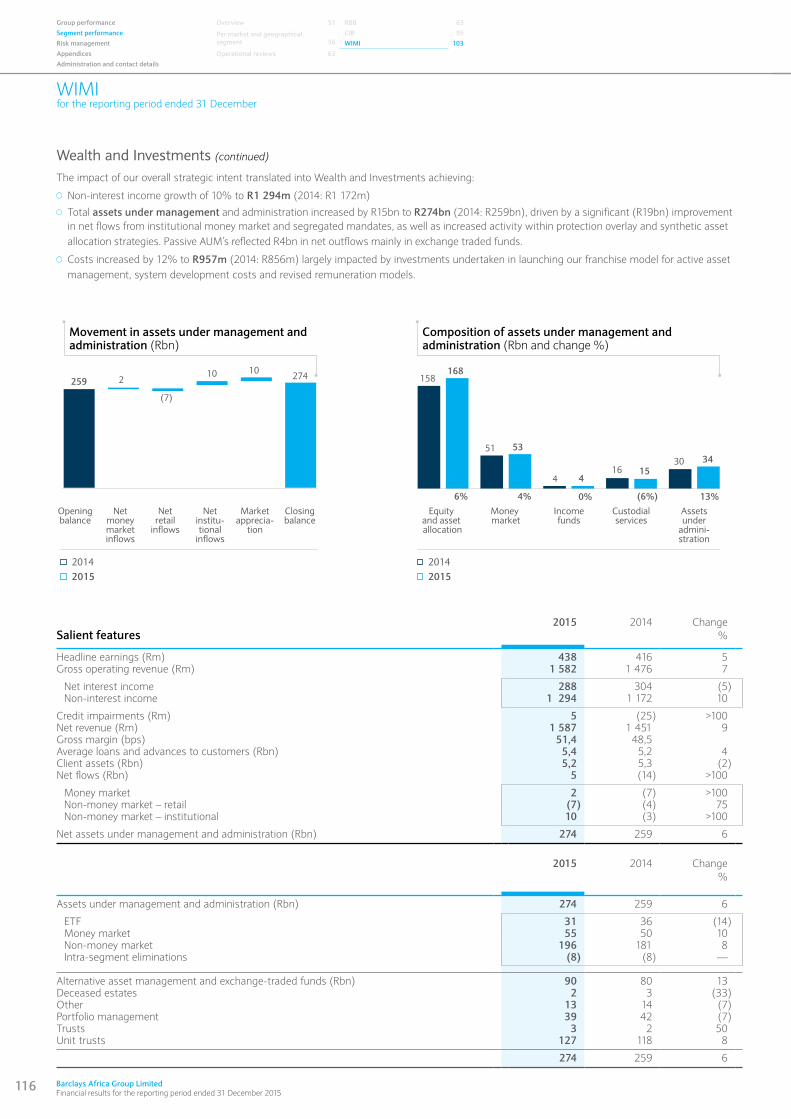
116 Barclays Africa Group Limited Financial results for the reporting period ended 31 December 2015
WIMIfor the reporting period ended 31 December
Group performance Overview 51 RBB 63Segment performance Per market and geographical
segment
56CIB 95
Risk management WIMI 103Appendices Operational reviews 63Administration and contact details
Equity and asset allocation
Money market
Assetsunder
admini-stration
Incomefunds
Custodialservices
4
53
168
1534
4
51
158
1630
6% 4% 0% (6%) 13%
Movement in assets under management and administration (Rbn)
Composition of assets under management and administration (Rbn and change %)
� 2014� 2015
� 2014� 2015
Netmoneymarketinflows
Netretail
inflows
Netinstitu-tional
inflows
Marketapprecia-
tion
Closingbalance
Openingbalance
10 274210
(7)
259
Wealth and Investments (continued)
The impact of our overall strategic intent translated into Wealth and Investments achieving:
Non-interest income growth of 10% to R1 294m (2014: R1 172m)
Total assets under management and administration increased by R15bn to R274bn (2014: R259bn), driven by a significant (R19bn) improvement in net flows from institutional money market and segregated mandates, as well as increased activity within protection overlay and synthetic asset allocation strategies. Passive AUM’s reflected R4bn in net outflows mainly in exchange traded funds.
Costs increased by 12% to R957m (2014: R856m) largely impacted by investments undertaken in launching our franchise model for active asset management, system development costs and revised remuneration models.
Salient features2015 2014 Change
%
Headline earnings (Rm) 438 416 5Gross operating revenue (Rm) 1 582 1 476 7
Net interest income 288 304 (5)Non-interest income 1 294 1 172 10
Credit impairments (Rm) 5 (25) >100Net revenue (Rm) 1 587 1 451 9Gross margin (bps) 51,4 48,5Average loans and advances to customers (Rbn) 5,4 5,2 4Client assets (Rbn) 5,2 5,3 (2)Net flows (Rbn) 5 (14) >100
Money market 2 (7) >100Non-money market – retail (7) (4) 75Non-money market – institutional 10 (3) >100
Net assets under management and administration (Rbn) 274 259 6
2015 2014 Change%
Assets under management and administration (Rbn) 274 259 6
ETF 31 36 (14)Money market 55 50 10Non-money market 196 181 8Intra-segment eliminations (8) (8) —
Alternative asset management and exchange-traded funds (Rbn) 90 80 13Deceased estates 2 3 (33)Other 13 14 (7)Portfolio management 39 42 (7)Trusts 3 2 50Unit trusts 127 118 8
274 259 6
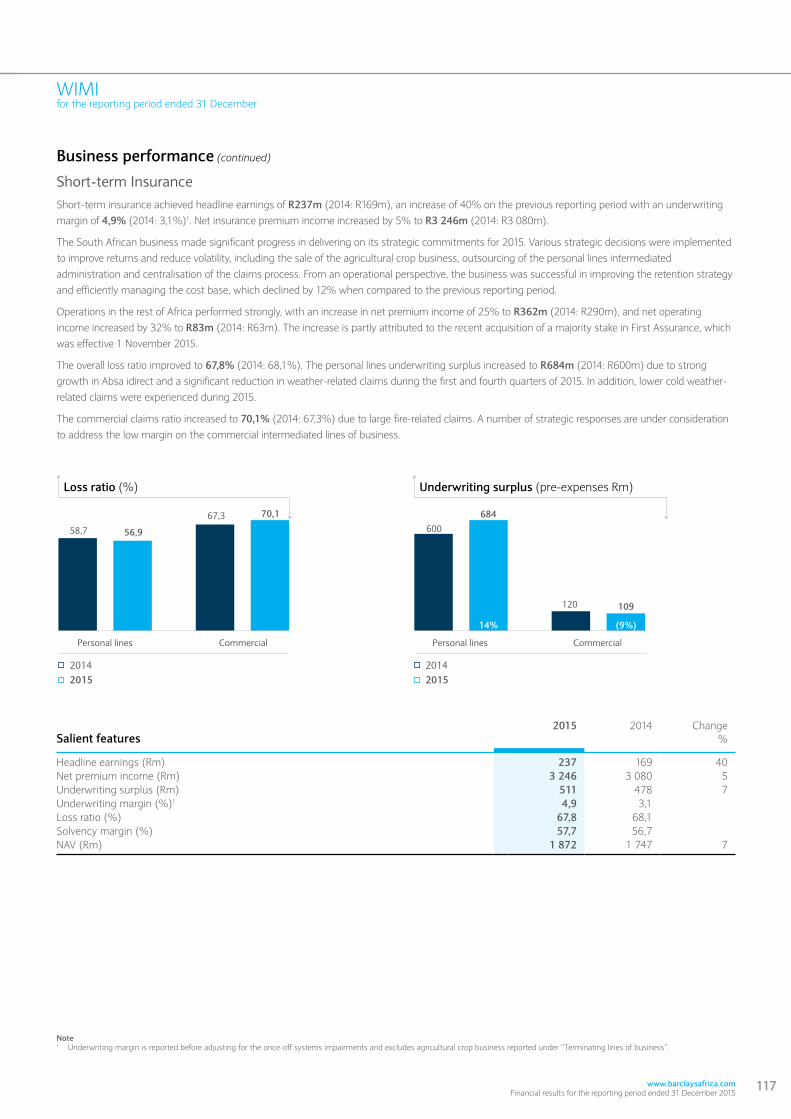
www.barclaysafrica.com Financial results for the reporting period ended 31 December 2015
117
WIMIfor the reporting period ended 31 December
Note1 Underwriting margin is reported before adjusting for the once-off systems impairments and excludes agricultural crop business reported under “Terminating lines of business”.
58,7
67,3600
70,1
56,9
Personal lines Commercial Personal lines Commercial
109120
684
14% (9%)
� 2014� 2015
� 2014� 2015
Loss ratio (%) Underwriting surplus (pre-expenses Rm)
Salient features2015 2014 Change
%
Headline earnings (Rm) 237 169 40Net premium income (Rm) 3 246 3 080 5Underwriting surplus (Rm) 511 478 7Underwriting margin (%)1 4,9 3,1Loss ratio (%) 67,8 68,1Solvency margin (%) 57,7 56,7NAV (Rm) 1 872 1 747 7
Business performance (continued)
Short-term InsuranceShort-term insurance achieved headline earnings of R237m (2014: R169m), an increase of 40% on the previous reporting period with an underwriting margin of 4,9% (2014: 3,1%)1. Net insurance premium income increased by 5% to R3 246m (2014: R3 080m).
The South African business made significant progress in delivering on its strategic commitments for 2015. Various strategic decisions were implemented to improve returns and reduce volatility, including the sale of the agricultural crop business, outsourcing of the personal lines intermediated administration and centralisation of the claims process. From an operational perspective, the business was successful in improving the retention strategy and efficiently managing the cost base, which declined by 12% when compared to the previous reporting period.
Operations in the rest of Africa performed strongly, with an increase in net premium income of 25% to R362m (2014: R290m), and net operating income increased by 32% to R83m (2014: R63m). The increase is partly attributed to the recent acquisition of a majority stake in First Assurance, which was effective 1 November 2015.
The overall loss ratio improved to 67,8% (2014: 68,1%). The personal lines underwriting surplus increased to R684m (2014: R600m) due to strong growth in Absa idirect and a significant reduction in weather-related claims during the first and fourth quarters of 2015. In addition, lower cold weather-related claims were experienced during 2015.
The commercial claims ratio increased to 70,1% (2014: 67,3%) due to large fire-related claims. A number of strategic responses are under consideration to address the low margin on the commercial intermediated lines of business.

118 Barclays Africa Group Limited Financial results for the reporting period ended 31 December 2015
WIMIfor the reporting period ended 31 December
Group performance Overview 51 RBB 63Segment performance Per market and geographical
segment
56CIB 95
Risk management WIMI 103Appendices Operational reviews 63Administration and contact details
Business performance (continued)
Fiduciary Services
Headline earnings increased by 17% to R137m (2014: R117m). Absa Trust continued to be a significant cash-generating business and reported a 9% increase in headline earnings to R86m (2014: R79m). A return on equity of 101% was achieved and the business delivered attractive returns in line with our target range. The business showed strong growth in new wills written in the high-net-worth segment and achieved 12% growth in Trust assets under management to R11,3bn.
Employee Benefits restructuring changes undertaken produced positive results, resulting in direct operational expenditure declining by 2%. Employee Benefits’ headline earnings increased by 34% to R51m (2014: R38m). A return on average equity of 33% was achieved and new business of R7m was achieved during the period.
The Fiduciary business recently won the “Actuarial Firm of the Year” award at the Imbasa Yegolide ceremony. The focus of Fiduciary Services has shifted to maximise its contribution to the Group through executing cross-sell opportunities and enhancing Group value created from customer/client relationships. The business continued to deliver annuity revenue and generated gross new assets under management from cross-sell opportunities of R372m and R8,5bn respectively.
79
38
86
51
Trust Employee Benefits Trust Employee Benefits
160
24
101
33
34%9%
� 2014� 2015
RoE (%)
� 2014� 2015
Headline earnings (Rm and change %)
Salient features2015 2014 Change
%
Headline earnings (Rm) 137 117 17Average value of estates distributed (R’000) 1 410 1 146 23Net assets under management (Rbn) 13,4 12,6 6
Third party 5,1 4,8 6Investments 8,3 7,8 6
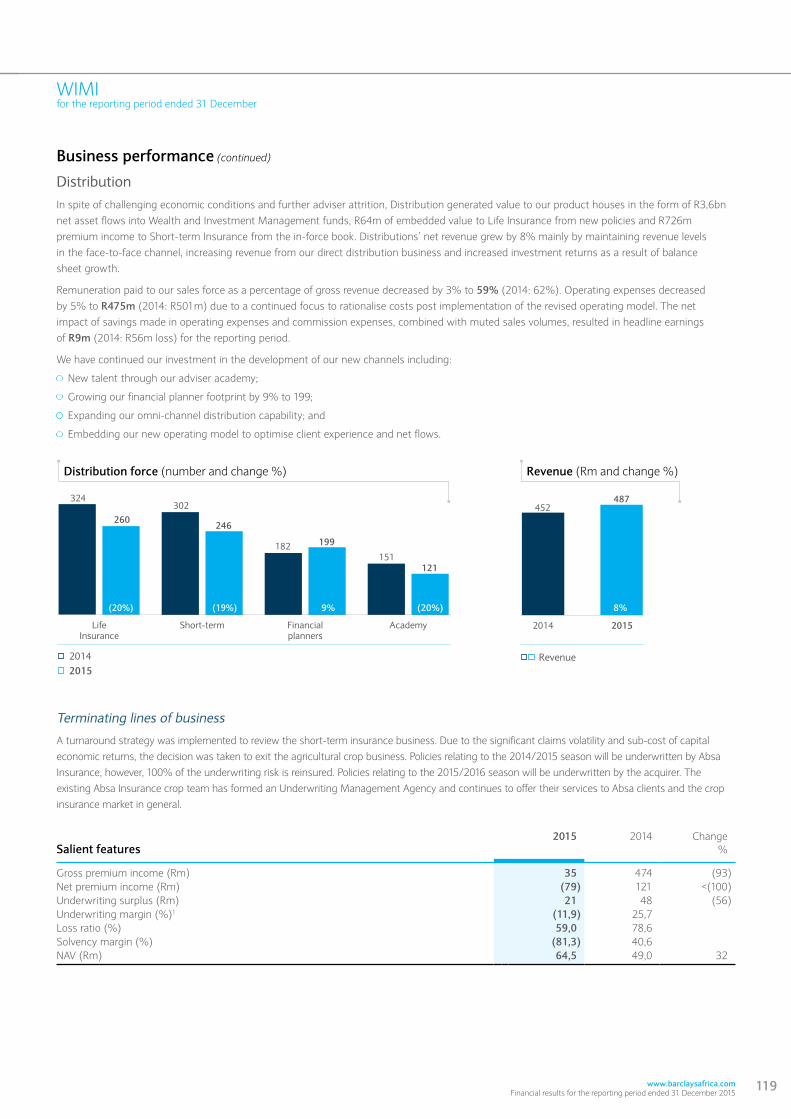
www.barclaysafrica.com Financial results for the reporting period ended 31 December 2015
119
WIMIfor the reporting period ended 31 December
Business performance (continued)
DistributionIn spite of challenging economic conditions and further adviser attrition, Distribution generated value to our product houses in the form of R3,6bn net asset flows into Wealth and Investment Management funds, R64m of embedded value to Life Insurance from new policies and R726m premium income to Short-term Insurance from the in-force book. Distributions’ net revenue grew by 8% mainly by maintaining revenue levels in the face-to-face channel, increasing revenue from our direct distribution business and increased investment returns as a result of balance sheet growth.
Remuneration paid to our sales force as a percentage of gross revenue decreased by 3% to 59% (2014: 62%). Operating expenses decreased by 5% to R475m (2014: R501m) due to a continued focus to rationalise costs post implementation of the revised operating model. The net impact of savings made in operating expenses and commission expenses, combined with muted sales volumes, resulted in headline earnings of R9m (2014: R56m loss) for the reporting period.
We have continued our investment in the development of our new channels including:
c New talent through our adviser academy;
c Growing our financial planner footprint by 9% to 199;
c Expanding our omni-channel distribution capability; and
c Embedding our new operating model to optimise client experience and net flows.
AcademyFinancialplanners
Short-termLifeInsurance
8%
452
2014
487
2015
(20%) 9% (20%)(19%)
260
199
121
246
324
182151
302
Distribution force (number and change %) Revenue (Rm and change %)
� � Revenue� 2014� 2015
Terminating lines of business
A turnaround strategy was implemented to review the short-term insurance business. Due to the significant claims volatility and sub-cost of capital economic returns, the decision was taken to exit the agricultural crop business. Policies relating to the 2014/2015 season will be underwritten by Absa Insurance, however, 100% of the underwriting risk is reinsured. Policies relating to the 2015/2016 season will be underwritten by the acquirer. The existing Absa Insurance crop team has formed an Underwriting Management Agency and continues to offer their services to Absa clients and the crop insurance market in general.
Salient features2015 2014 Change
%
Gross premium income (Rm) 35 474 (93)Net premium income (Rm) (79) 121 <(100)Underwriting surplus (Rm) 21 48 (56)Underwriting margin (%)1 (11,9) 25,7Loss ratio (%) 59,0 78,6Solvency margin (%) (81,3) 40,6NAV (Rm) 64,5 49,0 32
120 Barclays Africa Group Limited Financial results for the reporting period ended 31 December 2015
WIMIfor the reporting period ended 31 December
Group performance Overview 51 RBB 63Segment performance Per market and geographical
segment
56CIB 95
Risk management WIMI 103Appendices Operational reviews 63Administration and contact details
Looking aheadOur aim is to be the preferred non-banking financial services provider (including wealth, investment management, insurance, trust and employee benefits solutions) to Barclays Africa and other partners on the continent. Our strategy remains in place and we have made progress with the execution of our key priorities. We are, however, shifting focus from foundation activities to accelerate growth through customer focus and digital enablement. Our main effort is to grow assets under management and premium income through the following key execution priorities:
Improved cross-sell between WIMI and RBB by:
– Enhancing our bancassurance relationship with the bank through joint management structures, joint performance objectives and closer collaboration;
– Growing our internal and external distribution capabilities in relevant and new channels; and
– Continuously building our market presence to enhance our penetration of the bank customer base (“more than a bank”).
Continue to drive growth in selected markets across the African continent through:
– Entry into remaining target markets;
– Targeted expansion and improved cross-sell penetration of channels and product propositions in existing Africa markets and
– Targeted development of external partners for scale.
Build a customer-centric culture and competence in line with our Group ambition.
Enable our asset-gathering ambition through technology, digital enablement and automation.
Build out our data capabilities and insights-led sales as a key strategic asset.
Ongoing development of a diverse and high-performance team.
Embed the right culture and operating model for customer-centricity, improved efficiencies and an appropriate control environment.

www.barclaysafrica.com Financial results for the reporting period ended 31 December 2015
121
Risk management
ContentsRisk management overview 122
Capital management 129

122 Barclays Africa Group Limited Financial results for the reporting period ended 31 December 2015
Risk management overviewfor the reporting period ended 31 December
Group performance Risk management overview 122Segment performance Capital management 129Risk managementAppendicesAdministration and contact details
The role of risk management is to evaluate, respond to, and monitor risks in the execution of our strategy. It is essential that business growth plans are supported by an effective Enterprise Risk Management Framework (ERMF). Risk culture is closely aligned to that of the business. The Risk Function retains independence in analysis and decision-making.
The approach to managing risk is outlined in the ERMF, which creates the context for setting policies and standards, and establishing the right practices throughout the Group. It defines the risk management process and sets out the activities, tools, techniques and organisational arrangements to ensure that material risks can be optimally identified and managed. It also ensures that appropriate responses are in place to protect the Group and prevent detriment to its stakeholders.
The ERMF includes those risks taken by the Group that are foreseeable, and material enough to merit establishing specific group-wide control frameworks. These are known as key risks and are grouped into five principal risks.
The three lines of defence operating model, which has been defined in the ERMF, enables the appropriate assignment of risk management activities between those parties that:
Own and take risk, and implement controls (first line);
Oversee and challenge the first line, providing independent risk management activity and support controls (second line); and
Provide assurance that risk processes are fit for purpose, and that they are being carried out as intended (third line).
The ERMF enables businesses and functions to be organised along the three lines by formalising independence and challenge, whilst promoting collaboration and the flow of information between all areas.
Review of 2015Overall performance continued to be sound with all risk and capital measures remaining within the Board-approved risk appetite. Key highlights included:
Macro-economic conditions deteriorated significantly towards the end of the year. The Group extended its framework of macro-economic triggers and management actions in response.
Loans and advances to customers increased 11%, driven by growth in Wholesale, Card and rest of Africa portfolios.
The impairment loss ratio increased to 105bps (2014: 102bps) and impairment charges increased to R6.9bn (2014: R6.3bn). Increases in the Wholesale and Card portfolios, and additional macroeconomic provisions (R418m) were offset by lower charges in the mortgages and Edcon portfolios.
Overall coverage on performing loans increased to 73bps (December 2014: 70bps).
Market risk exposures remained within overall risk appetite notwithstanding volatile market conditions.
Total operational risk and fraud losses were lower than 2014, with fraud losses accounting for 71% of the total.
The Group remained capitalised above the minimum regulatory limit and the Board-approved CET1 target range. The liquidity position remained healthy and supports the year-end dividend.
The Group developed and implemented an approach to the management of conduct risk.
Absa Financial Services submitted its Own Risk and Solvency Assessment (ORSA) to the Financial Services Board.
Effective risk management and control are essential for sustainable and profitable growth

www.barclaysafrica.com Financial results for the reporting period ended 31 December 2015
123
Risk management overviewfor the reporting period ended 31 December
Future priorities Review and alter risk appetite to take account of global and local macroeconomic deterioration.
Increase focus on model risk and governance across the group.
Continue to strengthen operational risk controls and infrastructure, specifically in the areas of IT, financial crime, and cybercrime.
Enhance conduct risk management controls, tools and reporting.
Increase focus upon data initiatives, including those arising from regulation (e.g. BCBS 239, and IFRS 9).
Risk appetiteRisk appetite and stress testing are key components of the Group’s management of risk and are embedded as part of the strategic planning process. The risk appetite statement describes and measures the amount and types of risk that the Group is prepared to take in executing its strategy. The Group’s risk appetite framework combines a top-down view of capacity to take risk with a bottom-up view of the risk profile associated with each business area’s plans.
Risk appetite key indicators and triggersThe Group manages its risk profile in a forward-looking manner through a trigger and management action framework. Key indicators and triggers have been developed to serve as an early warning system in the event of deteriorating circumstances. The indicators include, inter alia, economic indices directly correlated with risk measures and key financial indicators. The indicators and triggers have been implemented at Group, Business Unit, country, and product levels, and are routinely monitored by management and reported to the GRCMC on a quarterly basis.
Stress testingStress testing is a key element of the Group’s integrated planning process. Through the use of stress testing and scenario analysis, the Group is able to assess the performance of the Group’s portfolios in the expected economic environment and also evaluate the impact of adverse economic conditions.
Actual market stresses, which have been experienced throughout the financial system in recent years, have been used to inform the Group’s capital planning process and enhance the stress scenarios employed. The Group takes into account the results of all such stress testing when assessing the Group’s internal and regulatory capital requirements including the setting of capital buffers.
GRCMC exercises governance oversight and approval authority over stress testing results.
.
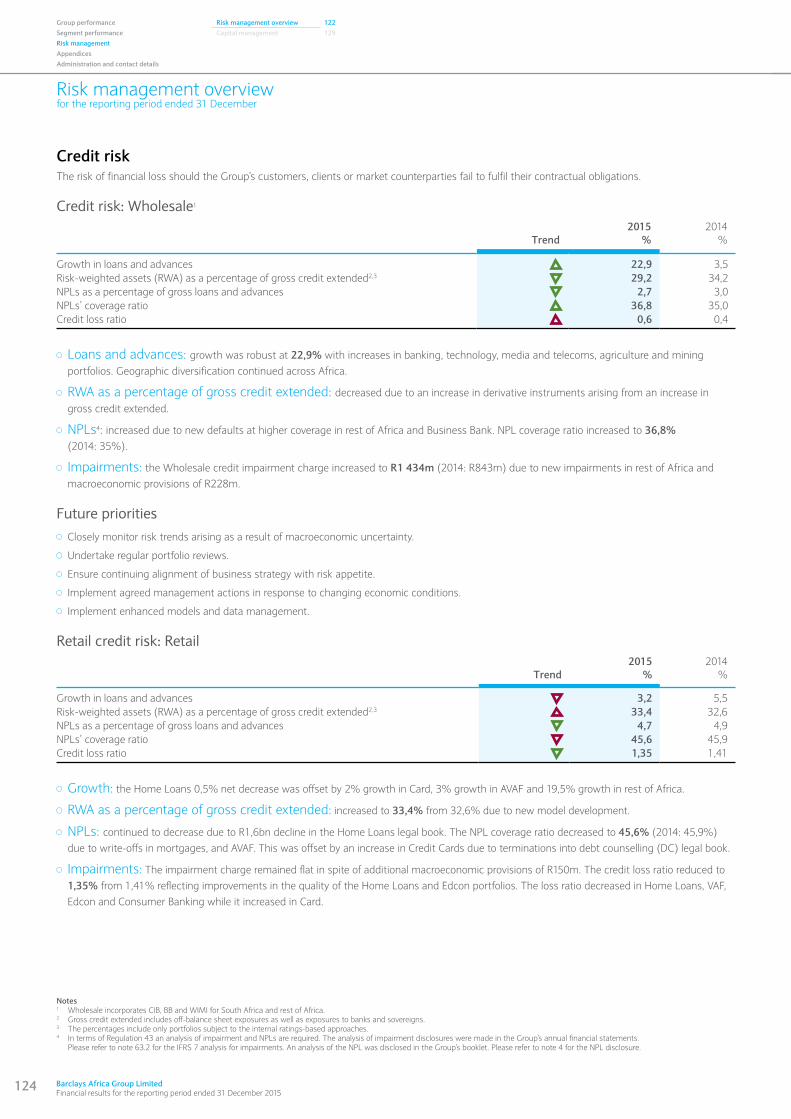
124 Barclays Africa Group Limited Financial results for the reporting period ended 31 December 2015
Risk management overviewfor the reporting period ended 31 December
Group performance Risk management overview 122Segment performance Capital management 129Risk managementAppendicesAdministration and contact details
Notes1 Wholesale incorporates CIB, BB and WIMI for South Africa and rest of Africa.2 Gross credit extended includes off-balance sheet exposures as well as exposures to banks and sovereigns.3 The percentages include only portfolios subject to the internal ratings-based approaches.4 In terms of Regulation 43 an analysis of impairment and NPLs are required. The analysis of impairment disclosures were made in the Group’s annual financial statements.
Please refer to note 63.2 for the IFRS 7 analysis for impairments. An analysis of the NPL was disclosed in the Group’s booklet. Please refer to note 4 for the NPL disclosure.
Credit riskThe risk of financial loss should the Group’s customers, clients or market counterparties fail to fulfil their contractual obligations.
Credit risk: Wholesale1
Trend2015
%2014
%
Growth in loans and advances 22,9 3,5Risk-weighted assets (RWA) as a percentage of gross credit extended2,3 29,2 34,2NPLs as a percentage of gross loans and advances 2,7 3,0NPLs’ coverage ratio 36,8 35,0Credit loss ratio 0,6 0,4
Loans and advances: growth was robust at 22,9% with increases in banking, technology, media and telecoms, agriculture and mining portfolios. Geographic diversification continued across Africa.
RWA as a percentage of gross credit extended: decreased due to an increase in derivative instruments arising from an increase in gross credit extended.
NPLs4: increased due to new defaults at higher coverage in rest of Africa and Business Bank. NPL coverage ratio increased to 36,8% (2014: 35%).
Impairments: the Wholesale credit impairment charge increased to R1 434m (2014: R843m) due to new impairments in rest of Africa and macroeconomic provisions of R228m.
Future priorities Closely monitor risk trends arising as a result of macroeconomic uncertainty.
Undertake regular portfolio reviews.
Ensure continuing alignment of business strategy with risk appetite.
Implement agreed management actions in response to changing economic conditions.
Implement enhanced models and data management.
Retail credit risk: Retail
Trend2015
%2014
%
Growth in loans and advances 3,2 5,5Risk-weighted assets (RWA) as a percentage of gross credit extended2,3 33,4 32,6NPLs as a percentage of gross loans and advances 4,7 4,9NPLs’ coverage ratio 45,6 45,9Credit loss ratio 1,35 1,41
Growth: the Home Loans 0,5% net decrease was offset by 2% growth in Card, 3% growth in AVAF and 19,5% growth in rest of Africa.
RWA as a percentage of gross credit extended: increased to 33,4% from 32,6% due to new model development.
NPLs: continued to decrease due to R1,6bn decline in the Home Loans legal book. The NPL coverage ratio decreased to 45,6% (2014: 45,9%) due to write-offs in mortgages, and AVAF. This was offset by an increase in Credit Cards due to terminations into debt counselling (DC) legal book.
Impairments: The impairment charge remained flat in spite of additional macroeconomic provisions of R150m. The credit loss ratio reduced to 1,35% from 1,41% reflecting improvements in the quality of the Home Loans and Edcon portfolios. The loss ratio decreased in Home Loans, VAF, Edcon and Consumer Banking while it increased in Card.

www.barclaysafrica.com Financial results for the reporting period ended 31 December 2015
125
Risk management overviewfor the reporting period ended 31 December
Note1 Daily value at risk for rest of Africa is based on a historical simulation model that uses sensitivity-based inputs rather than full revaluation as is done for South Africa.
Credit risk (continued)
Future priorities Further enhance collection programmes to ensure appropriate management of customers in financial difficulty.
Continue to focus on models/analytics to improve the Group’s risk profile, measurement and risk-adjusted returns.
Continue to improve internal risk measurement models and processes as part of the ICAAP.
Closely monitor risk trends arising as a result of macroeconomic uncertainty.
Market riskThe risk that the Group’s earnings, capital or business objectives will be adversely impacted by changes in the level or volatility of market rates or prices.
Traded market risk: the risk of the Group being impacted by changes in the level or volatility of positions in trading books, primarily in the Investment Bank.
Non-traded market risk: the risk of the Group’s earnings or capital being reduced due to the market risk exposure from banking book positions which may arise net of hedging activities.
Insurance risk: the risk that future experiences relating to claims, expenses, policyholder behaviour and investment returns are different from the assumptions made when setting premiums or valuing policyholder liabilities.
Pension risk: the risk that arises when an adverse movement between pension assets and liabilities results in a pension deficit.
Trend 2015 2014
Average traded market risk – daily value at risk (Rm)1 27,0 22,3Traded market risk regulatory capital (at 10% of RWAs) (Rm) 2 501 2 178Banking book annual earnings at risk for a 2% interest rate shock (% of Group net interest income) <6% <5%Insurance short-term loss ratio (%) RSA only 69,4 70,9Life insurance new business margin (%) RSA only 5,5 6,6
Traded market risk: trading exposures were managed within overall risk appetite and the trading business remained resilient despite macroeconomic conditions. The increase in average DVaR and Regulatory Capital was a result of increased volatility in the markets especially in the second half of the year.
Non-traded market risk: the Group remained positively exposed to increases in interest rates after the impact of hedging. Basis risks continue to prevail across rest of Africa. Interest rate risk management in rest of Africa remains challenging due to the availability of relevant derivative instruments to hedge.
Insurance risk: the first Own Risk and Solvency Assessment (ORSA) report was submitted to the Financial Services Board, highlighting risk management process improvements.
Pension risk: pension plans and benefits are provided in all presence countries. The Absa Pension Fund remains the largest fund. The overall funding level of the schemes improved in the current year. Following the Absa pension fund investment strategy review, the Liability Driven Investment (LDI) Strategy was implemented.
Future priorities Respond to regulatory and capital change, specifically preparing for the adoption of the fundamental review of the trading book.
Continue to reduce margin volatility through the on-going structural hedge programme in South Africa.
Develop the pension risk appetite for all the Group’s pension schemes in 2016.
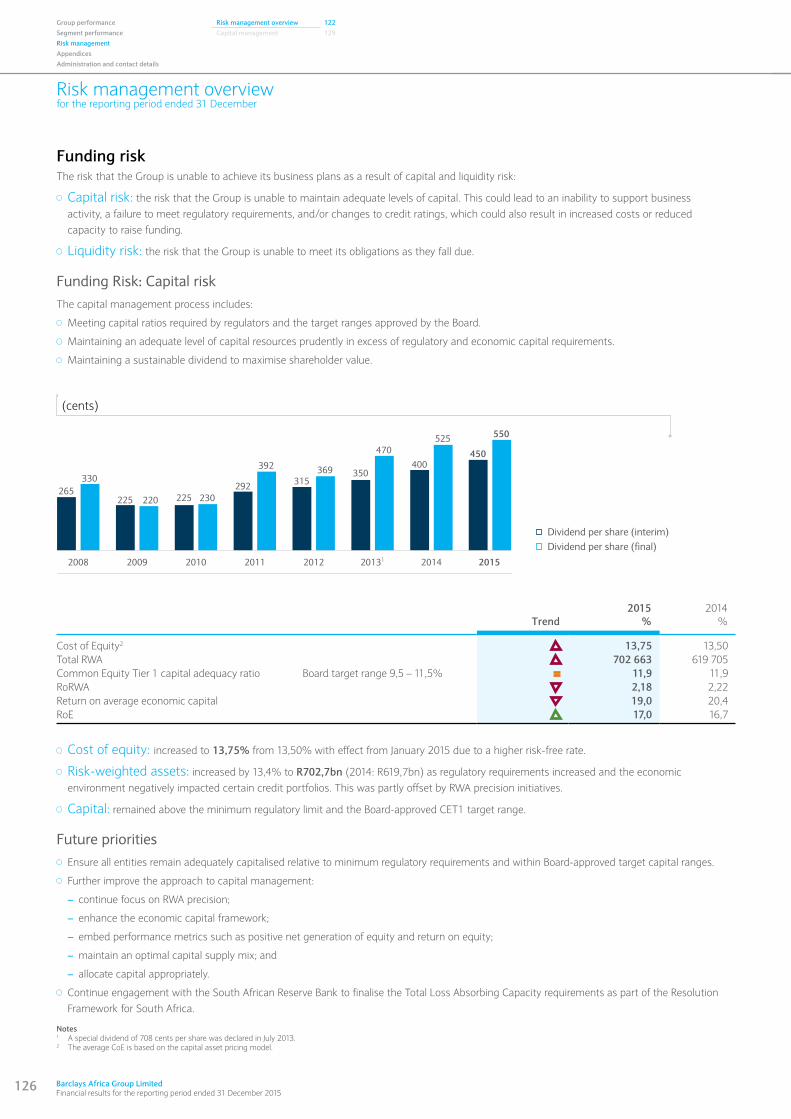
126 Barclays Africa Group Limited Financial results for the reporting period ended 31 December 2015
Risk management overviewfor the reporting period ended 31 December
Group performance Risk management overview 122Segment performance Capital management 129Risk managementAppendicesAdministration and contact details
Funding riskThe risk that the Group is unable to achieve its business plans as a result of capital and liquidity risk:
Capital risk: the risk that the Group is unable to maintain adequate levels of capital. This could lead to an inability to support business activity, a failure to meet regulatory requirements, and/or changes to credit ratings, which could also result in increased costs or reduced capacity to raise funding.
Liquidity risk: the risk that the Group is unable to meet its obligations as they fall due.
Funding Risk: Capital riskThe capital management process includes:
Meeting capital ratios required by regulators and the target ranges approved by the Board.
Maintaining an adequate level of capital resources prudently in excess of regulatory and economic capital requirements.
Maintaining a sustainable dividend to maximise shareholder value.
2014 20152013120122011201020092008
525
450
550
470
369392
230220
330400
350315292
225225265
(cents)
� Dividend per share (interim)� Dividend per share (final)
Trend2015
%2014
%
Cost of Equity2 13,75 13,50Total RWA 702 663 619 705Common Equity Tier 1 capital adequacy ratio Board target range 9,5 – 11,5% 11,9 11,9RoRWA 2,18 2,22Return on average economic capital 19,0 20,4RoE 17,0 16,7
Cost of equity: increased to 13,75% from 13,50% with effect from January 2015 due to a higher risk-free rate.
Risk-weighted assets: increased by 13,4% to R702,7bn (2014: R619,7bn) as regulatory requirements increased and the economic environment negatively impacted certain credit portfolios. This was partly offset by RWA precision initiatives.
Capital: remained above the minimum regulatory limit and the Board-approved CET1 target range.
Future priorities Ensure all entities remain adequately capitalised relative to minimum regulatory requirements and within Board-approved target capital ranges.
Further improve the approach to capital management:
– continue focus on RWA precision;
– enhance the economic capital framework;
– embed performance metrics such as positive net generation of equity and return on equity;
– maintain an optimal capital supply mix; and
– allocate capital appropriately.
Continue engagement with the South African Reserve Bank to finalise the Total Loss Absorbing Capacity requirements as part of the Resolution Framework for South Africa.
Notes1 A special dividend of 708 cents per share was declared in July 2013.2 The average CoE is based on the capital asset pricing model.
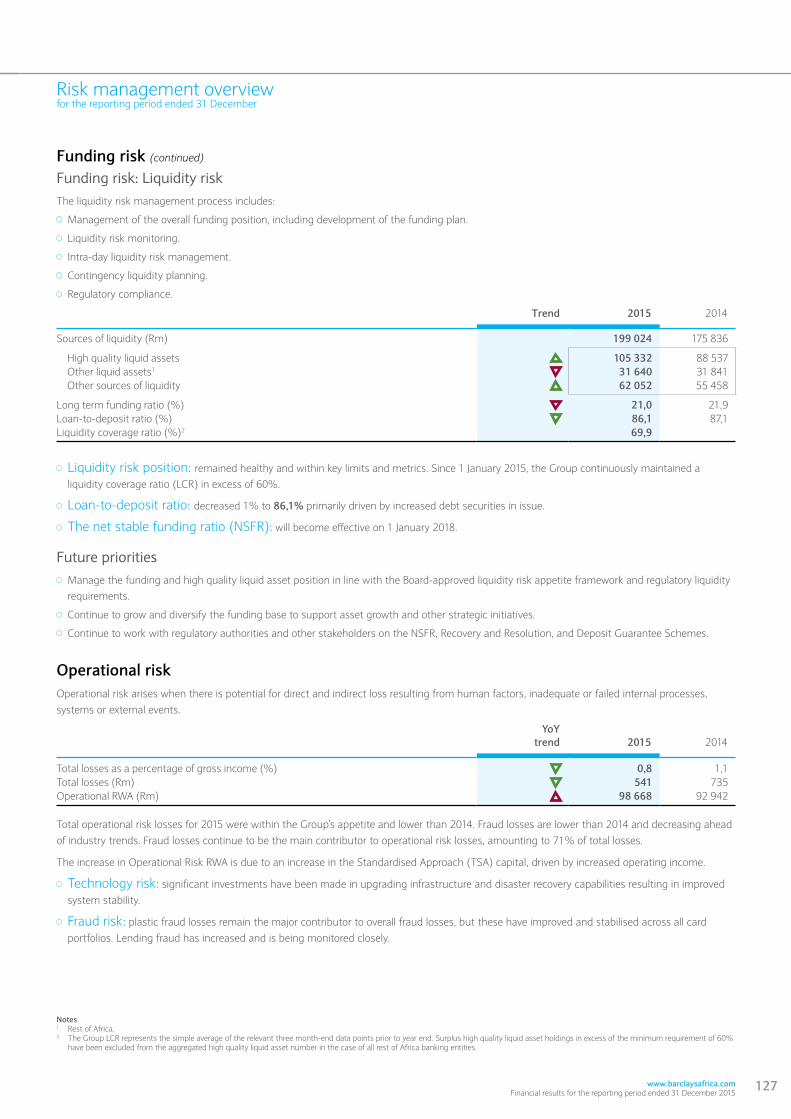
www.barclaysafrica.com Financial results for the reporting period ended 31 December 2015
127
Risk management overviewfor the reporting period ended 31 December
Notes1 Rest of Africa.2 The Group LCR represents the simple average of the relevant three month-end data points prior to year end. Surplus high quality liquid asset holdings in excess of the minimum requirement of 60%
have been excluded from the aggregated high quality liquid asset number in the case of all rest of Africa banking entities.
Funding risk (continued)
Funding risk: Liquidity riskThe liquidity risk management process includes:
Management of the overall funding position, including development of the funding plan.
Liquidity risk monitoring.
Intra-day liquidity risk management.
Contingency liquidity planning.
Regulatory compliance.
Trend 2015 2014
Sources of liquidity (Rm) 199 024 175 836
High quality liquid assets 105 332 88 537 Other liquid assets1 31 640 31 841 Other sources of liquidity 62 052 55 458
Long term funding ratio (%) 21,0 21,9Loan-to-deposit ratio (%) 86,1 87,1Liquidity coverage ratio (%)2 69,9
Liquidity risk position: remained healthy and within key limits and metrics. Since 1 January 2015, the Group continuously maintained a liquidity coverage ratio (LCR) in excess of 60%.
Loan-to-deposit ratio: decreased 1% to 86,1% primarily driven by increased debt securities in issue.
The net stable funding ratio (NSFR): will become effective on 1 January 2018.
Future priorities Manage the funding and high quality liquid asset position in line with the Board-approved liquidity risk appetite framework and regulatory liquidity
requirements.
Continue to grow and diversify the funding base to support asset growth and other strategic initiatives.
Continue to work with regulatory authorities and other stakeholders on the NSFR, Recovery and Resolution, and Deposit Guarantee Schemes.
Operational riskOperational risk arises when there is potential for direct and indirect loss resulting from human factors, inadequate or failed internal processes, systems or external events.
YoYtrend 2015 2014
Total losses as a percentage of gross income (%) 0,8 1,1Total losses (Rm) 541 735Operational RWA (Rm) 98 668 92 942
Total operational risk losses for 2015 were within the Group’s appetite and lower than 2014. Fraud losses are lower than 2014 and decreasing ahead of industry trends. Fraud losses continue to be the main contributor to operational risk losses, amounting to 71% of total losses.
The increase in Operational Risk RWA is due to an increase in the Standardised Approach (TSA) capital, driven by increased operating income.
Technology risk: significant investments have been made in upgrading infrastructure and disaster recovery capabilities resulting in improved system stability.
Fraud risk: plastic fraud losses remain the major contributor to overall fraud losses, but these have improved and stabilised across all card portfolios. Lending fraud has increased and is being monitored closely.
128 Barclays Africa Group Limited Financial results for the reporting period ended 31 December 2015
Risk management overviewfor the reporting period ended 31 December
Group performance Risk management overview 122Segment performance Capital management 129Risk managementAppendicesAdministration and contact details
Operational risk (continued)
Information risk: further progress has been made in enhancing protection of secret and confidential data by improving logical access controls.
Financial crime: satisfactory progress has been made on remediating customer identification and verification issues, customer on-boarding processes, improved customer document retrieval capability as well as improved suspicious transaction monitoring outside South Africa. Automated processes and controls are applied where possible.
Future priorities Technology risk: Continue to invest in technology to improve and maintain technology resilience. Continue focus on cyber risk management.
Financial crime risk: Financial Crime compliance will be strengthened through further investment in technology and transforming the customer on-boarding processes.
Fraud risk: Improve the Group’s fraud capability with a focus on digital banking, branch network and operations in the rest of Africa.
Business continuity management: Challenges to energy and water supply are being closely monitored, and plans developed.
Conduct risk Conduct risk is the risk that detriment is caused to customers, clients, counterparties or the Group because of inappropriate judgement in the execution of business activities.
Review of 2015The key themes identified in conduct material risk assessments were:
Resilience of technology.
Continued levels of regulatory change.
In addition, the Group managed a number of conduct and reputation risks:
A number of accounts deemed to be non-compliant with know your customer (KYC) regulations were blocked with a consequent negative impact on the customer experience.
The Bank closed several branches in line with a strategic drive to implement a multi-channel solution. Stakeholders’ responses were monitored and used to inform the engagement strategy.
The Group managed reputation risk associated with both internal and external fraud.
Implementation of the National Credit Act Amendments that came into effect on 13 September 2015.
The Group considered significant events and issues in the remuneration decisions of individuals and on bonus pools.
Future priorities Increase focus on improving overall regulatory controls, particularly those related to know your client, anti-money laundering, and the National
Credit Act.
Embed material risk assessments and forward-looking Conduct risk reporting across the organisation.
Enhance controls and key performance indicators to track and manage Conduct risk.
Maintain a robust awareness and understanding of drivers of political, regulatory and policy changes across the continent and manage changes to minimise customer impact.
Assess the impact of Twin Peaks regulatory model and specifically the Retail Distribution Review proposals.
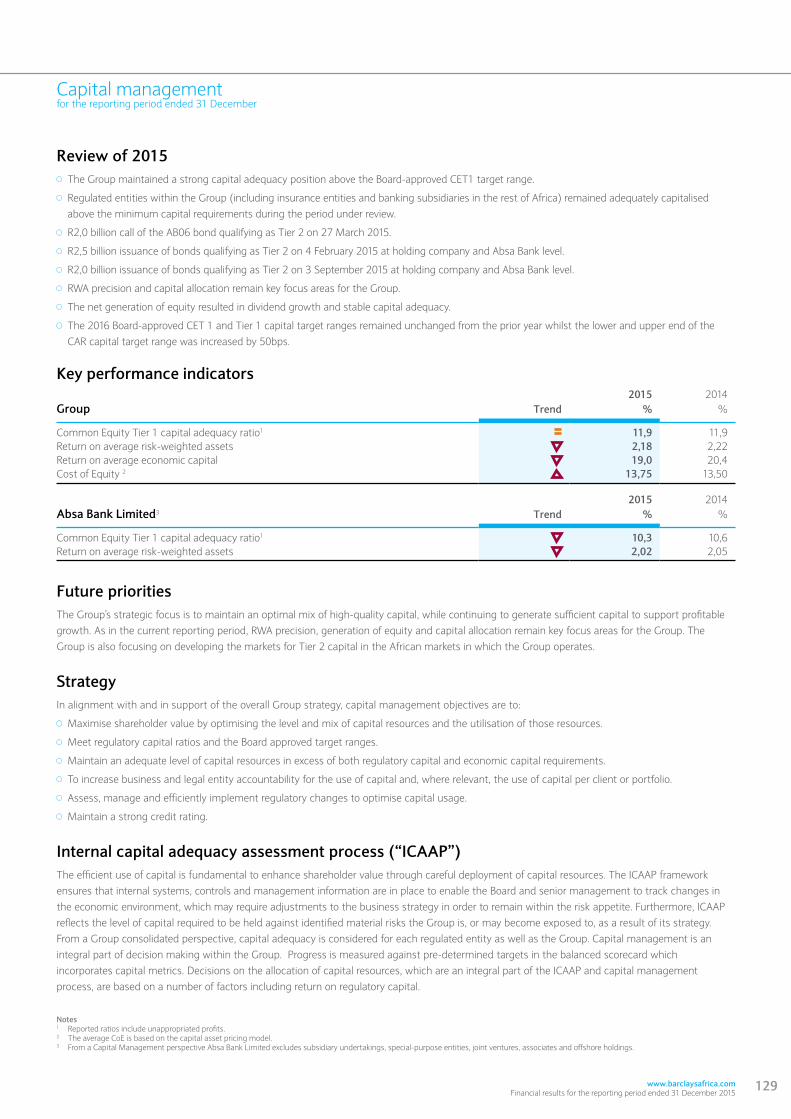
www.barclaysafrica.com Financial results for the reporting period ended 31 December 2015
129
Capital managementfor the reporting period ended 31 December
Key performance indicators 2015 2014
Group Trend % %
Common Equity Tier 1 capital adequacy ratio1 11,9 11,9Return on average risk-weighted assets 2,18 2,22Return on average economic capital 19,0 20,4Cost of Equity 2 13,75 13,50
2015 2014Absa Bank Limited3 Trend % %
Common Equity Tier 1 capital adequacy ratio1 10,3 10,6Return on average risk-weighted assets 2,02 2,05
Future prioritiesThe Group’s strategic focus is to maintain an optimal mix of high-quality capital, while continuing to generate sufficient capital to support profitable growth. As in the current reporting period, RWA precision, generation of equity and capital allocation remain key focus areas for the Group. The Group is also focusing on developing the markets for Tier 2 capital in the African markets in which the Group operates.
StrategyIn alignment with and in support of the overall Group strategy, capital management objectives are to:
Maximise shareholder value by optimising the level and mix of capital resources and the utilisation of those resources.
Meet regulatory capital ratios and the Board approved target ranges.
Maintain an adequate level of capital resources in excess of both regulatory capital and economic capital requirements.
To increase business and legal entity accountability for the use of capital and, where relevant, the use of capital per client or portfolio.
Assess, manage and efficiently implement regulatory changes to optimise capital usage.
Maintain a strong credit rating.
Internal capital adequacy assessment process (“ICAAP”)The efficient use of capital is fundamental to enhance shareholder value through careful deployment of capital resources. The ICAAP framework ensures that internal systems, controls and management information are in place to enable the Board and senior management to track changes in the economic environment, which may require adjustments to the business strategy in order to remain within the risk appetite. Furthermore, ICAAP reflects the level of capital required to be held against identified material risks the Group is, or may become exposed to, as a result of its strategy. From a Group consolidated perspective, capital adequacy is considered for each regulated entity as well as the Group. Capital management is an integral part of decision making within the Group. Progress is measured against pre-determined targets in the balanced scorecard which incorporates capital metrics. Decisions on the allocation of capital resources, which are an integral part of the ICAAP and capital management process, are based on a number of factors including return on regulatory capital.
Notes1 Reported ratios include unappropriated profits.2 The average CoE is based on the capital asset pricing model.3 From a Capital Management perspective Absa Bank Limited excludes subsidiary undertakings, special-purpose entities, joint ventures, associates and offshore holdings.
Review of 2015 The Group maintained a strong capital adequacy position above the Board-approved CET1 target range.
Regulated entities within the Group (including insurance entities and banking subsidiaries in the rest of Africa) remained adequately capitalised above the minimum capital requirements during the period under review.
R2,0 billion call of the AB06 bond qualifying as Tier 2 on 27 March 2015.
R2,5 billion issuance of bonds qualifying as Tier 2 on 4 February 2015 at holding company and Absa Bank level.
R2,0 billion issuance of bonds qualifying as Tier 2 on 3 September 2015 at holding company and Absa Bank level.
RWA precision and capital allocation remain key focus areas for the Group.
The net generation of equity resulted in dividend growth and stable capital adequacy.
The 2016 Board-approved CET 1 and Tier 1 capital target ranges remained unchanged from the prior year whilst the lower and upper end of the CAR capital target range was increased by 50bps.
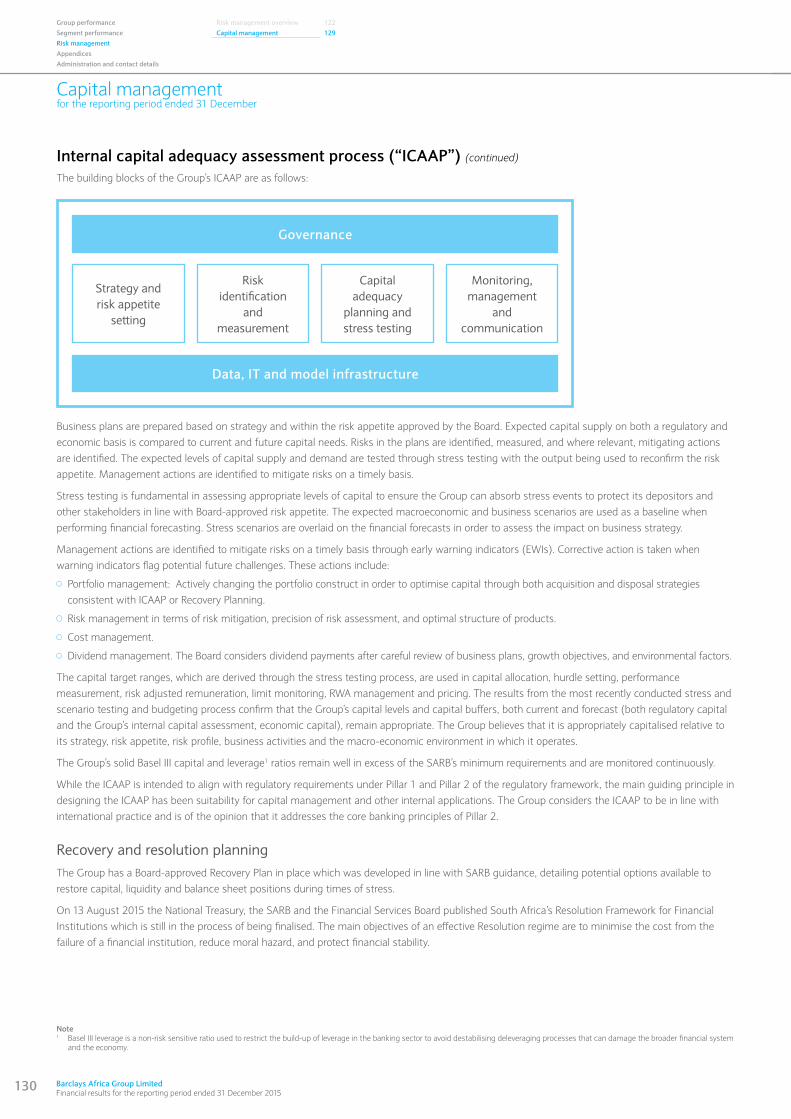
130 Barclays Africa Group Limited Financial results for the reporting period ended 31 December 2015
Capital managementfor the reporting period ended 31 December
Group performance Risk management overview 122Segment performance Capital management 129Risk managementAppendicesAdministration and contact details
Internal capital adequacy assessment process (“ICAAP”) (continued)
The building blocks of the Group’s ICAAP are as follows:
Governance
Strategy andrisk appetite
setting
Risk identification
and measurement
Capital adequacy
planning and stress testing
Monitoring, management
and communication
Data, IT and model infrastructure
Business plans are prepared based on strategy and within the risk appetite approved by the Board. Expected capital supply on both a regulatory and economic basis is compared to current and future capital needs. Risks in the plans are identified, measured, and where relevant, mitigating actions are identified. The expected levels of capital supply and demand are tested through stress testing with the output being used to reconfirm the risk appetite. Management actions are identified to mitigate risks on a timely basis.
Stress testing is fundamental in assessing appropriate levels of capital to ensure the Group can absorb stress events to protect its depositors and other stakeholders in line with Board-approved risk appetite. The expected macroeconomic and business scenarios are used as a baseline when performing financial forecasting. Stress scenarios are overlaid on the financial forecasts in order to assess the impact on business strategy.
Management actions are identified to mitigate risks on a timely basis through early warning indicators (EWIs). Corrective action is taken when warning indicators flag potential future challenges. These actions include:
Portfolio management: Actively changing the portfolio construct in order to optimise capital through both acquisition and disposal strategies consistent with ICAAP or Recovery Planning.
Risk management in terms of risk mitigation, precision of risk assessment, and optimal structure of products.
Cost management.
Dividend management. The Board considers dividend payments after careful review of business plans, growth objectives, and environmental factors.
The capital target ranges, which are derived through the stress testing process, are used in capital allocation, hurdle setting, performance measurement, risk adjusted remuneration, limit monitoring, RWA management and pricing. The results from the most recently conducted stress and scenario testing and budgeting process confirm that the Group’s capital levels and capital buffers, both current and forecast (both regulatory capital and the Group’s internal capital assessment, economic capital), remain appropriate. The Group believes that it is appropriately capitalised relative to its strategy, risk appetite, risk profile, business activities and the macro-economic environment in which it operates.
The Group’s solid Basel III capital and leverage1 ratios remain well in excess of the SARB’s minimum requirements and are monitored continuously.
While the ICAAP is intended to align with regulatory requirements under Pillar 1 and Pillar 2 of the regulatory framework, the main guiding principle in designing the ICAAP has been suitability for capital management and other internal applications. The Group considers the ICAAP to be in line with international practice and is of the opinion that it addresses the core banking principles of Pillar 2.
Recovery and resolution planningThe Group has a Board-approved Recovery Plan in place which was developed in line with SARB guidance, detailing potential options available to restore capital, liquidity and balance sheet positions during times of stress.
On 13 August 2015 the National Treasury, the SARB and the Financial Services Board published South Africa’s Resolution Framework for Financial Institutions which is still in the process of being finalised. The main objectives of an effective Resolution regime are to minimise the cost from the failure of a financial institution, reduce moral hazard, and protect financial stability.
Note1 Basel III leverage is a non-risk sensitive ratio used to restrict the build-up of leverage in the banking sector to avoid destabilising deleveraging processes that can damage the broader financial system
and the economy.
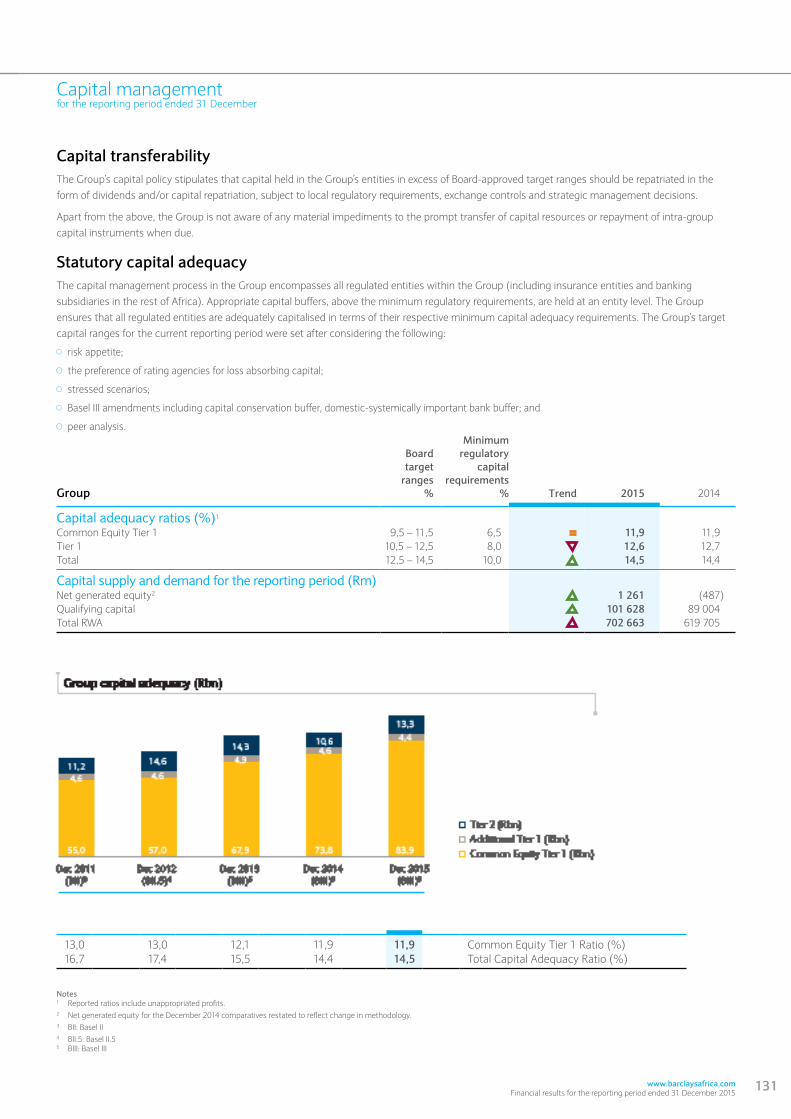
www.barclaysafrica.com Financial results for the reporting period ended 31 December 2015
131
Capital managementfor the reporting period ended 31 December
Capital transferability The Group’s capital policy stipulates that capital held in the Group’s entities in excess of Board-approved target ranges should be repatriated in the form of dividends and/or capital repatriation, subject to local regulatory requirements, exchange controls and strategic management decisions.
Apart from the above, the Group is not aware of any material impediments to the prompt transfer of capital resources or repayment of intra-group capital instruments when due.
Statutory capital adequacy The capital management process in the Group encompasses all regulated entities within the Group (including insurance entities and banking subsidiaries in the rest of Africa). Appropriate capital buffers, above the minimum regulatory requirements, are held at an entity level. The Group ensures that all regulated entities are adequately capitalised in terms of their respective minimum capital adequacy requirements. The Group’s target capital ranges for the current reporting period were set after considering the following:
risk appetite;
the preference of rating agencies for loss absorbing capital;
stressed scenarios;
Basel III amendments including capital conservation buffer, domestic-systemically important bank buffer; and
peer analysis.
Group
Boardtarget
ranges%
Minimumregulatory
capitalrequirements
% Trend 2015 2014
Capital adequacy ratios (%)1
Common Equity Tier 1 9,5 – 11,5 6,5 11,9 11,9Tier 1 10,5 – 12,5 8,0 12,6 12,7Total 12,5 – 14,5 10,0 14,5 14,4
Capital supply and demand for the reporting period (Rm) Net generated equity2 1 261 (487)Qualifying capital 101 628 89 004Total RWA 702 663 619 705
13,0 13,0 12,1 11,9 11,9 Common Equity Tier 1 Ratio (%)16,7 17,4 15,5 14,4 14,5 Total Capital Adequacy Ratio (%)
Notes1 Reported ratios include unappropriated profits.2 Net generated equity for the December 2014 comparatives restated to reflect change in methodology.3 BII: Basel II4 BII.5: Basel II.55 BIII: Basel III
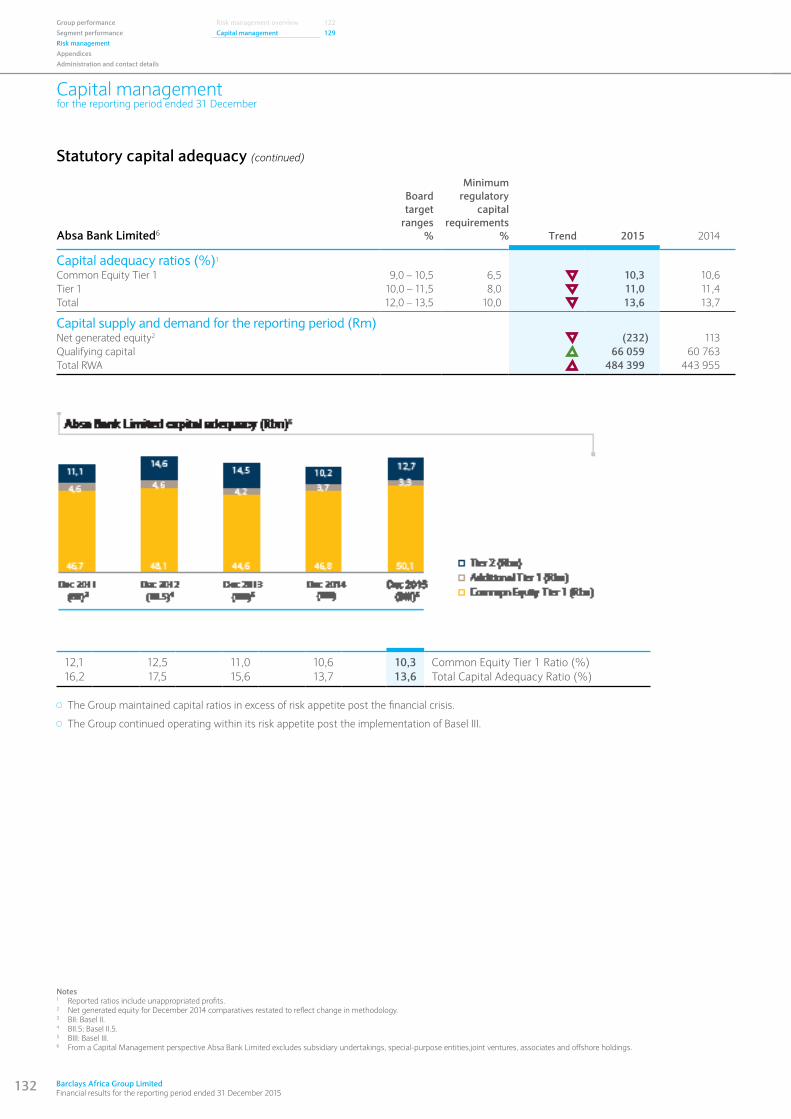
132 Barclays Africa Group Limited Financial results for the reporting period ended 31 December 2015
Capital managementfor the reporting period ended 31 December
Group performance Risk management overview 122Segment performance Capital management 129Risk managementAppendicesAdministration and contact details
Statutory capital adequacy (continued)
Absa Bank Limited6
Boardtarget
ranges%
Minimumregulatory
capitalrequirements
% Trend 2015 2014
Capital adequacy ratios (%)1
Common Equity Tier 1 9,0 – 10,5 6,5 10,3 10,6Tier 1 10,0 – 11,5 8,0 11,0 11,4Total 12,0 – 13,5 10,0 13,6 13,7
Capital supply and demand for the reporting period (Rm) Net generated equity2 (232) 113Qualifying capital 66 059 60 763Total RWA 484 399 443 955
12,1 12,5 11,0 10,6 10,3 Common Equity Tier 1 Ratio (%)16,2 17,5 15,6 13,7 13,6 Total Capital Adequacy Ratio (%)
The Group maintained capital ratios in excess of risk appetite post the financial crisis.
The Group continued operating within its risk appetite post the implementation of Basel III.
Notes1 Reported ratios include unappropriated profits.2 Net generated equity for December 2014 comparatives restated to reflect change in methodology.3 BII: Basel II.4 BII.5: Basel II.5.5 BIII: Basel III.6 From a Capital Management perspective Absa Bank Limited excludes subsidiary undertakings, special-purpose entities,joint ventures, associates and offshore holdings.
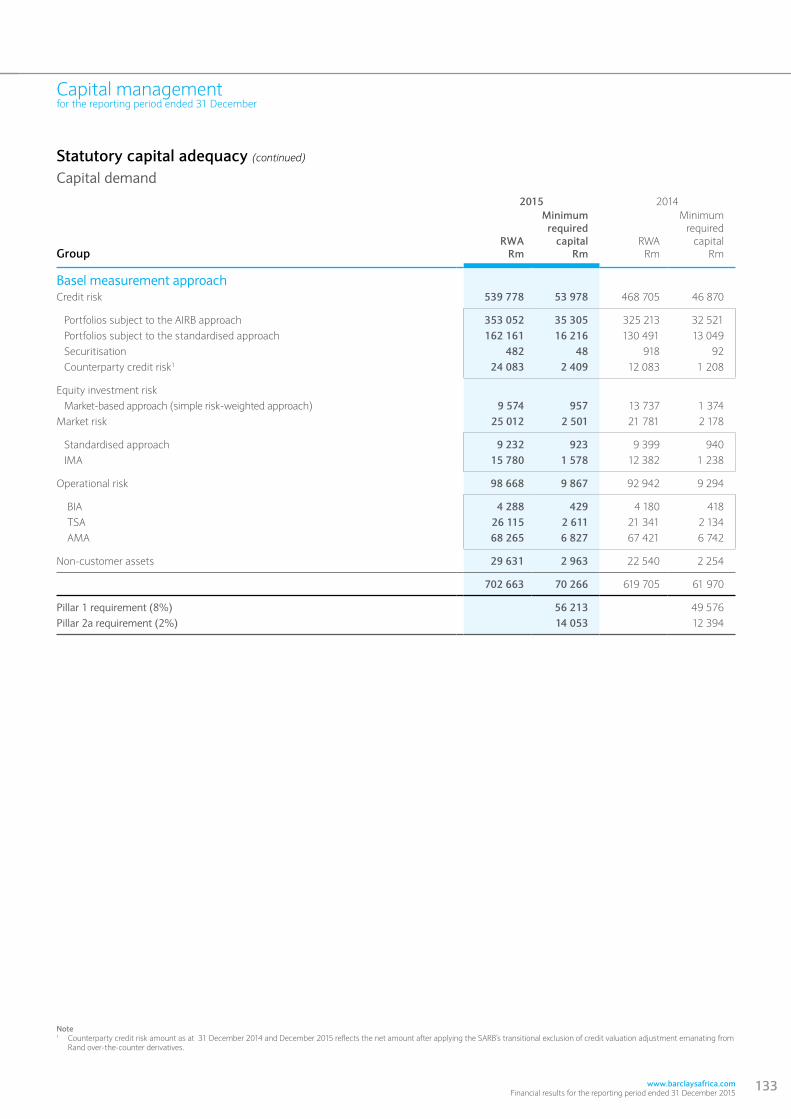
www.barclaysafrica.com Financial results for the reporting period ended 31 December 2015
133
Capital managementfor the reporting period ended 31 December
Statutory capital adequacy (continued)
Capital demand2015 2014
Minimum Minimumrequired required
RWA capital RWA capitalGroup Rm Rm Rm Rm
Basel measurement approachCredit risk 539 778 53 978 468 705 46 870
Portfolios subject to the AIRB approach 353 052 35 305 325 213 32 521Portfolios subject to the standardised approach 162 161 16 216 130 491 13 049Securitisation 482 48 918 92Counterparty credit risk1 24 083 2 409 12 083 1 208
Equity investment risk Market-based approach (simple risk-weighted approach) 9 574 957 13 737 1 374
Market risk 25 012 2 501 21 781 2 178
Standardised approach 9 232 923 9 399 940IMA 15 780 1 578 12 382 1 238
Operational risk 98 668 9 867 92 942 9 294
BIA 4 288 429 4 180 418 TSA 26 115 2 611 21 341 2 134 AMA 68 265 6 827 67 421 6 742
Non-customer assets 29 631 2 963 22 540 2 254
702 663 70 266 619 705 61 970
Pillar 1 requirement (8%) 56 213 49 576Pillar 2a requirement (2%) 14 053 12 394
Note1 Counterparty credit risk amount as at 31 December 2014 and December 2015 reflects the net amount after applying the SARB’s transitional exclusion of credit valuation adjustment emanating from
Rand over-the-counter derivatives.
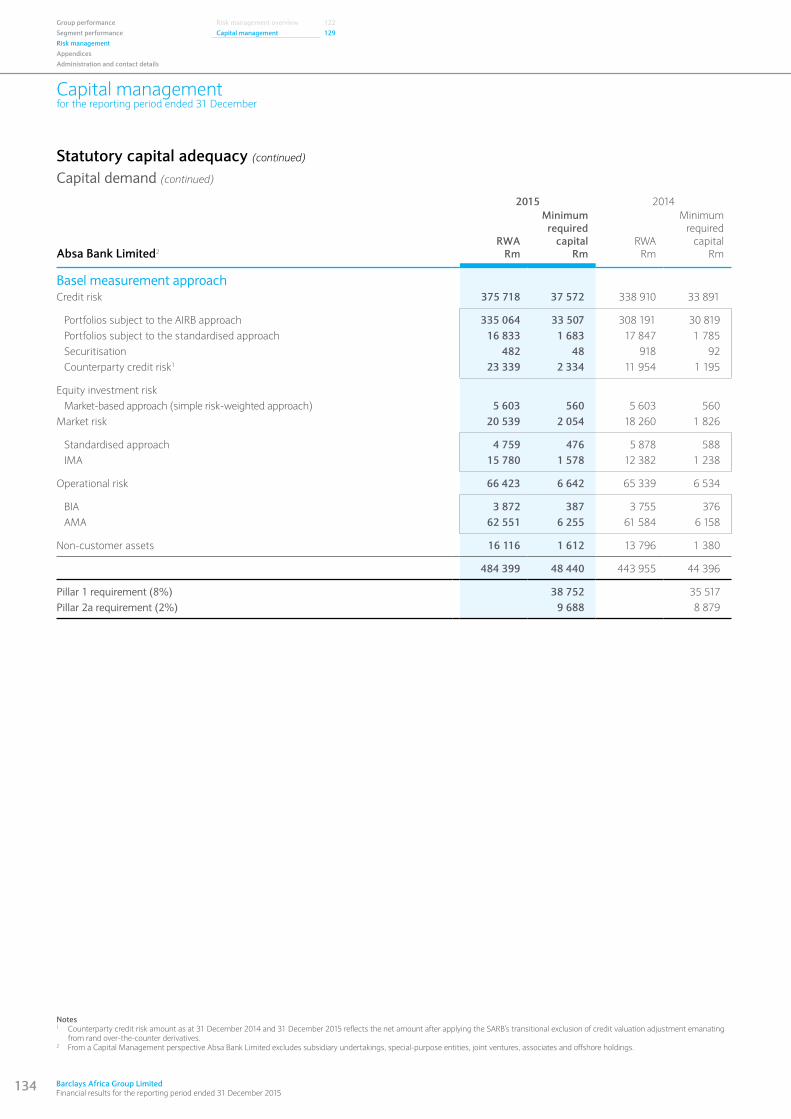
134 Barclays Africa Group Limited Financial results for the reporting period ended 31 December 2015
Capital managementfor the reporting period ended 31 December
Group performance Risk management overview 122Segment performance Capital management 129Risk managementAppendicesAdministration and contact details
Notes1 Counterparty credit risk amount as at 31 December 2014 and 31 December 2015 reflects the net amount after applying the SARB’s transitional exclusion of credit valuation adjustment emanating
from rand over-the-counter derivatives.2 From a Capital Management perspective Absa Bank Limited excludes subsidiary undertakings, special-purpose entities, joint ventures, associates and offshore holdings.
Statutory capital adequacy (continued)
Capital demand (continued)
2015 2014Minimum Minimum
required requiredRWA capital RWA capital
Absa Bank Limited2 Rm Rm Rm Rm
Basel measurement approachCredit risk 375 718 37 572 338 910 33 891
Portfolios subject to the AIRB approach 335 064 33 507 308 191 30 819Portfolios subject to the standardised approach 16 833 1 683 17 847 1 785Securitisation 482 48 918 92Counterparty credit risk1 23 339 2 334 11 954 1 195
Equity investment riskMarket-based approach (simple risk-weighted approach) 5 603 560 5 603 560
Market risk 20 539 2 054 18 260 1 826
Standardised approach 4 759 476 5 878 588IMA 15 780 1 578 12 382 1 238
Operational risk 66 423 6 642 65 339 6 534
BIA 3 872 387 3 755 376AMA 62 551 6 255 61 584 6 158
Non-customer assets 16 116 1 612 13 796 1 380
484 399 48 440 443 955 44 396
Pillar 1 requirement (8%) 38 752 35 517Pillar 2a requirement (2%) 9 688 8 879
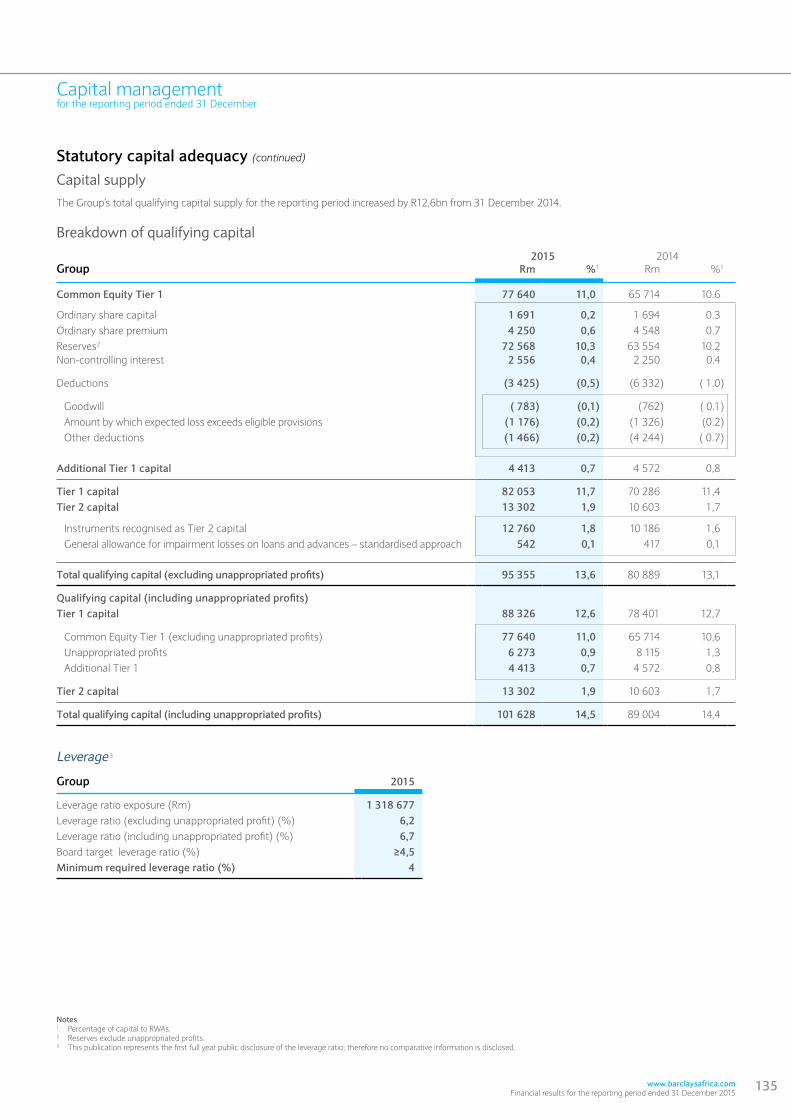
www.barclaysafrica.com Financial results for the reporting period ended 31 December 2015
135
Capital managementfor the reporting period ended 31 December
Statutory capital adequacy (continued) Capital supplyThe Group’s total qualifying capital supply for the reporting period increased by R12,6bn from 31 December 2014.
Breakdown of qualifying capital
2015 2014Group Rm %1 Rm %1
Common Equity Tier 1 77 640 11,0 65 714 10.6
Ordinary share capital 1 691 0,2 1 694 0.3Ordinary share premium 4 250 0,6 4 548 0.7Reserves2 72 568 10,3 63 554 10.2Non-controlling interest 2 556 0,4 2 250 0.4
Deductions (3 425) (0,5) (6 332) ( 1.0)
Goodwill ( 783) (0,1) (762) ( 0.1)Amount by which expected loss exceeds eligible provisions (1 176) (0,2) (1 326) (0.2)Other deductions (1 466) (0,2) (4 244) ( 0.7)
Additional Tier 1 capital 4 413 0,7 4 572 0,8
Tier 1 capital 82 053 11,7 70 286 11,4Tier 2 capital 13 302 1,9 10 603 1,7
Instruments recognised as Tier 2 capital 12 760 1,8 10 186 1,6General allowance for impairment losses on loans and advances – standardised approach 542 0,1 417 0,1
Total qualifying capital (excluding unappropriated profits) 95 355 13,6 80 889 13,1
Qualifying capital (including unappropriated profits)Tier 1 capital 88 326 12,6 78 401 12,7
Common Equity Tier 1 (excluding unappropriated profits) 77 640 11,0 65 714 10,6Unappropriated profits 6 273 0,9 8 115 1,3Additional Tier 1 4 413 0,7 4 572 0,8
Tier 2 capital 13 302 1,9 10 603 1,7
Total qualifying capital (including unappropriated profits) 101 628 14,5 89 004 14,4
Leverage 3
Group 2015
Leverage ratio exposure (Rm) 1 318 677Leverage ratio (excluding unappropriated profit) (%) 6,2Leverage ratio (including unappropriated profit) (%) 6,7Board target leverage ratio (%) ≥4,5Minimum required leverage ratio (%) 4
Notes1 Percentage of capital to RWAs.2 Reserves exclude unappropriated profits.3 This publication represents the first full year public disclosure of the leverage ratio; therefore no comparative information is disclosed.
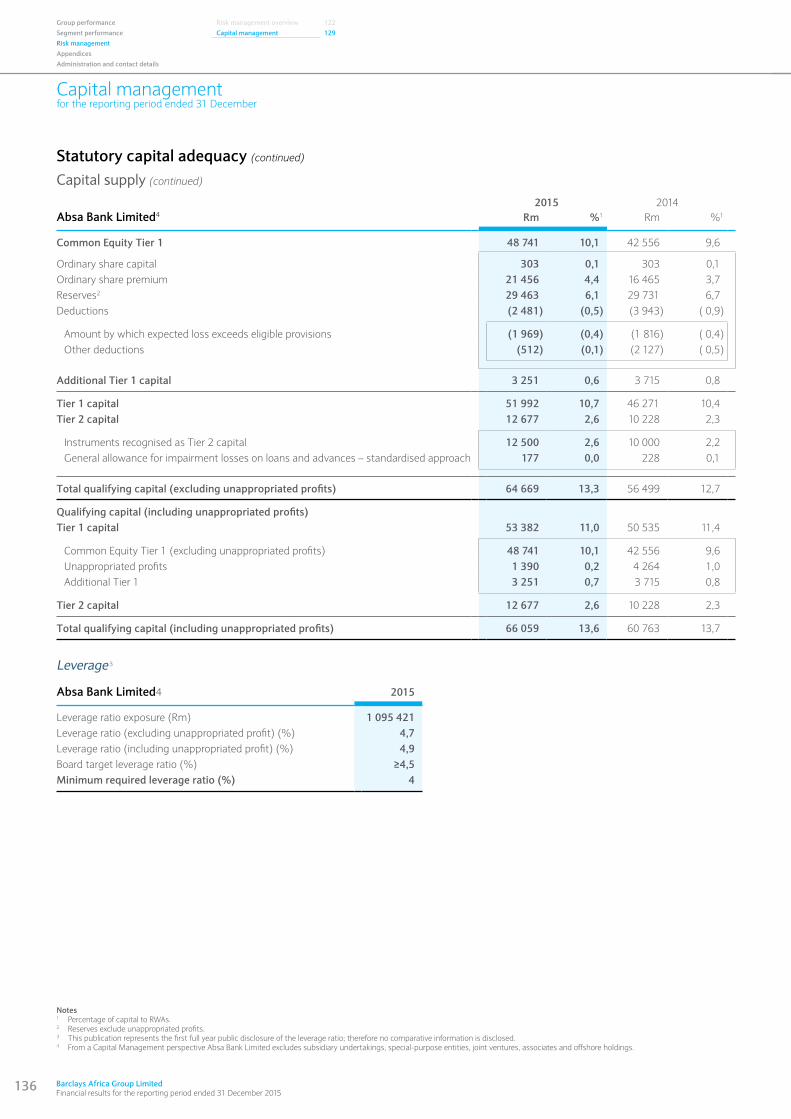
136 Barclays Africa Group Limited Financial results for the reporting period ended 31 December 2015
Capital managementfor the reporting period ended 31 December
Group performance Risk management overview 122Segment performance Capital management 129Risk managementAppendicesAdministration and contact details
Statutory capital adequacy (continued)
Capital supply (continued)
2015 2014Absa Bank Limited4 Rm %1 Rm %1
Common Equity Tier 1 48 741 10,1 42 556 9,6
Ordinary share capital 303 0,1 303 0,1Ordinary share premium 21 456 4,4 16 465 3,7Reserves2 29 463 6,1 29 731 6,7Deductions (2 481) (0,5) (3 943) ( 0,9)
Amount by which expected loss exceeds eligible provisions (1 969) (0,4) (1 816) ( 0,4)Other deductions (512) (0,1) (2 127) ( 0,5)
Additional Tier 1 capital 3 251 0,6 3 715 0,8
Tier 1 capital 51 992 10,7 46 271 10,4Tier 2 capital 12 677 2,6 10 228 2,3
Instruments recognised as Tier 2 capital 12 500 2,6 10 000 2,2General allowance for impairment losses on loans and advances – standardised approach 177 0,0 228 0,1
Total qualifying capital (excluding unappropriated profits) 64 669 13,3 56 499 12,7
Qualifying capital (including unappropriated profits)Tier 1 capital 53 382 11,0 50 535 11,4
Common Equity Tier 1 (excluding unappropriated profits) 48 741 10,1 42 556 9,6 Unappropriated profits 1 390 0,2 4 264 1,0 Additional Tier 1 3 251 0,7 3 715 0,8
Tier 2 capital 12 677 2,6 10 228 2,3
Total qualifying capital (including unappropriated profits) 66 059 13,6 60 763 13,7
Leverage 3
Absa Bank Limited4 2015
Leverage ratio exposure (Rm) 1 095 421Leverage ratio (excluding unappropriated profit) (%) 4,7Leverage ratio (including unappropriated profit) (%) 4,9Board target leverage ratio (%) ≥4,5Minimum required leverage ratio (%) 4
Notes1 Percentage of capital to RWAs.2 Reserves exclude unappropriated profits.3 This publication represents the first full year public disclosure of the leverage ratio; therefore no comparative information is disclosed.4 From a Capital Management perspective Absa Bank Limited excludes subsidiary undertakings, special-purpose entities, joint ventures, associates and offshore holdings.
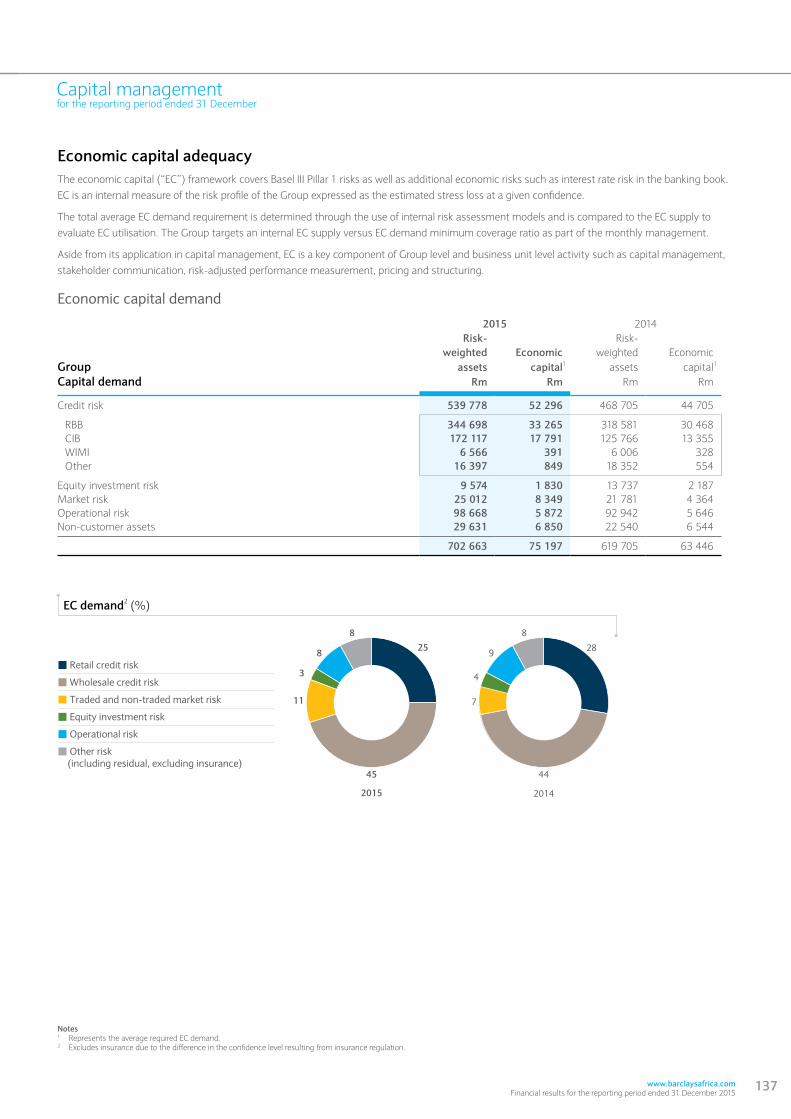
www.barclaysafrica.com Financial results for the reporting period ended 31 December 2015
137
Capital managementfor the reporting period ended 31 December
Economic capital adequacyThe economic capital (“EC”) framework covers Basel III Pillar 1 risks as well as additional economic risks such as interest rate risk in the banking book. EC is an internal measure of the risk profile of the Group expressed as the estimated stress loss at a given confidence.
The total average EC demand requirement is determined through the use of internal risk assessment models and is compared to the EC supply to evaluate EC utilisation. The Group targets an internal EC supply versus EC demand minimum coverage ratio as part of the monthly management.
Aside from its application in capital management, EC is a key component of Group level and business unit level activity such as capital management, stakeholder communication, risk-adjusted performance measurement, pricing and structuring.
Economic capital demand
2015 2014Risk- Risk-
weighted Economic weighted EconomicGroup assets capital1 assets capital1
Capital demand Rm Rm Rm Rm
Credit risk 539 778 52 296 468 705 44 705
RBB 344 698 33 265 318 581 30 468 CIB 172 117 17 791 125 766 13 355 WIMI 6 566 391 6 006 328Other 16 397 849 18 352 554
Equity investment risk 9 574 1 830 13 737 2 187 Market risk 25 012 8 349 21 781 4 364 Operational risk 98 668 5 872 92 942 5 646 Non-customer assets 29 631 6 850 22 540 6 544
702 663 75 197 619 705 63 446
Notes1 Represents the average required EC demand.2 Excludes insurance due to the difference in the confidence level resulting from insurance regulation.
45
8
8
3
11
25
44
9
8
4
7
28
EC demand2 (%)
� Retail credit risk
� Wholesale credit risk
� Traded and non-traded market risk
� Equity investment risk
� Operational risk
� Other risk (including residual, excluding insurance)
20142015

138 Barclays Africa Group Limited Financial results for the reporting period ended 31 December 2015
Capital managementfor the reporting period ended 31 December
Group performance Risk management overview 122Segment performance Capital management 129Risk managementAppendicesAdministration and contact details
Economic capital supplyThe resources available to meet EC requirements are calculated as the average available shareholders’ equity after adjustments including preference shares. The Group’s EC calculations form the basis of its internal risk view used in the ICAAP. Funds available for EC are impacted by a number of factors that have arisen from the application of IFRS.
EC supply includes:
ordinary shareholders’ equity;
retained earnings, whether appropriated or not;
non-redeemable, non-cumulative preference shares;
non-controlling interests; and
other reserves.
The following are excluded from EC available financial resources:
Cash flow hedging reserve: to the extent that the Group undertakes the hedging of future cash flows, shareholders’ equity will include gains and losses that will be offset against the gain or loss on the hedged item when it is recognised in the statement of comprehensive income at the conclusion of the hedged transaction. Given the future offset of such gains and losses, they are excluded from shareholders’ equity when calculating EC; and
Other perpetual debt, preference shares and subordinated debt.
The following are deducted from EC supply:
goodwill; and
intangible assets
2015 2014Share- Tier 1 Share- Tier 1
holders’ Economic regulatory holders’ Economic regulatoryGroup equity capital capital equity capital capitalTotal qualifying capital Rm Rm Rm Rm Rm Rm
Ordinary share capital and share premium 5 941 5 941 5 941 6 242 6 242 6 242Preference share capital and share premium - 4 644 4 413 — 4 644 4 572Retained earnings 75 785 75 785 73 026 70 237 70 237 66 931Other reserves 7 567 9 438 5 815 6 211 5 859 4 738Non-controlling interest — 4 710 2 556 — 3 611 2 250Expected loss adjustment — — (1 176) — — (1 326)Other deductions — (3 772) (2 249) — (3 219) (5 006)
89 293 96 746 88 326 82 690 87 374 78 401
Average capital for the reporting period 84 163 88 902 80 285 78 009 82 414 74 690
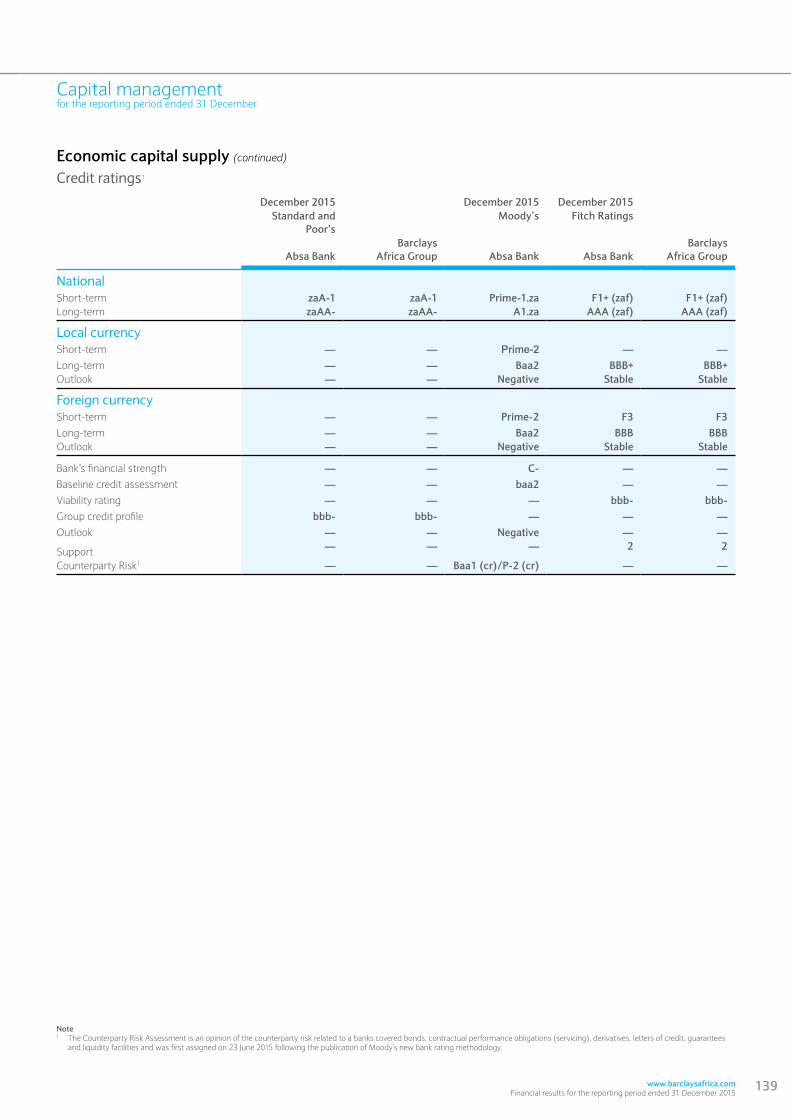
www.barclaysafrica.com Financial results for the reporting period ended 31 December 2015
139
Capital managementfor the reporting period ended 31 December
Economic capital supply (continued) Credit ratings1
December 2015 December 2015 December 2015Standard and
Poor’sMoody’s Fitch Ratings
Absa BankBarclays
Africa Group Absa Bank Absa BankBarclays
Africa Group
NationalShort-term zaA-1 zaA-1 Prime-1.za F1+ (zaf) F1+ (zaf)Long-term zaAA- zaAA- A1.za AAA (zaf) AAA (zaf)
Local currencyShort-term — — Prime-2 — —
Long-term — — Baa2 BBB+ BBB+Outlook — — Negative Stable Stable
Foreign currencyShort-term — — Prime-2 F3 F3Long-term — — Baa2 BBB BBBOutlook — — Negative Stable Stable
Bank’s financial strength — — C- — —
Baseline credit assessment — — baa2 — —
Viability rating — — — bbb- bbb-Group credit profile bbb- bbb- — — —
Outlook — — Negative — —
Support — — — 2 2
Counterparty Risk1 — — Baa1 (cr)/P-2 (cr) — —
Note1 The Counterparty Risk Assessment is an opinion of the counterparty risk related to a banks covered bonds, contractual performance obligations (servicing), derivatives, letters of credit, guarantees
and liquidity facilities and was first assigned on 23 June 2015 following the publication of Moody’s new bank rating methodology.
140 Barclays Africa Group Limited Financial results for the reporting period ended 31 December 2015
Group performance Risk management overview 122Segment performance Capital management 129Risk managementAppendicesAdministration and contact details
This page has been left blank intentionally

www.barclaysafrica.com Financial results for the reporting period ended 31 December 2015
141
Appendices
ContentsTransition to Barclays Africa Group Limited 142
Share performance 144
Shareholder information and diary 145
Glossary 146
Abbreviations and acronyms 154
Administration and contact details 155
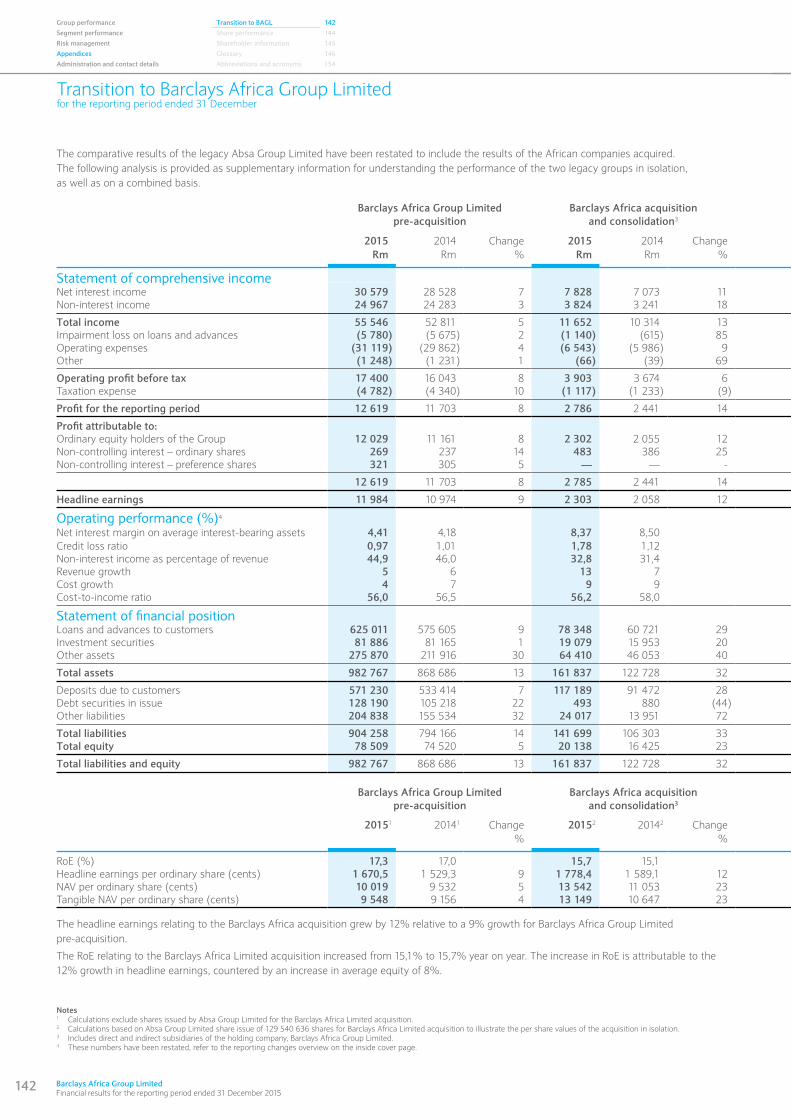
142 Barclays Africa Group Limited Financial results for the reporting period ended 31 December 2015
Group performance Transition to BAGL 142Segment performance Share performance 144Risk management Shareholder information 145Appendices Glossary 146Administration and contact details Abbreviations and acronyms 154
Transition to Barclays Africa Group Limitedfor the reporting period ended 31 December
The comparative results of the legacy Absa Group Limited have been restated to include the results of the African companies acquired. The following analysis is provided as supplementary information for understanding the performance of the two legacy groups in isolation, as well as on a combined basis.
Barclays Africa Group Limited pre-acquisition
Barclays Africa acquisition
and consolidation3 Barclays Africa Group Limited
2015 2014 Change 2015 2014 Change 2015 2014 ChangeRm Rm % Rm Rm % Rm Rm %
Statement of comprehensive incomeNet interest income 30 579 28 528 7 7 828 7 073 11 38 407 35 601 8Non-interest income 24 967 24 283 3 3 824 3 241 18 28 791 27 524 5
Total income 55 546 52 811 5 11 652 10 314 13 67 198 63 125 6Impairment loss on loans and advances (5 780) (5 675) 2 (1 140) (615) 85 (6 920) (6 290) 10Operating expenses (31 119) (29 862) 4 (6 543) (5 986) 9 (37 662) (35 848) 5Other (1 248) (1 231) 1 (66) (39) 69 (1 314) (1 270) 3
Operating profit before tax 17 400 16 043 8 3 903 3 674 6 21 303 19 717 8Taxation expense (4 782) (4 340) 10 (1 117) (1 233) (9) (5 899) (5 573) 6
Profit for the reporting period 12 619 11 703 8 2 786 2 441 14 15 404 14 144 9
Profit attributable to:Ordinary equity holders of the Group 12 029 11 161 8 2 302 2 055 12 14 331 13 216 8Non-controlling interest – ordinary shares 269 237 14 483 386 25 752 623 21Non-controlling interest – preference shares 321 305 5 — — - 321 305 5
12 619 11 703 8 2 785 2 441 14 15 404 14 144 9
Headline earnings 11 984 10 974 9 2 303 2 058 12 14 287 13 032 10
Operating performance (%)4 Net interest margin on average interest-bearing assets 4,41 4,18 8,37 8,50 4,81 4,65Credit loss ratio 0,97 1,01 1,78 1,12 1,05 1,02Non-interest income as percentage of revenue 44,9 46,0 32,8 31,4 42,8 43,6Revenue growth 5 6 13 7 6 6Cost growth 4 7 9 9 5 7Cost-to-income ratio 56,0 56,5 56,2 58,0 56,0 56,8
Statement of financial positionLoans and advances to customers 625 011 575 605 9 78 348 60 721 29 703 359 636 326 11Investment securities 81 886 81 165 1 19 079 15 953 20 100 965 97 118 4Other assets 275 870 211 916 30 64 410 46 053 40 340 280 257 970 32
Total assets 982 767 868 686 13 161 837 122 728 32 1 144 604 991 414 15
Deposits due to customers 571 230 533 414 7 117 189 91 472 28 688 419 624 886 10Debt securities in issue 128 190 105 218 22 493 880 (44) 128 683 106 098 21Other liabilities 204 838 155 534 32 24 017 13 951 72 228 855 169 485 35
Total liabilities 904 258 794 166 14 141 699 106 303 33 1 045 957 900 469 16Total equity 78 509 74 520 5 20 138 16 425 23 98 647 90 945 8
Total liabilities and equity 982 767 868 686 13 161 837 122 728 32 1 144 604 991 414 15
Notes1 Calculations exclude shares issued by Absa Group Limited for the Barclays Africa Limited acquisition.2 Calculations based on Absa Group Limited share issue of 129 540 636 shares for Barclays Africa Limited acquisition to illustrate the per share values of the acquisition in isolation.3 Includes direct and indirect subsidiaries of the holding company, Barclays Africa Group Limited.4 These numbers have been restated, refer to the reporting changes overview on the inside cover page.
Barclays Africa Group Limited pre-acquisition
Barclays Africa acquisition
and consolidation3 Barclays Africa Group Limited
20151 20141 Change 20152 20142 Change 2015 2014 Change% % %
RoE (%) 17,3 17,0 15,7 15,1 17,0 16,7Headline earnings per ordinary share (cents) 1 670,5 1 529,3 9 1 778,4 1 589,1 12 1 687,2 1 538,4 10NAV per ordinary share (cents) 10 019 9 532 5 13 542 11 053 23 10 558 9 764 8Tangible NAV per ordinary share (cents) 9 548 9 156 4 13 149 10 647 23 10 112 9 384 8
The headline earnings relating to the Barclays Africa acquisition grew by 12% relative to a 9% growth for Barclays Africa Group Limited pre-acquisition.
The RoE relating to the Barclays Africa Limited acquisition increased from 15,1% to 15,7% year on year. The increase in RoE is attributable to the 12% growth in headline earnings, countered by an increase in average equity of 8%.
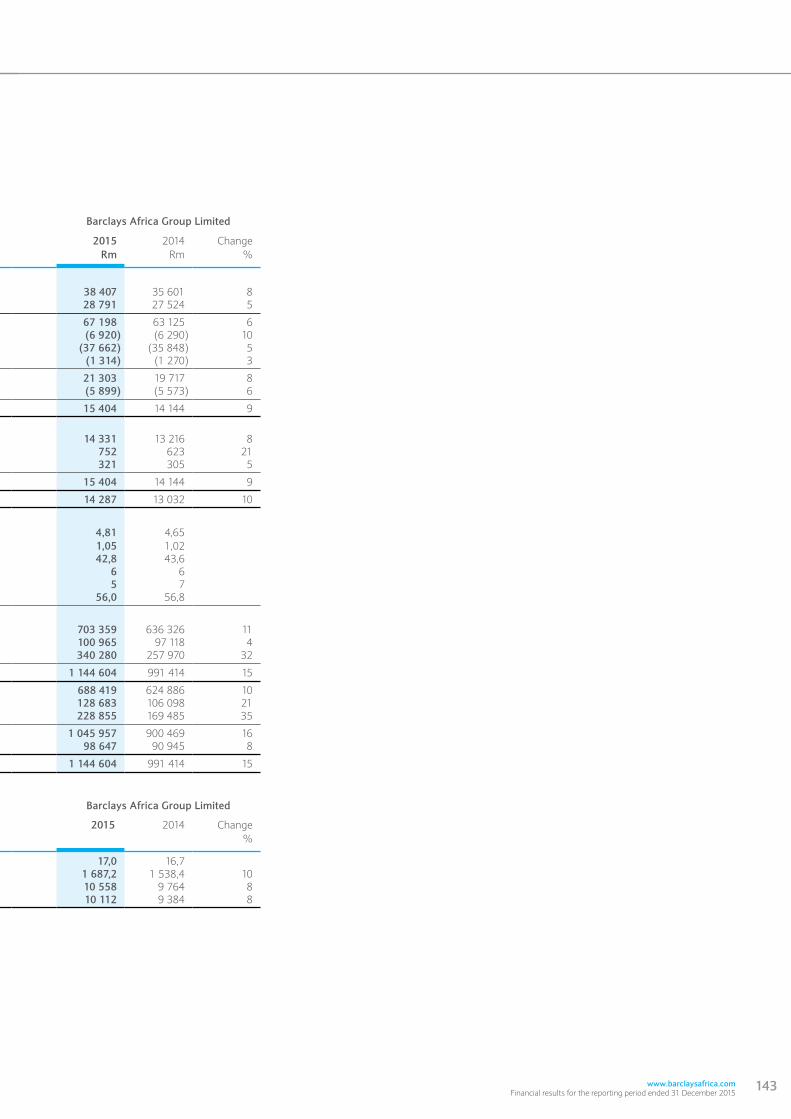
www.barclaysafrica.com Financial results for the reporting period ended 31 December 2015
143
The comparative results of the legacy Absa Group Limited have been restated to include the results of the African companies acquired. The following analysis is provided as supplementary information for understanding the performance of the two legacy groups in isolation, as well as on a combined basis.
Barclays Africa Group Limited pre-acquisition
Barclays Africa acquisition
and consolidation3 Barclays Africa Group Limited
2015 2014 Change 2015 2014 Change 2015 2014 ChangeRm Rm % Rm Rm % Rm Rm %
Statement of comprehensive incomeNet interest income 30 579 28 528 7 7 828 7 073 11 38 407 35 601 8Non-interest income 24 967 24 283 3 3 824 3 241 18 28 791 27 524 5
Total income 55 546 52 811 5 11 652 10 314 13 67 198 63 125 6Impairment loss on loans and advances (5 780) (5 675) 2 (1 140) (615) 85 (6 920) (6 290) 10Operating expenses (31 119) (29 862) 4 (6 543) (5 986) 9 (37 662) (35 848) 5Other (1 248) (1 231) 1 (66) (39) 69 (1 314) (1 270) 3
Operating profit before tax 17 400 16 043 8 3 903 3 674 6 21 303 19 717 8Taxation expense (4 782) (4 340) 10 (1 117) (1 233) (9) (5 899) (5 573) 6
Profit for the reporting period 12 619 11 703 8 2 786 2 441 14 15 404 14 144 9
Profit attributable to:Ordinary equity holders of the Group 12 029 11 161 8 2 302 2 055 12 14 331 13 216 8Non-controlling interest – ordinary shares 269 237 14 483 386 25 752 623 21Non-controlling interest – preference shares 321 305 5 — — - 321 305 5
12 619 11 703 8 2 785 2 441 14 15 404 14 144 9
Headline earnings 11 984 10 974 9 2 303 2 058 12 14 287 13 032 10
Operating performance (%)4 Net interest margin on average interest-bearing assets 4,41 4,18 8,37 8,50 4,81 4,65Credit loss ratio 0,97 1,01 1,78 1,12 1,05 1,02Non-interest income as percentage of revenue 44,9 46,0 32,8 31,4 42,8 43,6Revenue growth 5 6 13 7 6 6Cost growth 4 7 9 9 5 7Cost-to-income ratio 56,0 56,5 56,2 58,0 56,0 56,8
Statement of financial positionLoans and advances to customers 625 011 575 605 9 78 348 60 721 29 703 359 636 326 11Investment securities 81 886 81 165 1 19 079 15 953 20 100 965 97 118 4Other assets 275 870 211 916 30 64 410 46 053 40 340 280 257 970 32
Total assets 982 767 868 686 13 161 837 122 728 32 1 144 604 991 414 15
Deposits due to customers 571 230 533 414 7 117 189 91 472 28 688 419 624 886 10Debt securities in issue 128 190 105 218 22 493 880 (44) 128 683 106 098 21Other liabilities 204 838 155 534 32 24 017 13 951 72 228 855 169 485 35
Total liabilities 904 258 794 166 14 141 699 106 303 33 1 045 957 900 469 16Total equity 78 509 74 520 5 20 138 16 425 23 98 647 90 945 8
Total liabilities and equity 982 767 868 686 13 161 837 122 728 32 1 144 604 991 414 15
Barclays Africa Group Limited pre-acquisition
Barclays Africa acquisition
and consolidation3 Barclays Africa Group Limited
20151 20141 Change 20152 20142 Change 2015 2014 Change% % %
RoE (%) 17,3 17,0 15,7 15,1 17,0 16,7Headline earnings per ordinary share (cents) 1 670,5 1 529,3 9 1 778,4 1 589,1 12 1 687,2 1 538,4 10NAV per ordinary share (cents) 10 019 9 532 5 13 542 11 053 23 10 558 9 764 8Tangible NAV per ordinary share (cents) 9 548 9 156 4 13 149 10 647 23 10 112 9 384 8

144 Barclays Africa Group Limited Financial results for the reporting period ended 31 December 2015
December 15December 14December 13December 12
Share performance (cents)
14 34916 400
Banks’ index
Barclays Africa Group
• •
61 07253 362•
13 225•
57 745•
18 200•
72 998•
•
Group performance Transition to BAGL 142Segment performance Share performance 144Risk management Shareholder information 145Appendices Glossary 146Administration and contact details Abbreviations and acronyms 154
Share performancefor the reporting period ended 31 December
2015 2014 ChangeShare performance on the JSE %
Number of shares in issue, which includes 2 025 369 (2014: 880 000) treasury shares 847 750 679 847 750 679Market prices (cents per share):
closing 14 349 18 200 (21)
high 20 371 18 452 10
low 10 662 12 207 (13)
average 17 786 15 670 14
Closing price/NAV per share (excluding preference shares) (%) 1,36 1,86
Price-to-earnings ratio (closing price/HEPS) (%) 8,5 11,8
Volume of shares traded (million) 334,88 319,57 5
Value of shares traded (Rm) 58 640,7 49 659,2 18
Market capitalisation (Rm) 121 643,7 154 050,8 (21)
Annual total return (%) (15,8) 44,2 <(100)
Share performance (cents)
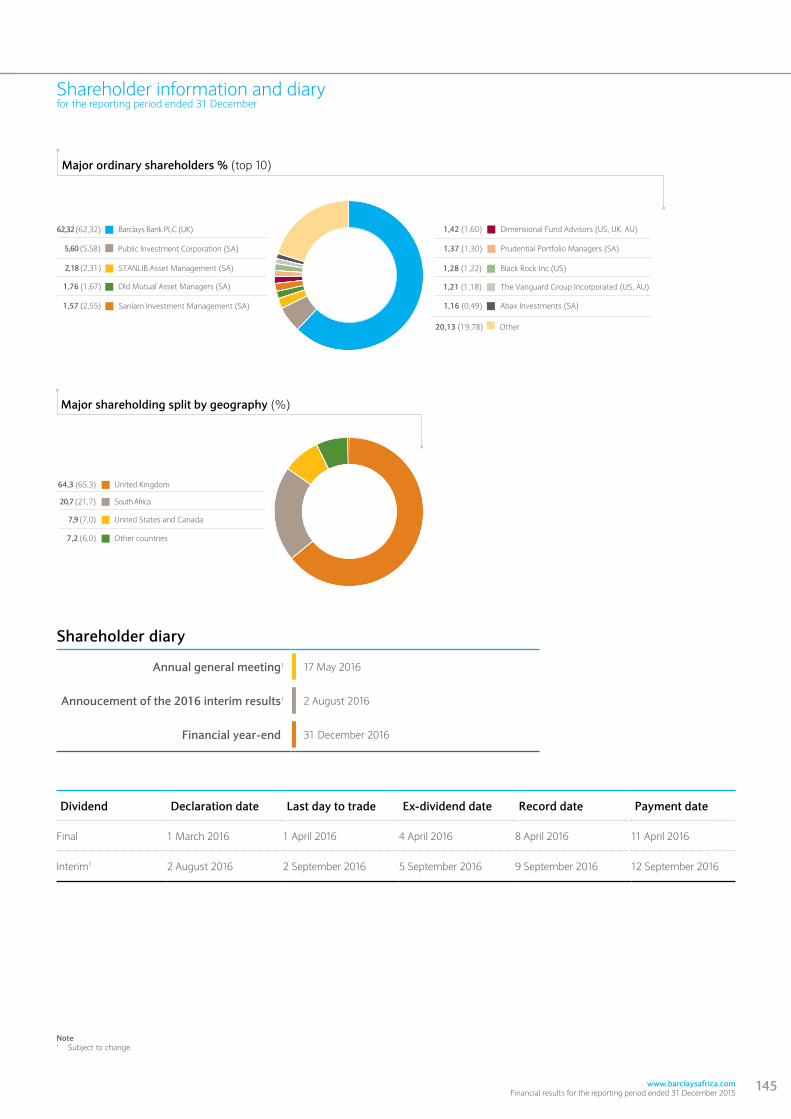
www.barclaysafrica.com Financial results for the reporting period ended 31 December 2015
145
20,7 (21,7)
7,9 (7,0)
South Africa
United States and Canada
7,2 (6,0) Other countries
United Kingdom64,3 (65,3)
Shareholder information and diaryfor the reporting period ended 31 December
Note1 Subject to change.
Shareholder diary
Annual general meeting1 17 May 2016
Annoucement of the 2016 interim results1 2 August 2016
Financial year-end 31 December 2016
Dividend Declaration date Last day to trade Ex-dividend date Record date Payment date
Final 1 March 2016 1 April 2016 4 April 2016 8 April 2016 11 April 2016
Interim1 2 August 2016 2 September 2016 5 September 2016 9 September 2016 12 September 2016
Major ordinary shareholders % (top 10)
Sanlam Investment Management (SA)
62,32 (62,32) Barclays Bank PLC (UK)
5,60 (5,58)
2,18 (2,31) STANLIB Asset Management (SA)
1,76 (1,67)
1,57 (2,55)
Old Mutual Asset Managers (SA)
Public Investment Corporation (SA)
1,42 (1,60) Dimensional Fund Advisors (US, UK, AU)
1,37 (1,30) Prudential Portfolio Managers (SA)
1,28 (1,22) Black Rock Inc (US)
1,21 (1,18) The Vanguard Group Incorporated (US, AU)
1,16 (0,49) Abax Investments (SA)
20,13 (19,78) Other
Major shareholding split by geography (%)

146 Barclays Africa Group Limited Financial results for the reporting period ended 31 December 2015
Glossary
Group performance Transition to BAGL 142Segment performance Share performance 144Risk management Shareholder information 145Appendices Glossary 146Administration and contact details Abbreviations and acronyms 154
Amounts written offOnce an advance has been identified as impaired and an impairment allowance has been raised, circumstances may change and indicate that the prospect of further recovery does not exist. Write-offs will occur when, and to the extent that, the debt is considered irrecoverable. A write-off policy based on an age-driven concept drives the timing and extent of write-offs. A write-off can also be triggered by a specific event, such as the conclusion of insolvency proceedings or other formal recovery actions, making it possible to quantify the extent of the advance that is beyond a realistic prospect of recovery. Assets are only written off once all necessary procedures have been completed and the amount of loss has been determined. Recoveries of amounts previously written off, are reversed and accordingly decrease the amount of the reported impairment charge in the statement of comprehensive income.
Approaches (FIRB, AIRB, AMA and IMA)Methods available to banks to calculate their regulatory capital requirements, based on their own risk estimates. These include the foundation internal ratings-based (“FIRB”) and advanced internal ratings-based (“AIRB”) approaches for credit risk, the advanced measurement approach (“AMA”) for operational risk and the internal models approach (“IMA”) for market risk.
Average interest-bearing assetsAverage interest-bearing assets consist of all accounts that are not impaired and thus attract interest within the asset categories of cash, cash balances and balances with central banks, loans and advances to banks and customers and investment securities (including cash and short-term assets, money market assets and capital market assets).
Balance sheetThe term “balance sheet” is used in the same context as the “statement of financial position”.
BankAbsa Bank Limited, together with its subsidiary undertakings, special-purpose entities, joint ventures, associates and offshore holdings. It is also referred to as “the Bank” or “Absa Bank” in this report.
Banking average assetsBanking average assets consist of all average assets related to the banking activities of the Group. Banking average assets exclude “Other assets”, “Current tax assets”, “Non-current assets held for sale”, “Reinsurance assets”, “Goodwill and intangible assets”, “Property and equipment” and “Deferred tax assets”, and includes “Trading portfolio liabilities”.
Banking book annual earnings at riskA measure of the sensitivity of net interest income over a one-year horizon due to a change in the level of interest rates. Calculated as the difference between the estimated income using the current yield curve, and the lowest estimated income following an increase or decrease in interest rates. As per regulatory requirement, a 200 bps downward shock is applied.
Banking interest yieldNet interest income after credit losses, as a proportion of banking average assets.
Banking non-interest yieldNon-interest income as a proportion of banking average assets.
Banking revenue yieldRevenue as a proportion of banking average assets.
Banks ActThis means the Banks Act, No 94 of 1990 and its accompanying regulations relating to banks published in the Government Gazette on 12 December 2012.
BarclaysBarclays PLC, registered in England under registration number 1026167, and the majority shareholder of Barclays Africa Group Limited.
Basel Capital Accord (ll, II.5 and lll)The Basel Capital Accord of the Bank for International Settlements is an improved capital adequacy framework aimed at closely aligning banks’ capital requirements with improved modern risk management practices and sophisticated risk assessment capabilities. It further ensures the risk sensitivity of the minimum capital requirements by including supervisory reviews and market discipline through enhanced disclosure.
www.barclaysafrica.com Financial results for the reporting period ended 31 December 2015
147
Glossary
Borrowed fundsSubordinated callable notes qualifying as long-term Tier 2 capital in terms of section 1 of the Banks Act, No 94 of 1990.
Capital adequacy ratioThe capital adequacy of South African banks is measured in terms of the requirements of the SARB. The ratio is calculated by the aggregate amount of qualifying capital and reserve funds dividend by RWA. The base minimum South African total capital adequacy ratio for banks is 10% of RWA. Non-South African banks in the Group have similar capital adequacy methodology requirements.
Capital – Common Equity Tier 1Common Equity Tier 1 capital consists of the sum of the following elements:
Common shares issued by Absa Bank Limited that meet the criteria for classification as common shares for regulatory purposes (or the equivalent for non-joint stock companies);
Stock surplus (share premium) resulting from the issue of instruments including CET1;
Retained earnings;
Accumulated other comprehensive income and other disclosed reserves;
Common shares issued by consolidated subsidiaries Absa Bank Limited and held by third parties (i.e., non-controlling interest) that meet the criteria for inclusion in CET1; and
Regulatory adjustments applied in the calculation of CET1.
Capital – Additional Tier 1 capital Additional Tier 1 capital consists of the sum of the following elements:
Instruments issued by Absa Bank Limited that meet the criteria for inclusion in Additional Tier 1 capital (and are not included in CET1);
Stock surplus (share premium) resulting from the issue of instruments included in Additional Tier 1 capital;
Instrument issued by consolidated subsidiaries of Absa Bank Limited and held by third parties that meet the criteria for inclusion in Additional Tier 1 capital and are not included in Common Equity Tier 1. See section 4 for the relevant criteria; and
Regulatory adjustments applied in the calculation of additional Tier 1 capital.
Capital – Common Equity Tier 1 capital adequacy ratioA measurement of a bank’s core equity capital compared with its total risk-weighted assets. This is the measure of a bank’s financial strength. The Common Equity Tier 1 excludes any preference shares or non-controlling interests when determining the calculation.
Capital – Tier 2 capitalTier 2 capital consists of the sum of the following elements:
Instruments issued by Absa Bank Limited that meet the criteria for inclusion in Tier 2 capital (and are not included in Tier 1 capital);
Stock surplus (share premium) resulting from the issue of instruments included in Tier 2 capital;
Instruments issued by consolidated subsidiaries of Absa Bank Limited and held by third parties that meet the criteria for inclusion in Tier 2 capital and are not included in Tier 1 capital;
Certain loan loss provisions such as general provisions/general loan-loss reserve; and
Regulatory adjustments applied in the calculation of Tier 2 capital.
Capital – Tier 2 ratioA component of regulatory capital, comprising qualifying subordinated loan capital, related minority interests, allowable collective impairment allowances and unrealised gains arising on the fair valuation of equity instruments held as available-for-sale. Tier 2 capital also includes reserves arising from the revaluation of properties.
Claims ratioNet insurance claims and benefits paid as a percentage of net premium income.
Combined ratioInsurance losses incurred and expenses as a percentage of insurance premiums earned.
Conduct riskConduct risk is the detriment caused to the Group’s customers and clients, counterparties or Absa Bank Limited as a result of inappropriate execution of the business activities.
148 Barclays Africa Group Limited Financial results for the reporting period ended 31 December 2015
Glossary
Group performance Transition to BAGL 142Segment performance Share performance 144Risk management Shareholder information 145Appendices Glossary 146Administration and contact details Abbreviations and acronyms 154
Constant currencyThe selected line items from the Condensed consolidated statement of comprehensive income and Condensed consolidated statement of financial position for the rest of Africa market segment disclosed on pages 60 and 89, are derived by translating the Statement of comprehensive income and Statement of financial position from the respective individual entities’ local currencies to rand.
The current reporting period’s results are translated at the current reporting period’s average rates for the Statement of comprehensive income, while the closing rate is used for the Statement of financial position in terms of IFRS. In order to calculate the percentage change based on constant currency, the previous reporting period’s results have also been translated at the current reporting period’s average rates for the Statement of comprehensive income, while the current reporting period’s closing rate has been used for the Statement of financial position. This has been done in order to provide investors with information on the impact of foreign currency movements on the local currency earnings.
The percentage change based on constant currency is provided for illustrative purposes only and may not fairly present the Group’s financial position and/or the results of its operations. The directors are responsible for the preparation of the constant currency information.
An assurance report on the constant currency financial information prepared by the Group’s auditors is available for inspection at the Group’s registered office.
Cost-efficiency ratio“Operating expenses” as a percentage of revenue. Revenue consists of net interest income and non-interest income, net of reinsurance, unearned premiums, net insurance claims and benefits paid, changes in investment and insurance contract liabilities and acquisition costs.
Cost of equityAn estimate of the return that the market demands in exchange for the risk of ownership of equity.
Cost-to-income ratio“Operating expenses“ as a percentage of revenue. Revenue consists of net interest income and non-interest income.
Coverage ratioImpairment loans on losses and advances as a proportion of gross loans and advances
Credit riskCredit risk is the risk of financial loss should the Group’s customers, clients or market counterparties fail to fulfil their contractual obligations.
Credit loss ratioImpairment losses on loans and advances for the reporting period, divided by total average advances (calculated on a daily weighted average basis).
Debt securities in issueShort- to medium-term instruments issued by the Group, including promissory notes, bonds and negotiable certificates of deposits.
Diluted headline earnings per shareHeadline earnings for the reporting period that is attributable to ordinary equity holders, as a proportion of the weighted average number of ordinary shares in issue adjusted for the effect of all potential dilutive ordinary shares.
Distribution forceNumber of active advisers.
Dividend coverHeadline earnings per share divided by dividend per share.
Dividend per ordinary share relating to income for the reporting periodDividend per ordinary share for the reporting period is the actual interim dividends paid and the final dividends declared for the reporting period under consideration, expressed as cents per share.
Special dividend per ordinary share is a payment made by the Group that is considered separate from the typical recurring dividend cycle, expressed as cents per share.
www.barclaysafrica.com Financial results for the reporting period ended 31 December 2015
149
Glossary
Earnings per shareBasic earnings per shareThis constitutes the net profit for the reporting period, less earnings attributable to non-controlling interest, divided by the weighted average number of ordinary shares in issue during the reporting period.
Diluted basic earnings per shareThe amount of profit for the reporting period that is attributable to ordinary equity holders, divided by the weighted average number of ordinary shares in issue during the reporting period, both adjusted for the effects of all potential dilutive ordinary shares, assuming they had been in issue for the reporting period.
Economic capitalAn internally calculated capital requirement deemed necessary by the Group to support the risks to which it is exposed, at a confidence level consistent with a target credit rating of AA. Also used in the return of average economic capital calculation.
Embedded valueThe embedded value of the covered business is the discounted value of the future after-tax shareholder profits (net of the opportunity cost of the required capital) arising from covered business in force at the valuation date, together with the adjusted net worth of the covered business. Covered business is taken to be all long-term insurance business written under the Group’s licence.
The free surplus is the excess of assets over the sum of liabilities and required capital, with assets at market value and liabilities on the statutory valuation method, adjusted to add back inadmissible assets. The required capital is taken to be two times the statutory capital adequacy requirement, in line with the results of internal capital models and the Group’s dividend policy.
Exchange differencesDifferences resulting from the translation of a given number of units of one currency into another currency at different exchange rates.
Financial Markets ActThis means the Financial Markets Act No 19 of 2012 and its regulations. This Act is the primary legislation governing the regulation of financial markets, market infrastructure and securities services in South Africa. It focuses primarily on the licensing and regulation of exchanges, central securities depositories, clearing houses, trade repositories and market infrastructure. The Act also strengthens measures already in place aimed at prohibiting insider trading and other market abuses.
Foreign currency translationForeign currency accounts of the Group’s subsidiaries translated to reporting currency, with the foreign adjusted currency translation included in a foreign currency translation reserve as equity capital.
Funding riskFunding risk is the risk that the Group is unable to achieve its business plans. It consists of:
Capital risk: the risk that the Group is unable to maintain appropriate capital ratios and composition which could lead to: an inability to support business activity, a failure to meet regulatory requirements; and/or changes to credit ratings, which could also result in increased costs or reduced capacity to raise funding;
Liquidity risk: the risk that the Group is unable to meet its obligations as they fall due; and
Structural risk: the risk arising from the impact of interest rate and foreign exchange movements on the Statement of comprehensive income and Statement of financial position.
Gains and losses from banking and trading activitiesBanking and trading portfolios include:
realised gains and losses on financial instruments held at amortised cost, held-to-maturity or available-for-sale;
realised gains and losses on the disposal of associates, joint ventures and subsidiaries within the banking portfolios;
realised and unrealised gains and losses on financial instruments designated at fair value through profit or loss; and
interest, dividends and fair value movements on certain financial instruments held for trading or designated at fair value through profit or loss.

150 Barclays Africa Group Limited Financial results for the reporting period ended 31 December 2015
Glossary
Group performance Transition to BAGL 142Segment performance Share performance 144Risk management Shareholder information 145Appendices Glossary 146Administration and contact details Abbreviations and acronyms 154
Gains and losses from investment activitiesInsurance and strategic investment portfolios including:
realised gains and losses on financial instruments held at amortised cost, held-to-maturity or available-for-sale;
realised gains and losses on the disposal of associates, joint ventures and subsidiaries;
realised and unrealised gains and losses on financial instruments designated at fair value through profit or loss; and
interest, dividends and fair value movements on certain financial instruments held for trading or designated at fair value through profit or loss.
Gross credit extendedLoans advanced to customers and banks, as well as off-balance sheet exposures.
GroupBarclays Africa Group Limited, together with its subsidiary undertakings, special-purpose entities, joint ventures, associates and offshore holdings. It is also referred to as “the Group” or “Barclays Africa Group” in this report.
Headline earningsHeadline earnings reflects the operating performance separated from remeasurements (an amount recognised in the statement of comprehensive income relating to any change (realised or unrealised) in the carrying amount of an asset/liability that arose after the initial recognition of such asset or liability) as well as non-controlling interest of preference shares or ordinary shares, where relevant.
Headline earnings per shareProfit attributable to ordinary equity holders after adjusting for separately identifiable remeasurements, net of tax and non-controlling interest, divided by the weighted average number of ordinary shares in issue. A remeasurement is an amount recognised in profit or loss relating to any change in the carrying amount of an asset or liability that arose after the initial recognition of such asset or liability.
Diluted headline earnings per shareDiluted headline earnings per share is calculated by adjusting both the headline earnings and the weighted average number of ordinary shares outstanding for the effects of all potential dilutive ordinary shares, assuming they had been in issue for the reporting period.
Impairments raised – IdentifiedImpaired loans with key indicators of default being:
�the borrower is unlikely to pay its credit obligation in full, without recourse by the Group to actions such as realising security held; and/or
�the borrower is overdue.
A retail identified impairment is triggered when a contractual payment is missed and is raised on a collective basis. Future cash flows for a group of financial assets, which are collectively evaluated for impaired purposes, are estimated based on the contractual cash flows of the assets in the Group and the historical loss experienced for assets with similar credit risk characteristics to those in the Group.
In the wholesale portfolio, an identified impairment is raised on an individual basis and is the difference between the outstanding capital and the present value of future cash flows.
Impairments raised – UnidentifiedAllowances are raised when observable data indicates a measurable decrease in the estimated future cash flows from a group of financial assets since their original recognition, even though the decrease cannot yet be linked to individual assets in the Group. The unidentified impairment calculation is based on the asset’s probability of moving from the performing portfolio to the defaulted portfolio as a result of a risk condition that has already occurred, but will only be identifiable at a borrower level at a future date.
Indirect taxationIndirect taxes are the taxes that are levied on transitions rather than on persons (whether individuals or corporate). These taxes include unclaimed value-added taxes, stamp duties on deposits and Regional Services Council levies.
Income statementThe term Income statement is used in the same context as the Statement of comprehensive income.
JawsA measure used to demonstrate the extent to which the Group’s income from operations growth rate exceeds operating expenses growth rate. Income from operations consists of net interest income and non-interest income.
www.barclaysafrica.com Financial results for the reporting period ended 31 December 2015
151
Glossary
LeverageAverage assets as a proportion of average equity.
Life new business marginEmbedded value of new business attained in the Life Insurance key business area of WIMI, as a proportion of the discounted value of the associated future premiums.
Loans-to-deposits and debt securities ratioLoans and advances to customers as a percentage of deposits due to customers and debt securities in issue.
Long-term funding ratioFunding with a term in excess of six months.
Market capitalisationThe Group’s closing share price, times the number of shares in issue at the reporting date.
Market riskMarket risk is the risk that the Group’s earnings, capital or business objectives will be adversely impacted by changes in the level or volatility of market rates or prices such as interest rates, foreign exchange rates, equity prices, commodity prices and credit spreads. It consists of:
Traded market risk, which is the risk of the Group being impacted by changes in the level or volatility of positions in the Group’s trading books, primarily in Investment Bank.
Non-traded market risk, which is the risk of the Group being unable to hedge the interest rate risk in the banking book, primarily in retail, business banking and corporate portfolios.
Insurance risk, which is the risk that future experiences relating to claims, expenses, policyholder behaviour and investment returns are different from the assumptions made when setting premiums or valuing policyholder liabilities.
Pension risk, which arises when an adverse movement between pension assets and liabilities results in a pension deficit.
Merchant incomeIncome generated from the provision of point-of-sale facilities to the Group’s merchant network customers. This income includes both rental income for the supply of point-of-sale units as well as transactional income for the transactions processed on the supplied terminals.
Net asset value per shareTotal equity attributable to ordinary equity holders divided by the number of shares in issue. The net asset value per share figure excludes the non-cumulative, non-redeemable preference shares issued.
Net insurance premium incomeThe amount of insurance premiums received or receivable on insurance assets net of insurance claims and benefits paid on insurance liabilities.
Net interest incomeThe amount of interest received or receivable on assets net of interest paid or payable on liabilities.
Net interest margin on average interest-bearing assetsNet interest income for the reporting period, divided by average interest-bearing assets (calculated on a daily weighted average basis), expressed as a percentage of average interest-bearing assets.
Net present value unwind on non-performing bookA net present value adjustment representing time value of money of expected cash flows within the impairment allowance. Such time value of money reduces as the point of cash flow is approached. The time-based reduction in time value of money is recognised in the statement of comprehensive income as interest received on impaired assets.
Net revenueNet revenue consists of net interest income and non-interest income, net of impairment losses on loans and advances.

152 Barclays Africa Group Limited Financial results for the reporting period ended 31 December 2015
Glossary
Group performance Transition to BAGL 142Segment performance Share performance 144Risk management Shareholder information 145Appendices Glossary 146Administration and contact details Abbreviations and acronyms 154
Net trading resultNet trading result includes the profits and losses on CIB’s trading desks arising from both the purchase and sale of trading instruments and the revaluation to market value, as well as CIB’s hedge ineffectiveness. This includes the interest income and interest expense from these instruments and related funding cost. It also includes similar activities from the African operations.
Non-interest incomeNon-interest income consists of the following Statement of comprehensive income line items: “net fee and commission income”, “net insurance premium income”, “net insurance claims and benefits paid”, “changes in investment contracts and insurance contract liabilities”, “gains and losses from banking and trading activities”, “gains and losses from investment activities as well as other operating income”.
Non-performing loansA loan is typically considered non-performing once its delinquency reaches a trigger point. This is typically when interest is suspended (in accordance with Group policy) or if the loan is moved to the legal environment for recovery. As a consequence, a loan that has defaulted is not necessarily non-performing (unless certain criteria are met).
NPLs’ coverage ratioNet exposure, being the outstanding NPL balance, less expected recoveries and fair value of collateral, as a percentage of the total outstanding NPL balance.
NPL ratioNPLs as a percentage of gross loans and advances to customers.
Non-interest income as a percentage of revenueNon-interest income as a percentage of income from operations. Revenue consists of net interest income and non-interest income.
Operational riskOperational risk is the risk of direct or indirect impacts resulting from human factors, inadequate or failed internal processes and systems or external events. This includes risks associated with payments and transaction operations, external suppliers, products, premises and security, fraud risk, regulation, information, financial reporting, tax, legal, people and technology.
Price-to-earnings ratioThe closing price of ordinary shares, divided by headline earnings per ordinary share for the reporting period.
Probability of default The probability that a debtor will default within a one-year time horizon.
Pre-provision profitTotal revenue less operating expenses.
Regulatory capital The capital that the Group holds, determined in accordance with the requirements of the Banks Act and regulations relating to banks.
Return on average assetsAnnualised headline earnings as proportion of total average assets.
Return on average equityAnnualised headline earnings as a proportion of average equity.
Return on average regulatory capitalMeasure of efficient use, by segment, of regulatory capital.
Return on average risk-weighted assetsAnnualised headline earnings as a proportion of average risk-weighted assets.
www.barclaysafrica.com Financial results for the reporting period ended 31 December 2015
153
Glossary
Revenue/total incomeRevenue consists of net interest income and non-interest income.
Risk-weighted assets Calculated by assigning a degree of risk, expressed as a percentage (risk weight) to an exposure, in accordance with the applicable standardised or internal ratings-based approaches rules. RWA are determined by applying the:
AIRB approach for wholesale and retail credit;
AMA for operational risk;
Internal ratings-based market-based simple risk-weight approach for equity investment risk in the banking book; and
Standardised approach for all African entities (both credit and operational risk).
Solvency marginThe amount by which assets, at fair value, exceed liabilities and other comparable commitments.
Tangible net asset value per shareTotal equity attributable to ordinary equity holders less goodwill and intangible assets, divided by the number of shares in issue. The tangible net asset value per share figure excludes the non-cumulative, non-redeemable preference shares issued.
Underwriting marginNet insurance premium income remaining after losses have been paid and administrative expenses have been deducted.
Value-at-risk model A technique that measures the loss that could occur on risk positions as a result of adverse movements in market risk factors (e.g. rates, prices, volatilities) over a specified time horizon and to a given level of confidence.
Value of new business The discounted value, at the date of sale, of the projected after-tax shareholder profits from new covered business, net of the opportunity cost of the required capital for new business. New covered business is defined as long-term insurance contracts written by the Group during the reporting period and for which at least one premium has been recognised in the financial statements. The value of new business is calculated using closing assumptions for all basis items.
Weighted average number of sharesThe number of shares in issue at the beginning of the reporting period increased by shares issued during the reporting period, weighted on a time basis for the period during which they participated in the income, less treasury shares held by entities, weighted on a time basis for the period during which the entities held these shares.
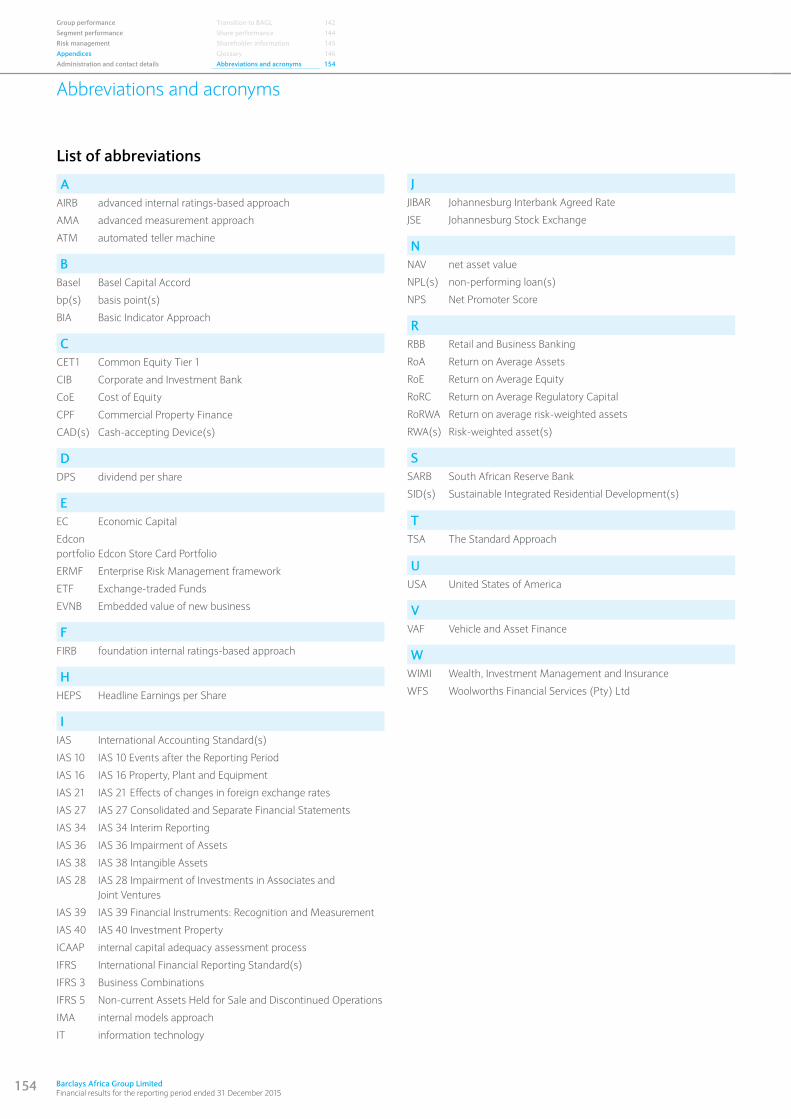
154 Barclays Africa Group Limited Financial results for the reporting period ended 31 December 2015
Group performance Transition to BAGL 142Segment performance Share performance 144Risk management Shareholder information 145Appendices Glossary 146Administration and contact details Abbreviations and acronyms 154
BASTION GRAPHICS
Abbreviations and acronyms
List of abbreviations
AAIRB advanced internal ratings-based approach
AMA advanced measurement approach
ATM automated teller machine
BBasel Basel Capital Accord
bp(s) basis point(s)
BIA Basic Indicator Approach
CCET1 Common Equity Tier 1
CIB Corporate and Investment Bank
CoE Cost of Equity
CPF Commercial Property Finance
CAD(s) Cash-accepting Device(s)
DDPS dividend per share
EEC Economic Capital
Edcon portfolio
Edcon Store Card Portfolio
ERMF Enterprise Risk Management framework
ETF Exchange-traded Funds
EVNB Embedded value of new business
FFIRB foundation internal ratings-based approach
HHEPS Headline Earnings per Share
IIAS International Accounting Standard(s)
IAS 10 IAS 10 Events after the Reporting Period
IAS 16 IAS 16 Property, Plant and Equipment
IAS 21 IAS 21 Effects of changes in foreign exchange rates
IAS 27 IAS 27 Consolidated and Separate Financial Statements
IAS 34 IAS 34 Interim Reporting
IAS 36 IAS 36 Impairment of Assets
IAS 38 IAS 38 Intangible Assets
IAS 28 IAS 28 Impairment of Investments in Associates and Joint Ventures
IAS 39 IAS 39 Financial Instruments: Recognition and Measurement
IAS 40 IAS 40 Investment Property
ICAAP internal capital adequacy assessment process
IFRS International Financial Reporting Standard(s)
IFRS 3 Business Combinations
IFRS 5 Non-current Assets Held for Sale and Discontinued Operations
IMA internal models approach
IT information technology
JJIBAR Johannesburg Interbank Agreed Rate
JSE Johannesburg Stock Exchange
NNAV net asset value
NPL(s) non-performing loan(s)
NPS Net Promoter Score
RRBB Retail and Business Banking
RoA Return on Average Assets
RoE Return on Average Equity
RoRC Return on Average Regulatory Capital
RoRWA Return on average risk-weighted assets
RWA(s) Risk-weighted asset(s)
SSARB South African Reserve Bank
SID(s) Sustainable Integrated Residential Development(s)
TTSA The Standard Approach
UUSA United States of America
VVAF Vehicle and Asset Finance
WWIMI Wealth, Investment Management and Insurance
WFS Woolworths Financial Services (Pty) Ltd
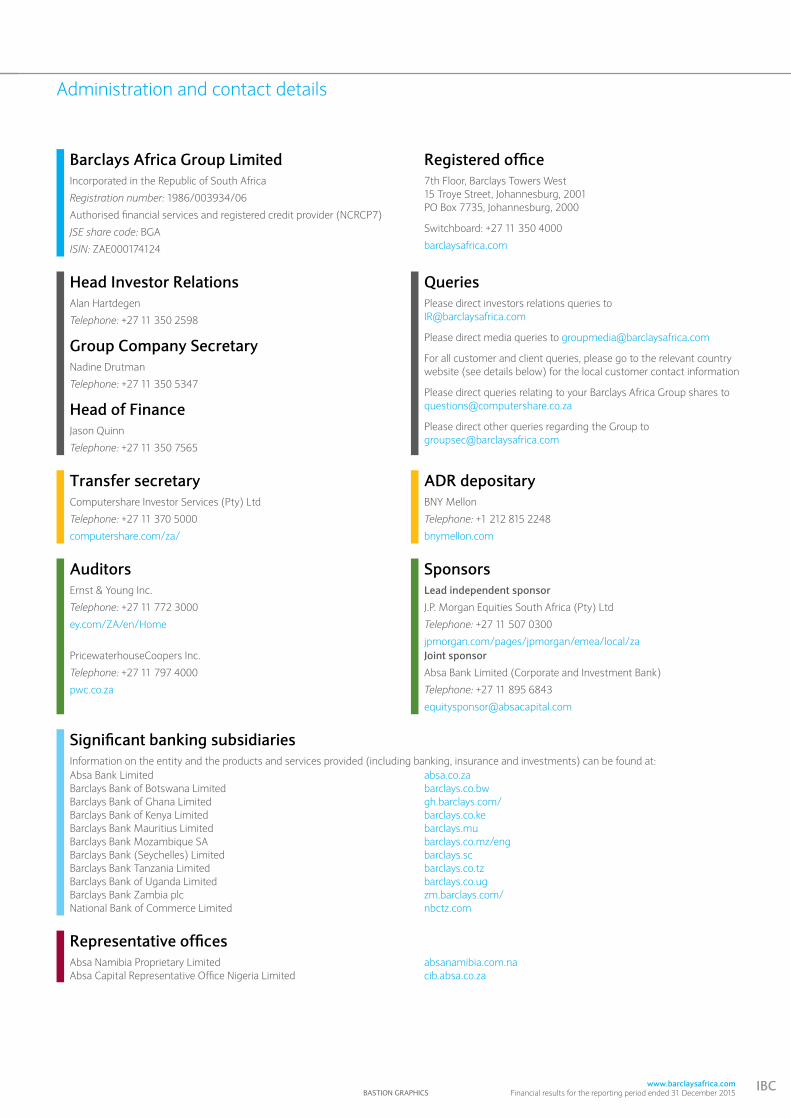
BASTION GRAPHICSwww.barclaysafrica.com
Financial results for the reporting period ended 31 December 2015IBC
Administration and contact details
Barclays Africa Group Limited Registered officeIncorporated in the Republic of South Africa
Registration number: 1986/003934/06
Authorised financial services and registered credit provider (NCRCP7)
JSE share code: BGA
ISIN: ZAE000174124
7th Floor, Barclays Towers West15 Troye Street, Johannesburg, 2001PO Box 7735, Johannesburg, 2000
Switchboard: +27 11 350 4000
barclaysafrica.com
Head Investor Relations QueriesAlan Hartdegen
Telephone: +27 11 350 2598
Please direct investors relations queries to [email protected]
Please direct media queries to [email protected]
For all customer and client queries, please go to the relevant country website (see details below) for the local customer contact information
Please direct queries relating to your Barclays Africa Group shares to [email protected]
Please direct other queries regarding the Group to [email protected]
Group Company SecretaryNadine Drutman
Telephone: +27 11 350 5347
Head of FinanceJason Quinn
Telephone: +27 11 350 7565
Transfer secretary ADR depositaryComputershare Investor Services (Pty) Ltd
Telephone: +27 11 370 5000
computershare.com/za/
BNY Mellon
Telephone: +1 212 815 2248
bnymellon.com
Auditors SponsorsErnst & Young Inc.
Telephone: +27 11 772 3000
ey.com/ZA/en/Home
Lead independent sponsor
J.P. Morgan Equities South Africa (Pty) Ltd
Telephone: +27 11 507 0300
jpmorgan.com/pages/jpmorgan/emea/local/zaPricewaterhouseCoopers Inc.
Telephone: +27 11 797 4000
pwc.co.za
Joint sponsor
Absa Bank Limited (Corporate and Investment Bank)
Telephone: +27 11 895 6843
Significant banking subsidiariesInformation on the entity and the products and services provided (including banking, insurance and investments) can be found at:Absa Bank LimitedBarclays Bank of Botswana LimitedBarclays Bank of Ghana Limited Barclays Bank of Kenya LimitedBarclays Bank Mauritius Limited Barclays Bank Mozambique SA Barclays Bank (Seychelles) Limited Barclays Bank Tanzania Limited Barclays Bank of Uganda Limited Barclays Bank Zambia plc National Bank of Commerce Limited
absa.co.za barclays.co.bw gh.barclays.com/barclays.co.ke barclays.mu barclays.co.mz/eng barclays.sc barclays.co.tz barclays.co.ug zm.barclays.com/nbctz.com
Representative officesAbsa Namibia Proprietary LimitedAbsa Capital Representative Office Nigeria Limited
absanamibia.com.na cib.absa.co.za

www.barclaysafrica.com