
Barbujani leicester
47
Human evolutionary genetics A few questions for the next few years Guido Barbujani Dipartimento di Scienze della Vita e Biotecnologie Università di Ferrara [email protected] Leicester, April 1st, 2014
-
Upload
genetica-ferrara-university-italy -
Category
Education
-
view
146 -
download
1
Transcript of Barbujani leicester
Human evolutionary genetics
A few questions for the next few years
Guido BarbujaniDipartimento di Scienze della Vita e BiotecnologieUniversità di [email protected] Leicester, April 1st, 2014
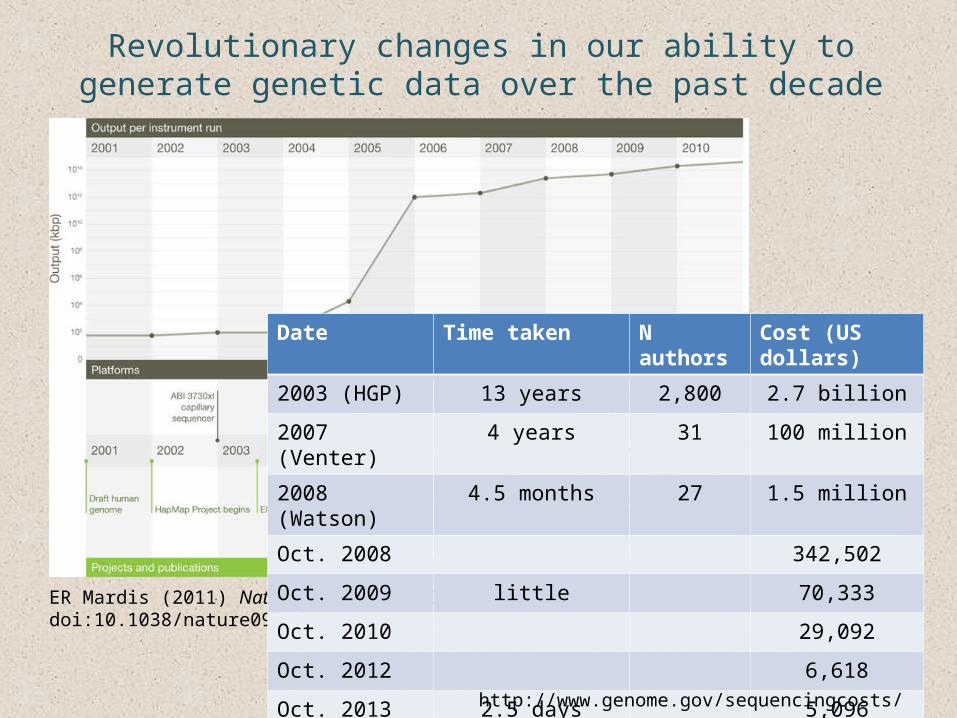
ER Mardis (2011) Nature 470: 198-203 doi:10.1038/nature09796
Revolutionary changes in our ability to generate genetic data over the past decade
Date Time taken N authors Cost (US dollars)
2003 (HGP) 13 years 2,800 2.7 billion
2007 (Venter) 4 years 31 100 million
2008 (Watson) 4.5 months 27 1.5 million
Oct. 2008 342,502
Oct. 2009 little 70,333
Oct. 2010 29,092
Oct. 2012 6,618
Oct. 2013 2.5 days (exome) 5,096
http://www.genome.gov/sequencingcosts/

Questions concerning three things:
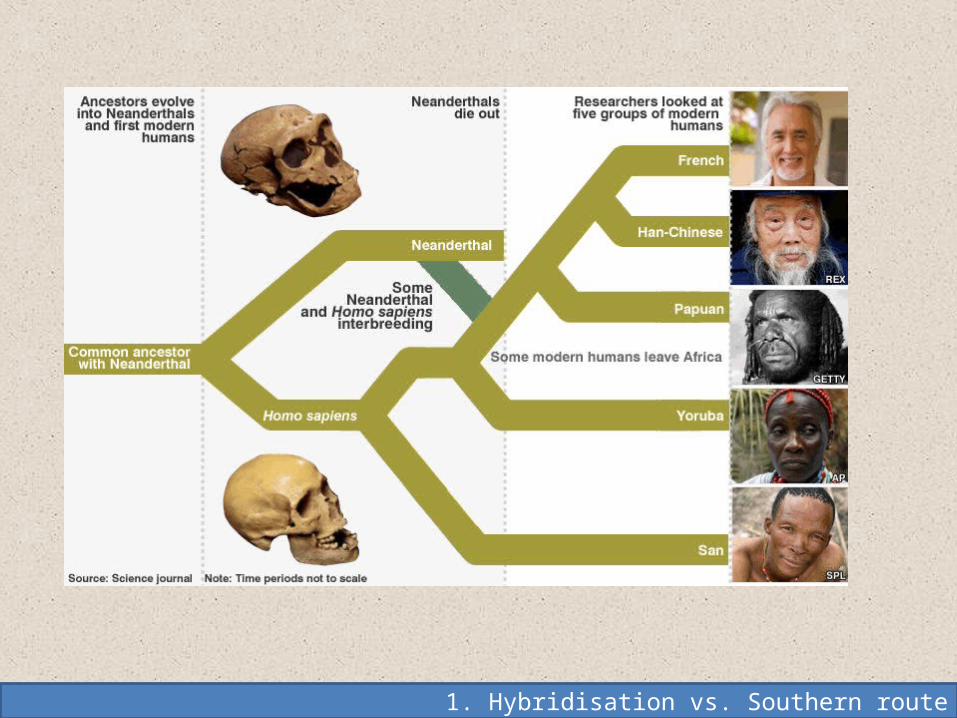
1. Hybridisation between human forms vs. the Southern route of modern human expansion from Africa
2. Evolution of cognitive functions vs. relationships between cultural and biological diversity
3. Data on human genome diversity vs. persistence of the racial paradigm

1. Hybridisation vs. Southern route
Han
Papuan
French
Yoruba
San
1. Hybridisation vs. Southern route

Hybridisation events proposed on the basis of HLA data. Is this a parsimonious hypothesis?
Abi-Rached et al. (2011) Science 334: 89-94
1. Hybridisation vs. Southern route
Population Freq.
Papua Wosera 20.5 %
Australia Kimberley 8.3 %
China Yunnan 9.0 %
Israeli Jews 3.0 %
Albanians 2.5 %
Finnish 1.1 %

A simpler, and currently rather standard, view of likely hybridisation processes.
1. Hybridisation vs. Southern route
Stoneking and Krause (2011) Nature Rev Genet 12: 603-614
Wall, J. D. et al. (2013) Genetics 194: 199–209
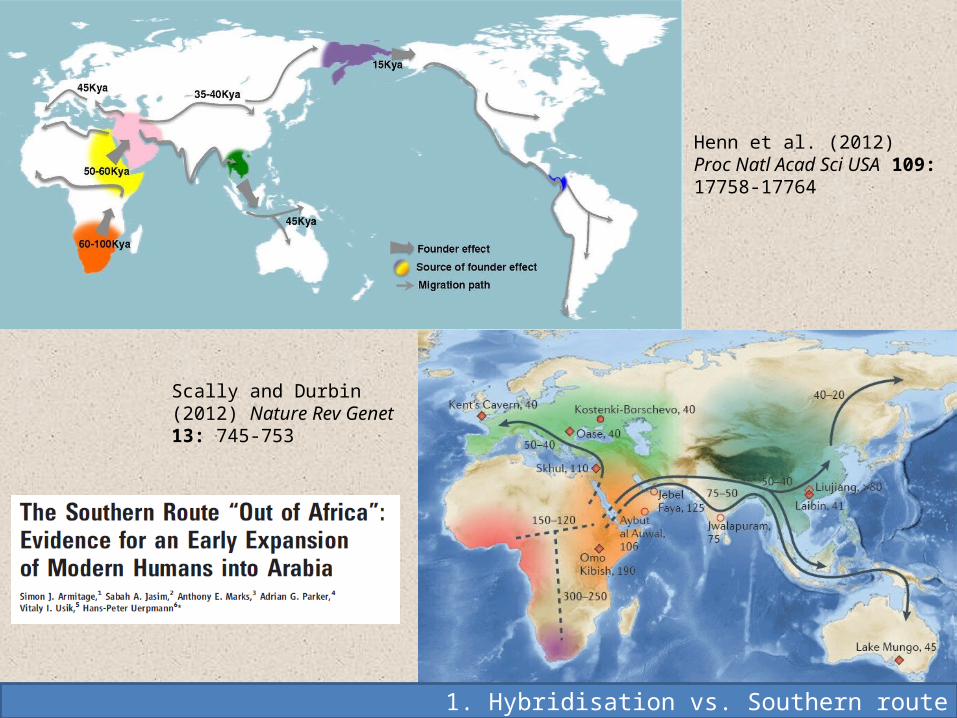
Henn et al. (2012) Proc Natl Acad Sci USA 109: 17758-17764
1. Hybridisation vs. Southern route
Scally and Durbin (2012) Nature Rev Genet 13: 745-753
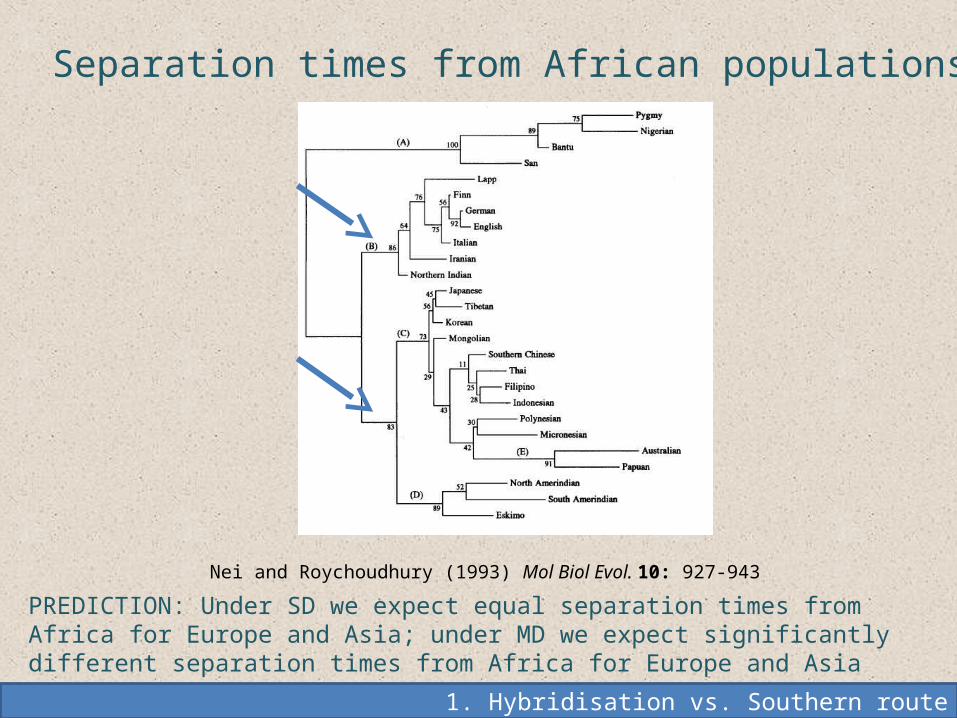
Nei and Roychoudhury (1993) Mol Biol Evol. 10: 927-943
Separation times from African populations
PREDICTION: Under SD we expect equal separation times from Africa for Europe and Asia; under MD we expect significantly different separation times from Africa for Europe and Asia
1. Hybridisation vs. Southern route

FST = Genetic distance
LINKAGE DISEQUILIBRIUM
T = Separation time Ne = eff. population size
But things are not so simple
Hayes et al. (2003) Novel multilocus measure of linkage disequilibrium to estimate past effective population size. Genome Res 13: 635-643McVean (2002) A genealogical interpretation of linkage disequilibrium. Genetics 162: 987-991
1. Hybridisation vs. Southern route

SINGLE DISPERSALMULTIPLE DISPERSAL 1MULTIPLE DISPERSAL 2
1. Hybridisation vs. Southern route
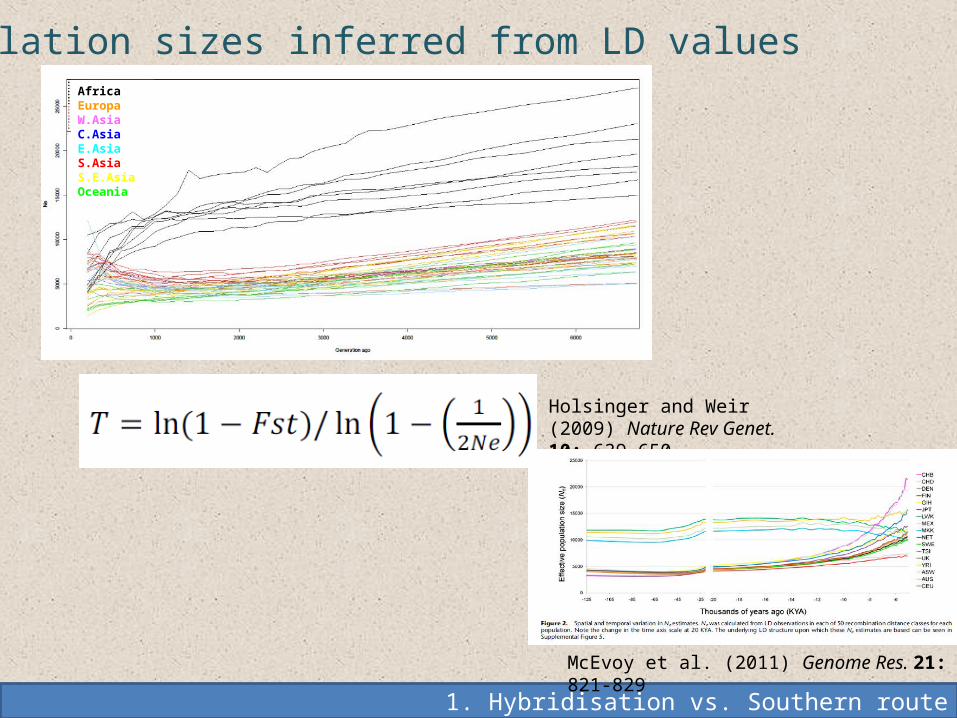
AfricaEuropaW.AsiaC.AsiaE.AsiaS.AsiaS.E.AsiaOceania
Population sizes inferred from LD values
Holsinger and Weir (2009) Nature Rev Genet. 10: 639-650
1. Hybridisation vs. Southern route
McEvoy et al. (2011) Genome Res. 21: 821-829

Significantly older separation between Africa and East Asia / Oceania than between Africa and Europe
Lower 5% CL Estimate (years ago)
Higher 5% CL
Europe 69,768 74,209 77,448
East Asia + Oceania 79,007 82,862 87,925
Oceania 92,609 97,799 104,142
1 generation = 25 years
1. Hybridisation vs. Southern route

1. Hybridisation vs. Southern route

1. Hybridisation vs. Southern route
Reyes-Centeno et al. Proc Natl Acad Sci USA (2014) in press
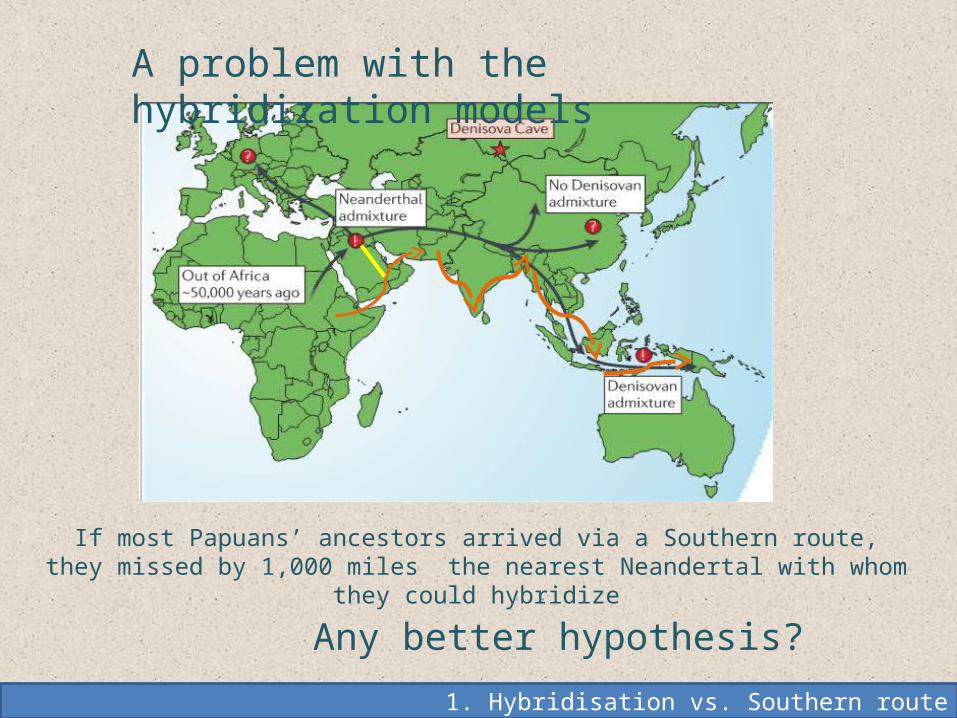
If most Papuans’ ancestors arrived via a Southern route, they missed by 1,000 miles the nearest Neandertal with whom they could hybridize
Any better hypothesis?
1. Hybridisation vs. Southern route
A problem with the hybridization models

1. Hybridisation vs. Southern route
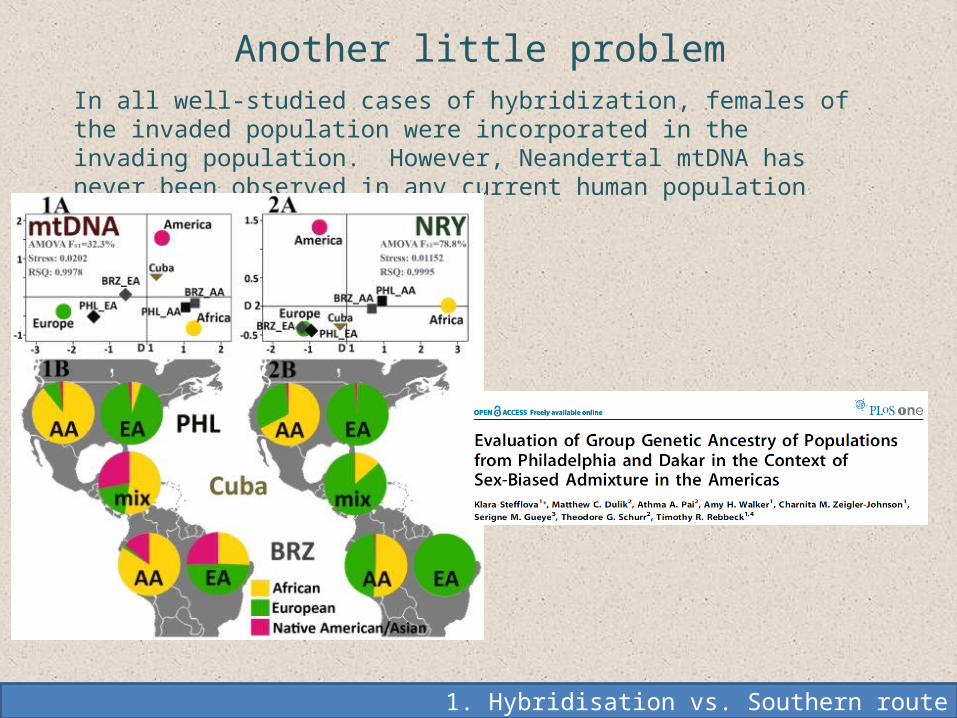
Another little problemIn all well-studied cases of hybridization, females of the invaded population were incorporated in the invading population. However, Neandertal mtDNA has never been observed in any current human population
1. Hybridisation vs. Southern route

Perhaps that’s not a problem?An interbreeding success smaller than 2% for Neanderthal-human hybrids is fully compatible with limited Neanderthal nuclear introgression and with no introgression of mtDNA.
But perhaps it is?
Observed statistics
ABC, Approximate Bayesian Computations
Comparison of observed diversity statistics with those generated under alternative models
Currat and Excoffier (2011) Proc Natl Acad Sci USA 105: 15129-15134
1. Hybridisation vs. Southern route

Model 4, with no Neandertals contribution to the mitochondrial genealogy, is at least 8 times as likely as any alternative coalescent-
based model
1. Hybridisation vs. Southern route
Ghirotto et al. (2011) Am J Phys Anthropol 146: 242-252.

Adding gene flow from Neandertals into the modern mtDNA pool decreases the posterior probability with respect to a model with no
admixture
1. Hybridisation vs. Southern route
Ghirotto et al. (2011) Am J Phys Anthropol 146: 242-252.
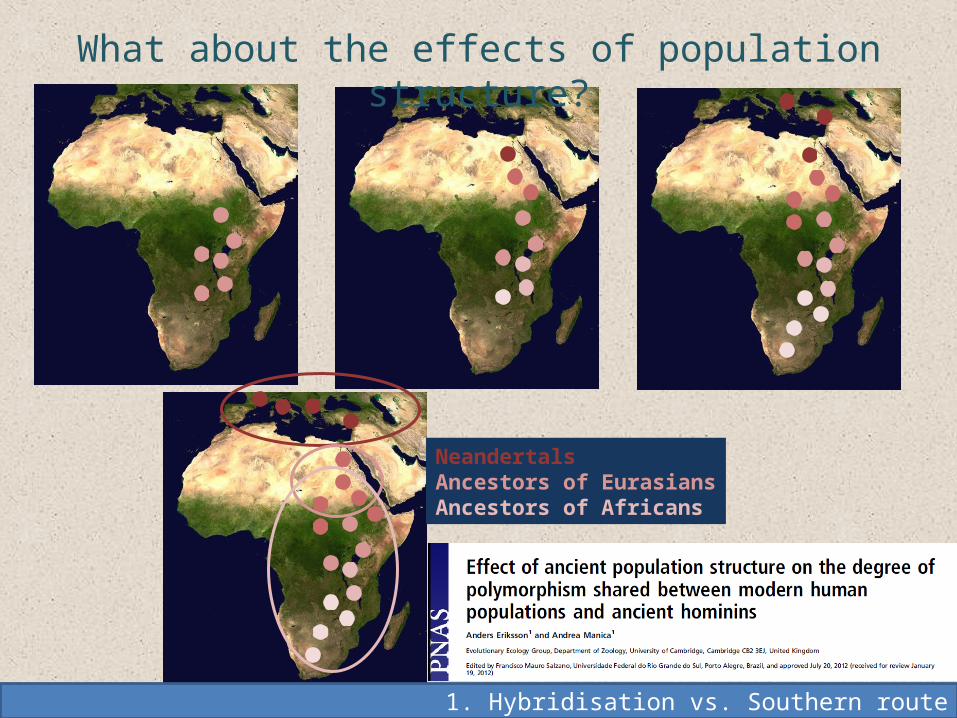
What about the effects of population structure?
NeandertalsAncestors of EurasiansAncestors of Africans
1. Hybridisation vs. Southern route

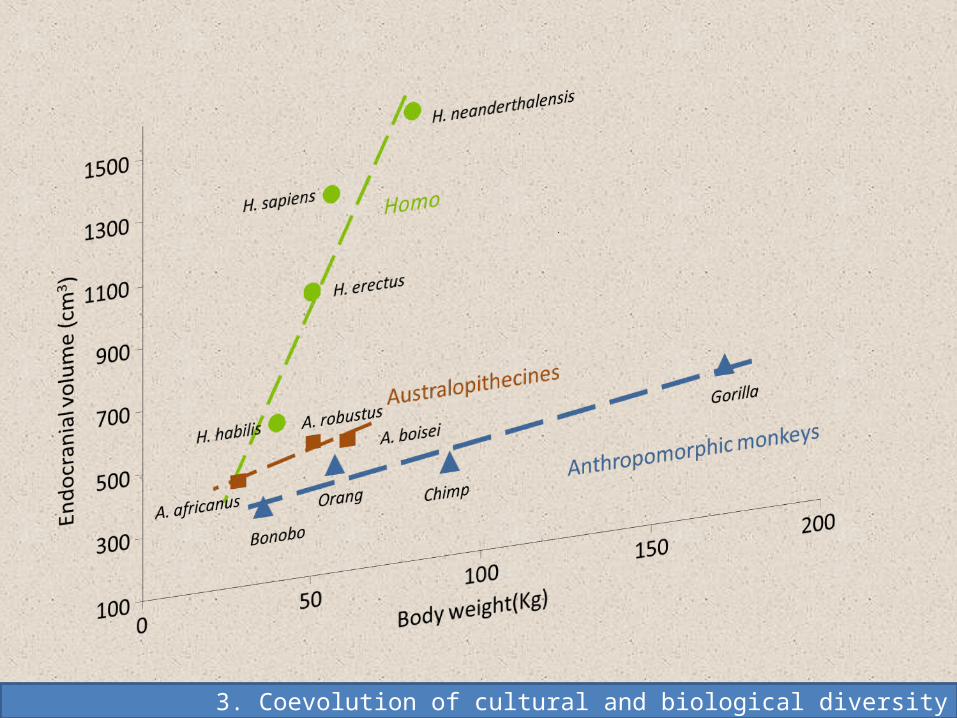
Evolution of brain size
2. Coevolution of cultural and biological diversity

2. Coevolution of cultural and biological diversity
3. Coevolution of cultural and biological diversity
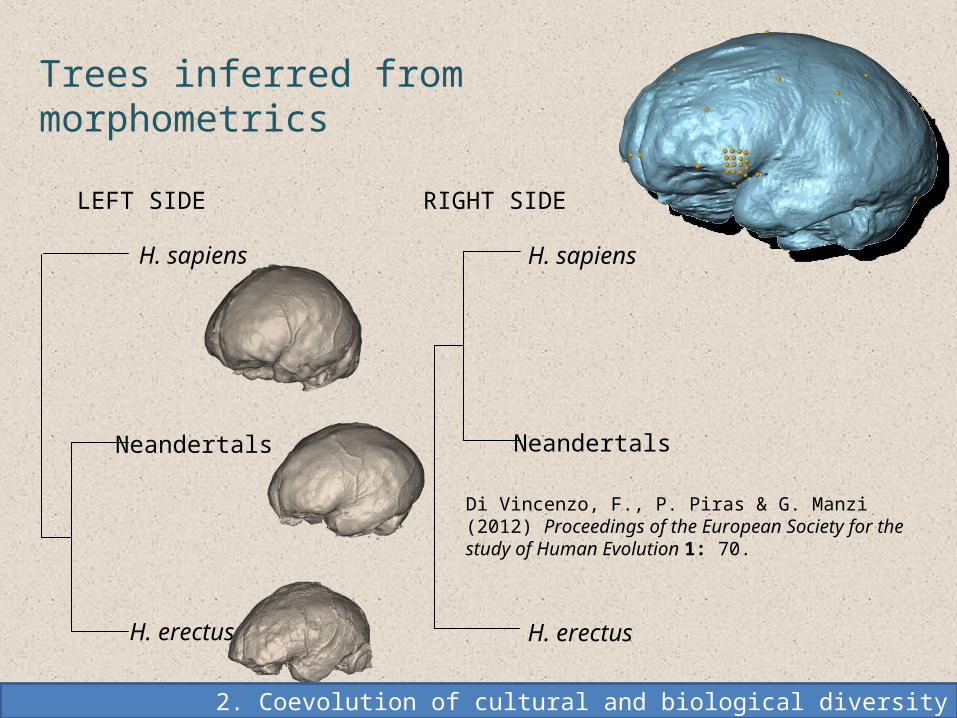
H. erectus
H. sapiens
Neandertals
Trees inferred from morphometrics
Neandertals
H. erectus
H. sapiens
LEFT SIDE RIGHT SIDE
2. Coevolution of cultural and biological diversity
Di Vincenzo, F., P. Piras & G. Manzi (2012) Proceedings of the European Society for the study of Human Evolution 1: 70.

Castillo-Morales A et al. (2014) Proc. R. Soc. B 281: 20132428.
Increased brain size in Mammals correlates with over-representation of gene families not obviously
associated with cognitive functions
2. Coevolution of cultural and biological diversity

Somel et al. (2013) Nature Rev. Neurosciences 14: 112-127.
2. Coevolution of cultural and biological diversity
So, do we have any evidence for nearly simultaneous origin of language and of the FOXP2 regulatory mutation?

Similarity between gene trees and language trees suggests parallel evolutionary changess
Cavalli-Sforza et al. (1988) Proc Natl Acad Sci USA 85: 6002-6006
Populations speaking related languages are also genetically closer than expected based on their spatial distance
Sokal (1988) Proc Natl Acad Sci USA 85: 1722-1726
2. Coevolution of cultural and biological diversity
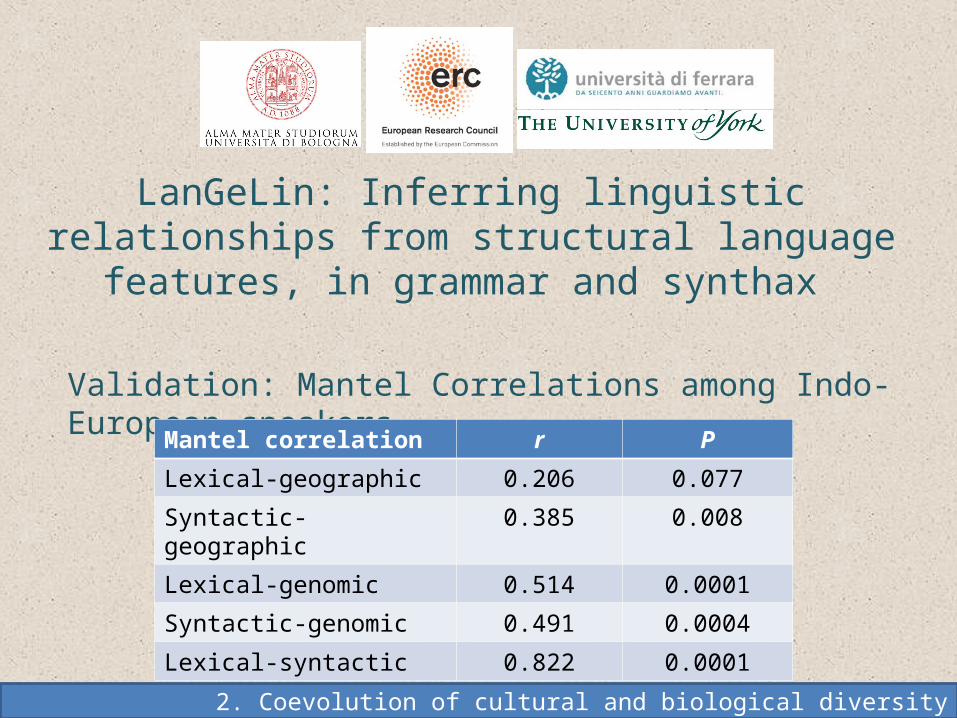
Validation: Mantel Correlations among Indo-European speakers
Mantel correlation r P
Lexical-geographic 0.206 0.077
Syntactic-geographic 0.385 0.008
Lexical-genomic 0.514 0.0001
Syntactic-genomic 0.491 0.0004
Lexical-syntactic 0.822 0.0001
LanGeLin: Inferring linguistic relationships from structural language features, in grammar and synthax
2. Coevolution of cultural and biological diversity

Jaccard distances inferred from syntactic distances
Application: A European language tree
Basque English Finnish French German Greek Hungarian Irish Italian Polish Portuguese Rumanian Russian Serbo_Croat SpanishBasque 0.0000
English 0.3333 0.0000
Finnish 0.3000 0.3600 0.0000
French 0.3600 0.2000 0.3333 0.0000
German 0.3913 0.0857 0.3333 0.1579 0.0000
Greek 0.6364 0.3529 0.4074 0.2973 0.2632 0.0000
Hungarian 0.4167 0.3103 0.1429 0.3529 0.3548 0.3548 0.0000
Irish 0.5294 0.1429 0.4167 0.2121 0.1250 0.2727 0.4286 0.0000
Italian 0.3600 0.1579 0.3103 0.0476 0.1220 0.2308 0.2941 0.2353 0.0000
Polish 0.4286 0.3077 0.2857 0.2414 0.1613 0.2000 0.3571 0.2308 0.2000 0.0000
Portuguese 0.3077 0.1579 0.3103 0.0476 0.1220 0.2500 0.3143 0.2121 0.0222 0.2000 0.0000
Rumanian 0.4286 0.2353 0.3077 0.1579 0.2432 0.2105 0.3125 0.2903 0.1000 0.2593 0.1000 0.0000
Russian 0.4286 0.3077 0.2857 0.2667 0.1875 0.2000 0.3571 0.2308 0.2258 0.0303 0.2258 0.2593 0.0000
Serbo_Croat 0.4286 0.2800 0.2593 0.2667 0.1613 0.2000 0.3333 0.2308 0.2258 0.0625 0.2258 0.2593 0.0303 0.0000
Spanish 0.3600 0.1892 0.3571 0.0698 0.1500 0.2500 0.3714 0.2000 0.0667 0.2414 0.0222 0.1000 0.2667 0.2667 0.0000
2. Coevolution of cultural and biological diversity

How come that black athletes always win in Olympic running events? Isn’t that the sign of a racial difference?
3. Racial paradigms

We are not identical, and our physical aspect contains information on our likely place of origin
3. Racial paradigms

The study of morphology leads to contrasting racial catalogs
Linnaeus (1735) 4 (europeus, luridus, afer, americanus) [+2]Buffon (1749) 6 (european, lapp, tartar, asian, ethiopan, american)Blumenbach (1795) 5 (caucasian, malay, afer, americanus, australianus)Cuvier (1828) 3 (caucasoid, negroid, mongoloid)Huxley (1875) 4 (mongoloid, xanthocroid, australoid, negroid)Deniker (1900) 29Von Eickstedt (1937) 38Chicago Nat. Hist. Museum (1933) 107USA census (2000) 6: White, Black or African-American, American Indian and Alaska Native, Asian,
Native Hawaiian and other Pacific Islander, Hispanic or Latino USA census (2010) 15: White, Black or African-American, American Indian and Alaska Native, Asian
Indian, Chinese, Filipino, Japanese, Korean, Vietnamese, Other Asian, Native Hawaiian, Guamanian, Samoan, Other Pacific Islander, Hispanic or Latino
3. Racial paradigms

Frank Livingstone: An alternative scientific paradigm, continuous variation
3. Racial paradigms

Theodosius Dobzhansky: Genetic diversity and human equality
“Equality—as in equality in law and equality of opportunity—pertains to the rights and the sacredness of life of every human being and not to the individual’s bodily or mental features.
There are valid races in humans, but biology is only beginning to properly define them”.
3. Racial paradigms

Pre- and post-genomic estimates of genetic variances
Lewontin (1972) 85% 8% 6%Barbujani et al. (1997) 85% 5% 10%Jorde et al. (2000) 85% 2% 13%Romualdi et al. (2002) 83% 8% 9%Rosenberg et al. (2002) 93% 3% 4%Excoffier & Hamilton (2003) 88% 3% 9%Ramachandran et al. (2005) 90% 5% 5%Bastos-Rodriguez et al. (2006) 86% 2% 12%Li et al. (2008) 89% 2% 9%Barreiro et al. (2008) 89% 11%Auton et al. (2009) 95% 5%Xing et al. (2009) 88% 12%
MEDIAN
within populations
between populations
between races or continents
85% 5% 10%
3. Racial paradigms
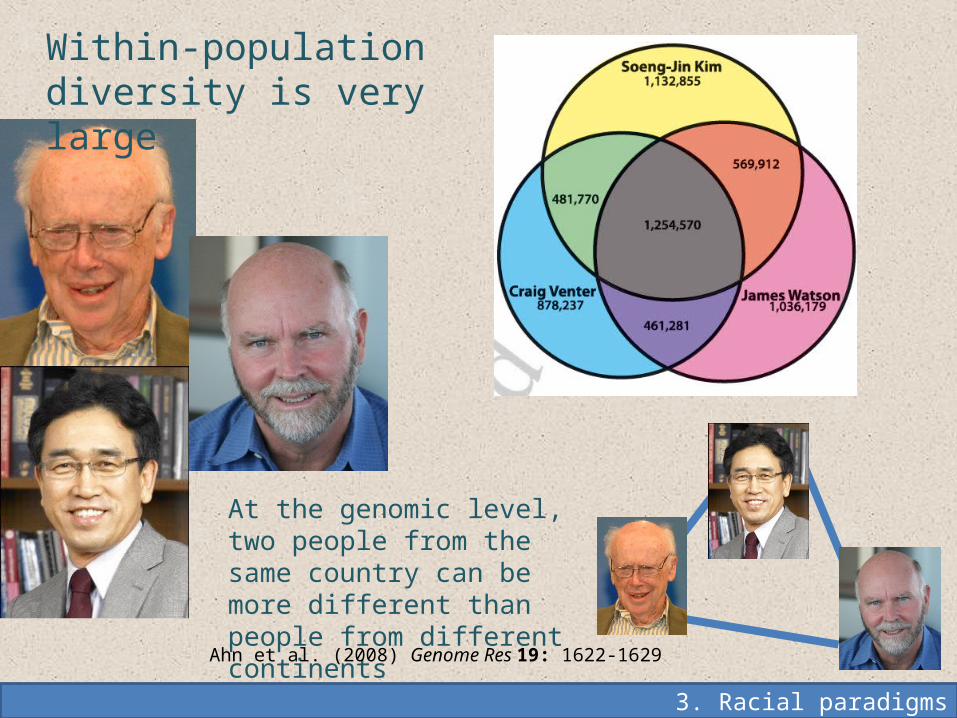
At the genomic level, two people from the same country can be more different than people from different continents
Within-population diversity is very large
3. Racial paradigms
Ahn et al. (2008) Genome Res 19: 1622-1629

“To attain truly personalized medicine, the scientific community must leave behind simplistic race-based approaches, and look instead for the genetic and
environmental factors contributing to individual drug reactions”
3. Racial paradigms
Ng et al. (2008) Clin Pharmacol Ther. 84: 306-309
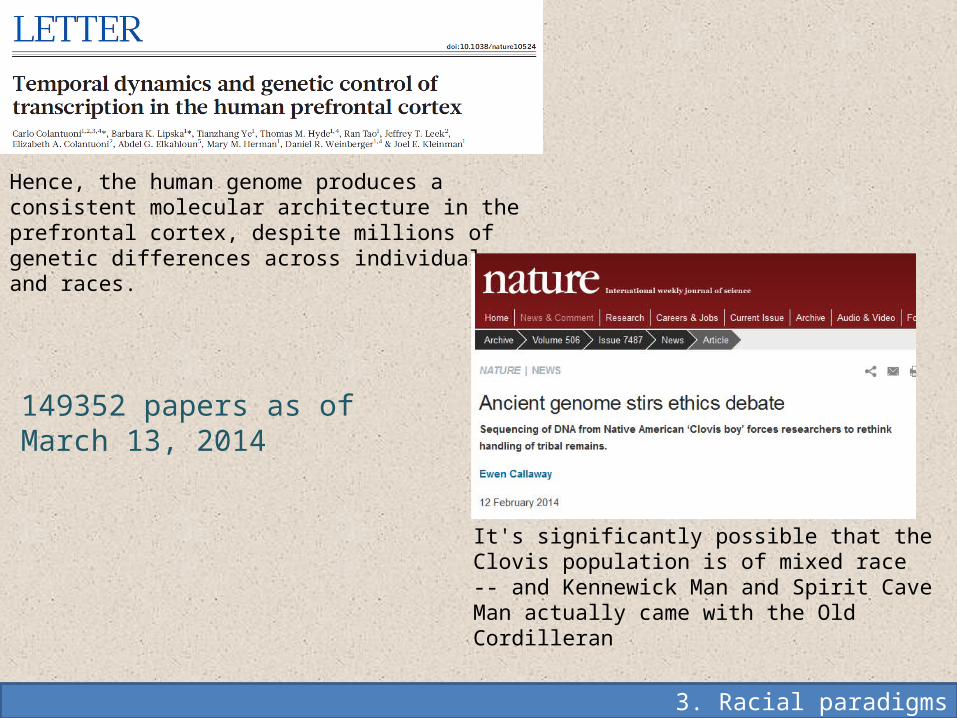
Hence, the human genome produces a consistent molecular architecture in the prefrontal cortex, despite millions of genetic differences across individuals and races.
It's significantly possible that the Clovis population is of mixed race -- and Kennewick Man and Spirit Cave Man actually came with the Old Cordilleran
149352 papers as of March 13, 2014
3. Racial paradigms

Many thanks to:
Krishna Veeramah
Tomàs Marques-Bonet
Richard Nichols
Silvietta Ghirotto Fabio Di Vincenzo

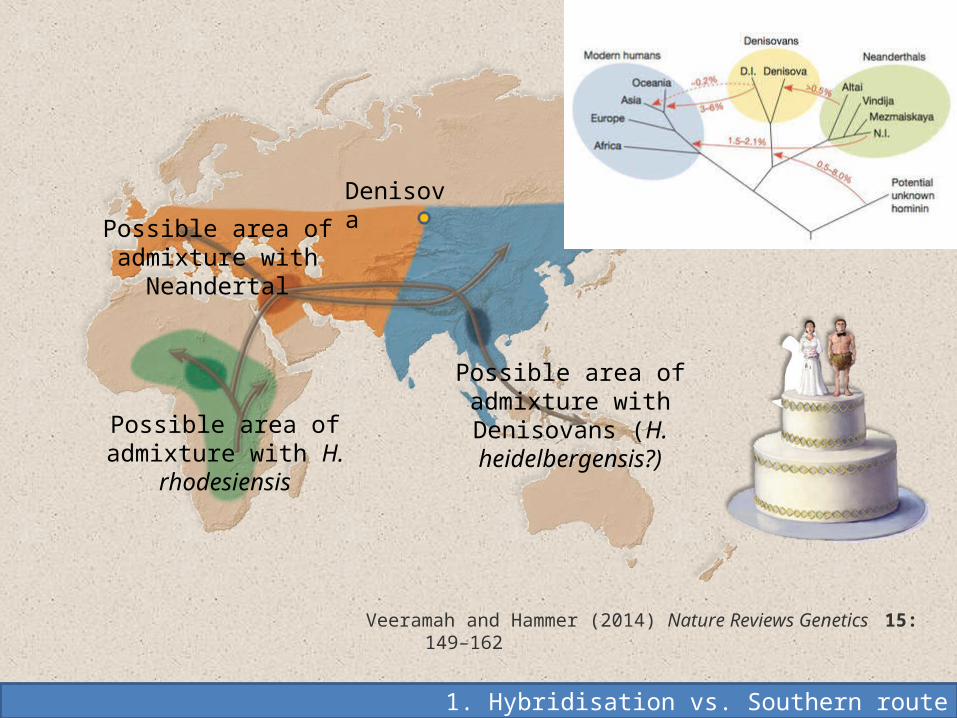
Denisova
Possible area of admixture with Neandertal
Possible area of admixture with Denisovans (H. heidelbergensis?)
Possible area of admixture with H. rhodesiensis
Veeramah and Hammer (2014) Nature Reviews Genetics 15: 149–162
1. Hybridisation vs. Southern route
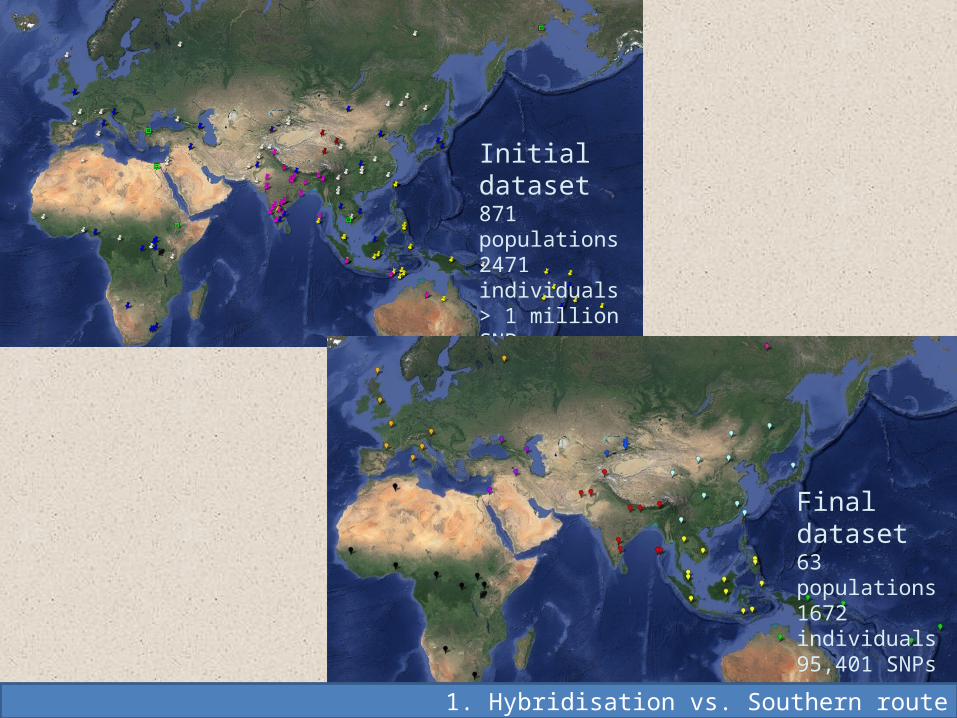
Initial dataset871 populations 2471 individuals> 1 million SNPs
Final dataset63 populations 1672 individuals95,401 SNPs
1. Hybridisation vs. Southern route

Harmonic means over arbitrary recombination classes; errors estimated comparing Ne values inferred for the different chromosomes
Estimated population sizes inferred from LD values
1. Hybridisation vs. Southern route

Each of us shares 99.9% of her genome with everybody else
Two cells of the same person 0/1000
Two identical twins 0/1000
Two of us 1/1000
One of us and a chimp 10-30/1000
One of us and an artichoke 700/1000
3. Racial paradigms
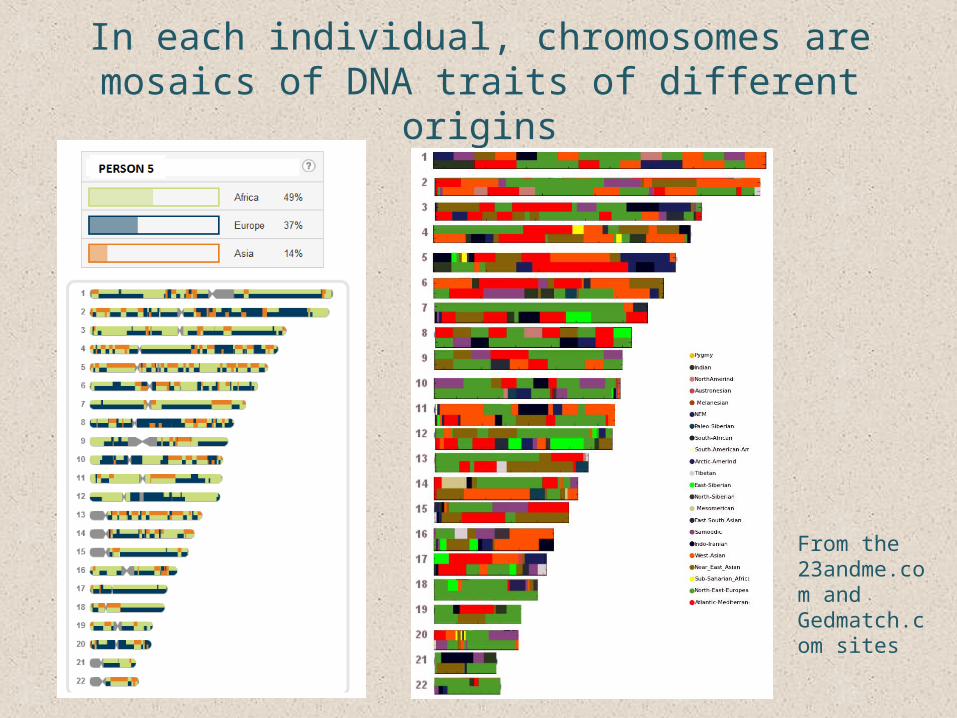
In each individual, chromosomes are mosaics of DNA traits of different origins
From the 23andme.com and Gedmatch.com sites