Banyan Tree Holdings Limitedinvestor.banyantree.com/PDF/Financial_Results/2016/Q4/Analyst... · A...
24
A BANYAN TREE Banyan Tree Holdings Limited 4Q16 & FY16 Results Briefing A BANYAN TREE 4Q16 & FY16 Results Briefing
Transcript of Banyan Tree Holdings Limitedinvestor.banyantree.com/PDF/Financial_Results/2016/Q4/Analyst... · A...
ABANYAN TREE
Banyan Tree Holdings Limited 4Q16 & FY16 Results Briefing
ABANYAN TREE
4Q16 & FY16 Results Briefing
ABANYAN TREE
This document is provided to you for information only and should not be relied on or used as a basis for making any specific investment, businessor commercial decision. No representation or warranty, expressed or implied, is made as to, and no reliance should be placed on, the informationor opinions contained herein. This document does not constitute and should not be construed as, any offer or solicitation for the subscription,purchase or sale of any securities of Banyan Tree Holdings Limited (“Banyan Tree”). Nothing in this document should be construed as arecommendation regarding the securities of Banyan Tree.
Certain statements in this document may constitute "forward-looking statements”, including statements regarding, amongst other things, BanyanTree’s business and growth strategy. These statements reflect Banyan Tree’s expectations and are subject to risks and uncertainties that maycause actual results to differ materially and may adversely affect the outcome and financial effects of the plans described herein. You arecautioned not to rely on such forward-looking statements. Banyan Tree disclaims any obligation to update their view of such risks anduncertainties or to publicly announce the result of any revisions to the forward-looking statements made herein, except where they would berequired to do so under applicable law.
Banyan Tree is under no obligation to keep current the information contained in this document and any opinions expressed in it are subject tochange without notice. None of Banyan Tree or any of its affiliates, advisers or representatives shall have any liability whatsoever for any loss
Disclaimer
2
change without notice. None of Banyan Tree or any of its affiliates, advisers or representatives shall have any liability whatsoever for any losswhatsoever arising from any use of this document or its contents, or otherwise arising in connection with this document (whether direct, indirect,consequential or other). This document is not intended to provide professional advice and should not be relied upon in that regard. Prospectiveinvestors should consult their tax, legal, accounting or other advisers.
The information in this document is given in confidence and reproduction of this document, in whole or in part, or disclosure of any of its contents,without prior consent of Banyan Tree, is prohibited. This document remains the property of Banyan Tree and on request must be returned andany copies destroyed.
ABANYAN TREE
Contents
1. Overview & Outlook Ho KwonPing
2. Hotel & Fee-Based Business Eddy See
3. Property Business Eddy See
3
3. Property Business Eddy See
ABANYAN TREE
Overview & Outlook
4
ABANYAN TREE
Overview
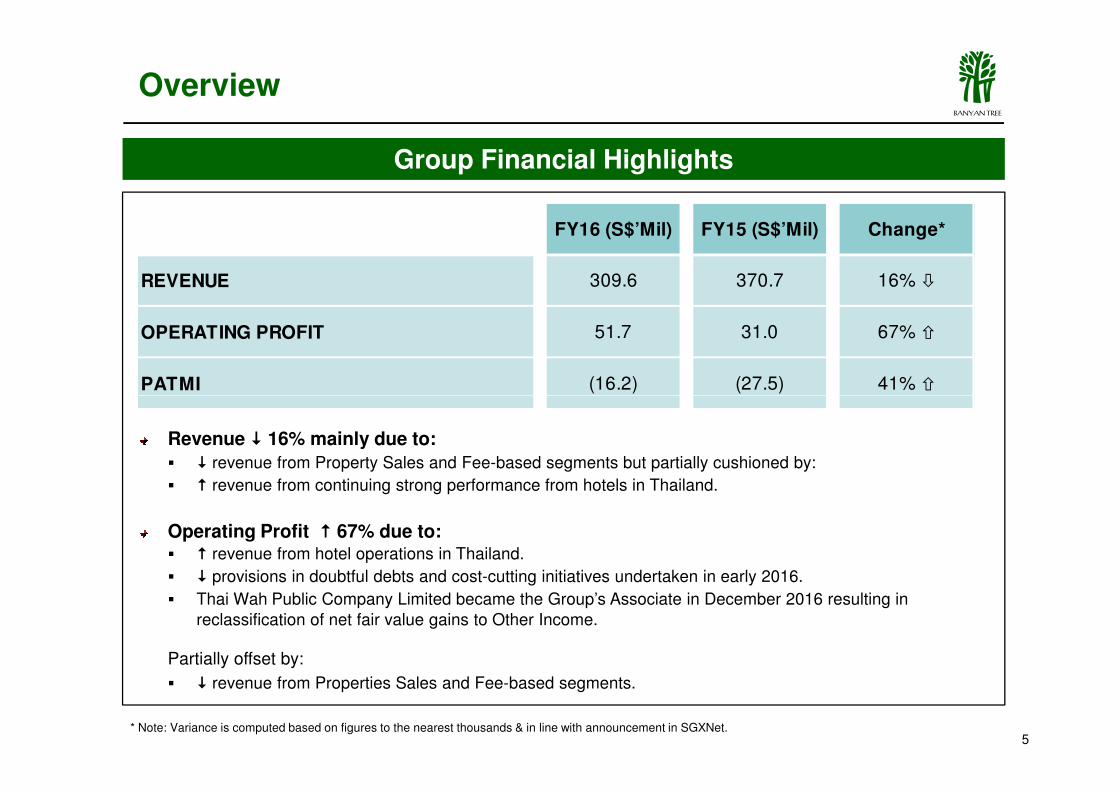
Group Financial Highlights
FY16 (S$’Mil) FY15 (S$’Mil) Change*
REVENUE 309.6 370.7 16% �
OPERATING PROFIT 51.7 31.0 67% �
PATMI (16.2) (27.5) 41% �
5
Revenue � 16% mainly due to:
� � revenue from Property Sales and Fee-based segments but partially cushioned by:
� � revenue from continuing strong performance from hotels in Thailand.
Operating Profit � 67% due to:� � revenue from hotel operations in Thailand.
� � provisions in doubtful debts and cost-cutting initiatives undertaken in early 2016.
� Thai Wah Public Company Limited became the Group’s Associate in December 2016 resulting in
reclassification of net fair value gains to Other Income.
Partially offset by:
� � revenue from Properties Sales and Fee-based segments.
* Note: Variance is computed based on figures to the nearest thousands & in line with announcement in SGXNet.
ABANYAN TREE
Macro outlook1:
� Barring unforeseen circumstances arising from uncertainties caused by political developments in the USAand Europe, global economic growth is expected to pick up in 2017 following a very weak 2016.
Promising hotel outlook:
� Travellers from Russia are expected to further increase although still below the pre-sanction levels.
� Hotel bookings (same store) for 1Q17 for owned hotels are currently above last year.
− Thailand � 15%.
− Non Thailand � 3%.
Outlook
Overview
6
− Non Thailand � 3%.
− Overall � 10%.
Encouraging property sales in Phuket. China and Australia sales may remain weak:
� Angsana Beachfront Residences in Phuket was well received when launched in late Dec 2016; 100%were sold by end of Jan 2017.
� Laguna Chengdu project faced problems in securing vital infrastructure support from the Government anderoded consumer confidence. Sales will likely to be suspended till mid 2017.
However we expect renew interest with big developers acquiring lands in Wenjiang for “wellness themed”projects.
� Banyan Tree Residences, Brisbane received strong response when it was officially launched in 2Q16 butsales momentum slowed down following measures imposed by government and banks.
1 Source: IMF, World Economic Outlook Update (January 2017).
ABANYAN TREE
Strategic alliances with globally reputable and strong partners
� BTH with AccorHotels (Accor)
- Propel Banyan Tree’s brands further into Europe, Africa, the Middle East and the Americas.
- Accelerate Fee-based income.
Outlook
Overview
7
- Accelerate Fee-based income.
- Preserve brand equity while improving competiveness.
- Expect to contribute positively in the medium term.
ABANYAN TREE
� BTH with China Vanke Co Ltd (Vanke)
- Consolidate our assets in China via JV (BTC) which will help further strengthen the Group’s presencein China.
- Provide avenue for branded hotel owners to exit and will help encourage more owners to let BTmanage their asset.
- Vanke strong database of 9 million provide potential source of customers to BT hotels, spas and
Outlook
Overview
8
property sales.
- Potential income will arise from:
• Valuation gains from our disposal of assets in China to BTC.
• Increase in management fees from the following:
a. Transfer of Vanke owned hotels to be under our Group’s management.
b. Conversion of Vanke’s service apartments with facilities to be managed by the Group.
c. Creation of wellness projects in Vanke’s developments.
ABANYAN TREE
Hotel & Fee-Based Business
9

ABANYAN TREE
Highlights
Hotel Investments – Financial Performance
4Q16 vs 4Q15 / FY16 vs FY15
���� EBITDA due to:
� ���� revenue from Thailand.
� ���� provision for doubtful debts.
� ���� operating costs due to several cost management initiatives implemented.
Operating ProfitOwned Hotels1
0.5
$8.0
$12.0
$16.0
$20.0S$'Mil
FY16 vs FY154Q16 vs 4Q15
4.5
13.2
10
initiatives implemented.
Partially offset by:
� ���� revenue from Maldives and Seychelles.
1. Hotel management fees attributed for hotels managed and owned by BTH was allocated to hotel management segment.
4.0 1.7
12.7
3.2
(0.4)(4.7)
1.3
-$8.0
-$4.0
$0.0
$4.0
$8.0
4Q16 4Q15 FY16 FY15
Thailand Non-Thailand
(3.0)
3.64.5
ABANYAN TREE
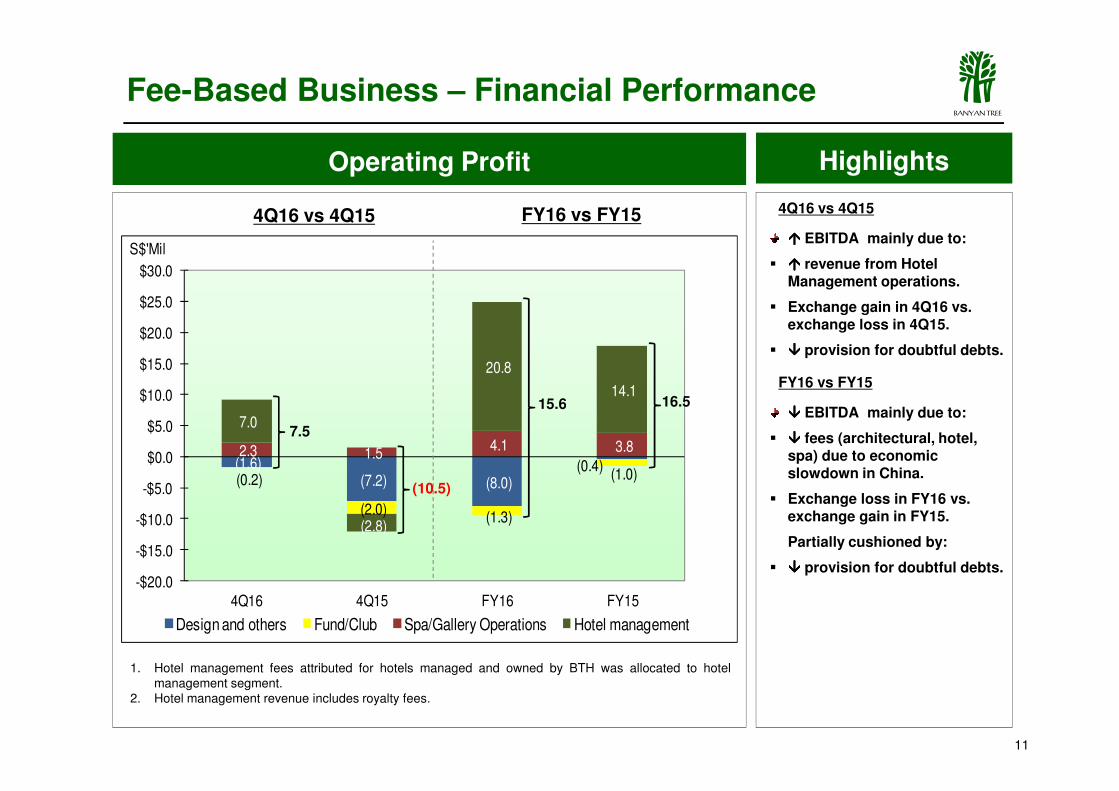
4Q16 vs 4Q15
���� EBITDA mainly due to:
� ���� revenue from Hotel Management operations.
� Exchange gain in 4Q16 vs. exchange loss in 4Q15.
� ���� provision for doubtful debts.
FY16 vs FY15
Fee-Based Business – Financial Performance
20.8
14.1 $10.0
$15.0
$20.0
$25.0
$30.0
S$'Mil
FY16 vs FY154Q16 vs 4Q15
HighlightsOperating Profit
15.6 16.5
11
1. Hotel management fees attributed for hotels managed and owned by BTH was allocated to hotelmanagement segment.
2. Hotel management revenue includes royalty fees.
���� EBITDA mainly due to:
� ���� fees (architectural, hotel, spa) due to economic slowdown in China.
� Exchange loss in FY16 vs. exchange gain in FY15.
Partially cushioned by:
� ���� provision for doubtful debts.
(1.6)(7.2) (8.0)
(0.4)(0.2)
(2.0)(1.3)
(1.0)
2.3 1.5 4.1 3.8
7.0
(2.8)
14.1
-$20.0
-$15.0
-$10.0
-$5.0
$0.0
$5.0
$10.0
4Q16 4Q15 FY16 FY15
Design and others Fund/Club Spa/Gallery Operations Hotel management
15.6 16.5
(10.5)
7.5
ABANYAN TREE
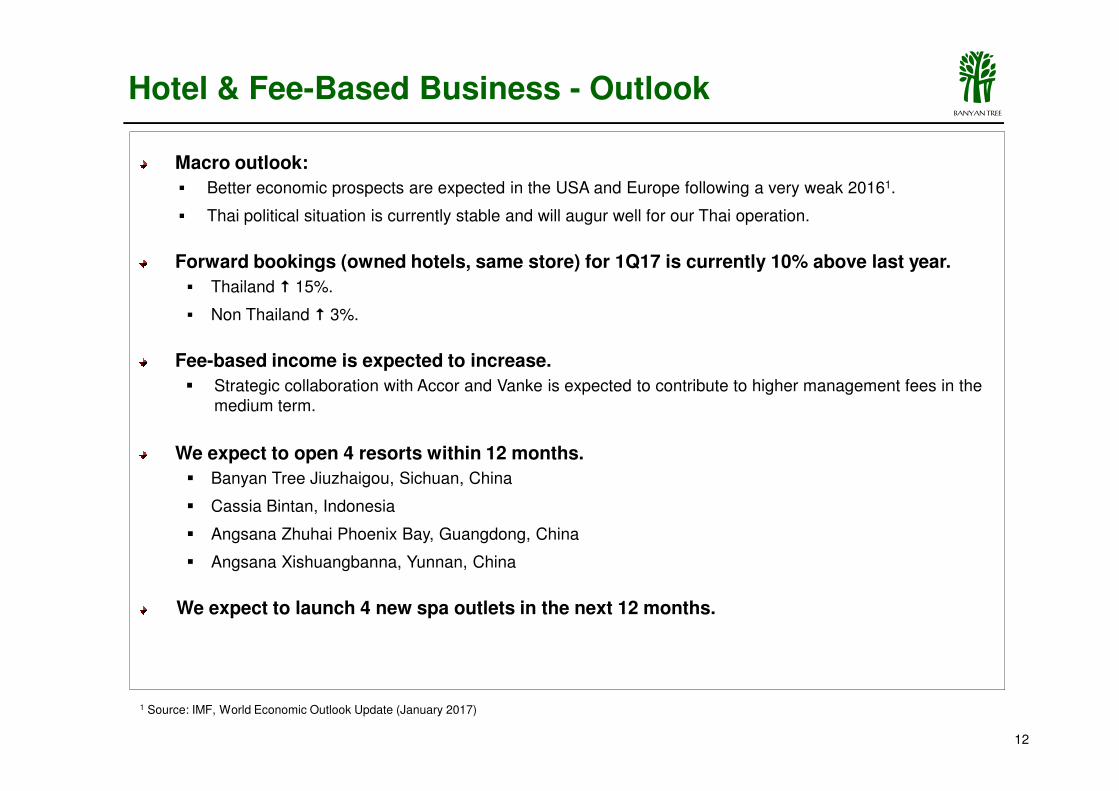
Macro outlook:
� Better economic prospects are expected in the USA and Europe following a very weak 20161.
� Thai political situation is currently stable and will augur well for our Thai operation.
Forward bookings (owned hotels, same store) for 1Q17 is currently 10% above last year.
� Thailand � 15%.
� Non Thailand � 3%.
Fee-based income is expected to increase.
� Strategic collaboration with Accor and Vanke is expected to contribute to higher management fees in the
Hotel & Fee-Based Business - Outlook
12
medium term.
We expect to open 4 resorts within 12 months.
� Banyan Tree Jiuzhaigou, Sichuan, China
� Cassia Bintan, Indonesia
� Angsana Zhuhai Phoenix Bay, Guangdong, China
� Angsana Xishuangbanna, Yunnan, China
We expect to launch 4 new spa outlets in the next 12 months.
1 Source: IMF, World Economic Outlook Update (January 2017)
ABANYAN TREE
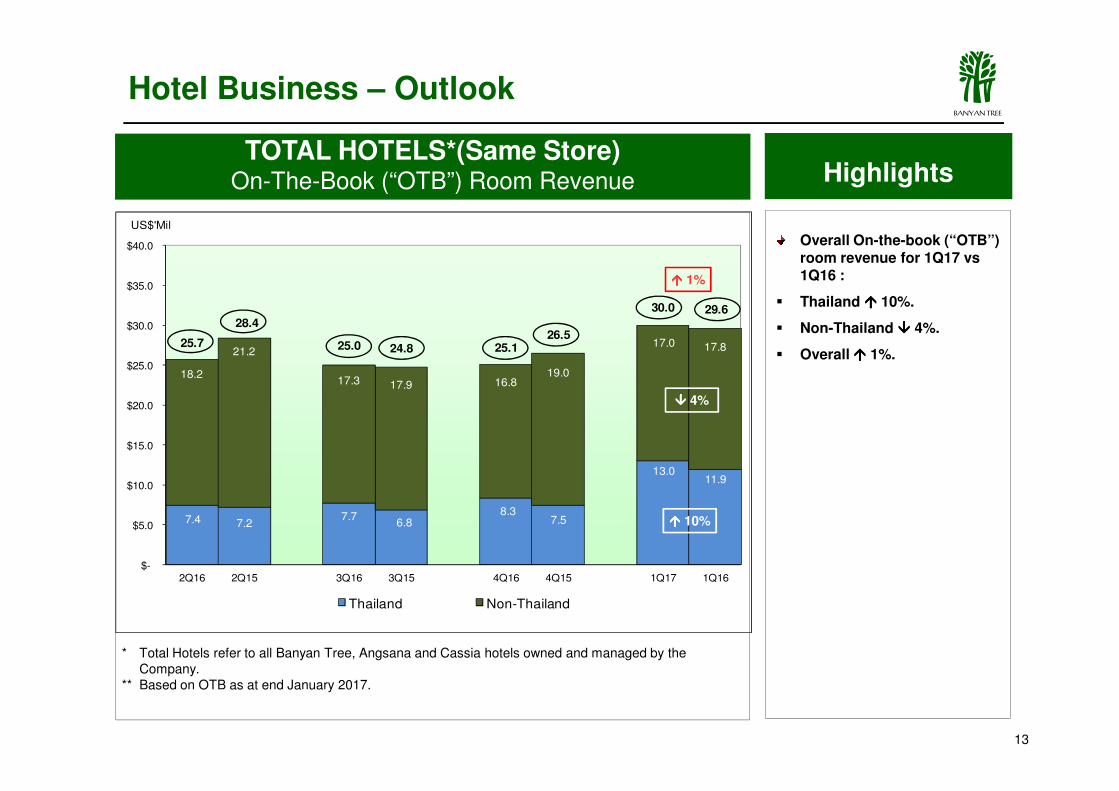
TOTAL HOTELS*(Same Store)On-The-Book (“OTB”) Room Revenue Highlights
Overall On-the-book (“OTB”) room revenue for 1Q17 vs1Q16 :
� Thailand ���� 10%.
� Non-Thailand ���� 4%.
� Overall ���� 1%.
18.2
21.2
17.3 17.9 16.819.0
17.0 17.825.7
28.4
25.0 24.8 25.126.5
30.0 29.6
$25.0
$30.0
$35.0
$40.0
US$'Mil
Hotel Business – Outlook
���� 1%
���� 4%
13
* Total Hotels refer to all Banyan Tree, Angsana and Cassia hotels owned and managed by the Company.
** Based on OTB as at end January 2017.
7.4 7.27.7
6.88.3
7.5
13.011.9
$-
$5.0
$10.0
$15.0
$20.0
2Q16 2Q15 3Q16 3Q15 4Q16 4Q15 1Q17 1Q16
Thailand Non-Thailand
���� 10%
���� 4%
ABANYAN TREE
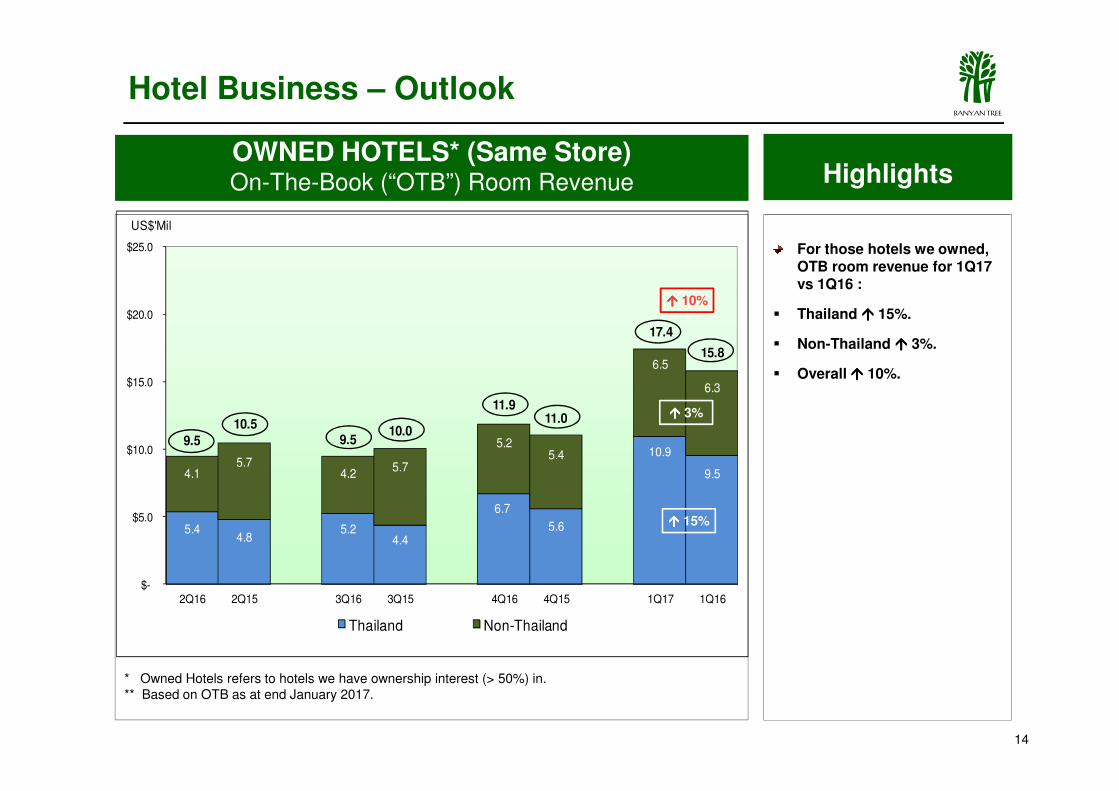
OWNED HOTELS* (Same Store)On-The-Book (“OTB”) Room Revenue
For those hotels we owned, OTB room revenue for 1Q17 vs 1Q16 :
� Thailand ���� 15%.
� Non-Thailand ���� 3%.
� Overall ���� 10%.
Hotel Business – Outlook
6.5
6.3
17.4
15.8
$15.0
$20.0
$25.0
US$'Mil
Highlights
���� 10%
14
* Owned Hotels refers to hotels we have ownership interest (> 50%) in.** Based on OTB as at end January 2017.
���� 2%
5.44.8
5.24.4
6.7
5.6
10.9
9.54.15.7
4.25.7
5.25.4
9.5
10.59.5
10.0
11.911.0
$-
$5.0
$10.0
2Q16 2Q15 3Q16 3Q15 4Q16 4Q15 1Q17 1Q16
Thailand Non-Thailand
���� 15%
���� 3%
ABANYAN TREE
62%
58%55%
55%
63%
59%
57%
55%
60%
65%
70%
Total Hotels1 Highlights
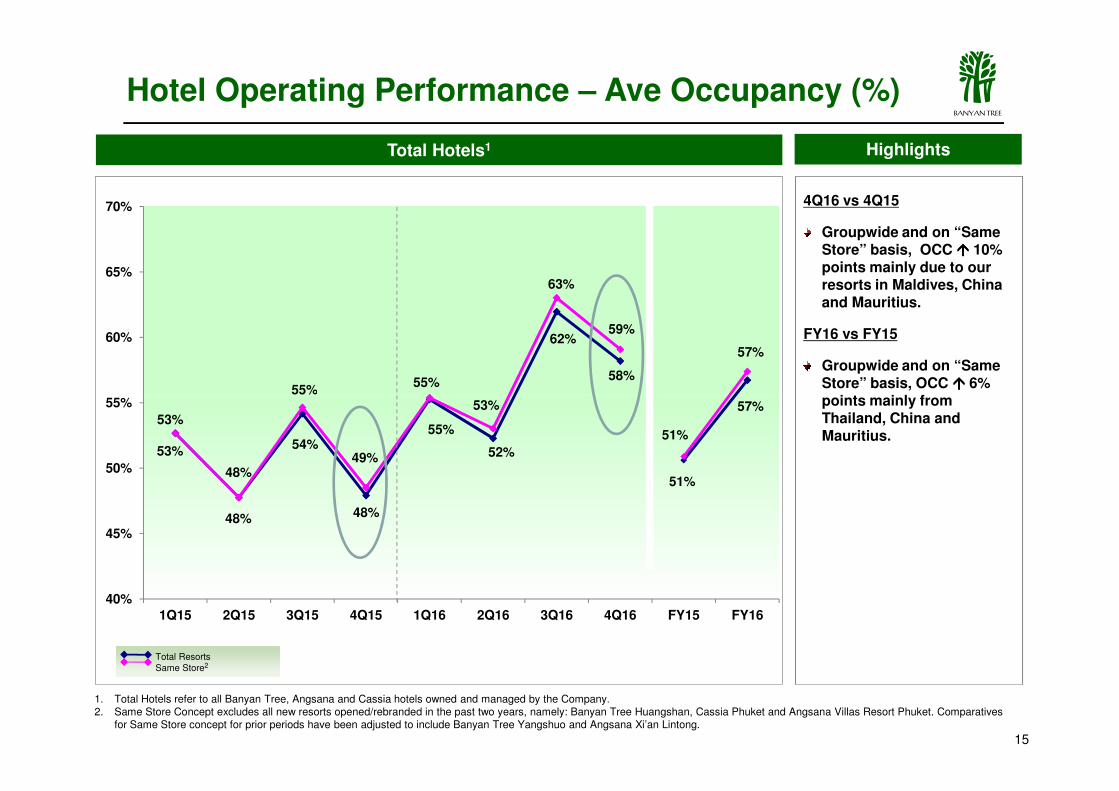
4Q16 vs 4Q15
Groupwide and on “Same Store” basis, OCC ���� 10% points mainly due to our resorts in Maldives, China and Mauritius.
FY16 vs FY15
Groupwide and on “Same Store” basis, OCC ���� 6% points mainly from
Hotel Operating Performance – Ave Occupancy (%)
53%
48%
54%
48%
55%
52%
51%
57%53%
48%
55%
49%
53%
51%
40%
45%
50%
55%
1Q15 2Q15 3Q15 4Q15 1Q16 2Q16 3Q16 4Q16 FY15 FY16
15
points mainly from Thailand, China and Mauritius.
Total ResortsSame Store2
1. Total Hotels refer to all Banyan Tree, Angsana and Cassia hotels owned and managed by the Company.2. Same Store Concept excludes all new resorts opened/rebranded in the past two years, namely: Banyan Tree Huangshan, Cassia Phuket and Angsana Villas Resort Phuket. Comparatives
for Same Store concept for prior periods have been adjusted to include Banyan Tree Yangshuo and Angsana Xi’an Lintong.
ABANYAN TREE
417
398381
371377
417
358
338
398 396384 377
355
350
400
450
500
Highlights
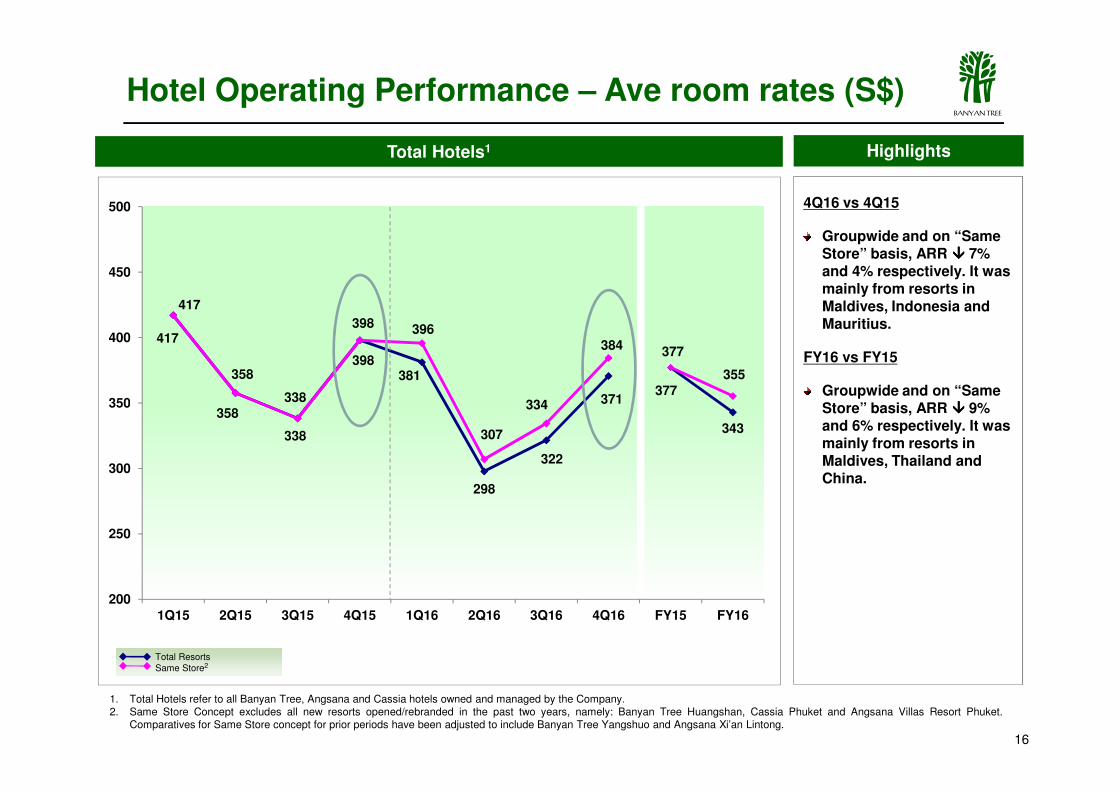
4Q16 vs 4Q15
Groupwide and on “Same Store” basis, ARR ���� 7% and 4% respectively. It was mainly from resorts in Maldives, Indonesia and Mauritius.
FY16 vs FY15
Groupwide and on “Same
Total Hotels1
Hotel Operating Performance – Ave room rates (S$)
358
338
298
322
371377
343
338
307
334
200
250
300
350
1Q15 2Q15 3Q15 4Q15 1Q16 2Q16 3Q16 4Q16 FY15 FY16
16
Groupwide and on “Same Store” basis, ARR ���� 9% and 6% respectively. It was mainly from resorts in Maldives, Thailand and China.
Total ResortsSame Store2
1. Total Hotels refer to all Banyan Tree, Angsana and Cassia hotels owned and managed by the Company.2. Same Store Concept excludes all new resorts opened/rebranded in the past two years, namely: Banyan Tree Huangshan, Cassia Phuket and Angsana Villas Resort Phuket.
Comparatives for Same Store concept for prior periods have been adjusted to include Banyan Tree Yangshuo and Angsana Xi’an Lintong.
ABANYAN TREE
220
191
211199
216
191 195
220
171185
193
219
163
211
227
192204
200
250
300
Highlights
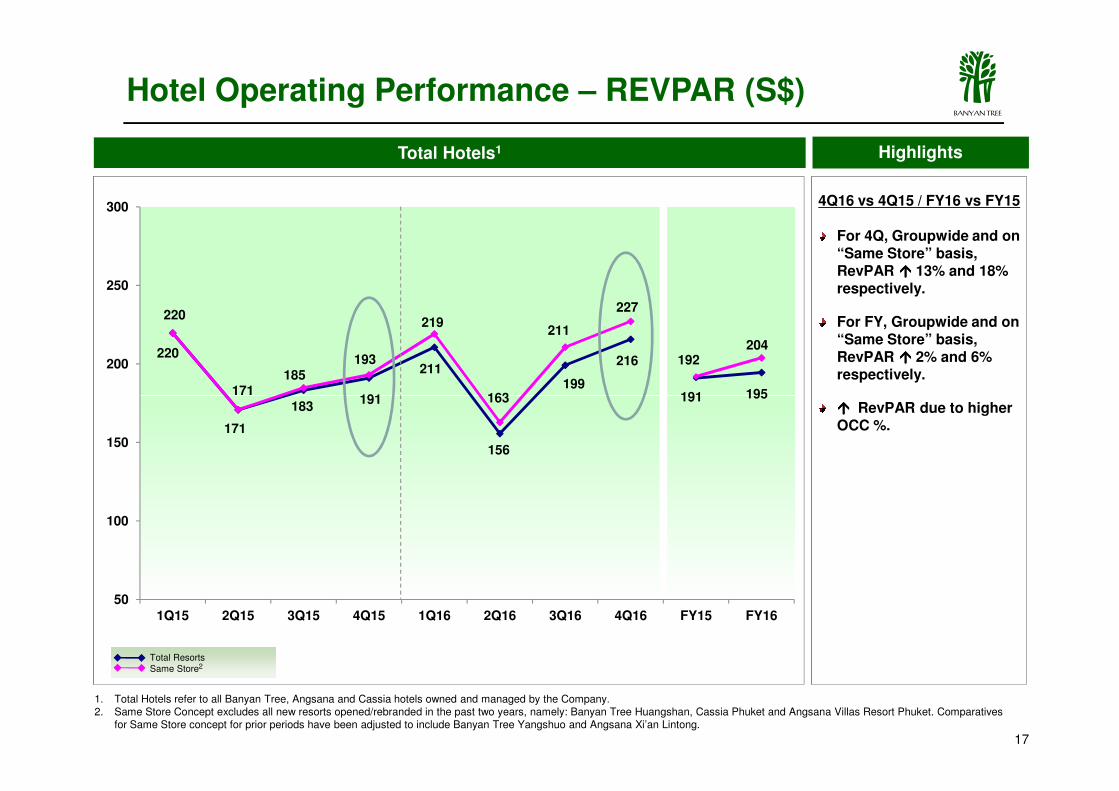
4Q16 vs 4Q15 / FY16 vs FY15
For 4Q, Groupwide and on “Same Store” basis, RevPAR ���� 13% and 18% respectively.
For FY, Groupwide and on “Same Store” basis, RevPAR ���� 2% and 6% respectively.
Total Hotels1
Hotel Operating Performance – REVPAR (S$)
171
183191
156
191 195171163
50
100
150
1Q15 2Q15 3Q15 4Q15 1Q16 2Q16 3Q16 4Q16 FY15 FY16
17
���� RevPAR due to higherOCC %.
Total ResortsSame Store2
1. Total Hotels refer to all Banyan Tree, Angsana and Cassia hotels owned and managed by the Company.2. Same Store Concept excludes all new resorts opened/rebranded in the past two years, namely: Banyan Tree Huangshan, Cassia Phuket and Angsana Villas Resort Phuket. Comparatives
for Same Store concept for prior periods have been adjusted to include Banyan Tree Yangshuo and Angsana Xi’an Lintong.
ABANYAN TREE
Highlights
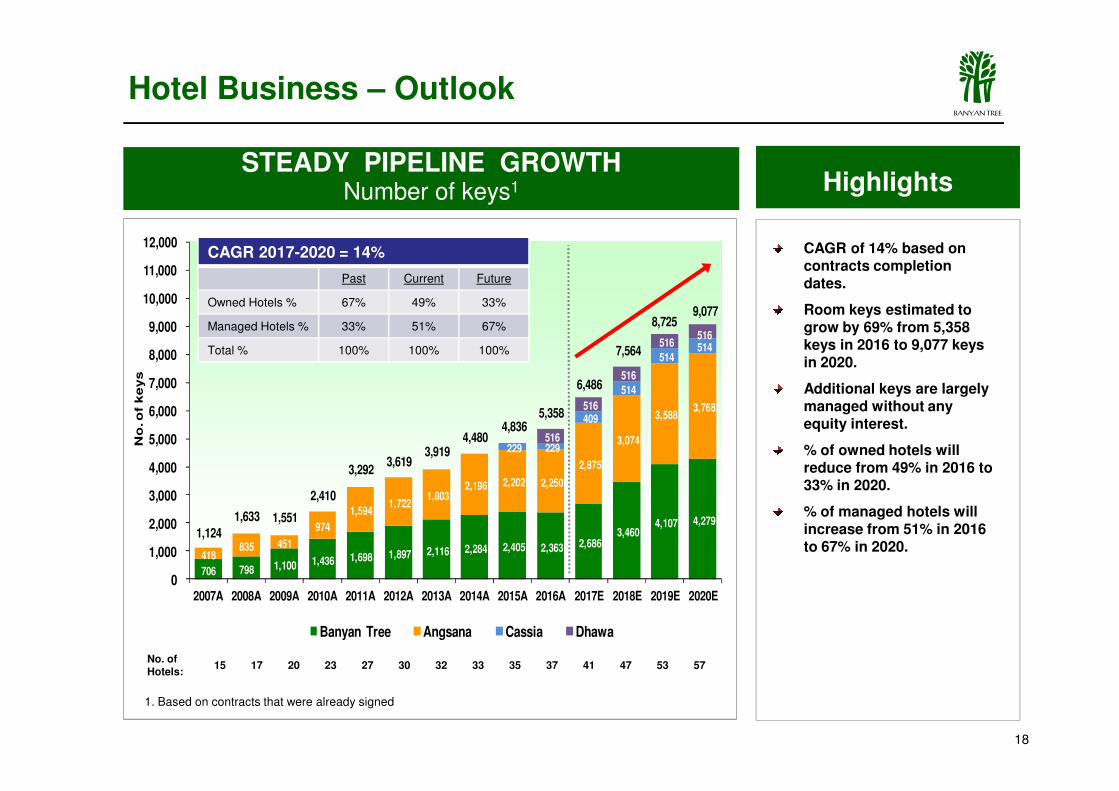
CAGR of 14% based on contracts completion dates.
Room keys estimated to grow by 69% from 5,358 keys in 2016 to 9,077 keys in 2020.
Additional keys are largely
STEADY PIPELINE GROWTHNumber of keys1
514
514 514
516
516 516
6,486
7,564
8,725 9,077
7,000
8,000
9,000
10,000
11,000
12,000
No
. o
f k
eys
Hotel Business – Outlook
CAGR 2017-2020 = 14%
Past Current Future
Owned Hotels % 67% 49% 33%
Managed Hotels % 33% 51% 67%
Total % 100% 100% 100%
18
1. Based on contracts that were already signed
Additional keys are largely managed without any equity interest.
% of owned hotels will reduce from 49% in 2016 to 33% in 2020.
% of managed hotels will increase from 51% in 2016 to 67% in 2020.
706 798 1,100 1,436 1,698 1,897 2,116 2,284 2,405 2,363 2,686 3,460
4,107 4,279
418 835 451
974
1,594 1,722
1,803 2,196 2,202 2,250
2,875
3,074
3,588 3,768
229 229
409
514
516
516
1,124
1,633 1,551
2,410
3,292 3,619
3,919 4,480
4,836 5,358
0
1,000
2,000
3,000
4,000
5,000
6,000
2007A 2008A 2009A 2010A 2011A 2012A 2013A 2014A 2015A 2016A 2017E 2018E 2019E 2020E
No
. o
f k
eys
Banyan Tree Angsana Cassia Dhawa
No. of Hotels:
15 17 20 23 27 30 32 33 35 37 41 47 53 57
ABANYAN TREE
Property Business
19
ABANYAN TREE
Operating Profit Highlights
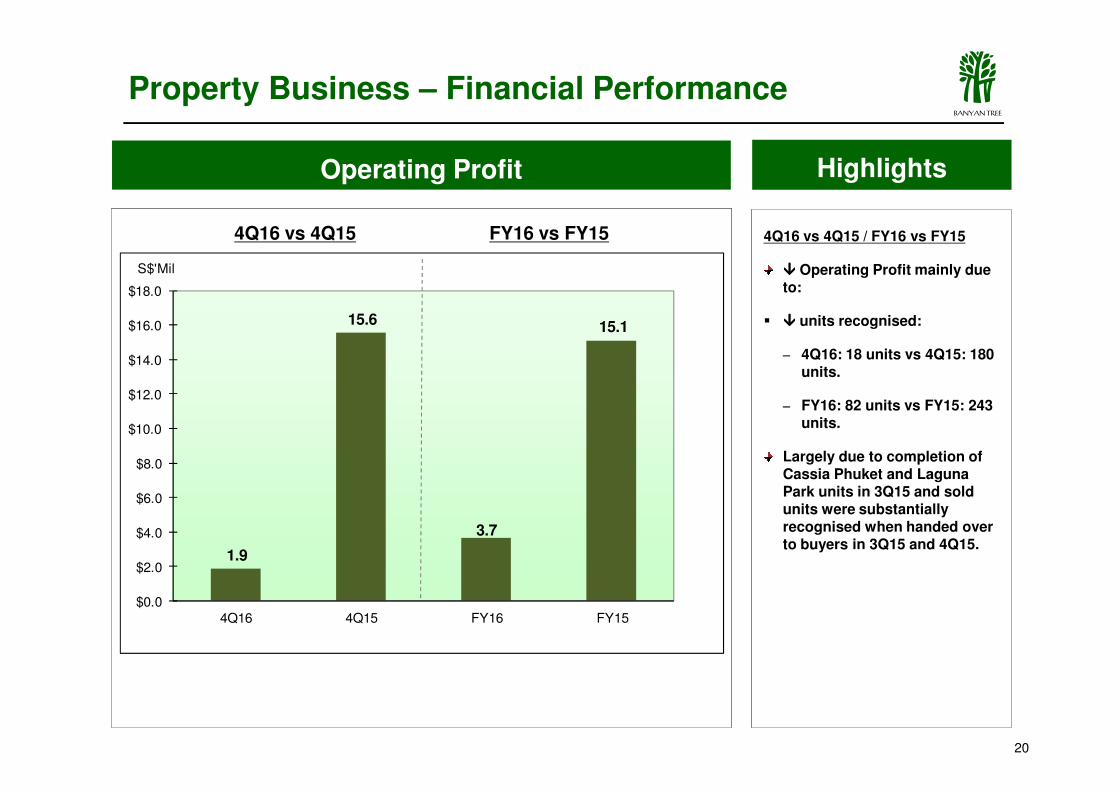
4Q16 vs 4Q15 / FY16 vs FY15
���� Operating Profit mainly due to:
� ���� units recognised:
− 4Q16: 18 units vs 4Q15: 180 units.
Property Business – Financial Performance
15.6 15.1
$12.0
$14.0
$16.0
$18.0
S$'Mil
4Q16 vs 4Q15 FY16 vs FY15
− FY16: 82 units vs FY15: 243 units.
Largely due to completion of Cassia Phuket and Laguna Park units in 3Q15 and sold units were substantially recognised when handed over to buyers in 3Q15 and 4Q15.
1.9
3.7
$0.0
$2.0
$4.0
$6.0
$8.0
$10.0
$12.0
4Q16 4Q15 FY16 FY15
20
ABANYAN TREE
Sales Progress
Property Business – Hotel Residences
Highlights
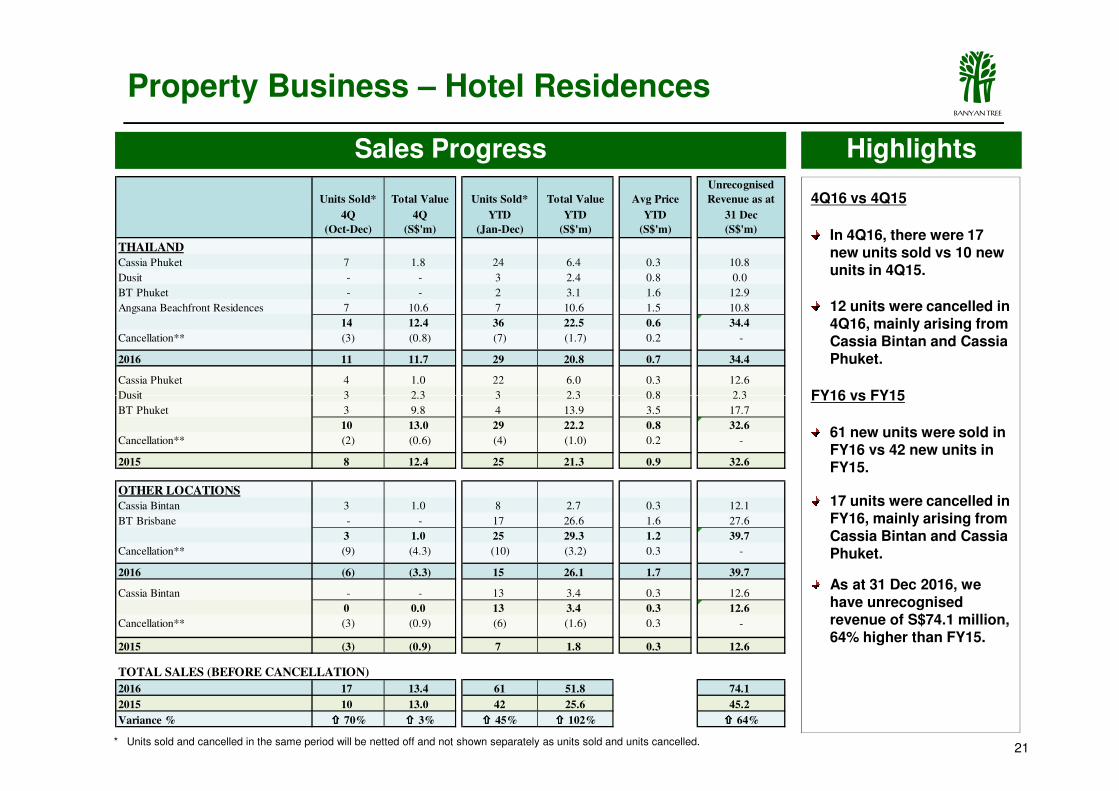
4Q16 vs 4Q15
In 4Q16, there were 17 new units sold vs 10 new units in 4Q15.
12 units were cancelled in 4Q16, mainly arising from Cassia Bintan and Cassia Phuket.
FY16 vs FY15
Units Sold* Total Value Units Sold* Total Value Avg Price
Unrecognised
Revenue as at
4Q 4Q YTD YTD YTD 31 Dec
(Oct-Dec) (S$'m) (Jan-Dec) (S$'m) (S$'m) (S$'m)
THAILANDCassia Phuket 7 1.8 24 6.4 0.3 10.8
Dusit - - 3 2.4 0.8 0.0
BT Phuket - - 2 3.1 1.6 12.9
Angsana Beachfront Residences 7 10.6 7 10.6 1.5 10.8
14 12.4 36 22.5 0.6 34.4
Cancellation** (3) (0.8) (7) (1.7) 0.2 -
2016 11 11.7 29 20.8 0.7 34.4
Cassia Phuket 4 1.0 22 6.0 0.3 12.6
Dusit 3 2.3 3 2.3 0.8 2.3
* Units sold and cancelled in the same period will be netted off and not shown separately as units sold and units cancelled.21
FY16 vs FY15
61 new units were sold in FY16 vs 42 new units in FY15.
17 units were cancelled in FY16, mainly arising from Cassia Bintan and Cassia Phuket.
As at 31 Dec 2016, we have unrecognisedrevenue of S$74.1 million, 64% higher than FY15.
Dusit 3 2.3 3 2.3 0.8 2.3
BT Phuket 3 9.8 4 13.9 3.5 17.7
10 13.0 29 22.2 0.8 32.6
Cancellation** (2) (0.6) (4) (1.0) 0.2 -
2015 8 12.4 25 21.3 0.9 32.6
OTHER LOCATIONSCassia Bintan 3 1.0 8 2.7 0.3 12.1
BT Brisbane - - 17 26.6 1.6 27.6
3 1.0 25 29.3 1.2 39.7
Cancellation** (9) (4.3) (10) (3.2) 0.3 -
2016 (6) (3.3) 15 26.1 1.7 39.7
Cassia Bintan - - 13 3.4 0.3 12.6
0 0.0 13 3.4 0.3 12.6
Cancellation** (3) (0.9) (6) (1.6) 0.3 -
2015 (3) (0.9) 7 1.8 0.3 12.6
TOTAL SALES (BEFORE CANCELLATION)
2016 17 13.4 61 51.8 74.1
2015 10 13.0 42 25.6 45.2
Variance % ���� 70% ���� 3% ���� 45% ���� 102% ���� 64%
ABANYAN TREE
Sales Progress Highlights
4Q16 vs 4Q15
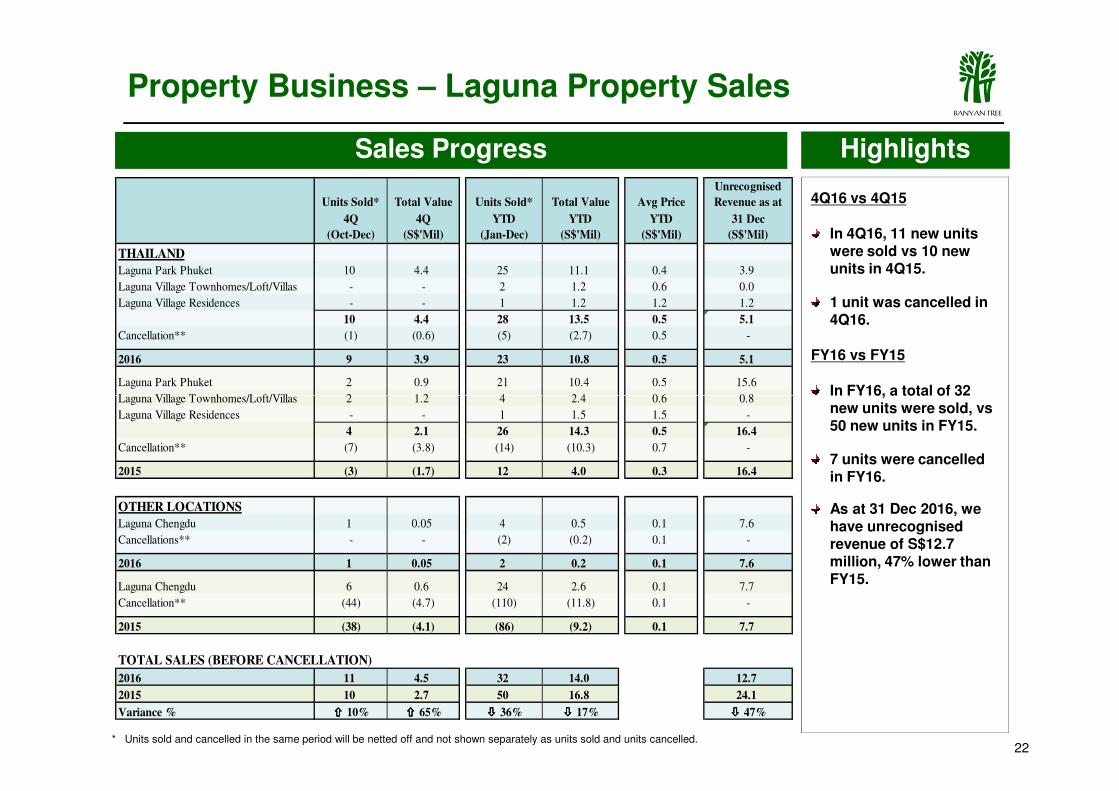
In 4Q16, 11 new units were sold vs 10 new units in 4Q15.
1 unit was cancelled in 4Q16.
FY16 vs FY15
In FY16, a total of 32
Property Business – Laguna Property Sales
Units Sold* Total Value Units Sold* Total Value Avg Price
Unrecognised
Revenue as at
4Q 4Q YTD YTD YTD 31 Dec
(Oct-Dec) (S$'Mil) (Jan-Dec) (S$'Mil) (S$'Mil) (S$'Mil)
THAILAND
Laguna Park Phuket 10 4.4 25 11.1 0.4 3.9
Laguna Village Townhomes/Loft/Villas - - 2 1.2 0.6 0.0
Laguna Village Residences - - 1 1.2 1.2 1.2
10 4.4 28 13.5 0.5 5.1
Cancellation** (1) (0.6) (5) (2.7) 0.5 -
2016 9 3.9 23 10.8 0.5 5.1
Laguna Park Phuket 2 0.9 21 10.4 0.5 15.6
Laguna Village Townhomes/Loft/Villas 2 1.2 4 2.4 0.6 0.8
22
In FY16, a total of 32 new units were sold, vs50 new units in FY15.
7 units were cancelled in FY16.
As at 31 Dec 2016, we have unrecognisedrevenue of S$12.7 million, 47% lower than FY15.
* Units sold and cancelled in the same period will be netted off and not shown separately as units sold and units cancelled.
Laguna Village Townhomes/Loft/Villas 2 1.2 4 2.4 0.6 0.8
Laguna Village Residences - - 1 1.5 1.5 -
4 2.1 26 14.3 0.5 16.4
Cancellation** (7) (3.8) (14) (10.3) 0.7 -
2015 (3) (1.7) 12 4.0 0.3 16.4
OTHER LOCATIONS
Laguna Chengdu 1 0.05 4 0.5 0.1 7.6
Cancellations** - - (2) (0.2) 0.1 -
2016 1 0.05 2 0.2 0.1 7.6
Laguna Chengdu 6 0.6 24 2.6 0.1 7.7
Cancellation** (44) (4.7) (110) (11.8) 0.1 -
2015 (38) (4.1) (86) (9.2) 0.1 7.7
TOTAL SALES (BEFORE CANCELLATION)
2016 11 4.5 32 14.0 12.7
2015 10 2.7 50 16.8 24.1
Variance % ���� 10% ���� 65% ���� 36% ���� 17% ���� 47%
ABANYAN TREE
Encouraging property sales momentum in Phuket
� Favourable response to the launch of Angsana Beachfront apartments in late December. By end of January2017, all 30 units (S$48.5m) that were available for sales were sold.
Property sales in Chengdu, China will temporary halt
� Laguna Chengdu sales were temporary halted following government’s inability to provide vital infrastructureto the project site. Negotiations with government are still in process.
� Sold 31% of Phase 1A to date.
� Big developers eg Evergrande and Vanke looking to acquire lands for “wellness themed” projects inWenjiang, expect renewed interest by property buyers.
Property Business - Outlook
23
Wenjiang, expect renewed interest by property buyers.
Property sales in Brisbane, Australia likely to be slow in 2017.
� Sold 22% to date.
� Off-plan sales momentum slowed down after imposition of lending restrictions by banks, increase in foreignbuyers stamp duty and over supply of off-plan apartments.
Total 93 units (S$65.8m) sold in FY16 vs. 93 units (S$43.4m) in FY15.
S$86.8m of unrecognised revenue, 25% higher than last year of S$69.3m.
� About 32% will be recognised in 2017, remaining in 2018-2019.
ABANYAN TREE
Mission Statement
“ We want to build globally recognised brands
which by inspiring exceptional experiences among
our guests, instilling pride and integrity in our
associates and enhancing both the physical and
24
associates and enhancing both the physical and
human environment in which we operate, will
deliver attractive returns to our shareholders. ”