Banner Performance Reporting and Analytics Advanced COGNOS ...
249
Banner Performance Reporting and Analytics Advanced COGNOS© Reporting Training Workbook Cognos Release 8.x Updated 06/30/2011 What can we help you achieve? HIGHER EDUCATION
Transcript of Banner Performance Reporting and Analytics Advanced COGNOS ...

Banner Performance Reporting and Analytics Advanced COGNOS© Reporting
Training Workbook
Cognos Release 8.x Updated 06/30/2011
What can we help you achieve? HIGHER EDUCATION

_________________________________________________________________________________________________________________
SunGard Higher Education
4 Country View Road Malvern, Pennsylvania 19355 United States of America (800) 522 - 4827
Customer Support Center website
http://connect.sungardhe.com
Distribution Services e-mail address
Other services
In preparing and providing this publication, SunGard Higher Education is not rendering legal, accounting, or other similar professional services. SunGard Higher Education makes no claims that an institution's use of this publication or the software for which it is provided will insure compliance with applicable federal or state laws, rules, or regulations. Each organization should seek legal, accounting and other similar professional services from competent providers of the organization's own choosing.
Trademark
Without limitation, SunGard, the SunGard logo, Banner, Campus Pipeline, Luminis, PowerCAMPUS, Matrix, and Plus are trademarks or registered trademarks of SunGard Data Systems Inc. or its subsidiaries in the U.S. and other countries. Third-party names and marks referenced herein are trademarks or registered trademarks of their respective owners.
Revision History Log
Publication Date Summary
6/30/2010 New workbook that supports Advanced Cognos© Reporting Workshop for Banner ODS General Person data.
Notice of rights Copyright © SunGard Higher Education 2010. This document is proprietary and confidential information of SunGard Higher Education Inc. and is not to be copied, reproduced, lent, displayed or distributed, nor used for any purpose other than that for which it is specifically provided without the express written permission of SunGard Higher Education Inc.

Table of Contents
Introduction .............................................................................................................. 5 Cognos Connection Navigation Basics ............................................................................ 7 Using Report Studio .................................................................................................... 14 Using the Explorer Bar ................................................................................................ 19 Using the Toolbox Tab ................................................................................................ 21 Creating a Folder ........................................................................................................ 22 Creating a Report ....................................................................................................... 24 Opening a New Report from Report Studio ................................................................... 28
Working with Report Contents ................................................................................ 29 Adding Row Numbers ................................................................................................. 30 Adding Record Counts ................................................................................................ 33 Using Aggregates ....................................................................................................... 35 Adding a Singleton ..................................................................................................... 38 Performing a Query Calculation ................................................................................... 41 Concatenating Data .................................................................................................... 43 Inserting Multiple Items into a Single Column ............................................................... 46
Working with Filters ................................................................................................ 50 Adding Filters to a Report............................................................................................ 51 Using Before/After Auto Aggregation ............................................................................ 58 Adding a Filter Prompt to a Report ............................................................................... 60
Working with Prompts and Prompt Pages............................................................... 67 Building and Formatting a Prompt Page ........................................................................ 68 Adding a Value Prompt to a Report .............................................................................. 75 Creating a Prompt Using a Look Up Value ..................................................................... 80 Adding a Select and Search Prompt ............................................................................. 89 Adding a Text Box Prompt ........................................................................................... 96 Adding a Date Prompt............................................................................................... 101 Adding End User Messages to a Prompt Page ............................................................. 106 Adding Error Messages to a Prompt Page ................................................................... 106
Drilling Up, Down, and Through Reports ............................................................... 107 Step 1: Creating a Summary Report .......................................................................... 108 Step 2: Creating a Detail Report ............................................................................... 112 Step 3: Creating a Drill-Through Definition ................................................................ 116
Using Cognos Framework Manager ....................................................................... 120 Working with Framework Manager Layers .................................................................. 121 Modifying a Model .................................................................................................... 122 Creating a Framework Manager Project ...................................................................... 123
Using Cognos Framework Manager ....................................................................... 124 Cognos Framework Manager Overview ....................................................................... 125 Framework Manager Models ...................................................................................... 126 Framework Manager Applied Functionality .................................................................. 130 Branch To…Merge From ............................................................................................ 139 Exercise 1: Publishing a Package .............................................................................. 160

Using a Repeater Table ......................................................................................... 161 Creating a Mailing Label Report ................................................................................. 198 Filtering Data in a Mailing Label ................................................................................. 206 Sorting Data in a Mailing Label .................................................................................. 208 Saving the Mailing Labels as a PDF File ...................................................................... 210 Printing the Mailing Labels ........................................................................................ 212
Working with Queries ............................................................................................ 214 Creating Multiple Queries .......................................................................................... 215 Combining Data by Forming a Union .......................................................................... 219 Comparing Data Using an Intersect ............................................................................ 220 Comparing Data Using an Except ............................................................................... 221 Creating a Manual Join.............................................................................................. 222 Adding SQL .............................................................................................................. 223
Using Advanced Reporting Techniques ................................................................. 224 Using Variables ........................................................................................................ 225 Adding Aggregate Summaries .................................................................................... 226 Viewing Objects Rendering Using Variables................................................................. 227 Working with Multiple Pages Reporting ....................................................................... 228
Formatting Reports and Create Report Templates ................................................ 229 Working in the Page Structure View ........................................................................... 230 Adding Headers and Footers...................................................................................... 230 Adding a Page Break ................................................................................................ 230 Applying Conditional Styles ........................................................................................ 231 Importing a Graphic Element ..................................................................................... 236 Creating a Report Template ...................................................................................... 236
Appendix ............................................................................................................... 237 Terminology ............................................................................................................. 238

© SunGard 2010 Advanced Cognos Reporting Page 5
Introduction
Course goal
The goal of this course is to provide the knowledge and practice to create and run more advanced reports using calculations, counts, filters, prompts, queries, variables, and templates in Cognos Report Author.
Course objectives
In this course you will learn how to:
• work with report content using the General Person data
• work with filters
• work with prompts and prompt pages
• drill up, down, and through reports
• use Cognos Framework Manager
• use a repeater table to create mailing labels
• work with multiple queries and joins
• work with advanced reporting techniques such as variables, aggregates, and multiple page reporting
• format reports and create report templates.
Intended audience
Report writers who will use Banner Operational Data Store data in the Cognos 8 Business Intelligence (BI) Report Author © tool.
Prerequisites

© SunGard 2010 Advanced Cognos Reporting Page 6
To complete this course, you should have a basic understanding of
• your institution‟s business processes and data
• Cognos 8 Business Intelligence (BI) Consumer © tool
To complete this course, you should have completed the following
• Introduction to Cognos Reporting – Business User training
• Introduction to Cognos Reporting – Report Author training.

© SunGard 2010 Advanced Cognos Reporting Page 7
Cognos Connection Navigation Basics
Introduction
When you open the Cognos Connection, you can create and view built from information stored in the Banner Operational Data Store. Reports can be grouped into tabs and folders. Click the folder name to open the set of reports that you want to view. Notice that some folders are blue. Blue folders represent specific data packages such as the Person Demographic.

© SunGard 2010 Advanced Cognos Reporting Page 8
When you first open Cognos Connection, the reports folders will be empty. As you begin to create your own reports, they will be saved in the folder you designate. You can save reports you want to share with others on the Public Folders tab. You can also save reports that you create to the Operational Data Store Reports tab. There is a empty folder for each package. By saving the reports you create using each package in the corresponding folder for the package, others can more easily find a report created using that package.
You can save reports you create that you only want yourself to have access to on the My Folders tab. Open each folder for a list of all the reports contained in it. You can run, view, copy, save, schedule, email, or export reports from this view.

© SunGard 2010 Advanced Cognos Reporting Page 9
Toolbar icons
Above the report list is a toolbar that helps you manage reports. Each toolbar icon is described below. Based on your security permissions, you may not see all of the icons.
Icon Name Description
List View
The default view is the list view which displays the folders or reports by name. Notice the shaded background. This indicates that the icon is selected.
Details View
Use this icon to view the name and description of the folders or reports.
New Folder
Use this icon to create a new folder.
New Metric Package
Use this icon to create a new metric package. A metric package is a container for models, reports, and tasks used to manage the contents of a metric store.
Note: Depending on your security level, not all users will have access to this icon.
New Job
Use this icon to set the same schedule for multiple entries by creating a job. A job identifies a collection of reports, report views, and other jobs that are scheduled together and share the same schedule settings. When a scheduled job runs, all the entries in the job run.
New Data Integration Task
Administrators use this icon to select one of the following:
New Metric Import from Files New Metric Maintenance New Metric Export

© SunGard 2010 Advanced Cognos Reporting Page 10
Icon Name Description
New URL
Use this icon to create a link to a URL such as a server stored document or a website.
New Page
Use this icon to create your own pages to group different types of information into a single view. The information within a tab is displayed on a page.
Cut
Use this icon to remove a folder or report from the current page. Use with the paste feature when moving a folder or report.
Copy
Use this icon to copy a report to another folder while leaving the original report in its current location. This is useful if you want to base one report off of another.
Paste
Use this icon to place a copy of the folder or report in the new location. Notice that this icon is completely grayed-out. This means that this icon is not available until another action (in this case cut or copy) is performed.
Delete
Use this icon to remove a folder or report that you do not want to move.
Set Properties
Use this icon to set general properties such as name, language, description, and screen tip for a folder. You can also set permissions for a folder.
Order
Use this icon to specify the folders and entries to be shown at the beginning of the list and specify their display order. The default is to show them in ascending order by name. You can select one or more reports or folders to be shown at the beginning of the list followed by the remaining items in ascending order by name.
© SunGard 2010 Advanced Cognos Reporting Page 11
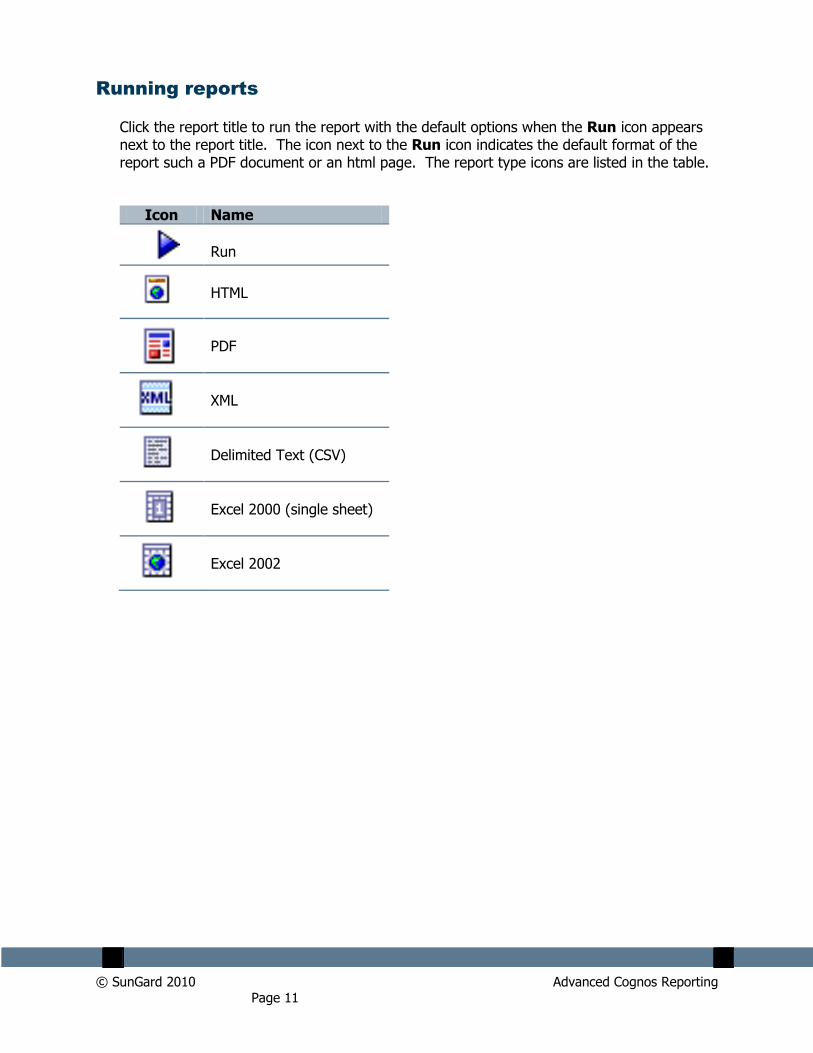
Running reports
Click the report title to run the report with the default options when the Run icon appears next to the report title. The icon next to the Run icon indicates the default format of the report such a PDF document or an html page. The report type icons are listed in the table.
Icon Name
Run
HTML
XML
Delimited Text (CSV)
Excel 2000 (single sheet)
Excel 2002

© SunGard 2010 Advanced Cognos Reporting Page 12
Report Actions
The Actions column next to the reports provides additional options for each report listed. Each action is described below.
Icon Name Description
Set properties
Use this icon to set general properties such as name, language, description, and screen tip for a report. You can also set permissions for a report.
Run with options
Use the Run with options icon in the Actions column to change the report options such as format, language, and delivery. You must use this option to select Advanced options to run the report in multiple languages or formats. Note: You can also click the report title to run the report with the default options when the Run icon appears next to the report title.
Open with report studio
Report authors use this icon to open the report in Report Studio where they can modify the report structure. Business users should not use this link.
Create a report view
Use this icon to create a new report view. You can set the view so that the report always displays according to your run options without modifying the original report.

© SunGard 2010 Advanced Cognos Reporting Page 13
Icon Name Description
Schedule
Use the Schedule icon to schedule this entry to run at a recurring date and time. You can run using the default values or specify the options. You can disable the schedule without losing any of its details.
Report Output Versions
Use this icon to view a list of report outputs and select the one that you want to view.
Open with Query Studio
Use this icon to open an Ad Hoc query report in Query Studio.
More…
Use the More… link to access set properties, run with options, open with report studio, new schedule, move, copy, create a shortcut, create a report view of this report, add to bookmarks, and delete. Note: Some of these options have their own action icon and others can only be accessed using the More… link.

© SunGard 2010 Advanced Cognos Reporting Page 14
Using Report Studio
Introduction
Report Studio is a Cognos tool that helps create simple and complex reports to answer business questions. When you open Report Studio, you must select the data package and the format of your report.
Report Studio then opens with the selected report format showing you where to insert the data. In the example below, a crosstab report was selected. You can drag the data you want to use for rows and columns to the appropriate part of the report in blue. You can drag the measures to the middle white section.
Report Studio

© SunGard 2010 Advanced Cognos Reporting Page 15
Layout
The Cognos Report Studio contains the following layout objects.
Object Description
Menu bar
Links to additional tasks grouped into menus.
Toolbar
Two rows of icons allow you to have easy access to tasks related to building and formatting reports.
Insertable object pane
The Insertable Objects pane displays data in nested folders from the selected data package. Click the plus sign next to a data element to expand the data. At the bottom of the pane are three tabs, the default Source tab (shows all available data), the Data Items tab (shows just the data already included in the report), and the Toolbox tab (which shows the objects that you can add to the report).
Properties pane
The Properties pane helps you modify objects and data items.
Explorer bar
The Explorer bar separates the panes on the left from the work area on the right. It includes three buttons that can change the view from the default page to other report pages, or open the Query Explorer and Condition Explorer.
Work Area The largest element on the screen is the work area. In
Report Studio the data from your report is not visible as you are building the report. The column and rows of data appear in the work area but you must run the report to see the actual data that will display.

© SunGard 2010 Advanced Cognos Reporting Page 16
Toolbars
Above the work area is a toolbar that helps you create reports. If you use a windows-based text editing program, you are already familiar with many of the icons such as Save, Cut, Copy, Bold, Italics, etc…
In addition to the text-editing toolbars there is also a report toolbar that contains icons you may not be familiar with. Each report toolbar icon is described below.
Icon Name Description
Validate report
Use this icon to validate a report
Show specification
Use this icon to show the report specifications in XML format.
Run report
Use this icon to run with all data and test prompts for data.
Lock
Use this icon to lock and unlock a report.
Visual Aids Use this icon to select the visual aids that you would like to see on the screen as you build your report such as boundary lines, headers and footers, sorting, grouping, etc…
Create sets
Use this icon to create data sets
Insert Single Member
Use this icon to insert a single member into a report.
Filter
Use this icon to show a sub-set of the data.
Sort
Use this icon to display report data in an ascending or descending alpha-numeric list.
Sort opposite axis sets by value
Use this icon to sort the opposite axis sets by value.
© SunGard 2010 Advanced Cognos Reporting Page 17
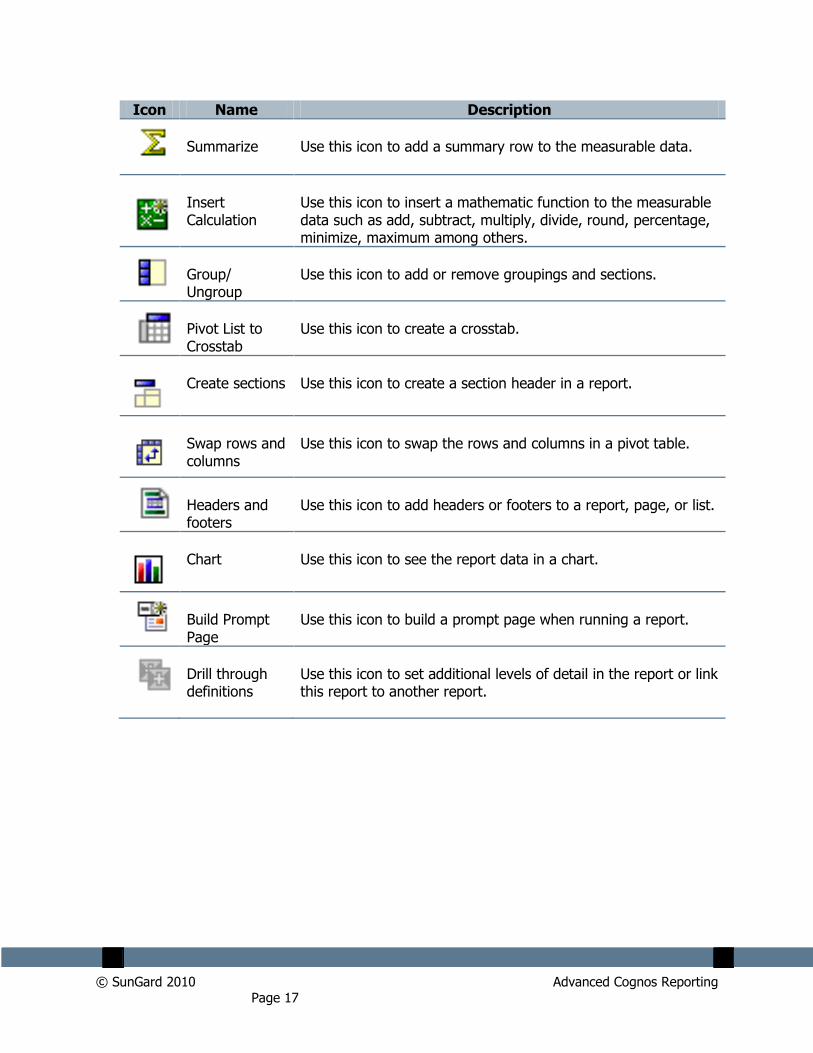
Icon Name Description
Summarize
Use this icon to add a summary row to the measurable data.
Insert Calculation
Use this icon to insert a mathematic function to the measurable data such as add, subtract, multiply, divide, round, percentage, minimize, maximum among others.
Group/ Ungroup
Use this icon to add or remove groupings and sections.
Pivot List to Crosstab
Use this icon to create a crosstab.
Create sections
Use this icon to create a section header in a report.
Swap rows and columns
Use this icon to swap the rows and columns in a pivot table.
Headers and footers
Use this icon to add headers or footers to a report, page, or list.
Chart
Use this icon to see the report data in a chart.
Build Prompt Page
Use this icon to build a prompt page when running a report.
Drill through definitions
Use this icon to set additional levels of detail in the report or link this report to another report.
© SunGard 2010 Advanced Cognos Reporting Page 18
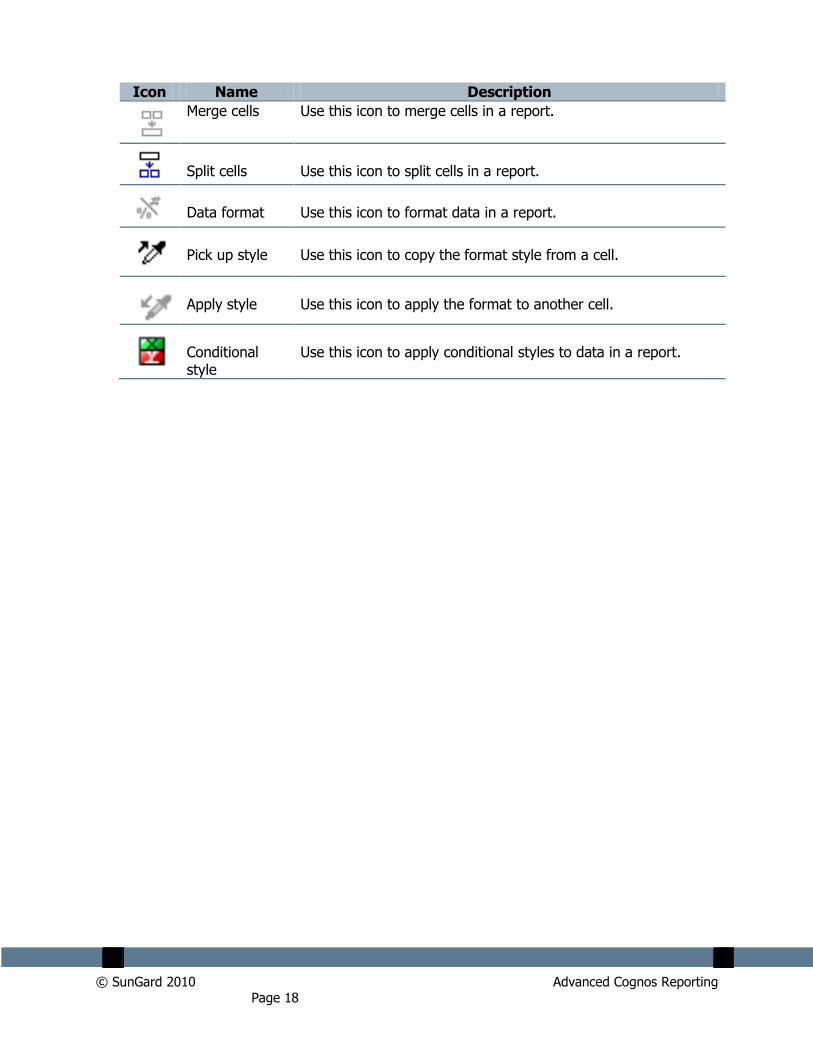
Icon Name Description
Merge cells Use this icon to merge cells in a report.
Split cells
Use this icon to split cells in a report.
Data format
Use this icon to format data in a report.
Pick up style
Use this icon to copy the format style from a cell.
Apply style
Use this icon to apply the format to another cell.
Conditional style
Use this icon to apply conditional styles to data in a report.

© SunGard 2010 Advanced Cognos Reporting Page 19
Using the Explorer Bar
Introduction
The Explorer bar separates the panes on the left from the work area on the right. It includes three buttons that can change the view from the default page to other report pages, or open the Query Explorer and Condition Explorer. Each icon is described below.
Icon Name Description
Page Explorer
Use this icon to open the Page Explorer window on top of the work area. You can select other pages contained in the report such as a report page or a prompt page. The selected page will display in the work area.
© SunGard 2010 Advanced Cognos Reporting Page 20
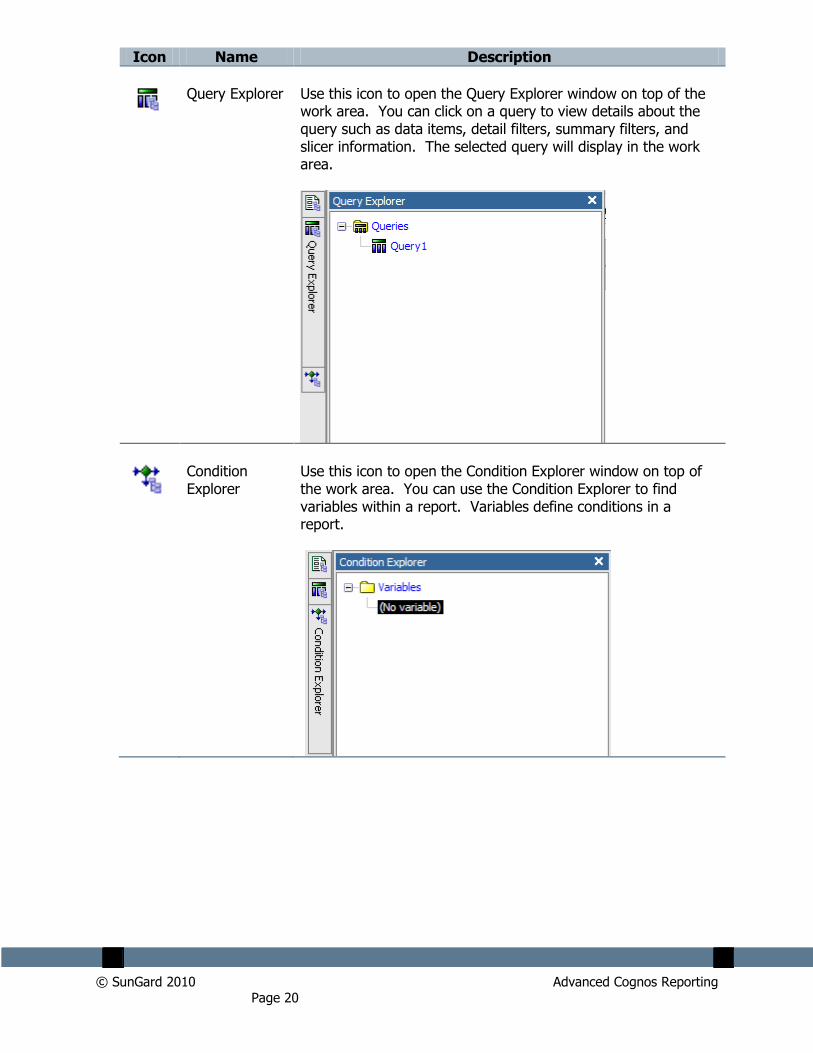
Icon Name Description
Query Explorer
Use this icon to open the Query Explorer window on top of the work area. You can click on a query to view details about the query such as data items, detail filters, summary filters, and slicer information. The selected query will display in the work area.
Condition Explorer
Use this icon to open the Condition Explorer window on top of the work area. You can use the Condition Explorer to find variables within a report. Variables define conditions in a report.

© SunGard 2010 Advanced Cognos Reporting Page 21
Using the Toolbox Tab
Introduction
The Insertable Objects pane displays by default when you first open Report Studio. The Insertable Objects pane displays data in nested folders from the selected data package.
At the bottom of the Insertable Objects pane are three tabs, the default Source tab (shows all available data), the Data Items tab (shows just the data already included in the report), and the Toolbox tab (which shows the objects that you can add to the report).
You can use the Toolbox tab to multiple types of data as needed for your report. You can add text, blocks or tables to hold other objects such as text or prompts, charts, calculations, images, report types, links, page numbers, and several types of prompts. In this Advanced Cognos Reporting training workbook, you will learn to use items in the Toolbox tab.
Toolbox tab

© SunGard 2010 Advanced Cognos Reporting Page 22
Creating a Folder
Introduction
Before you begin working in Cognos, you should create a folder into which you want to put the reports you create or copy.
For this training class, you will create a folder called xx-Sample Reports where xx= your initials. The reports that you create in the training workbook will be stored in this folder.
Training folder

© SunGard 2010 Advanced Cognos Reporting Page 23
Steps
Follow these steps to create a folder.
1. From Cognos Connection, click the My Folders tab.
2. Click the New Folder icon.
3. Enter xx-Sample Reports where XX = your initials in the Name field.
4. Enter <your first name> Training Reports in the Description field.
5. Click the Finish button.
6. Click the More… link at the end of the line for the folder you just created.
Notice the options that are available to you.
7. Click the Cancel button to return to the list of folders.

© SunGard 2010 Advanced Cognos Reporting Page 24
Creating a Report
Introduction
Report Studio is used for more complex reports and does not include a report preview window. To create a report, open Report Studio select the data package and the format of your report.
Report Studio then opens with the selected report format showing you where to insert the data. You can drag the data you want to use to the appropriate part of the report.
There are some basic steps to creating a report:
select data package
select report format
insert data into the report
edit data – filter, sort or summarize the data in the report.

© SunGard 2010 Advanced Cognos Reporting Page 25
Step 1 - Selecting the right data package
Cognos uses a metadata layer defined using its Framework Manager Tool to make the data in the reporting database available to the Cognos BI Reporting Tools. The database is redefined so that the data can be published in a package made available through the Cognos Connection. The Framework Manager model structures, adds to, and manages data to provide the data in a manner that makes sense to users
After the metadata model is defined, a package is created to make metadata available to report authors. Each package contains all the information that a specific user or group of users needs to create reports.
Example: One package can contain all the data related to person demographics and a second package a different set of the data that is used for reporting on the student data.
When you are creating a report, the first thing you need to do is select the data package. The packages are based on the business concepts. The recently used packages appear first, followed by the list of all available data packages. You can scroll through the list of recently used data packages. Packages can also be accessed by selecting one of the blue folders. Each report can contain data from only one package.

© SunGard 2010 Advanced Cognos Reporting Page 26
Step 2 - Selecting the report format
Report Studio provides an empty layout based on the type of report you select. You can start from scratch with a blank report, or choose some pre-existing report formats such as list, crosstab, chart, map, or financial. The Repeater Table format is used when you want to repeat fields in multiple repeating tables such as mailing labels.
A crosstab report displays a lot of information in a compact area. You can switch the rows and columns to see which way fit onto the screen better. If you know that you want to display the data in a crosstab report, you can select the Crosstab format here and then easily insert the data into the rows and columns.
Note: If you select the List format, you can change the report format to Crosstab manually later; however you cannot change a Crosstab report to a list report.
Report format selection window

© SunGard 2010 Advanced Cognos Reporting Page 27
Steps
Steps to follow:
1. From Cognos Connection, click the Launch link in the top toolbar.
2. Select Report Studio.
3. In the Recently used packages field, select the Person Demographic package.
Note: You may need to wait while the Report Studio is initializing. You can also select the package by clicking the blue Person Demographic folder.
4. Click the Create a New Report or Template link.
5. Select a report style.
6. Click the OK button.

© SunGard 2010 Advanced Cognos Reporting Page 28
Opening a New Report from Report Studio
Introduction
When you are ready to open a new report in Report Studio, you can open a new report by clicking the New icon on the toolbar or selecting New from the File menu. By default, the new report will use the same data package as the current one.
New icon
Steps
Follow these steps to open a new report.
1. From Report Studio, click the New icon.
2. Select the type of report you want to open.
3. Click the OK button.

© SunGard 2010 Advanced Cognos Reporting Page 29
Working with Report Contents
Section goal
The goal of this section is to provide the knowledge and practice to work with report contents in list, crosstab, and chart formats.
Objectives
In this section you will learn how to:
add row numbers
add record counts
use aggregates
perform a query calculation
add a singleton
insert multiple items into a single column.

© SunGard 2010 Advanced Cognos Reporting Page 30
Adding Row Numbers
Introduction
You can add row numbers to a report by dragging the Row Number object from the Insertable Objects pane to the left of the first column on the report. When you run the report, the Row Number column will sequentially number each row in the report.
Row Number object
Steps
Follow these steps to create a simple list report and add row numbers.
1. From Cognos Connection, click the Launch link in the top toolbar.
2. Select Report Studio.
3. In the Recently used packages field, select the Person Demographic package.
Note: You may need to wait while the Report Studio is initializing. You can also select the package by clicking the blue Person Demographic folder.
4. Click the Create a New Report or Template link.

© SunGard 2010 Advanced Cognos Reporting Page 31
5. Select a report style.
Note: For this exercise, select the List report.
6. Click the OK button.
7. Expand the Person Demographic package by clicking on the plus icon.
8. Expand the Address Preferred query subject by clicking on the plus icon.
9. Double-click the STATE_PROVINCE query item to add it to the report.
10. Expand the Person Detail query subject by clicking on the plus icon.
11. Double-click the GENDER query item to add it to the report.
12. Double-click the PERSON_UID query item to add it to the report.
13. Double-click the ID query item to add it to the report.
Best Practice: Use the PERSON_UID or ENTITY_UID rather than the ID query item. The ID query item is the Banner ID and may contain duplicates. The PERSON_UID which is the PIDM will not contain duplicates. If you are certain your Banner IDs do not contain duplicates, you can use the ID query item.
14. From an open report in Report Studio, click the Toolbox tab of the Insertable Objects pane.
15. Scroll to the Row Number object.
16. Drag the Row Number object to the left of the first column on the report.
17. Click the Run Report icon to preview the report.
18. Click the Bottom link.

© SunGard 2010 Advanced Cognos Reporting Page 32
Notice that the Row Number column displays how many rows are included in the report.
19. Close the Report Preview window to return to Report Studio.

© SunGard 2010 Advanced Cognos Reporting Page 33
Adding Record Counts
Introduction
A Row Number will display the total number of rows of records that are included in a report. If you want to count the total number of unique or distinct records and not include any duplicates, you can use the Aggregate function to count the distinct number of records.
If you highlight the data column for ID and click the Aggregate icon, by default, it will count the total number of IDs in the report. However, some IDs may have multiple records such as addresses in multiple states, such as a temporary, billing, or permanent address. If you wanted to count each person only once even though they might have multiple addresses, you would use the Count Distinct option in the Aggregate Function field and the Total option in the Rollup Aggregate Function field.
Properties pane

© SunGard 2010 Advanced Cognos Reporting Page 34
Steps
Follow these steps to add a distinct record count to a report.
1. From an open report in Report Studio, click in the column body of the data item you want to count.
For this example, click in the ID column body.
2. Click the Aggregate icon on the toolbar.
3. Scroll through the Properties pane and click the Aggregate Function field.
4. Select Count Distinct from the Aggregate Function drop-down list.
Notice that the Rollup Aggregate Function field was set to “Count” when you clicked the Aggregate icon.
5. Click the Run Report icon to preview the report.
6. Click the Bottom link.
Notice that the Row Number displays column how many rows are included in the report.
7. Close the Report Preview window to return to Report Studio.

© SunGard 2010 Advanced Cognos Reporting Page 35
Using Aggregates
Introduction
An aggregate is a type of summary. You can summarize data in multiple ways such as a total, count (which counts each row or item each time it appears), count distinct (which counts an item only if it is the first time it appears but not subsequent), minimum, maximum, median, etc... You can perform aggregate summaries automatically using the Aggregate icon or manually using the Properties pane.
Using the Aggregate icon
When you use the Aggregate icon, you can select the type of aggregation you want to apply. When you click the small arrow next to the Aggregate icon, you can choose an aggregation option from the list.
If you have grouped data in your report, clicking the Aggregate icon create a summary row for each data group. If you want to remove a summary row, click in the gray summary row and click the Delete key on your keyboard.

© SunGard 2010 Advanced Cognos Reporting Page 36
Using the Properties pane
In the Properties pane, you can use the Aggregate Function and Rollup Aggregate Function fields to create an aggregate summary. In the Aggregate Function field you can select how you want to calculate the value. In the Rollup Aggregate Function field, you have similar choices.
Steps
Follow these steps to group two columns of data in a report and apply aggregate summary rows.
1. From an open Report Studio report, click in the data column you want to group.
Note: For this exercise, select the STATE_PROVINCE column body.
2. Click the Group icon on the toolbar.
3. Click in the second data column you want to group.
Note: For this exercise, select the GENDER column body.
4. Click the Group icon on the toolbar.

© SunGard 2010 Advanced Cognos Reporting Page 37
5. Click the Aggregate icon on the toolbar.
Notice that a Summary row for STATE_PROVINCE and GENDER displays on the report.
6. Click the Run Report icon to preview the report.
7. Click the Bottom link to view the total number of IDs by gender and state/province in the report.
Note: You may need to scroll to the end of the report.
8. Close the report preview window.
9. Note: If you did not want to show the sub-totals by gender, you can click on the gray GENDER sub-total line and click the Delete key on your keyboard to remove it. The result would look like the example shown below. Notice that the STATE_PROVINCE summary row was not deleted.

© SunGard 2010 Advanced Cognos Reporting Page 38
Adding a Singleton
Introduction
A singleton is a flexible placeholder where you can display data such as a record count. This is helpful if you want to display summary information on the first page of the report instead of having to scroll through the report to find the summary data.
For example, you may want to count the total number of records in the database. You could find the total by clicking the Bottom link and going to the bottom of the report to view the total. Or you could add a singleton which displays the total on the first page of the report.
You can add a singleton from the Toolbox tab of the Insertable Objects pane. When you drag the Singleton object to the report, a new query will be created by default. You can modify the query or select an existing query in the Query field of the Properties pane.
Only the value will display in the Singleton field. If you want, you can add a label or text box to describe what data is being displayed by the singleton.
A Singleton placeholder

© SunGard 2010 Advanced Cognos Reporting Page 39
Steps
Follow these steps to add a singleton to a report under the report title.
1. From an open Report Studio report, click the Toolbox tab.
2. Drag the Singleton item to the right of the report title so that it will display directly under the title.
3. Drag the Text Item to the left of the singleton to add a label or description of the singleton.
4. Enter a label or description in the Text field.
5. Note: For this exercise, type Total: in the Text field.
6. Click the OK button.
7. Click the Source tab.
8. Expand the Person Detail query subject by clicking on the plus icon.
9. Drag the ID query item to singleton placeholder.
10. Click on the ID singleton.
11. Click the arrow on the Properties pane title bar, select Singleton.

© SunGard 2010 Advanced Cognos Reporting Page 40
12. Click in the Query field.
Notice that a new Query is automatically created when a new singleton is added to the report. In this example, you will change the default Query 2 to Query 1.
13. Use the Query drop-down arrow to select Query 1.
14. Click the Run Report icon to preview the report.
15. Notice the ID total at the top of the report.
16. Click the Bottom link.
17. Notice the ID total at the bottom of the report.
18. Close the report preview window.

© SunGard 2010 Advanced Cognos Reporting Page 41
Performing a Query Calculation
Introduction
Use the Query Calculation icon to insert a mathematic function to the measurable data such as add, subtract, multiply, divide, round, percentage, minimize, maximum among others.
For example, if you wanted to find the full time equivalent (FTE) for a student, you could divide a calculated column value (such as current credit hours) by a specific number such as 15. If you wanted to find the average number of IDs from each state, you could do a query calculation that divides the ID total by 50 (for the 50 states).
Mathematic symbols
When creating a query calculation the following symbols are used to represent common mathematical functions:
Add + Subtract –
Multiply * Divide /
Steps
Follow these steps to perform a query calculation. In this example, you will create a query calculation that divides the ID total by 50 (for the 50 states).
1. From Report Studio, click the New icon.
2. Select a report style.
Note: For this exercise, select the List report.
3. Click the OK button.
4. Expand the Person Demographic package by clicking on the plus icon.
5. Expand the Address Preferred query subject by clicking on the plus icon.
6. Double-click the STATE_PROVINCE query item to add it to the report.
7. Click in the data column you want to group.

© SunGard 2010 Advanced Cognos Reporting Page 42
Note: For this exercise, select the STATE_PROVINCE column body.
8. Click the Group icon on the toolbar.
9. Expand the Person Detail query subject by clicking on the plus icon.
10. Double-click the ID query item to add it to the report.
11. Click in the column body of the data item you want to count.
For this example, click in the ID column body.
12. Scroll through the Properties pane and click the Aggregate Function field.
13. Select Count Distinct from the Aggregate Function drop-down list.
14. Select Total from Rollup Aggregate Function drop down list.
15. Click the Toolbox tab of the Insertable Objects pane.
16. Drag the Query Calculation item onto the report.
Note: Drag the Query Calculation item to after ID.
17. Enter a name for the calculation in the Create Query Name field.
Note: For this exercise, type Average per state in the Name field.
18. Click the OK button.
19. Click the Queries tab in the Data Item Expression window.
20. Double-click the ID query item to add it to the expression.
21. Type “/Count(disintct [STATE_PROVINCE]for report)” without the quotes to say divide the total number of IDs by total number of states.

© SunGard 2010 Advanced Cognos Reporting Page 43
Concatenating Data
Introduction
You can add multiple query items to a single column by concatenating the data. To concatenate items, you must use the Query Calculation item from the Toolbox tab. Within the Query Calculation, you can name the column and then add query items. To add query items, you can drag to the Expression Definition field. The Expression Definition field should be continuous. Use double straight lines to separate query items or text items like commas and spaces. Text items should be enclosed in single-quotes. For example, a comma and space would look like ||', '|| with the quotation marks in the middle as single-quotes surrounded by double straight lines.
In this example you will concatenate the LAST_NAME and FIRST_NAME query items into a single column called “Name” which will display the name like this: Last Name, First Name.
Adding data to the column

© SunGard 2010 Advanced Cognos Reporting Page 44
Steps
Follow these steps to concatenate data to create a name column.
1. From Report Studio, click the New icon.
2. Select a report style.
Note: For this exercise, select the List report.
3. Click the OK button.
4. Expand the Person Demographic package by clicking on the plus icon.
5. Expand the Person Detail query subject by clicking on the plus icon.
6. Double-click the ID query item to add it to the report.
7. Click the Toolbox tab of the Insertable Objects pane.
8. Drag the Query Calculation item onto the report.
Note: Drag the Query Calculation item to after ID.
9. Enter a name for the new column in the Name field.
10. Click the OK button.
11. Expand the Person Demographic package.
12. Expand the Person Detail query subject by clicking the plus icon.
13. Drag the LAST_NAME query item to the Expression Definition field.
14. After the LAST_NAME query item, type double straight lines to separate query items.
15. Type a single quote, then add a comma and a space followed by a second set of double-straight lines. It should look like ||', '|| with the quotation marks in the middle as single-quotes surrounded by double straight lines.
16. Drag the FIRST_NAME query item to the Expression Definition field immediately after the double-straight lines.
17. Note: The Expression Definition field should read: [Person Demographic].[Person Detail].[LAST_NAME]||', '||[Person Demographic].[Person Detail].[FIRST_NAME]. By dragging the two query item names, you only need to type the syntax in the middle that separates the two query items.

© SunGard 2010 Advanced Cognos Reporting Page 45
18. Click the OK button.
19. Click the Run Report icon to preview the report.
20. Close the report preview window.

© SunGard 2010 Advanced Cognos Reporting Page 46
Inserting Multiple Items into a Single Column
Introduction
You can also insert multiple items into a single column by unlocking the column. Be default, when you add query items to a report, the data is locked. You can use the Lock/Unlock icon on the toolbar to unlock the data. Once the data column is unlocked, you can add multiple query items into the same column. If you want to separate the data items with spaces, you will need to manually enter a text box into the column that contains a blank space.
Spaces between query items
Within each individual column, you may also want to include spaces or commas to separate the query items. For example, adding a comma and a space between the last name and first name. In order to add spaces, you must use the Toolbox tab and insert a Text Item next to the query item where you want the space or comma to display. Type either a comma or a space (or both) in the Text field, then press OK. The next query item will begin after the comma and space.

© SunGard 2010 Advanced Cognos Reporting Page 47
Changing a column name
If you want to change a column name that you unlocked, you can use the Properties pane to change the Source Type field to Text and then use the Text field to rename the column.
Steps
Follow these steps to insert multiple items into a single column.
1. From Report Studio, click the New icon to start a new report.
2. Select a report style.
Note: For this exercise, select the List report.
3. Click the OK button.
4. Expand the Person Demographic package by clicking on the plus icon.
5. Expand the Person Detail query subject by clicking on the plus icon.
6. Double-click the ID query item to add it to the report.
7. Double-click the LAST_NAME query item to add it to the report.
8. Click in the LAST_NAME column body.
9. Click the Lock/Unlock icon on the toolbar to unlock the Last Name field.
10. Click the Toolbox tab of the Insertable Objects pane.
11. Click the Toolbox tab to add a text box after the LAST_NAME item.

© SunGard 2010 Advanced Cognos Reporting Page 48
12. Drag the Text Item next to the query item where you want the space or comma to display.
13. Type a comma and a space in the Text field, then press OK. The next query item will begin after the comma and space.
14. Click the Source tab to add another query items to the unlocked column.
15. From the Insertable Objects pane, drag the FIRST_NAME item to the right of text field containing the comma. Once you see a blinking vertical black line release your mouse and the Query Item will be inserted.
16. Click in the LAST_NAME column header.
17. In the Properties pane, change the Source Type to Text.

© SunGard 2010 Advanced Cognos Reporting Page 49
18. Click in the Text field.
19. Click the ellipse icon (three dots) to open the Text field.
20. Type a name for the column in the Text field.
21. Click the OK button.
22. Click the Lock/Unlock icon on the toolbar to lock all fields in this and subsequent reports.
23. Click the Run Report icon to preview the report.
24. Close the report preview window.

© SunGard 2010 Advanced Cognos Reporting Page 50
Working with Filters
Section goal
The goal of this section is to provide the knowledge and practice to create filters.
Objectives
In this section you will learn how to:
create a filter
use before/after auto aggregation
create a filter using a Look Up Value (LOV).

© SunGard 2010 Advanced Cognos Reporting Page 51
Adding Filters to a Report
Introduction
You can use the Filter icon to add a filter to your report. The Filter icon opens the Filter Query 1 window. Click the Add icon to open the Detail Filter Expression window where you can build your filter. As you select the items you want to filter, add the filter operator (such as less than, equals, etc...) and select the values, the Expression Definition field shows the current expression for the filter you are building.
For example, in this training database, when you ran the report you created there are two columns of data that are displaying that you do not want to display. There is a column for gender called “N” for not known and a blank column that contains missing data or null data. You can use a filter to exclude these results.
Notes: The report does not show which filters have been applied. You can delete the column once you have added a filter without deleting the filter itself.
Detail Filter Expression window

© SunGard 2010 Advanced Cognos Reporting Page 52
Steps
Steps to follow to add a filter to a report based on excluding a specific value:
1. From Report Studio, click the New icon to start a new report.
2. Select a report style.
Note: For this exercise, select the Crosstab report.
3. Click the OK button.
4. From the Insertable Objects pane, expand the Person Demographic package by clicking on the plus icon.
5. Expand the Person query subject by clicking on the plus icon.
6. Double-click the NATION_DESC query item. You will note this puts the NATION_DESC Item in a row not a column, this Query Item can be moved to the columns of the crosstab, but for this exercise please leave as a row.
7. Scroll up and drag the STATE_PROVINCE item to the Rows container just to the right of NATION_DESC. Once you see a blinking vertical black line release your mouse and the Query Item will be inserted.
8. Scroll up and drag the GENDER query item to the Columns container.
9. Scroll down and drag the ADDRESS_COUNT measure to the Measures container.

© SunGard 2010 Advanced Cognos Reporting Page 53
10. Click the Run Report icon to preview the report.
Notice that there are four columns for gender: F (female), M (male), blank (missing or null data), and N for not known. You can use a filter to exclude the missing or not known data if desired.
11. Click the Close [X] icon in the upper-right corner of the browser window to return to Report Studio.
12. Click in the Gender column in the Report work area.
13. Click the Filter icon.
14. Click the Add icon.
15. Expand the Person query subject.
16. Double-click the GENDER item.
17. Enter a does not equals sign ( <> ) in the Expression Definition field.
18. Click the Select Value icon above the Expression Definition field.
19. Select N from the list or whatever code your institution uses for unknown gender.
Note: You may need to use the page down arrows to find the correct value. If you know the value you want to add, you can also enter it into the expression

© SunGard 2010 Advanced Cognos Reporting Page 54
using single quotes.
20. Click the Insert button and leave the Usage set at Required and the Application set at Before auto aggregation.
21. Click the OK button.
22. Click the OK button again.
23. Note: You can click the Delete icon to remove the column. The filter is not deleted, just the column. You can see this by clicking on the filter icon again.
24. Click the Run Report icon to preview the report.
25. Click the Close [X] icon in the upper-right corner of the browser window to return to Report Studio.
26. Click the Save icon on the toolbar
Steps
Steps to follow to add a filter to a report to exclude missing data:
1. With the report open that you just created in the previous exercise, click in the Gender column in the Report work area.
2. Click the Filter icon.
3. Click the Add icon.
4. Expand the Person query subject.
5. Double-click the GENDER item.
6. Click the Functions tab.
7. Expand the Operators folder.
8. Scroll down and double-click the is not missing operator.
9. Click the OK button.
10. Click the OK button again.
Note: You can click the Delete icon to remove the column. The filter is not deleted, just the column. You can see this by clicking on the filter icon again.
11. Click the Run Report icon to preview the report.
Notice that there only two gender columns: F (female) and M (male).

© SunGard 2010 Advanced Cognos Reporting Page 55
12. Click the Close [X] icon in the upper-right corner of the browser window to return to Report Studio.
13. Click the Save icon on the toolbar
Steps
In this example, you want to create a filter that only selects data from a specific nation. Steps to follow to add a filter to a report to include only selected data:
1. With the report open that you just created in the previous exercise, click in the NATION_DESC column in the Report work area.
2. Click the Filter icon.
3. Click the Add icon.
4. Expand the Person query subject.
5. Double-click the NATION_DESC item.
6. Enter an equals sign ( = ) in the Expression Definition field.
7. Click the Select Value icon above the Expression Definition field.
8. Select United States of America from the list or whatever nation you want to select.
Note: You may need to use the page down arrows to find the correct value. If you know the value you want to add, you can also enter it into the expression

© SunGard 2010 Advanced Cognos Reporting Page 56
using single quotes.
9. Click the Insert button and leave the Usage set at Required and the Application set at Before auto aggregation.
10. Click the OK button.
Notice that the specific value you want to include is enclosed by single quotes.
11. Click the OK button again.
Note: You can click the Delete icon to remove the column. The filter is not deleted, just the column. You can see this by clicking on the filter icon again.
12. Click the Run Report icon to preview the report.
Notice that there only two gender columns: F (female) and M (male) and that the United States of America is the only nation selected.
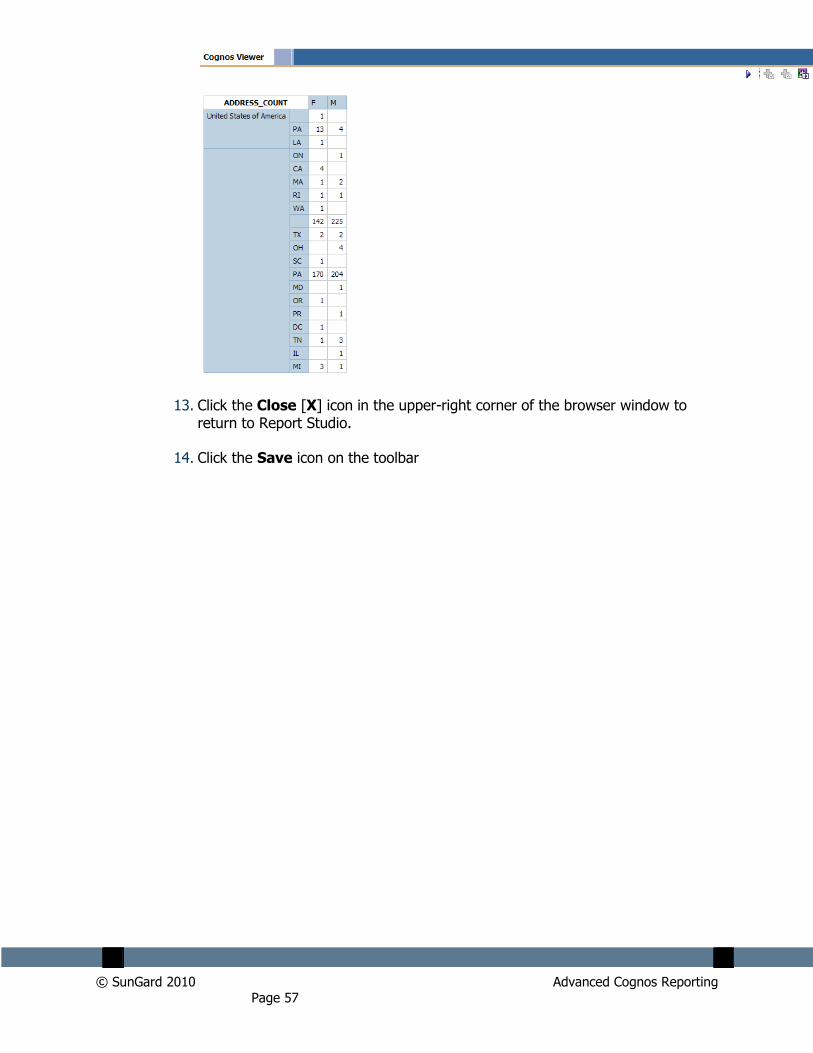
© SunGard 2010 Advanced Cognos Reporting Page 57
13. Click the Close [X] icon in the upper-right corner of the browser window to return to Report Studio.
14. Click the Save icon on the toolbar

© SunGard 2010 Advanced Cognos Reporting Page 58
Using Before/After Auto Aggregation
Introduction
You can control when the calculation is made in a filter by using the Before Auto Aggregation or After Auto Aggregation radio boxes.
Before Auto Aggregation
By default, the filter is applied BEFORE auto aggregation is applied. This means that if you were sorting the data by a value such as the number of credit hours a student is taking, the records were be added to the report if they met the criteria prior to the summary aggregation being applied.
For example: If you wanted to filter students based on full-time credit hours of 15 total hours, all students who had less than 15 credits would be excluded. If you are using the Before Auto Aggregation option, each record that student has would be excluded if under 15 credit hours even if the student had six records of 3 credits each for a semester.
© SunGard 2010 Advanced Cognos Reporting Page 59
After Auto Aggregation
After auto aggregation means that the filter would be applied after all records are added to the report and the total was calculated. The filter would then apply to the total (after aggregation has occurred).
For example: The filter for full time students would be applied after all six records are added to the report and the total credit hours were calculated.

© SunGard 2010 Advanced Cognos Reporting Page 60
Adding a Filter Prompt to a Report
Introduction
A prompt is a filter that the person running the report selects when the report is run. The advantage of using a prompt instead of a set filter value is that the report can be created once but used for multiple years or for multiple types of data such as selecting nations or states/provinces.
Example
In the previous exercise, you created a filter to select the nation „United States of America‟. This report would need to be modified for any other nation. Instead of updating the report for a new nation, you can use the Filter icon to add a filter that prompts the person running the report for the nation so that the report can be used for many nations without needing to be updated. You could also add a filter that selects one or more states or provinces when the report is run. This provides greater flexibility in selecting which data is displayed when the report is run.

© SunGard 2010 Advanced Cognos Reporting Page 61

© SunGard 2010 Advanced Cognos Reporting Page 62
Creating the prompt
The difference between a regular filter and a prompt filter is how the expression is written. In a regular filter, you enter a specific value such as „United States of America‟ enclosed in single quotes. To create a prompt, the value would be the name of the data item such as ?NATION_DESC? enclosed in question marks.
Detail Filter Expression window
Notice that the expression will prompt the person running the report for a value because the data item ?NATION_DESC? is enclosed in question marks.
Note: Use the equal ( = ) operator if you want the user to enter a single value in the prompt or use the word „in‟ if you want the user to be able to select multiple values in a list of values.

© SunGard 2010 Advanced Cognos Reporting Page 63
Steps
Follow these steps to convert an existing filter to a prompt.
1. With the report open in design mode that you just created in the previous exercise, click in the NATION_DESC column in the Report work area.
Note: If you are working with an existing delivered report, you will need to make a copy of the report.
2. Click the Filter icon.
3. Highlight the filter that you already created that you want to convert to a prompt.
4. Click the Edit icon.
5. Delete ‘United States of America’ at the end of the expression.
6. Add ?NATION_DESC? to the end of the expression.
7. Click the OK button.
8. Click the OK button again.
9. Click the Run Report icon to preview the report and view the prompt page.

© SunGard 2010 Advanced Cognos Reporting Page 64
10. Select a nation in the NATION_DESC prompt field.
11. Click the OK button.
12. Click the Close [X] icon in the upper-right corner of the browser window to return to Report Studio.
13. Since you no longer need the NATION_DESC column, you can delete the column from the report without deleting the filter. Click in the NATION_DESC column, then click the Delete icon.
14. Click the Save icon on the toolbar.
15. Click the Run Report icon to rerun the report and view the prompt page.
16. Select a nation in the NATION_DESC prompt field.
17. Click the OK button.
Notice that deleting the NATION_DESC column did not delete the prompt/filter from the report.
18. Click the Close [X] icon in the upper-right corner of the browser window to return to Report Studio.

© SunGard 2010 Advanced Cognos Reporting Page 65
Steps
In this exercise, you will add a new prompt to select multiple states/provinces.
Follow these steps to add a multiple entry prompt.
1. With the report open in design mode that you just created in the previous exercise, click in the STATE_PROVINCE row in the Report work area.
2. Click the Filter icon.
3. Click the Add icon.
4. Expand the Person query subject.
5. Double-click the STATE_PROVINCE item.
6. Enter the word in to select multiple values in the Expression Definition field.
7. Add ?STATE_PROVINCE? to the end of the expression.
8. Click the OK button.
9. Click the OK button again.
10. Click the Save icon.
11. Click the Run Report icon to preview the report and view the prompt page.

© SunGard 2010 Advanced Cognos Reporting Page 66
12. Select a nation in the NATION_DESC prompt field.
13. Click the Select All link below the STATE_PROVINCE prompt field.
Note: You can select a single state/province by clicking on it or you can select several by holding down the Ctrl key on your keyboard while selecting multiple states/provinces.
14. Click the OK button.
15. Click the Close [X] icon in the upper-right corner of the browser window to return to Report Studio.

© SunGard 2010 Advanced Cognos Reporting Page 67
Working with Prompts and Prompt
Pages
Section goal
The goal of this section is to provide the knowledge and practice to create prompts and prompt pages.
Objectives
In this section you will learn how to:
build a prompt page
add a prompt to a report page
format a prompt page
add a text box prompt
add a value prompt
add a select and search prompt
add a date prompt
add end user instructions
add error messages.

© SunGard 2010 Advanced Cognos Reporting Page 68
Building and Formatting a Prompt Page
Introduction
A prompt is a type of filter that the person running the report selects when the report is run. The advantage of using a prompt instead of a set filter value is that the report can be created once but used for multiple years or for multiple types of data such as selecting nations or states/provinces.
In the previous lesson you learned how to create a filter that prompts a user for a value. This type of filter uses a default Prompt page like the one shown below.

© SunGard 2010 Advanced Cognos Reporting Page 69
This format may or may not match the rest of your report and does not contain descriptive text or instructions. You can build your own prompt page and add prompts to it using the Prompt options available on the bottom of the Toolbox tab of the Insertable Objects pane.

© SunGard 2010 Advanced Cognos Reporting Page 70
Creating a prompt page from an icon
You can create a prompt page using one of two methods. The first is to select a column body of a value you want to add a prompt to and then click the Build a Prompt Page icon
.
Building a prompt page
The second method is to build your own prompt page using the Page Explorer bar and selecting the Prompt Pages folder.

© SunGard 2010 Advanced Cognos Reporting Page 71
Once you‟ve selected Prompt Pages, you can see a default blank prompt page. To start to create a prompt page, you can add a Page item from the Insertable Objects pane. You can then add a table to hold the text labels and prompts that you will create.
Steps
Follow these steps to create a new report and build a prompt page using the icon.
1. From an open Cognos Report Studio report, click the New icon.
2. Select a report style.
Note: For this exercise, select the List report.
3. Click the OK button.
4. Expand the Person Demographic package by clicking on the plus icon.
5. Expand the Person Detail query subject by clicking on the plus icon.
6. Double-click the ID query item to add it to the report.
7. Scroll down and double-click the MAILING_NAME_PREFERRED query item to add it to the report.
8. Scroll down and double-click the GENDER query item to add it to the report.

© SunGard 2010 Advanced Cognos Reporting Page 72
9. Click in the GENDER column body.
10. Click the Build Prompt Page icon.
Notice that a new prompt page with a gender prompt is built.
11. Click the Run Report icon to preview the prompt page and report.
12. Select a gender from the available list.
13. Click the Finish button.
14. Click the Close [X] icon in the upper-right corner of the browser window to return to Report Studio.
Steps
Follow these steps to create a new report and build a prompt page manually.
1. From an open Cognos Report Studio report, click the New icon.
2. Select a report style.
Note: For this exercise, select the List report.
3. Click the OK button.
4. Expand the Person Demographic package by clicking on the plus icon.
5. Expand the Person Detail query subject by clicking on the plus icon.

© SunGard 2010 Advanced Cognos Reporting Page 73
6. Double-click the ID query item to add it to the report.
7. Scroll down and double-click the MAILING_NAME_PREFERRED query item to add it to the report.
8. Scroll down and double-click the GENDER query item to add it to the report.
9. Double-click the GENDER_DESC query item to add it to the report
10. Expand the Address Preferred query subject by clicking on the plus icon.
11. Double-click the STATE_PROVINCE query item to add it to the report.
12. With your mouse, point to the Page Explorer bar, then click on the Prompt Pages link.
Notice that the Prompt Page is blank.
13. Drag the Page item from the Insertable Objects pane onto the blank Prompt page.

© SunGard 2010 Advanced Cognos Reporting Page 74
14. Double-click on the new prompt page you just created to open it.
Notice that the title, header, and footer information is included as a part of the default Prompt Page.
15. From the Toolbox tab of the Insertable Objects pane, drag the Table object to the report work area.
16. Enter the total number of columns and rows you will need to build your prompt page.
Note: For this example, enter 2 columns and 3 rows.
17. Click the OK button.
Note: In the next lesson, you will add a prompt into one of the rows of the table.

© SunGard 2010 Advanced Cognos Reporting Page 75
Adding a Value Prompt to a Report
Introduction
If you add a filter to a report using the Filter icon, it will not be added to the prompt page. Instead, you need to navigate to the Prompt page and add a Text Item to use as a label for the prompt and use the Values Prompt. By adding a Values Prompt to the prompt page of the report, a wizard will open which will walk you through the steps for creating a prompt.
Steps
Follow these steps to add a prompt to a report using a prompt page. In the previous lesson, you created a blank prompt page. In this lesson you will add prompts to the prompt page.
1. To access the prompt page, place the cursor over the Page Explorer bar and select Prompt Page 1 in the Prompt Pages folder.
Note: You should already have the Prompt Page 1 open from the previous lesson.
2. From the Insertable Objects pane, click the Toolbox tab.
3. Drag a Text Item over to the first column of the first row of the table you created in the previous exercise.
4. Enter Select a Gender: in the Text field.
5. Click the OK button.
6. To add a selection prompt, scroll through the list and drag a Value Prompt over to the second column of the first row of the table.

© SunGard 2010 Advanced Cognos Reporting Page 76
7. Use the wizard to enter the prompt information.
8. Change the default name Parameter 1 to the column name of the prompt you want to create and click the Next button.
Note: For this example, replace “Parameter 1” with “Gender”
9. Click the ellipse icon next to the Package Item field.

© SunGard 2010 Advanced Cognos Reporting Page 77
10. Expand the query subject that contains the query item for which you want to prompt.
Note: In this training example, expand the Person Detail query subject, scroll to GENDER query item.
11. Click the query item (GENDER) for which you want to prompt.
12. Click the OK button.
13. Click the Next button.
14. On the Populate control window of the Prompt Wizard, change the default name of Query2 to the column name followed by the word prompt.
Note: In this example, change “Query2” to “Gender Prompt”

© SunGard 2010 Advanced Cognos Reporting Page 78
15. Click the ellipse icon next to the Values to display field.
Note: The Values to use field is the actual values the report will filter based on what the end user selects. However, since the values used in the filters are often the codes which the end user may not be familiar with, you can use the corresponding description query items as the ones to display to the end user when selecting a value.

© SunGard 2010 Advanced Cognos Reporting Page 79
16. Expand the query subject that contains the query item for which you want to prompt.
Note: In this training example, expand the Person Detail query subject, scroll to GENDER_DESC query item.
17. Click the query item (GENDER_DESC) for which you want to prompt.
18. Click the OK button.
19. Click the Finish button.
20. Click the Save icon and save the report.
21. Click the Run Report icon to preview the prompt page and report.
22. Select a gender from the available list.
23. Click the Finish button.
24. Click the Close [X] icon in the upper-right corner of the browser window to return to Report Studio.

© SunGard 2010 Advanced Cognos Reporting Page 80
Creating a Prompt Using a Look Up Value
Introduction
By default, when you create a filter the data selection choices for the filter are based on the data within your database. For example, if you want to filter data based on STATE_PROVINCE and there are only three states – New York, Pennsylvania, and New Jersey in the database, then only those three states will appear in the drop-down list for the filter. If you wanted ALL the values in the STATE_PROVINCE validation table to appear regardless of whether you have data in the database for those states/provinces, you could create a filter using a look up value. The look up values are the values in the Banner validation tables. In this example, the filter would allow you to select any of the 50 United States in America or any of the Canadian provinces because those values are in the STATE_PROVINCE validation table.
Creating a prompt using a Look Up Value or List of Values
(LOV)
The difference between creating a regular Values prompt and a List of Values Prompt is selecting the query item from the List of Values query subject. Notice in this example that above the Person Demo

© SunGard 2010 Advanced Cognos Reporting Page 81

© SunGard 2010 Advanced Cognos Reporting Page 82
Steps
Follow these steps to add a prompt to a report using a prompt page. In the previous lesson, you created a blank prompt page and added a values prompt. In this lesson you will add another values prompt that displays all values in a List of Values (LOV) for State and Province.
1. To access the prompt page, place the cursor over the Page Explorer bar and select Prompt Page 1 in the Prompt Pages folder.
Note: You should already have the Prompt Page 1 open from the previous lesson.
2. From the Insertable Objects pane, click the Toolbox tab.
3. Drag a Text Item over to the first column of the second row of the table you created in the previous exercise.
4. Enter Select a State (LOV): in the Text field.
5. Click the OK button.
6. To add a selection prompt, scroll through the list and drag a Value Prompt over to the second column of the second row of the table.
7. Use the wizard to enter the prompt information.

© SunGard 2010 Advanced Cognos Reporting Page 83
8. Change the default name Parameter 1 to the column name of the prompt you want to create and click the Next button.
Note: For this example, replace “Parameter 1” with “State Province LOV”
9. Click the ellipse icon next to the Package Item field.
10. Expand the List of Values query subjects that contains the query item for which you want to prompt.

© SunGard 2010 Advanced Cognos Reporting Page 84
Note: In this training example, expand the List of Values query subject, scroll to State Province LOV query item.
11. Click the VALUE query item for State Province LOV.
12. Click the OK button.
13. Click the Next button.
14. On the Apply Filter window of the Prompt Wizard, accept the default Query1.

© SunGard 2010 Advanced Cognos Reporting Page 85
15. Click the Next button.

© SunGard 2010 Advanced Cognos Reporting Page 86
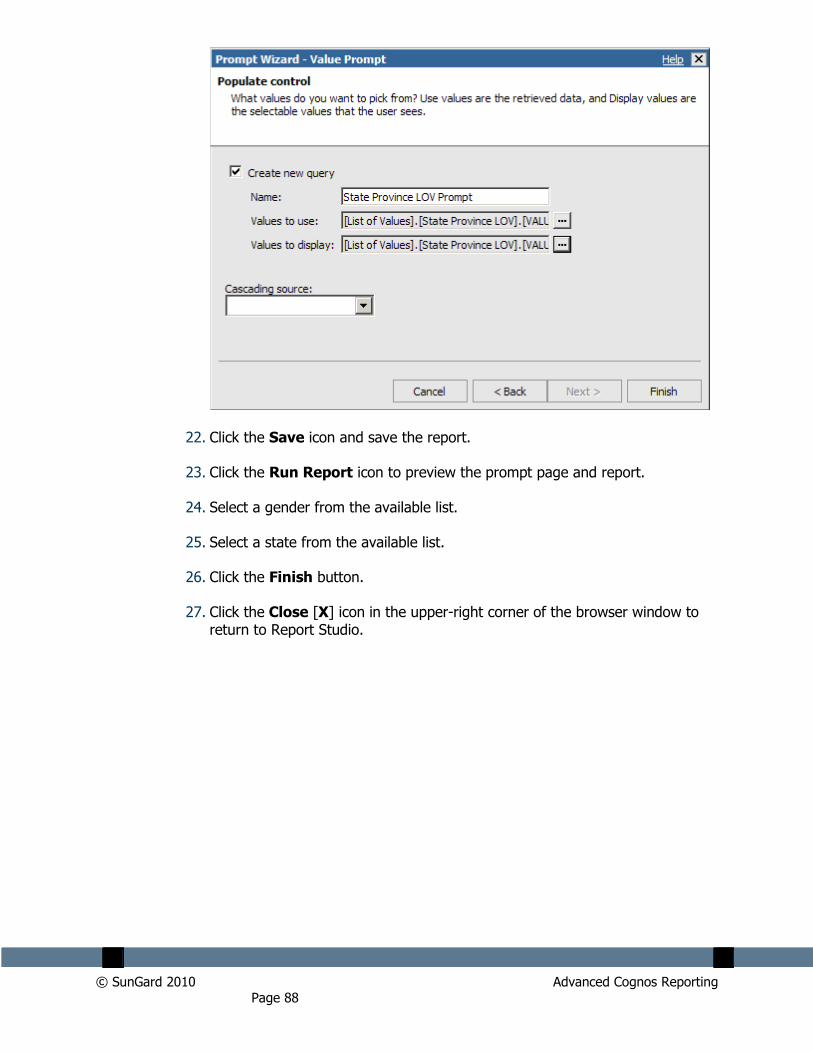
16. On Populate control window of the Prompt Wizard, change the default name of Query2 to the column name followed by the word prompt.
Note: In this example, change “Query2” to “State Province LOV Prompt”
17. Click the ellipse icon next to the Values to display field.
Note: The Values to use field is the actual values the report will filter based on what the end user selects. However, since the values used in the filters are often the codes which the end user may not be familiar with, you can use the corresponding description query items as the ones to display to the end user when selecting a value.

© SunGard 2010 Advanced Cognos Reporting Page 87
18. Expand the List of Values query subject that contains the query item for which you want to prompt.
Note: In this training example, expand the List of Values query subject, scroll to State Province LOV query item.
19. Click the query item (VALUE_DESC) for which you want to prompt.
20. Click the OK button.
21. Click the Finish button.
© SunGard 2010 Advanced Cognos Reporting Page 88
22. Click the Save icon and save the report.
23. Click the Run Report icon to preview the prompt page and report.
24. Select a gender from the available list.
25. Select a state from the available list.
26. Click the Finish button.
27. Click the Close [X] icon in the upper-right corner of the browser window to return to Report Studio.

© SunGard 2010 Advanced Cognos Reporting Page 89
Adding a Select and Search Prompt
Introduction
You can add a Select & Search prompt which allows the end user to search for values on the prompt page. For example, if you wanted the end user to enter a name on the prompt page, you could create a Select & Search prompt that allows the end user to enter full or partial names and use a built-in Search button to find matching criteria.
Select & Search prompt example
Steps
Follow these steps to add a Select & Search prompt to a report using a prompt page. In the previous lesson, you created a blank prompt page and added a values prompt. In this lesson you will add a Select & Search prompt to find a person by name.
1. To access the prompt page, place the cursor over the Page Explorer bar and select Prompt Page 1 in the Prompt Pages folder.
Note: You should already have the Prompt Page 1 open from the previous lesson.
2. From the Insertable Objects pane, click the Toolbox tab.

© SunGard 2010 Advanced Cognos Reporting Page 90
3. Drag a Text Item over to the first column of the third row of the table you created in the previous exercise.
4. Enter Select a Name in the Text field.
5. Click the OK button.
6. To add a selection prompt, scroll through the list and drag a Select & Search Prompt over to the second column of the third row of the table.
7. Use the wizard to enter the prompt information.
8. Change the default name Parameter 1 to the column name of the prompt you want to create and click the Next button.
Note: For this example, replace “Parameter 1” with “Name”

© SunGard 2010 Advanced Cognos Reporting Page 91
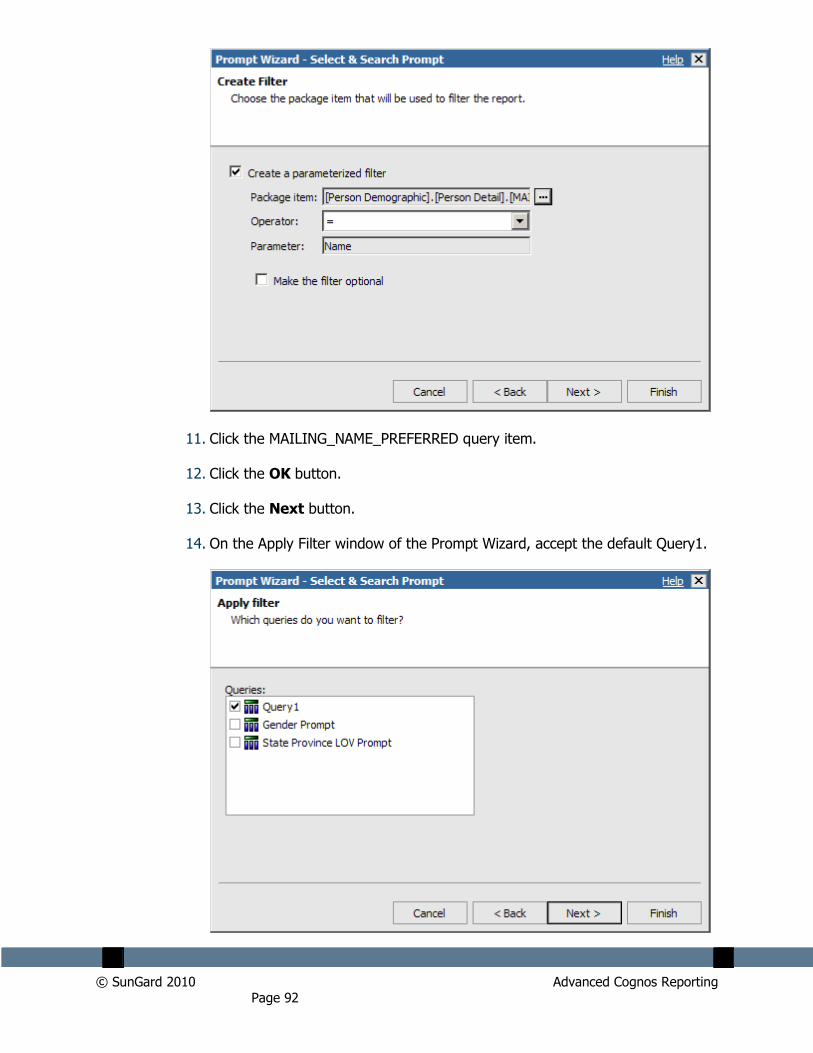
9. Click the ellipse icon next to the Package Item field.
10. Expand the query subjects that contains the query item for which you want to prompt.
Note: In this training example, expand the Person Demographic query subject, scroll to Person Detail query subject and the MAILING_NAME_PREFERRED query item.
© SunGard 2010 Advanced Cognos Reporting Page 92
11. Click the MAILING_NAME_PREFERRED query item.
12. Click the OK button.
13. Click the Next button.
14. On the Apply Filter window of the Prompt Wizard, accept the default Query1.
© SunGard 2010 Advanced Cognos Reporting Page 93
15. Click the Next button.

© SunGard 2010 Advanced Cognos Reporting Page 94
16. On Populate control window of the Prompt Wizard, change the default name of Query2 to the column name followed by the word prompt.
Note: In this example, change “Query2” to “Name Prompt”
Note: The Values to use field is the actual values the report will filter based on what the end user selects and is selected based on package item you already selected. The Values to display field is used when the values in the filters are codes which the end user may not be familiar with. You can use the corresponding description query items as the ones to display to the end user when selecting a value. Since you are creating a prompt to search by name, this field does not apply and can be left blank.
17. Click the Finish button.
18. Click the Save icon and save the report.
19. Click the Run Report icon to preview the prompt page and report.
20. Select a gender from the available list.
21. Select a state from the available list.
22. Click the Finish button.
23. Click the Close [X] icon in the upper-right corner of the browser window to return to Report Studio.

© SunGard 2010 Advanced Cognos Reporting Page 95

© SunGard 2010 Advanced Cognos Reporting Page 96
Adding a Text Box Prompt
Introduction
In a Values prompt, the end user is given a list of values to choose from. In a Text Box prompt, the end user must supply an appropriate value in a text box. If the end user knows the correct value, the report will run based on the prompt value entered. If the end user does not know the correct value, the report will not run. This type of prompt is used when the report writer wants to add another level of security into the report.
For example, a text box prompt might be used by Finance to filter a report based on a FOAPAL code. If the end user knows the appropriate FOAPAL accounting code, the report can be run. However, if the end user does not know the appropriate FOAPAL accounting code, they cannot just select a value from a list and run the report anyway.
Steps
Follow these steps to create a new report and build a prompt page manually and add a text prompt.
1. From an open Cognos Report Studio report, click the New icon.
2. Select a report style.
Note: For this exercise, select the List report.
3. Click the OK button.
4. Expand the Person Demographic package by clicking on the plus icon.
5. Expand the Person Detail query subject by clicking on the plus icon.
6. Double-click the ID query item to add it to the report.
7. Scroll down and double-click the MAILING_NAME_PREFERRED query item to add it to the report.
8. Scroll down and double-click the BIRTH_DATE query item to add it to the report.
9. Expand the Address Preferred query subject by clicking on the plus icon.
10. Double-click the STATE_PROVINCE query item to add it to the report.

© SunGard 2010 Advanced Cognos Reporting Page 97
11. With your mouse, point to the Page Explorer bar, then click on the Prompt Pages link.
12. Notice that the Prompt Page is blank.
13. Drag the Page item from the Insertable Objects pane onto the blank Prompt page.
14. Double-click on the new prompt page you just created to open it.
15. Notice that the title, header, and footer information is included as a part of the default Prompt Page.

© SunGard 2010 Advanced Cognos Reporting Page 98
16. From the Toolbox tab of the Insertable Objects pane, drag the Table object to the report work area.
17. Enter the total number of columns and rows you will need to build your prompt page.
18. Note: For this example, enter 2 columns and 4 rows.
19. Click the OK button.
20. From the Insertable Objects pane, click the Toolbox tab.
21. Drag a Text Item over to the first column of the third row of the table.
Note: You will use the first two rows later to add explanatory text.
22. Type Enter a State Code: in the Text field.
23. Click the OK button.
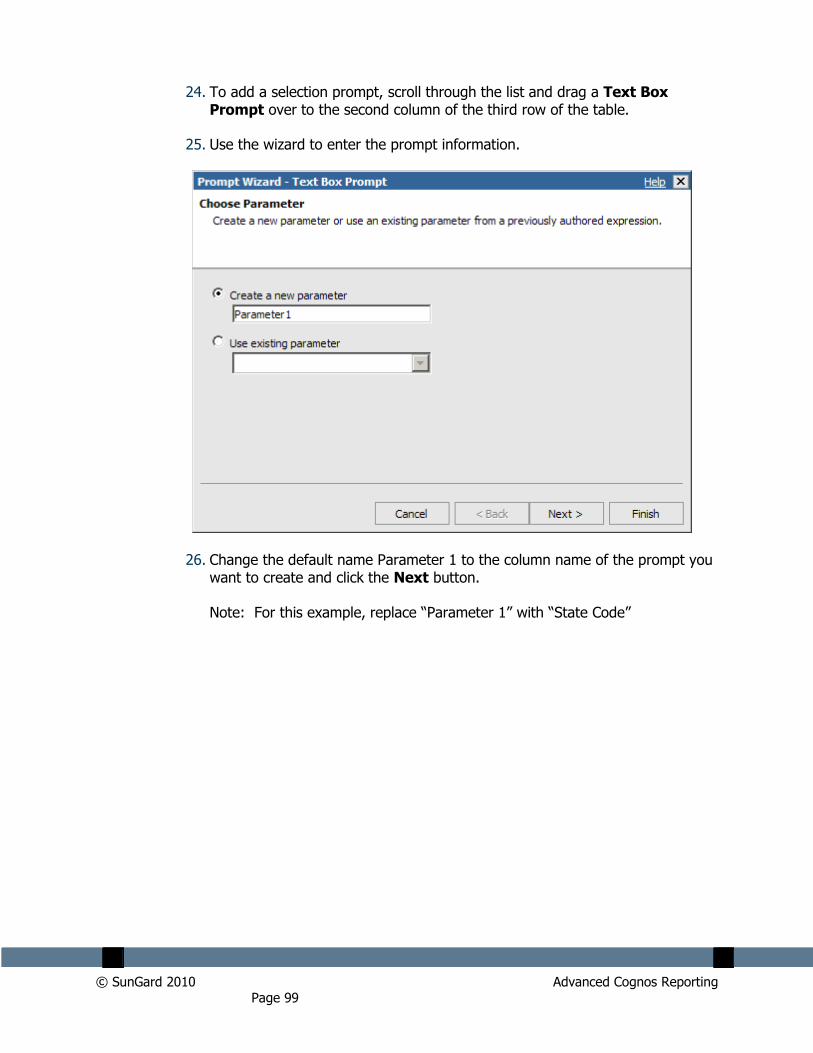
© SunGard 2010 Advanced Cognos Reporting Page 99
24. To add a selection prompt, scroll through the list and drag a Text Box Prompt over to the second column of the third row of the table.
25. Use the wizard to enter the prompt information.
26. Change the default name Parameter 1 to the column name of the prompt you want to create and click the Next button.
Note: For this example, replace “Parameter 1” with “State Code”

© SunGard 2010 Advanced Cognos Reporting Page 100
27. Click the ellipse icon next to the Package Item field.
28. Expand the query subject that contains the query item for which you want to prompt.
Note: In this training example, expand the ADDRESS_PREFERRED query subject, scroll to STATE_PROVINCE query item.
29. Click the query item (STATE_PROVINCE) for which you want to prompt.
30. Click the OK button.
31. Click the Finish button.
32. Click the Save icon and save the report.
33. Click the Run Report icon to preview the prompt page and report.
34. Enter a state code (such as PA) in the Enter a State Code: field.
35. Click the Finish button.
36. Click the Close [X] icon in the upper-right corner of the browser window to return to Report Studio.

© SunGard 2010 Advanced Cognos Reporting Page 101
Adding a Date Prompt
Introduction
You can add a prompt to a report that allows you to select values by date.
The Date Prompt wizard is similar to the Values Prompt wizard but contains fewer steps. On the Report Prompt page work area, a calendar outline displays when a date prompt is added to the prompt page.

© SunGard 2010 Advanced Cognos Reporting Page 102
Creating a Date Range prompt
If you want the prompt to contain a date range, you can change the value in the Operator field of the Create Filter window to greater than or equal to (>=). By default, the operator is set to equals (=).
Steps
Follow these steps to add a Select & Search prompt to a report using a prompt page. In the previous lesson, you created a blank prompt page and added a values prompt. In this lesson you will add a Select & Search prompt to find a person by name.
1. To access the prompt page, place the cursor over the Page Explorer bar and select Prompt Page 1 in the Prompt Pages folder.
Note: You should already have the Prompt Page 1 open from the previous lesson.
2. From the Insertable Objects pane, click the Toolbox tab.
3. Drag a Text Item over to the first column of the fourth row of the table you created in the previous exercise.
4. Enter Select a Date in the Text field.

© SunGard 2010 Advanced Cognos Reporting Page 103
5. Click the OK button.
6. To add a selection prompt, scroll through the list and drag a Date Prompt over to the second column of the fourth row of the table.
7. Use the wizard to enter the prompt information.
8. Change the default name Parameter 1 to the column name of the prompt you want to create and click the Next button.
Note: For this example, replace “Parameter 1” with “Date”
9. Click the ellipse icon next to the Package Item field.
10. Expand the query subjects that contains the query item for which you want to prompt.
Note: In this training example, expand the Person Demographic query subject, scroll to Person Detail query subject and the BIRTH_DATE query item.
11. Click the BIRTH_DATE query item.
12. Click the OK button.

© SunGard 2010 Advanced Cognos Reporting Page 104
13. Select >= in the Operator field.
14. Click the Finish button.
15. Click the Save icon and save the report.
16. Click the Run Report icon to preview the prompt page and report.
17. Enter a state code (such as PA) in the Enter a State Code: field.
18. Select a date from the calendar.

© SunGard 2010 Advanced Cognos Reporting Page 105
19. Click the Finish button.
20. Click the Close [X] icon in the upper-right corner of the browser window to return to Report Studio.

© SunGard 2010 Advanced Cognos Reporting Page 106
Adding End User Messages to a Prompt Page
Introduction
Instructional text goes here
Adding Error Messages to a Prompt Page
Introduction
Instructional text goes here

© SunGard 2010 Advanced Cognos Reporting Page 107
Drilling Up, Down, and Through
Reports
Section goal
The goal of this section is to provide the knowledge and practice to work with reports.
Objectives
In this section you will learn how to:
create a summary report
create a detail report
create a drill-through definition.

© SunGard 2010 Advanced Cognos Reporting Page 108
Step 1: Creating a Summary Report
Business scenario
You want to create a summary report that shows a count of addresses by state or province and city. You would like to display this information in a simple list. You want to prompt the person running the report to select a single state. For training purposes you will name this report “xx - Summary Report” where xx = your initials.
Try it yourself
Try to create this report yourself in Report Studio. If you get stuck, the steps to create this report begin on the next page.

© SunGard 2010 Advanced Cognos Reporting Page 109
Steps
Follow these steps to create a summary report for this exercise.
1. From Cognos Connection, click the Launch link.
2. Select Report Studio.
3. Select the Person Demographic package in the Recently used packages field.
4. Click the Create a new report or template link.
5. Click the List format.
6. Click the OK button.
7. From the Insertable Objects pane, expand the Person Demographic package.
8. Expand the Person query subject.
9. Double-click the STATE_PROVINCE query item.
10. Double-click the CITY query item.
11. Drag the ADDRESS_COUNT item to the report window.
12. Click in the STATE_PROVINCE column (not column header).
13. Click the Sort icon and select Sort Ascending.
14. With the STATE_PROVINCE column highlighted, click the Group icon.
15. Click the Filter icon.
16. Click the Add icon.
17. Expand the Person Demographic package in the Available Components area.
18. Expand the Person query subject.
19. Double-click the STATE_PROVINCE item.
20. Enter an equals sign ( = ) to select a single value in the Expression Definition field.
21. Add ?STATE_PROVINCE? to the end of the expression to prompt the

© SunGard 2010 Advanced Cognos Reporting Page 110
person running the report to select a state or province.
22. Click the OK button.
23. Click the OK button again.
24. Click in the CITY column (not column header).
25. Click the Sort icon and select Sort Ascending.
26. In the top of the report preview space double-click the Double-click to edit text link to rename the report.
27. Enter XX-Summary Report (where XX= your initials) in the Text field.
28. Click the OK button.
29. Click the Save button.
30. Navigate to the XX – Sample Reports folder (where XX= your initials) in the Save in field.
31. Enter XX-Summary Report in the Name field.
32. Click the Run Report icon to preview the report.
33. Select a state or province in the STATE_PROVINCE prompt field.
34. Click the OK button.
35. Click the Close [X] icon in the upper-right corner of the browser window to return to Report Studio.
Sample report

© SunGard 2010 Advanced Cognos Reporting Page 111
Sample report with sample data

© SunGard 2010 Advanced Cognos Reporting Page 112
Step 2: Creating a Detail Report
Business scenario
You want to create a detail report in a simple list format that displays the name and address of each person by state. You want the person running the report to select a single state when they run the report. You want the addresses to be sorted and grouped by city. Within each city, the names should then be sorted alphabetically by last name. Next to the last name you want to display the corresponding first name and street address of each person.
Try it yourself
Try to create this report yourself in Report Studio. If you get stuck, the steps to create this report begin on the next page.

© SunGard 2010 Advanced Cognos Reporting Page 113
Steps
Follow these steps to create a detail report:
1. From Cognos Connection, click the Launch link.
2. Select Report Studio.
3. Select the Person Demographic package in the Recently used packages field.
4. Click the Create a new report or template link.
5. Click the List format.
6. Click the OK button.
7. From the Insertable Objects pane, expand the Person Demographic package.
8. Expand the Person query subject.
9. Double-click the STATE_PROVINCE query item.
10. Double-click the CITY query item.
11. Drag the LAST_NAME item to the report window.
12. Note: The MAILING_NAME_PREFERRED item is a combination of first and last name. You may want to use it for mailing labels but you cannot use it to sort by last name.
13. Drag the FIRST_NAME item to the report window.
14. Double-click the STREET_LINE1 item to add it to the report window.
15. Double-click the STREET_LINE2 item to add it to the report window.
16. Double-click the STREET_LINE3 item to add it to the report window.
17. Double-click the STREET_LINE4 item to add it to the report window.
18. Click in the STATE_PROVINCE column (not column header).
19. Click the Sort icon and select Sort Ascending.
20. With the STATE_PROVINCE column highlighted, click the Group icon.
21. Click the Filter icon.

© SunGard 2010 Advanced Cognos Reporting Page 114
22. Click the Add icon.
23. Expand the Person Demographic package in the Available Components area.
24. Expand the Person query subject.
25. Double-click the STATE_PROVINCE item.
26. Enter an equals sign ( = ) to select a single value in the Expression Definition field.
27. Add ?STATE_PROVINCE? to the end of the expression to prompt the person running the report to select a state or province.
28. Click the OK button.
29. Click the OK button again.
30. Click in the CITY column (not column header).
31. Click the Sort icon and select Sort Ascending.
32. With the CITY column highlighted, click the Group icon.
33. Click in the LAST_NAME column (not column header).
34. Click the Sort icon and select Sort Ascending.
35. In the top of the report preview space double-click the Double-click to edit text link to rename the report.
36. Enter XX-Detail Report (where XX= your initials) in the Text field.
37. Click the OK button.
38. Click the Save button.
39. Navigate to the XX – Sample Reports folder (where XX= your initials) in the Save in field.
40. Enter XX-Detail Report in the Name field.
41. Click the Run Report icon to preview the report.
42. Select a state or province in the STATE_PROVINCE prompt field.
43. Click the OK button.
44. Click the Close [X] icon in the upper-right corner of the browser window to return to Report Studio.

© SunGard 2010 Advanced Cognos Reporting Page 115
Sample report
Sample report with sample data

© SunGard 2010 Advanced Cognos Reporting Page 116
Step 3: Creating a Drill-Through Definition
Introduction
You can create a drill-through definition that allows you to link data in a summary report to additional information in a detail report. To create a drill-through definition, you can right-click on the data in a column and then select Drill-Through Definitions from the pop-up menu.
Once the Drill-through definition is in place, the text of the data in the column will have a standard blue font and underline to indicate it is a clickable link.
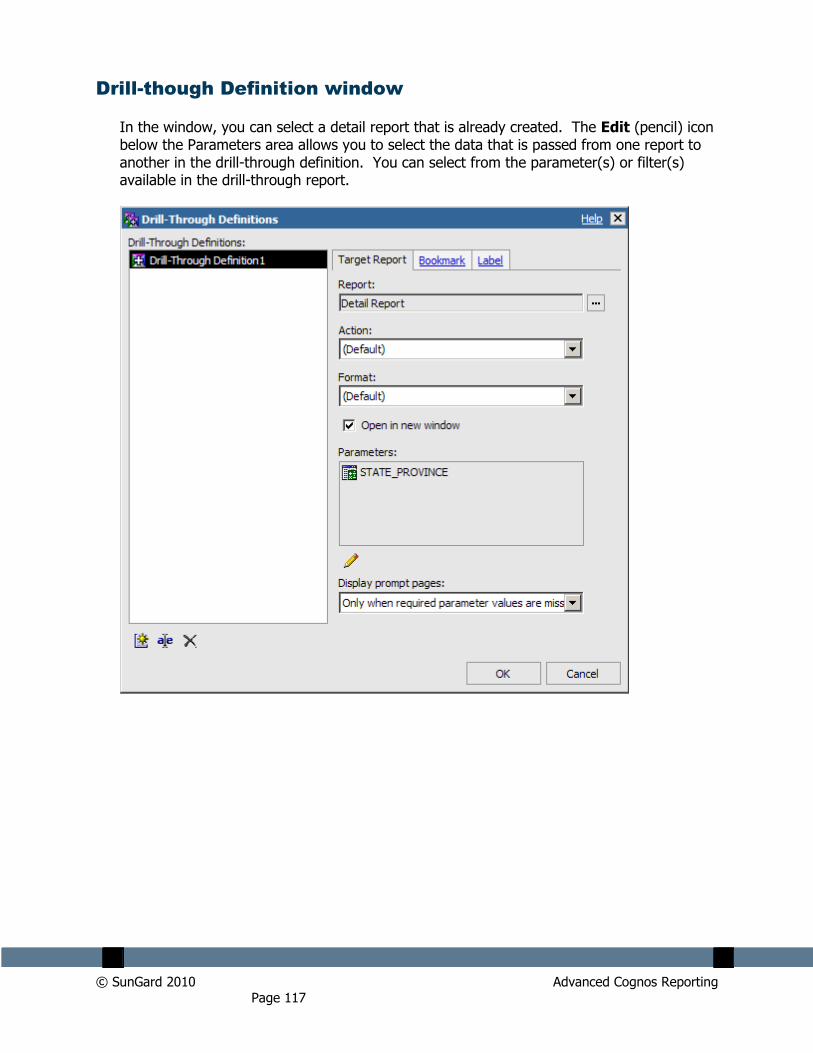
© SunGard 2010 Advanced Cognos Reporting Page 117
Drill-though Definition window
In the window, you can select a detail report that is already created. The Edit (pencil) icon below the Parameters area allows you to select the data that is passed from one report to another in the drill-through definition. You can select from the parameter(s) or filter(s) available in the drill-through report.

© SunGard 2010 Advanced Cognos Reporting Page 118
Steps
Note: To complete this exercise you will need to have a summary report and a detail report that contains a filtered valued based on the summary report. This exercise assumes that the Summary and Detail Reports created in Exercises 1 and 2 have already been completed.
1. Within the My Folders tab, navigate to the Summary Report you created in Exercise 1.
2. Click on the Open with Report Studio icon next to the summary report in which you want to add a drill-through definition.
3. Right-click in the column (not column header) of the State column.
4. Select Drill-Through Definitions from the pop-up menu.
5. Click the Add icon
6. Click the Ellipse icon in the Report Name field to navigate to the detail report to which you want to drill-through.
Note: For this exercise, navigate to the XX-Detail Report (where XX = your initials) that you created in the previous exercise.
7. Click on the check box Open in a new window.
8. Click the Edit (pencil) icon below the Parameters area.
9. Select Pass data item value in the Method field.
10. Select STATE_PROVINCE in the Value field.
11. Click the OK button.
12. Select Only when required parameter values are missing in the Display

© SunGard 2010 Advanced Cognos Reporting Page 119
prompt pages field.
13. Click the OK button.
Note: A plus symbol displays when a drill-through definition has been added to a column.
14. Click the Run Report icon to preview the report.
15. Select a state or province in the STATE_PROVINCE prompt field for the summary report.
16. Click the OK button.
17. Click on a state or province in the list to preview the data in the detail report.
18. Click the Close [X] icon in the upper-right corner of the browser window to return to the summary report.
19. Click the Close [X] icon in the upper-right corner of the browser window to return to Report Studio.
20. Click the Save icon.
21. Select Exit from the File menu to close the report.

© SunGard 2010 Advanced Cognos Reporting Page 120
Using Cognos Framework Manager
Section goal
The goal of this section is to provide the knowledge and practice to use Cognos Framework Manager to modify models and create a project.
Objectives
In this section you will learn how to:
work with Framework Manager layers
modify a model
create a Framework Manager project.

© SunGard 2010 Advanced Cognos Reporting Page 121
Working with Framework Manager Layers
Introduction
See if any of the topics/lessons from the Using Framework Manager lessons from the Banner Recruiting and Admissions Performance workbook (which are copied into this workbook) can be modified and re-used.

© SunGard 2010 Advanced Cognos Reporting Page 122
Modifying a Model
Introduction
See if any of the topics/lessons from the Using Framework Manager lessons from the Banner Recruiting and Admissions Performance workbook (which are copied into this workbook) can be modified and re-used.
© SunGard 2010 Advanced Cognos Reporting Page 123
Creating a Framework Manager Project
Introduction
See if any of the topics/lessons from the Using Framework Manager lessons from the Banner Recruiting and Admissions Performance workbook (which are copied into this workbook) can be modified and re-used.

© SunGard 2010 Advanced Cognos Reporting Page 124
Using Cognos Framework Manager
Section goal
The goal of this section is to provide the knowledge and practice to use Cognos Framework Manager to maintain SunGard Higher Education Recruiting and Admissions Relationships Performance data.
Objectives
In this section you will learn how to:
copy a package
modify a package
create a package
modify a parameter map
publish a package.

© SunGard 2010 Advanced Cognos Reporting Page 125
Cognos Framework Manager Overview
Introduction
Cognos Framework Manager is a translator that allows the metadata layer of Performance Management to talk to Banner EDW using reporting tools (Report Studio, Query Studio) and analysis tools (Analysis Studio) to answer business questions. It enables metadata to be created that spans multiple sources, while remaining completely invisible to the end users.
The Framework Manager model (a business presentation of the information in one or more data sources), delivered with Recruiting and Admissions Performance, captures data
using business terms and definitions enabling a consistent understanding and use of data and metrics across your institution. The logical relationship between the data is captured, and does not depend on the physical data source. This enables more data integration to be completed so you spend less time gathering and organizing information. The model structures, adds to, and manages data in ways that make sense to users. For example, a model defines business rules, data descriptions, data relationships, business dimensions and hierarchies, and other administration tasks.
Users and their reports are insulated from changes to the underlying system data sources. When the model needs to change, Framework Manager identifies the impact to existing reports. This enables Administrative users to implement systems improvements without having to rewrite reports and manage model changes.
Packages of information can be published to target specific types of analysis and users. This enables you to use dashboards, run reports, build ad-hoc reports, and analyze trends without having to sift through large amounts of information. The delivered Performance Management Framework Manager model (named sghe_pm) is divided into three views: Database View, Business View, and Presentation View. The delivered model can be copied and changed, but you cannot change the delivered model.

© SunGard 2010 Advanced Cognos Reporting Page 126
Framework Manager Models
Introduction
Databases are typically designed to accurately and efficiently store all the data captured through the business processes. Therefore, the stored data is usually not easily accessible for reporting and making enterprise decisions in business terms. Because of this, data requires metadata, the „data about data‟, so that it can be more effectively retrieved for analysis and reporting. Cognos‟ Framework Manager tool is the mechanism that allows the data in the database to be redefined to answer business questions.
Cognos is specifically designed to leverage and deliver centralized enterprise metadata via the Framework Manager Model. The Framework Manager Model provides the user a common definition in business terms that adds value across an organization. The database is redefined so that the metadata can be published in a package made available through the Cognos Connection to the Cognos BI reporting tools (Report Studio, Query Studio, and Analysis Studio) to answer business questions.
The Performance Management products utilize Framework Manager‟s ability to separate the database representation of data from the business perspective to provide for an intuitive user experience across all knowledge levels.
The Framework Manager model presents the data using business terms and definitions. This enables you to use, build, and modify your own reports and enables consistent understanding and use of data and metrics across the institution. The logical relationships between data are defined within the model to enable complete data integration so that you spend less time gathering and organizing data.
Metadata Layers
When changes to an existing model are required, Framework Manager (FM) is able to identify the impact to existing reports. This enables an institution to implement system improvements to manage model changes proactively without having to rewrite reports. Framework Manager provides the ability to „layer‟ metadata as a means to insulate end users from changes made to the underlying data sources and/or relationships.
The FM model delivered as part of the Recruiting and Admissions Performance solution seeks to exercise this flexibility most effectively by utilizing three layers to manage the metadata content. The delivered content is organized into a database view, business view, and presentation view. Each layer is designed to build upon the next to „transform‟ data from a set of database tables to an intuitive business-centric reporting layer. Each of the three layers serves a specific purpose and employs specific Cognos concepts. Details of each are as follows:

© SunGard 2010 Advanced Cognos Reporting Page 127
Database View
The database view is intended to be the layer into which Framework Manager imports all database objects. There is very little different in the database view and the database itself, save a few exceptions:
Object names for columns that will eventually be published from subsequent layers have been updated to a business name. They have been changed to utilize mixed-case nomenclature while removing all underscores.
Some calculated columns have been added as a means of making commonly used functions more readily available, for generating a unique key for specific fact tables, and for providing the flexibility to configure institution-specific descriptions for certain concepts through use of parameter maps.
Business View
The business view layer is utilized to organize content around a specific business process or processes. Objects from the database view are referenced and relationships among all of them are defined to support the associated business process. The content defined within the business view is as follows:
Relationships between the various objects (fact and dimension tables) are defined. These joins define the SQL generated behind the scenes by the various Cognos BI Reporting Tools.
Determinants are defined for the various dimensions to ensure that the proper cardinality is preserved with multi-fact queries that have a conformed, or shared, dimension.
Role-based, or „alias‟, query subjects are defined for those objects that serve multiple business purposes. An example of one such object would be „Application Date‟ which is a copy of the „Calendar Date‟ query subject. These role-based query subjects allow an object to be utilized multiple times within the same query for different purposes.

© SunGard 2010 Advanced Cognos Reporting Page 128
Presentation View
The presentation view is the layer in which information is reorganized into useful logical groups of data that may be used together for reporting. The query subjects contain data elements and folders of data elements that ideally present the data in an intuitive fashion so it is easy for the report writer to locate desired data for any report. In creating the presentation layer the following standards were applied:
Related data or query subject items are put into the same query subject.
Subsets of the data that will commonly be used together are organized into folders.
Commonly used filters have been defined to enhance functionality. Examples of delivered filters include Student Level Undergraduate, Student Level Graduate, and Student Level Professional.
Commonly used calculations have been added to make reporting easier.
Additional range and aging concepts have been added that work in conjunction with parameter maps. Each has an accompanying „order‟ concept to ensure they appear in proper order when they are utilized.
Packages of information can be published to target specific types of analysis and users. This enables you to use dashboards, run reports, build ad-hoc reports, and analyze trends without having to sift through large amounts of irrelevant information.

© SunGard 2010 Advanced Cognos Reporting Page 129
Business Concepts
Different business processes often require different perspectives on data. This signifies that the relationships amongst the supporting database objects would need to change based upon the analysis being performed. As a means to support this important flexibility, the Recruiting and Admissions Performance solution has been designed to take advantage of Cognos Framework Manager‟s ability to separate objects into different namespaces. Query subjects, their relationships, and various other supporting objects have been organized into separate namespaces to support specific business processes. These “business concepts” are driven off of a central fact table which is the primary focus of analysis within that area. Two business concepts are delivered with the Recruiting and Admissions Performance solution. The business concept names and a brief description of each are provided below.
Business
Concept Driving Fact Table Business Definition
Package
Name
Analyze Enrollment Funnel
WFT_FUNNEL_HISTORY
Use this business concept to report the movement of the prospective students through the institution enrollment funnel with all details and other fact and dimension tables including the Combined Admissions Record, Campaign, Communication, Recruiter Assigned, etc.
PM Analyze Enrollment
Funnel
Manage Applicant
WFT_ADMISSIONS_APPLICATION
Use this business concept to report the details on the admissions application and other related fact and dimensions tables including but not limited to Application Rating, Application Decisions, Prospective Student, etc.
PM Manage Applicant

© SunGard 2010 Advanced Cognos Reporting Page 130
Framework Manager Applied Functionality
Preselected Records of Interest
For some business areas, it is useful to represent certain records of interest along with the entirety of records. Concepts such as „First Contact‟, „Latest Contact‟, „Highest Test Score‟ are typically of interest. It, therefore, is desirable to make such items easily available within the presentation view. To support this functionality, such concepts have been included in various query subjects where deemed to be useful.
An example of this can be found within the Contact query subject. Information relative to all contacts is included as well as content associated with the first contact and the latest contact.
Query Subject/Folder/ Query Subject Item
Data Elements
Contact

© SunGard 2010 Advanced Cognos Reporting Page 131
Indicators
Some query subjects in the presentation layer include indicators from one of the fact tables in the EDW Oracle Database these are translated from the database value of „1‟ or „0‟ to Yes and No respectively. In addition, where desirable, some indicators have a new query subject item of <indicator> description. Both translations from „1‟ or „0‟ are defined in a parameter map so they can be determined by the institution and defined during set up.
Some query subjects within the presentation layer include indicator fields. Dependent upon the database source for a given data element, the indicator is translated to a meaningful „Yes‟ or „No‟ representation. For those data elements drawn from dimension tables within the EDW, indicator fields are translated via cleansing during ETL processing. For those data elements drawn from fact tables, however, the values remain as either a 1 or 0. The Framework Manager model has been designed to utilize a parameter map for these elements. Additionally, a description field and associated parameter map has been included for each to allow for a customizable representation of what a Yes or No means for that data element.
An example of this can be found within the Combined Admissions Record query subject. The Application Complete Ind and its associated description may be found. The contents of both are driven by a parameter map that ties to a value of 1 or 0.
Query Subject/Folder/ Query Subject Item
Data Elements
Combined Admissions Record/Application Complete Ind and Application Complete Ind Description

© SunGard 2010 Advanced Cognos Reporting Page 132
Derived Concepts
In some business cases it is important to associate certain values together for reporting purposes that may not otherwise have an association in the database. To address this need derived concepts have been created that utilize parameter maps to define how values translate to the new data element.
An example of this functionality can be seen in the Demographic query subject. The Minority Ind data element references a parameter map to determine which ethnicity categories should be classified as „Minority‟ and which should be classified as „Non Minority‟.
A second example is the Traditional Student Ind which is based on the prospective student being under a specified age or over the specified age defined within a parameter map.
Query Subject/Folder/ Query Subject Item
Data Elements
Demographic/ Diversity Information/ Minority Ind and Minority Ind Description or Traditional Student Ind and Traditional Student Ind Description

© SunGard 2010 Advanced Cognos Reporting Page 133
Pre-Defined Value Concepts
There are specific data elements that are commonly used yet may have different codes from one client to another. For these situations, it is desirable to have a predefined element that may be driven off of a parameter map to provide a standardized structure within the presentation layer. Elements such as this have been added to the presentation layer to support this need.
An example of this can be seen within the Test query subject. Analysis of undergraduate applicants typically centers around test scores such as the ACT Composite and the SAT Combined. The codes within the database, however, may vary from institution to institution. A parameter has been defined, therefore, to allow for the translation of these codes to ensure that they appear in a standardized meaningful representation.
Query Subject/Folder/ Query Subject Item
Data Elements
Test/ all, highest or latest

© SunGard 2010 Advanced Cognos Reporting Page 134
Distinct Counts
One measure often used for analysis within higher education is unduplicated headcount. This concept, as well as other unduplicated counts, can be a bit complex to create in a report because one needs to have a true understanding of what the uniqueness of a record truly is. Various counts have been added throughout the presentation layer to eliminate any such confusion and to ensure a “single version of the truth” for these measures.
Headcount is a primary example of this concept which is included in the presentation layer. An additional example would be counts based upon the set of financial aid steps a person may have completed within the Financial Aid Status query subject. A distinct count is calculated for each indicator based upon whether they have a “Yes” value.
Query Subject/Folder/ Query Subject Item
Data Elements
Financial Aid Status

© SunGard 2010 Advanced Cognos Reporting Page 135
Special Calculations
Special calculations are frequently required based upon various measures already represented in the presentation layer. Some of these useful calculations have been included in their own folders seen at the bottom of available components in the presentation layer. Examples of such calculations would be the various calculations provided with the Analyze Enrollment Funnel business concept which return rates, yields, and percentages for associated funnel history data.
Query Subject/Folder/ Query Subject Item
Data Elements
Funnel Status Performance Measures
Initial Percent of Qualifying Headcount
Initial Percent of Total Headcount
Current Percent of Qualifying Headcount

© SunGard 2010 Advanced Cognos Reporting Page 136
Query Subject/Folder/ Query Subject Item
Data Elements
Current Percent of Total Headcount
Internal Keys
Unique identifiers for people or records may be required in certain situations within Cognos when performing more complex analysis. For this reason, an additional query subject has been included within each business concept to house these unique identifiers. These values are useful when joining queries within Report Studio and when identifying distinct headcounts or applications counts within a cube model.
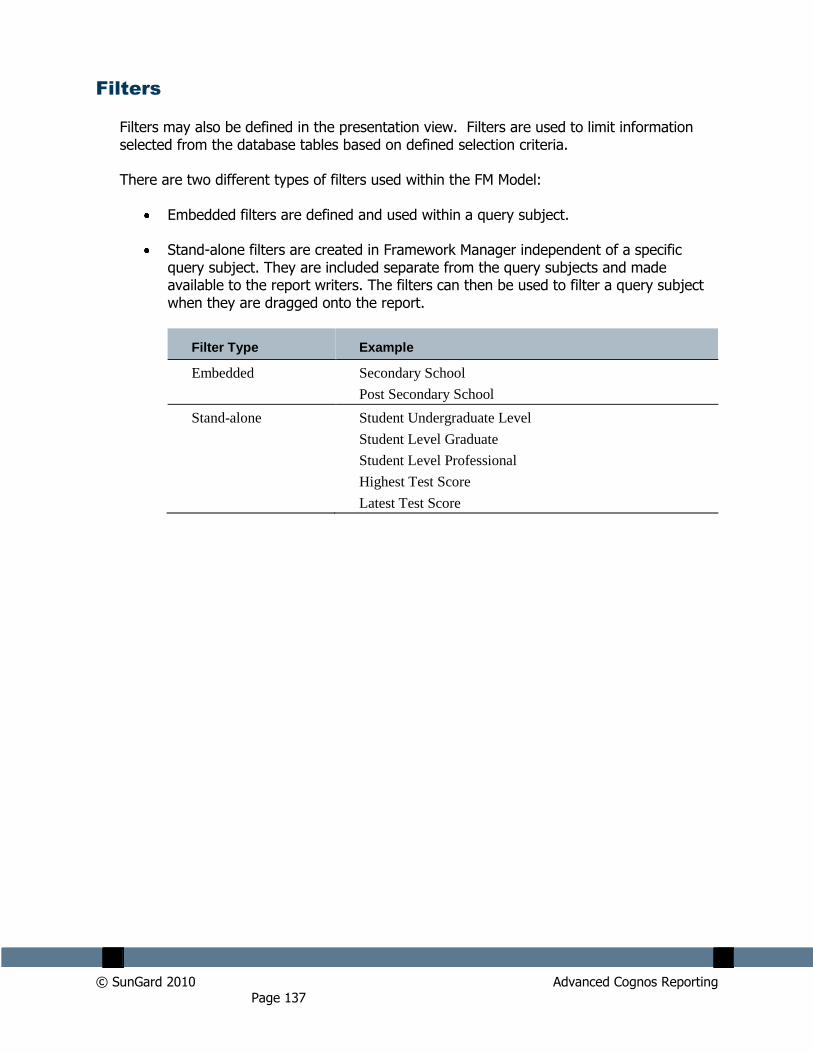
© SunGard 2010 Advanced Cognos Reporting Page 137
Filters
Filters may also be defined in the presentation view. Filters are used to limit information selected from the database tables based on defined selection criteria.
There are two different types of filters used within the FM Model:
Embedded filters are defined and used within a query subject.
Stand-alone filters are created in Framework Manager independent of a specific query subject. They are included separate from the query subjects and made available to the report writers. The filters can then be used to filter a query subject when they are dragged onto the report.
Filter Type Example
Embedded Secondary School
Post Secondary School
Stand-alone Student Undergraduate Level
Student Level Graduate
Student Level Professional
Highest Test Score
Latest Test Score

© SunGard 2010 Advanced Cognos Reporting Page 138
Delivered filters
Filter Data Elements
Current Academic Year (filter)
Current Academic Period (filter)
ACT Composite Test (filter)
SAT Combined Test (filter)
Student Level Undergraduate (filter)
Student Level Graduate (filter)
Student Level Professional (filter)

© SunGard 2010 Advanced Cognos Reporting Page 139
Branch To…Merge From
Introduction
SunGard Higher Education recommends that you do not modify the Framework Manager Master Project (sghe_pm) that is delivered with Enrollment Management. If modification is needed you will need to Branch off copies of the master project.
Best practice
Best practice would be to not only branch off a copy of the master project (Initial Branch To), but to make a second branch layer. This third layer would become your Modification Layer keeping your production project available for use and allowing multiple modelers to work on the same project simultaneously. Any combination of branches could then be merged with the Production version of the project. Once you are ready to make these changes available, publish any package from the Production project where changes were made.

© SunGard 2010 Advanced Cognos Reporting Page 140
Steps – Branch to
Follow these steps to branch to a copy of the project 1. Launch Framework Manager and open the delivered sghe_pm project.
We will want to make a branch (Prod copy) of this Master Project (sghe_pm).

© SunGard 2010 Advanced Cognos Reporting Page 141
2. Left click on Projects from the Text menu and select Branch To…
3. Give your branch copy a name and select a save location and click Ok.
4. Repeat Steps 2 – 3 again to create a copy for your Modification Layer. Name the branched project sghe_pm Mod.
The sghe_pm Prod branch will become your production project. This will be the project that you will always publish your packages to Cognos Connection from. Any children that are branched from the sghe_pm Prod project is where you would make you modifications.

© SunGard 2010 Advanced Cognos Reporting Page 142
5. Close the Master Project (sghe_pm) by clicking on File and then Close.
6. Open the sghe_pm Mod project and make any necessary changes.

© SunGard 2010 Advanced Cognos Reporting Page 143
7. As an example we‟ll create a new package. Right click on Packages Create Package.

© SunGard 2010 Advanced Cognos Reporting Page 144
8. Select a name for your new package and click Next.

© SunGard 2010 Advanced Cognos Reporting Page 145
9. Select which model objects you want to include in the package by selecting, unselecting, or hiding Query Subjects. These choices are inherited by the objects‟ children. So unselecting the top level will unselect the entire structure. Note: Do not use "Use Existing Packages" option for new Functional Package.

© SunGard 2010 Advanced Cognos Reporting Page 146
10. Maximize the Presentation View and select the Managed Applicants Business Concept by clicking the red X.
Once you have selected everything you want the package to include, click Next.

© SunGard 2010 Advanced Cognos Reporting Page 147
11. Next you will see a screen that allows you to select which Data Base Functions you will allow the report writer to use in this package. If your Data Base is listed in the right column and you want to include these functions, click Finish.

© SunGard 2010 Advanced Cognos Reporting Page 148
Once your package is created you should see the screen below. You do not want to publish your newly created package at this time. It still needs to be merged so click No.

© SunGard 2010 Advanced Cognos Reporting Page 149
12. You can now see that your new package has been created.
13. Save this project by clicking on File Save.

© SunGard 2010 Advanced Cognos Reporting Page 150
14. Close the project. File Close.

© SunGard 2010 Advanced Cognos Reporting Page 151
Steps- Merge From
Now that you have modified your branched project, you will need to do a Merge From. Follow these steps to do a merge from.
1. Open your sghe_pm Prod project.

© SunGard 2010 Advanced Cognos Reporting Page 152
2. Click on Project Merge From…
3. Navigate to the location of your saved sghe_pm Mod project.
4. Framework Manager will compare the log files of each project to determine the differences.

© SunGard 2010 Advanced Cognos Reporting Page 153
Select the actions you want Framework Manager to perform during the merge, leaving the actions you do not want to take place unselected.
You can either Run the entire process or Step through the process one action at a time by clicking the respective buttons.
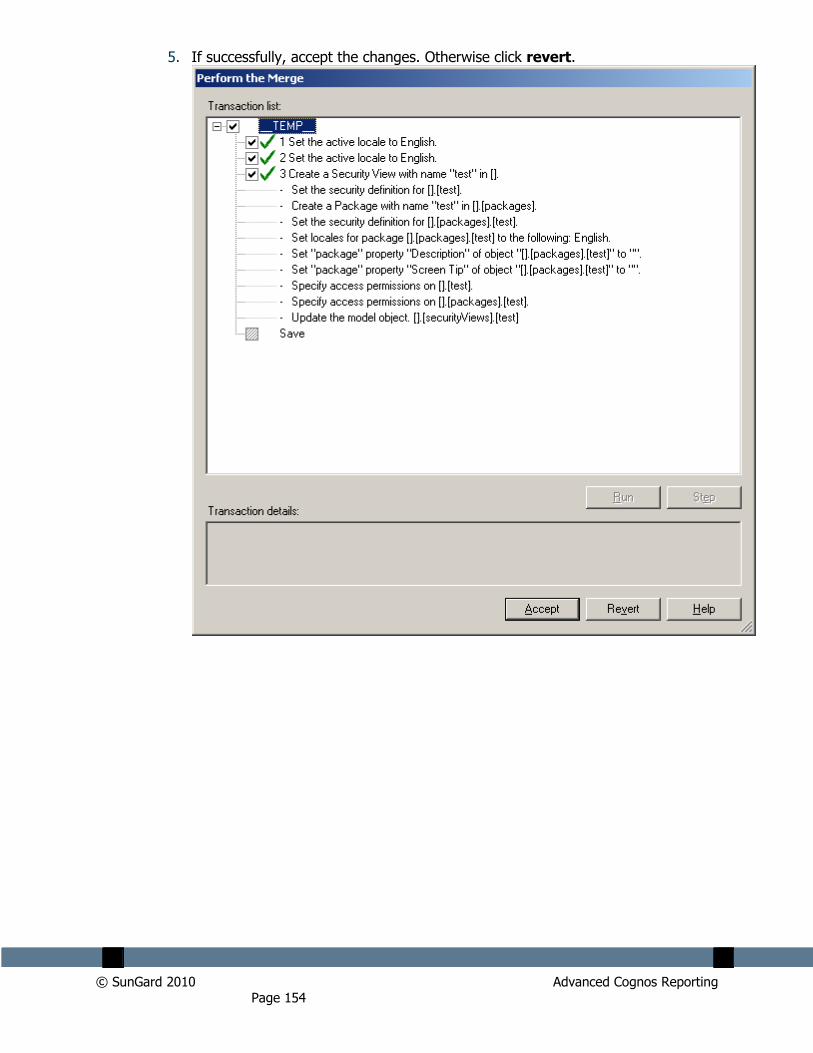
© SunGard 2010 Advanced Cognos Reporting Page 154
5. If successfully, accept the changes. Otherwise click revert.

© SunGard 2010 Advanced Cognos Reporting Page 155
6. Notice that the icon next to the new package does not have a globe on it. This means the package has not been published. Right click on the New Package and select Publish Package.

© SunGard 2010 Advanced Cognos Reporting Page 156
7. Select Cognos 8 Content Store as your publish location. Use the Browse button to select the destination on the server. Then click Next.

© SunGard 2010 Advanced Cognos Reporting Page 157
8. Apply security and click Next.

© SunGard 2010 Advanced Cognos Reporting Page 158
9. Select whether you want to verify the package before publishing. If you have any
external query subjects to add to this package do so here. Then click Publish.

© SunGard 2010 Advanced Cognos Reporting Page 159
10. Verify that there were no fatal errors. Then click Finish.

© SunGard 2010 Advanced Cognos Reporting Page 160
Exercise 1: Publishing a Package
Scenario
You made a small change database layer so that the information reflects how your institution defines data. Now you need to republish the business layer package.
Instructions
Without changing any data in the package, practice republishing the business layer package.
Try it yourself
Try to republish the package yourself in Framework Manager. If you get stuck, refer to steps in the previous lesson.
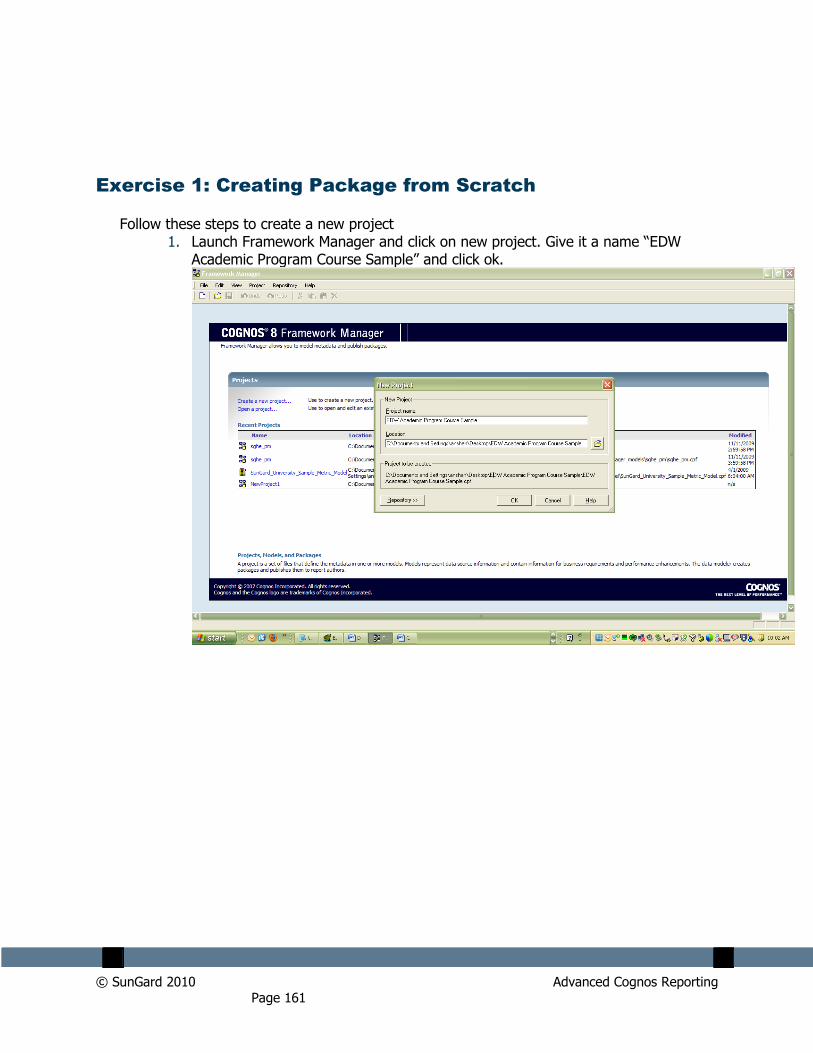
© SunGard 2010 Advanced Cognos Reporting Page 161
Exercise 1: Creating Package from Scratch
Follow these steps to create a new project 1. Launch Framework Manager and click on new project. Give it a name “EDW
Academic Program Course Sample” and click ok.

© SunGard 2010 Advanced Cognos Reporting Page 162
2. Select language “English” and click ok.

© SunGard 2010 Advanced Cognos Reporting Page 163
3. Select Data Sources and click next.

© SunGard 2010 Advanced Cognos Reporting Page 164
4. Select EDW Data Sources and click next.

© SunGard 2010 Advanced Cognos Reporting Page 165
5. Expand EDWMGR Database Schema. Expand Views. Check “WCV_ACADEMIC_PROGRAM_COURSE” view and click next.

© SunGard 2010 Advanced Cognos Reporting Page 166
6. Keep default selection as it is and then click “Import”.
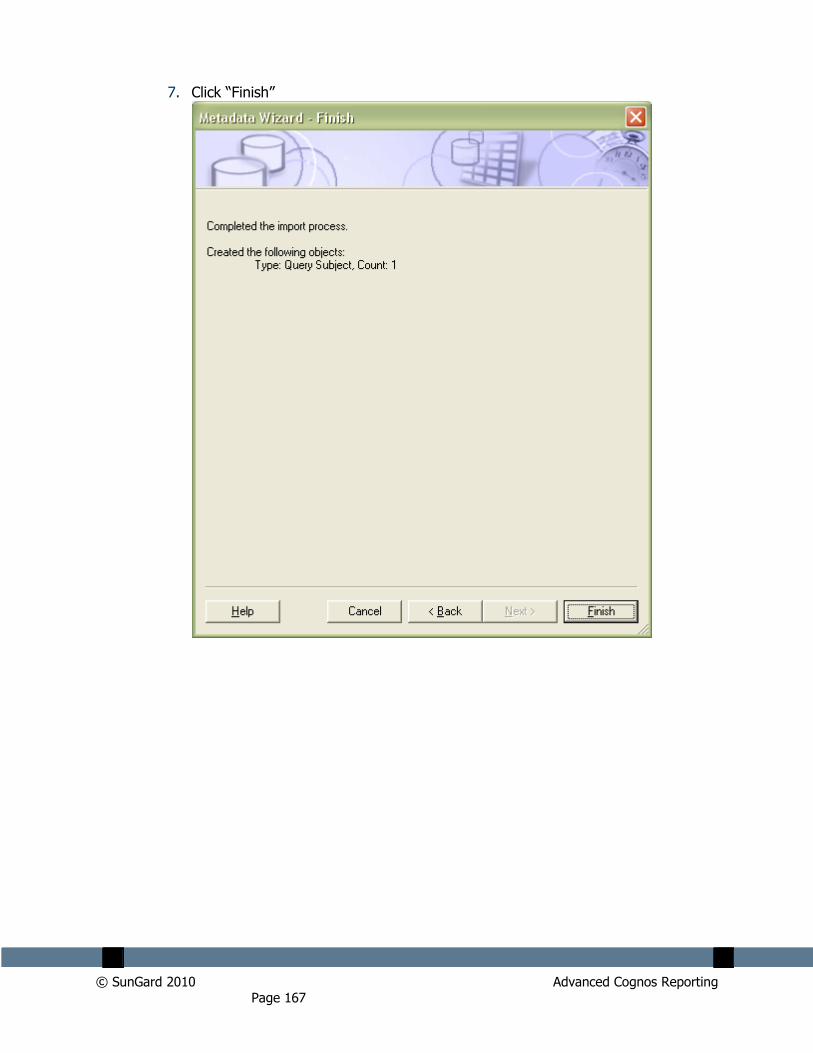
© SunGard 2010 Advanced Cognos Reporting Page 167
7. Click “Finish”

© SunGard 2010 Advanced Cognos Reporting Page 168
8. From the “Project Viewer” window select “EDW” namespace. Right Click on the namespace and “Create -> Namespace” and name it as Database View and hit enter.

© SunGard 2010 Advanced Cognos Reporting Page 169
9. Repeat the process twice and create two new namespaces (i.e. Business View, Presentation View)

© SunGard 2010 Advanced Cognos Reporting Page 170
10. Drag “WCV_ACADEMIC_PROGRAM_COURSE” and drop into the “Database View” Namespace

© SunGard 2010 Advanced Cognos Reporting Page 171
11. Select Database View Namespace. Right click and select “Run Metadata Wizard”.

© SunGard 2010 Advanced Cognos Reporting Page 172
12. Select Data Sources. Click Next. Select “EDW” Data Source and click next. Expand EDWMGR schema. Expand Tables.

© SunGard 2010 Advanced Cognos Reporting Page 173
13. Select “WDT_DEMOGRAPHIC” Table. Click next and import and finish.

© SunGard 2010 Advanced Cognos Reporting Page 174
14. You will notice “WDT_DEMOGRAPHIC” dimension table will be imported underneath of “WCV_ACADEMIC_PROGRAM_COURSE”

© SunGard 2010 Advanced Cognos Reporting Page 175
15. Select Business View namespace. Right click and create “Query Subject”. Name it as “Academic Program Course Measure” and click ok.

© SunGard 2010 Advanced Cognos Reporting Page 176
16. Once you click ok it will bring up the “Query Subject Definition” Window.

© SunGard 2010 Advanced Cognos Reporting Page 177
17. Expand Database View namespace and drag and drop “WCV_ACADEMIC_PROGRAM_COURSE” into “Query Item and Calculation” window.

© SunGard 2010 Advanced Cognos Reporting Page 178
18. Click ok and it will create a new Query Suject.
19. Notice a new Query Subject underneath Business View Namespace.
20. Repeat this process again and import “WDT_DEMOGAPHIC” Query Subject into “Business View” Namespace. And it should look like this.

© SunGard 2010 Advanced Cognos Reporting Page 179
21. Select “Academic Program Course Measure”, hold “CTL” key and select “Demographic” query subject. Release “CTL” key, right click and Create -> Relationship.

© SunGard 2010 Advanced Cognos Reporting Page 180
22. Match “DEMOGRAPHIC_KEY” on both end and click ok.

© SunGard 2010 Advanced Cognos Reporting Page 181
23. Import those two query subjects from Business View namespace to Presentation View namespace (Steps would be the same as we imported Query Subjects from Database View namespace to the Business View Namespace – Steps 15 to 20). Final View should look like this.

© SunGard 2010 Advanced Cognos Reporting Page 182
24. Now you are ready to create package. Select Packages section. Right click Create -> Package and name it as “EDW Academic Program Course Sample” Package

© SunGard 2010 Advanced Cognos Reporting Page 183
25. Select Next and select only “Presentation View” Namespace

© SunGard 2010 Advanced Cognos Reporting Page 184
26. Click Next

© SunGard 2010 Advanced Cognos Reporting Page 185
27. Click Finish and it will create package

© SunGard 2010 Advanced Cognos Reporting Page 186
28. Click Yes and it will bring up publishing package wizard

© SunGard 2010 Advanced Cognos Reporting Page 187
29. Click next keep default settings as it is

© SunGard 2010 Advanced Cognos Reporting Page 188
30. Click Next

© SunGard 2010 Advanced Cognos Reporting Page 189
31. Click Publish
32. You have successfully published Package

© SunGard 2010 Advanced Cognos Reporting Page 190
Exercise 2: Calculations
Steps – Create a Calculation
Now that you have branched your project, you can modify the model. Follow these steps to add a stand-alone calculation.
11. Open your sghe_ods_bv_mod project.

© SunGard 2010 Advanced Cognos Reporting Page 191
12. Expand the Model namespace and then the ODS folder. Right click on the
Admissions Application namespace and select Create Calculation.

© SunGard 2010 Advanced Cognos Reporting Page 192
13. In the name box type Max Test Score. In the expression definition window enter
the expression maximum ( [Admission Application].[Test].[TEST_SCORE] ).
Alternatively, you can navigate to the desired object under Available
Components. Then drag or click the blue arrow to move the object over to the
expression. Click Ok.
You have created a stand-alone Calculation. Embedded calculations work in the
same way, except the expression is written at the Query Item level. By embedding
a calculation, you are forcing the report writers and consumers to always use the
object containing the calculation.

© SunGard 2010 Advanced Cognos Reporting Page 193
Exercise 3: Filters
Steps – Create a Filter
Filters allow you to limit the amount or type of data returned. Follow these steps to add a stand-alone filter.
1. Open your sghe_ods_bv_mod project.

© SunGard 2010 Advanced Cognos Reporting Page 194
2. Expand the Model namespace and then the ODS folder. Right click on the
Admissions Application namespace and select Create Filter.

© SunGard 2010 Advanced Cognos Reporting Page 195
3. In the name box type Applicant Selection. In the expression definition window
enter the expression
[Admission Application].[Admissions Application].[LATEST_DECISION]
<> 'SC' and [Admission Application].[Admissions
Application].[LATEST_DECISION] <> 'CD'
or
[Admission Application].[Admissions Application].[LATEST_DECISION] is
null
Alternatively, you can navigate to the desired object under Available
Components. Then drag or click the blue arrow to move the object over to the
expression. Click Ok.
You have created a stand-alone Filter. Embedded Filters work in the same way,
except the expression is written at the Query Item level. By embedding a filter,
you are forcing the report writers and consumers to always use the object
containing the filter.

© SunGard 2010 Advanced Cognos Reporting Page 196

© SunGard 2010 Advanced Cognos Reporting Page 197
Using a Repeater Table
Section goal
The goal of this section is to provide the knowledge and practice to use a repeater table to create and print mailing labels.
Objectives
In this section you will learn how to:
create a mailing label
filter data in a mailing label list
sort data in a mailing label list
save the mailing labels as a PDF file
print the mailing labels.

© SunGard 2010 Advanced Cognos Reporting Page 198
Creating a Mailing Label Report
Introduction
You can use Repeater Table style or report to create mailing labels or name tags. Repeater tables are used whenever you want to display multiple small pieces of information on a single page. For example, when you use the Repeater Table report style, you can select the number of columns and rows in which you want your data to display. You then add query items to the first cell in the repeater table and all the remaining cells will contain the same query item.
Report format selection window

© SunGard 2010 Advanced Cognos Reporting Page 199
Numbers of rows and columns
When you open a repeater table, there is only one block displayed. As you add query items, a default number of cells display. You can manually change this to any number of columns and rows you want to use for your mailing labels.
In the Properties pane, click the Properties arrow and select Repeater Table. Then scroll through the list to the General properties. Enter the number of columns across you want in the Across field. Enter the number of rows down you want in the Down field.

© SunGard 2010 Advanced Cognos Reporting Page 200
Blocks within a cell
When you create mailing labels, you may want to display your information in blocks with a cell. Each cell is the actual mailing label. The blocks are how you format information within each individual mailing label. For example, if you want to display the name on the first line, have two address lines, followed by the city, state/province and postal code, you would need to manually insert 4 separate blocks within a cell. Because it is a repeater table, what you do to one cell will apply to all.
Spaces between query items
Within each individual block, you may also want to include spaces or commas to separate the values. For example, adding a comma and a space between the city and space or province. In order to add spaces, you must use the Toolbox tab and insert a Text Item next to the query item where you want the space or comma to display. Type either a comma or a space (or both) in the Text field, then press OK. The next query item will begin after the comma and space.
Note: If you did not want to sort on any of the items in this block, you could do a concatenation instead. In this example, you will sort by POSTAL_CODE so the query items will be added individually.

© SunGard 2010 Advanced Cognos Reporting Page 201
Steps
Follow these steps to create a new Repeater Table report for mailing labels. In this example, you will produce mailing labels that print 3 columns of data in 10 rows per page.
1. From Cognos Connection, click the Launch link in the top toolbar.
2. Select Report Studio.
3. In the Recently used packages field, select the Person Demographic package.
Note: You may need to wait while the Report Studio is initializing. You can also select the package by clicking the blue Person Demographic folder.
4. Click the Create a New Report or Template link.
5. Click the Repeater Table report style.
6. Click the OK button.
7. Click the Toolbox tab to add blocks to hold query items on separate lines.
8. Drag the Block item repeating objects container. This will hold the name data.
Notice that as you add data, a default number of rows and columns are created. You can change the number of rows and columns that display.
9. Drag the Block item to the cell three more times to hold the two address line and the city, state/province, and postal code query items.
You should have four blocks that look like the example below. As you add data, the blocks will expand.

© SunGard 2010 Advanced Cognos Reporting Page 202
10. Click the Source tab to add query items to the blocks.
11. From the Insertable Objects pane, expand the Person Demographic package by clicking on the plus icon.
12. Expand the Person Detail query subject by clicking on the plus icon.
13. Drag the MAILING_NAME_PREFERRED item to the top block in the cell.
14. Collapse the Person Detail query subject by clicking on the minus icon
15. Expand the ADDRESS_CURRENT query subject by clicking on the plus icon.
16. Drag the STREET_LINE_1 query item to the second block in the cell.
17. Drag the STREET_LINE_2 query item to the third block in the cell.
Note: If there is no STREET_LINE_2 data, the mailing label will automatically move the City line up so that there are no blank lines within the address.
18. Drag the CITY query item to the fourth block in the cell.
19. Click the Toolbox tab to add a text box after the CITY item.
20. Drag the Text Item next to the query item where you want the space or comma to display.
21. Type a comma and a space in the Text field, then press OK. The next query item will begin after the comma and space.
22. Click the Source tab to add query items to the blocks.
23. From the Insertable Objects pane, drag the STATE_PROVINCE item to the fourth block just to the right of text field containing the comma. Once you

© SunGard 2010 Advanced Cognos Reporting Page 203
see a blinking vertical black line release your mouse and the Query Item will be inserted.
24. Click the Toolbox tab again to add a text box after the STATE_PROVINCE item.
25. Drag the Text Item after the STATE_PROVINCE item where you want the space to display.
26. Type a space in the Text field, then press OK. The next query item will begin after the space.
27. Click the Source tab to add query items to the blocks.
28. From the Insertable Objects pane, drag the POSTAL_CODE item to the fourth block just to the right of text field containing the space. Once you see a blinking vertical black line release your mouse and the Query Item will be inserted.

© SunGard 2010 Advanced Cognos Reporting Page 204
29. The mailing labels are in 2 columns by 3 rows by default. You want to change the default to print mailing labels in 3 columns by 10 rows. In the Properties pane, click the Properties arrow and select Repeater Table.
30. Scroll through the list to the General properties.
31. Enter the number of columns across you want in the Across field.
32. Enter the number of rows down you want in the Down field.

© SunGard 2010 Advanced Cognos Reporting Page 205
33. Scroll to the Properties field. Double-click Table Properties or click Table Properties once then click the ellipse (…) icon.
34. Click the Fixed size checkbox.
35. Click the Apply button.
36. Click the OK button.
37. Click the Run Report icon to preview the mailing label report.
38. Click the Close [X] icon in the upper-right corner of the browser window to return to Report Studio.
39. Click the Save icon to save your work.
40. Enter a descriptive title such as 3 x 10 Mailing Labels in the Name field.
41. Click the Save button.

© SunGard 2010 Advanced Cognos Reporting Page 206
Filtering Data in a Mailing Label
Introduction
You can use the Filter icon to add a filter to your mailing label report. This allows you to select just the addresses you want based on your criteria. The Filter icon opens the Filter Query 1 window. Click the Add icon to open the Detail Filter Expression window where you can build your filter. As you select the items you want to filter, add the filter operator (such as less than, equals, etc...) and select the values, the Expression Definition field shows the current expression for the filter you are building.
Notes: The report does not show which filters have been applied. You can add a filter without adding the data you are filtering on to the mailing label report. For example, you can add just MAILING_NAME_PREFERRED and mailing address data but filter data based on nation, alumni or student status.
Detail Filter Expression window

© SunGard 2010 Advanced Cognos Reporting Page 207
Steps
In this example, you want to create a filter that only selects data from a specific nation. Steps to follow to add a filter to a report to include only selected data:
1. With the mailing label report open that you just created in the previous exercise, click the Filter icon.
2. Click the Add icon.
3. Expand the Address Current query subject.
4. Double-click the NATION_DESC item.
5. Enter an equals sign ( = ) in the Expression Definition field.
6. Click the Select Value icon above the Expression Definition field.
7. Select United States of America from the list or whatever nation you want to select.
Note: You may need to use the page down arrows to find the correct value. If you know the value you want to add, you can also enter it into the expression using single quotes.
8. Click the Insert button and leave the Usage set at Required and the Application set at Before auto aggregation.
9. Click the OK button.
Notice that the specific value you want to include is enclosed by single quotes.
10. Click the OK button again.
11. Click the Run Report icon to preview the mailing label report.
12. Click the Close [X] icon in the upper-right corner of the browser window to return to Report Studio.
13. Click the Save icon on the toolbar.

© SunGard 2010 Advanced Cognos Reporting Page 208
Sorting Data in a Mailing Label
Introduction
You can use the Sort icon at the top of the Cognos Connection window to sort the data in a mailing label. For instance, you may want to sort the mailing labels by postal code. In order to sort by a query item, you must have added the query item to the report.
For example, in the mailing labels that you are building in this section, you can sort by postal code because that is a value you added to the report. However, you cannot sort by last name because you are using the MAILING_ADDRESS_PREFERRED query item which displays the name starting with the first name. If you were to sort on the MAILING_ADDRESS_PREFERRED query item, you would sort by first name only.
Notice that once the query item is sorted, you can see a directional (sort ascending or sort descending) arrow next to the item that sorted. Notice that the sort arrow only appears in the first cell but will be applied to all.
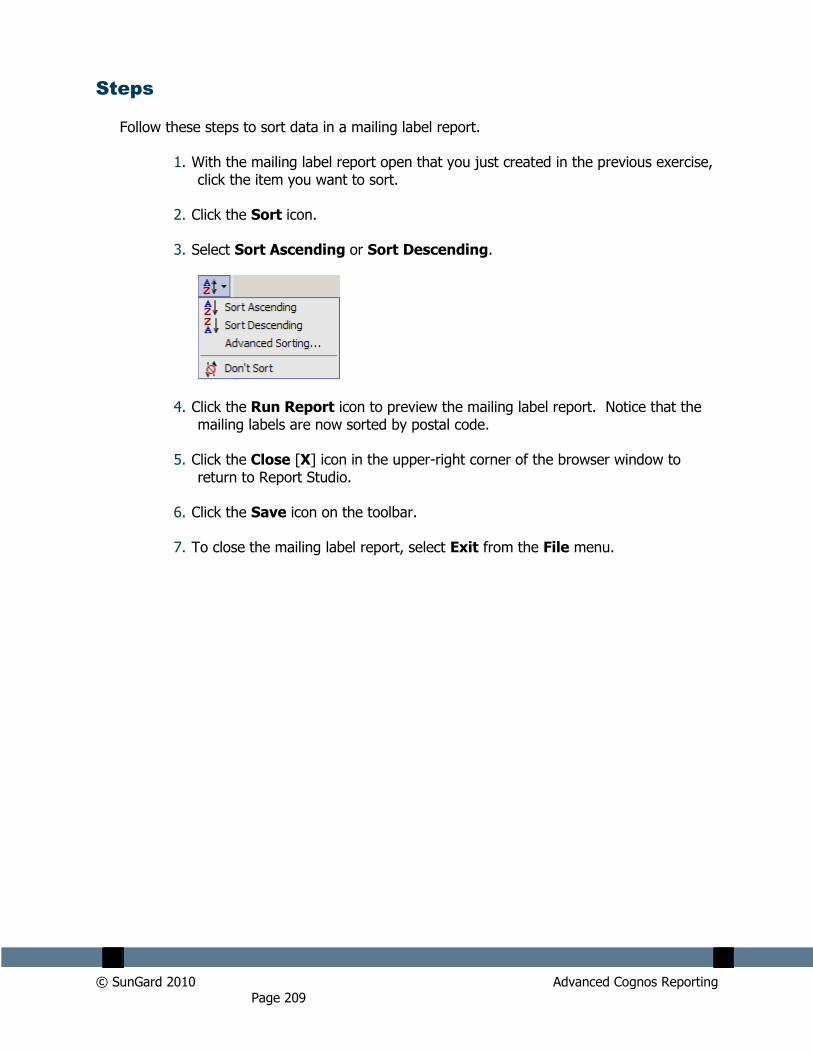
© SunGard 2010 Advanced Cognos Reporting Page 209
Steps
Follow these steps to sort data in a mailing label report.
1. With the mailing label report open that you just created in the previous exercise, click the item you want to sort.
2. Click the Sort icon.
3. Select Sort Ascending or Sort Descending.
4. Click the Run Report icon to preview the mailing label report. Notice that the mailing labels are now sorted by postal code.
5. Click the Close [X] icon in the upper-right corner of the browser window to return to Report Studio.
6. Click the Save icon on the toolbar.
7. To close the mailing label report, select Exit from the File menu.

© SunGard 2010 Advanced Cognos Reporting Page 210
Saving the Mailing Labels as a PDF File
Introduction
Once you create the mailing labels report, you can run the report and save the mailing labels that you produced for later use. You can also save the mailing labels as a PDF file that you can e-mail to a mailing fulfillment house.
At the top of the report window, the Keep this version link lets you choose to Email Report, Save Report, or Save as Report View.
Keep this version list
Steps
Steps to follow if the report is already in PDF format:
1. From the xx- Sample Report folder (or whatever folder you saved the report in), click the title to run the report.
2. Click the Keep this version link.
3. Click Save Report.
Steps
Steps to follow if the report is in HTML format:
1. Select a report and run it.
2. Once the report has displayed results, select the arrow next to the View in HTML format icon in the upper right corner of your display.

© SunGard 2010 Advanced Cognos Reporting Page 211
3. Select the View in PDF format link.
4. Click the Save button.
5. Save the report to your desktop or other location.

© SunGard 2010 Advanced Cognos Reporting Page 212
Printing the Mailing Labels
Introduction
Once you created the mailing labels, you can print the mailing labels in two ways. First, you can use the Print icon on your web browser. The second is to view the report in PDF format, then use the Print icon to print the entire document or just selected pages.
Print icons in PDF view

© SunGard 2010 Advanced Cognos Reporting Page 213
Steps
Steps to follow:
1. Select a report and run it.
2. Once the report has displayed results, select the arrow next to the View in HTML format icon in the upper right corner of your display.
3. Select the View in PDF format link.
4. Click the Open button.
5. Click the Print icon on the PDF toolbar.
6. Select the entire document or selected pages.
7. Click the OK button.

© SunGard 2010 Advanced Cognos Reporting Page 214
Working with Queries
Section goal
The goal of this section is to provide the knowledge and practice to work with multiple queries.
Objectives
In this section you will learn how to:
create multiple queries
combine data by forming a union
compare data using an intersect
compare data using an except
create a manual join
add SQL.

© SunGard 2010 Advanced Cognos Reporting Page 215
Creating Multiple Queries
You can also add, edit, or remove a filter from a delivered report. If you remove a data column from a delivered report, you will need to also manually remove the corresponding queries (filters) from the report if you do not want the data to be filtered in the report. For example, if you are filtering data based on Donor Association and you remove the Donor Association column from the report, the report is still filtering the data that is displayed by campus even though the column is no longer displayed. You must also remove Donor Association from any queries that might be using campus.
Query Explorer view
To access all queries for a report, point to the Query Explorer bar separating the work area from the Insertable Objects list. The Query Explorer window opens on top of the current work area. Click on Queries link to open the queries page in the work area.

© SunGard 2010 Advanced Cognos Reporting Page 216
Queries Page view
Once the Queries Page view is displayed, you can click on a query and delete it from the queries page. To delete an item, click on the item to highlight it, then click the Delete icon on the toolbar. This removes the prompt from the report, however, you still need to manually remove the filter from any other query that may also contain the filter.

© SunGard 2010 Advanced Cognos Reporting Page 217
Removing the filter from other queries
To remove the filter from any other query that may also contain the filter, you will need to open each query individually and check the Data Items column and Filter column. To navigate between queries, point to the Query Explorer bar separating the work area from the Insertable Objects list. The Query Explorer window opens on top of the current work area. Click the name of the query you want to view. If you see the item in the Data Items column or the Filter column, click on it to select it, then click the Delete icon. Be sure to check all queries in the report for the filter you want to delete.
To return to the original report page, point to the Page Explorer bar separating the work area from the Insertable Objects list and select Page 1 in the Report folder.

© SunGard 2010 Advanced Cognos Reporting Page 218
Steps
Follow these steps to remove a filter.
1. From the open copied report that you want to modify, point to the Query Explorer bar separating the work area from the Insertable Objects list.
2. Click the Queries link.
3. Click on the item you want to delete.
4. Click the Delete icon.
5. Point to the Query Explorer bar separating the work area from the Insertable Objects list.
6. Click on the first query in the list.
7. Review the Data Items, Detail Filters, and Summary Filters areas.
8. Highlight and delete any data item or filter you do not want using the Delete icon.
9. Repeat steps 6-8 for all remaining queries in the report.
10. Click the Save icon.
11. Point to the Page Explorer bar separating the work area from the Insertable Objects list.
12. Select Page 1 under the Report Pages folder to return the report view.
13. Click the Validate Report icon.
14. Enter variables as needed.
15. Click the Ok button.
16. Click the Run Report icon.

© SunGard 2010 Advanced Cognos Reporting Page 219
Combining Data by Forming a Union
Introduction
You can combine data from multiple queries with a union, an intersect, or an except. A union, intersect, and except are types of pre-determined joins. You can combine all the data from two queries into a single query with a union. You can combine just the data from each query that has a matching data item in the second query with an intersect. Or you can compare the data in query 1 to query 2 so that only data that does not have a matching data item is found.
Example

© SunGard 2010 Advanced Cognos Reporting Page 220
Comparing Data Using an Intersect
Introduction
You can combine data from multiple queries with an intersect. You can combine just the data from each query that has a matching data item in the second query with an intersect.

© SunGard 2010 Advanced Cognos Reporting Page 221
Comparing Data Using an Except
Introduction
You can compare the data in query 1 to query 2 so that only data that does not have a matching data item is found. You can use an Except on the Query page to compare data in two separate queries.

© SunGard 2010 Advanced Cognos Reporting Page 222
Creating a Manual Join
Introduction
You can use a join to manually combine data from two queries.
© SunGard 2010 Advanced Cognos Reporting Page 223
Adding SQL
Introduction
You can also join data from multiple queries using SQL statements that you can add to the report. This method is helpful if you need to combine data from multiple reporting packages.

© SunGard 2010 Advanced Cognos Reporting Page 224
Using Advanced Reporting
Techniques
Section goal
The goal of this section is to provide the knowledge and practice to use advanced reporting techniques such as variables, aggregate summaries, object rendering, and multiple page reporting.
Objectives
In this section you will learn how to:
use variables
add aggregate summaries
view object rendering using variables
work with multiple page reporting.

© SunGard 2010 Advanced Cognos Reporting Page 225
Using Variables
Introduction

© SunGard 2010 Advanced Cognos Reporting Page 226
Adding Aggregate Summaries
Introduction

© SunGard 2010 Advanced Cognos Reporting Page 227
Viewing Objects Rendering Using Variables
Introduction
© SunGard 2010 Advanced Cognos Reporting Page 228
Working with Multiple Pages Reporting
Introduction

© SunGard 2010 Advanced Cognos Reporting Page 229
Formatting Reports and Create
Report Templates
Section goal
The goal of this section is to provide the knowledge and practice to use advanced techniques to format reports.
Objectives
In this section you will learn how to:
work in the Page Structure View
add headers and footers
add a page break
apply conditional formatting to values
import a graphic element
create a report template.

© SunGard 2010 Advanced Cognos Reporting Page 230
Working in the Page Structure View
Introduction
Adding Headers and Footers
Introduction
Adding a Page Break
Introduction

© SunGard 2010 Advanced Cognos Reporting Page 231
Applying Conditional Styles
Introduction
You can also apply conditional formatting to values in the report if they meet certain criteria that you set. In this way you can color code values that you want to review because they are either too high or too low. The colors are automatically added when you select a default style from poor (red) to excellent (green).
Note: The color is automatically selected based on the style you choose. You can use the small Edit icon next to the color example to change the color if desired.
Conditional styles window
The Conditional Style icon opens an empty Conditional Styles window. Click the New icon at the bottom of the window to build your conditions.

© SunGard 2010 Advanced Cognos Reporting Page 232
Steps
In this training exercise, you want to format the report so that values above 200 are highlighted in green and values below 5 are highlighted in red. Follow these steps to add a conditional style.
1. Click in the ADDRESS_COUNT column (not column heading).
2. Click the Conditional Styles icon.
3. Click the New icon.
4. Select New Conditional style.
5. Select ADDRESS_COUNT.
6. Click the OK button.
Result: The Conditional Style – Numeric Range window opens.
7. Click the New icon at the bottom of the window.
8. Enter 5 in the Enter a value field.

© SunGard 2010 Advanced Cognos Reporting Page 233
9. Click the OK button.
10. Click the New icon to enter a second value.
11. Enter 200 in the Enter a value field.
12. Click the OK button.

© SunGard 2010 Advanced Cognos Reporting Page 234
13. Select Excellent in the highest value Style field.
14. Select Poor in the lowest value Style field.
Result: The highest and lowest values will be color coded green and red when the report is run.
15. Click the OK button.
16. Click the OK button again.
17. Click the Run Report icon to preview the report.
18. Select a nation in the NATION_DESC prompt field.
19. Click the Select All link below the STATE_PROVINCE prompt field.

© SunGard 2010 Advanced Cognos Reporting Page 235
20. Click the OK button.
Notice that the count of addresses per state greater than 200 are highlighted in green while the count of addresses per state below 5 are red.
21. Click the Close [X] icon in the upper-right corner of the browser window to return to Report Studio.
22. Click the Save icon to save your changes.

© SunGard 2010 Advanced Cognos Reporting Page 236
Importing a Graphic Element
Introduction
You can import a graphic element such as a logo into your report.
Creating a Report Template
Introduction

© SunGard 2010 Advanced Cognos Reporting Page 237
Appendix

© SunGard 2010 Advanced Cognos Reporting Page 238
Terminology
Attribute
A building block of information within a view. Many of the attributes in a view come directly from fields in the source database. Other attributes are derived from database fields either through calculations or the logic defined in a function.
Base View
A view of a primary or secondary composite table, which. A base view is used to add fields not extracted from the source database, or ERP, but required for the view, such as counts or other function-based values. In addition, the base view serves to insulate the user from changes to the architecture of the composite tables. Any changes to the underlying table can be handled through the creation of the base view. The Banner ODS builds all access to data via the base views
Business Intelligence
A term adopted within the technology industry to represent a broad category of applications for gathering, storing, analyzing, and providing access to data to help users make better business decisions. Applications within a business intelligence environment allow users to monitor the operations and financial soundness of the institution – they may preserve the organization‟s fiscal history, display its current state, and forecast future results using business intelligence data.
Change File
A file that captures and records key information about the updates, additions, and deletions of data in a master file. The creation of the Change File starts the incremental refresh process in the Banner ODS.
Change Tables
In Banner, Oracle tables that capture key information when data is changed. Change tables drive the incremental refresh of the Banner ODS process. They identify which information needs to be updated in the Banner ODS.
Cleansing

© SunGard 2010 Advanced Cognos Reporting Page 239
The process of translating, decoding, or resolving anomalies within source information that resides in Banner Operational Data Store.
Composite Table
A table within the Banner ODS that groups information from the source system‟s database tables to form the foundation from which views will be built.
Composite View
Views within Banner that contain the information that will be extracted into the Banner ODS. The ETL process pulls the information from the composite views into the composite tables of the Banner ODS.
Control report
In the Banner ODS, a report generated after a refresh process that indicates the status of the refresh. The report identifies whether the refresh process was successful, the elapsed time of the refresh, and any errors that might have occurred.
CSV
Comma Separated Values file. CSV is a normal format for files as they are downloaded or exported from an application. A CSV file can be opened and manipulated in common tools like Microsoft Excel.
Cube
A cube is a multidimensional data structure used to store presorted information that has been aggregated based on an underlying data relationship. Data structured in this way can be quickly processed and analyzed, because multiple dimensions can be examined at one time.
Customer Support Center
The Customer Support Center is our centralized support site where clients can access support resources for SunGard Higher Education (SGHE) products, and where they can go for support of UDC solutions. The support center itself is not part of the Unified Digital Campus.
Data
Recording facts or instructions on a storage medium for communication, retrieval, processing, or presentation.

© SunGard 2010 Advanced Cognos Reporting Page 240
Data Element
The smallest individual component part of data. A field‟s literal, technical name.
Data Link
A reference to a remote database, located on a completely different system from the local database.
Data Mart
A subset of a data warehouse that is designed for a particular subject area or branch of the organization‟s business, such as for the Admissions or Human Resource areas. Data marts are typically built and controlled by a single department in an organization.
Data Model
A map that displays the data elements that are included in the Banner ODS, and the transition of each data element from its origin in the ERP database to its location in the Banner ODS composite tables and views and Banner EDW star schemata.
Data Store
Also called Banner Operational Data Store (Banner ODS). A place that stores significant types and pieces of information for an organization, in a format that promotes ease of retrieval and analysis. Banner Operational Data Store (Banner ODS) facilitates operational ad hoc reporting by gathering, transforming, and storing data. The Data Store deals with information that is transactional in nature. It‟s short-lived, and may be here today and gone tomorrow. See Data Warehouse.
Data Transformation
The process of converting pieces of raw data into information that is logical, such as by decoding production data and merging information from multiple sources and formats.
Data Warehouse
Also called Enterprise Data Warehouse (Banner EDW). An informational database that stores data provided and shared by multiple databases. It enables an institution to keep “time slices” of data over time, over history, stored for easy retrieval and comparison. The data warehouse is an extension of the Data Store, which is the primary source of aggregated and detailed data. Partner applications can also be used to feed detailed data into the Banner EDW through the Banner ODS. The data warehouse is separated from the transaction stores, offering scalable performance, product independence and a streamlined extraction
© SunGard 2010 Advanced Cognos Reporting Page 241
process to support the reporting, query or uses of the data warehouse.
Of an Enterprise Data Warehouse (Banner EDW) an institution can ask the question, “How are we doing this month as compared to last month?” See Data Store.
Denormalized
Describes data that does not conform to any “normalized” form. Normalized data is data in its simplest format, without redundant attributes or keys. Data is normalized for ease when transporting it to another environment, or retrieving it for reporting purposes.
Dimension
A structural attribute of data that consists of pieces of information of a similar type. A Geography dimension, for example, may contain data about regions, countries, cities, states. A time dimension contains year, month, day and hour members. A multidimensional data structure allows data to be organized and analyzed in a concise, efficient way.
Dimension Table
A table that contains all the attributes (dimensions) or characteristics that describe observations and their associated measures (related numbers). Characteristics of the people, places, or things represented in the data are stored in the dimension tables. One row represents a unique combination of the characteristics in a particular dimension table. The unique combination is assigned a surrogate (sequential) key.
Dynamic Data
Data that is automatically updated every time something changes in the Oracle database.
Banner EDW (Banner Enterprise Data Warehouse)
See Data Warehouse.
Enterprise Resource Planning (ERP)
ERP is the term used to describe the transactional system. It‟s the combination of the major components of these systems (Student, Financial Aid, Human Resource, Finance, and Alumni/Advancement). It provides the core of information for the Banner ODS and the EDW.
Extract, Transform and Load (ETL)
In managing databases, Extract, Transformation, Load (ETL) refers to three separate

© SunGard 2010 Advanced Cognos Reporting Page 242
functions combined into a single programming tool.
The Extract function reads the data from a specified source database, and extracts a desired subset of data. Next, the Transformation function works with the acquired data, using rules or lookup tables, or creating combinations with other data to convert it to the desired state. Finally, the Load function writes the resulting data (either all of the subset or just the changes) to a target database, which may or may not previously exist.
The ETL process is used to populate Banner Operational Data Store (Banner ODS) from the source database. Another set of ETL processes is used to populate the enterprise data warehouse (Banner EDW) from Banner Operational Data Store (Banner ODS).
ETL Map Package Parameter
In the Administration tool, a parameter used to group mappings together into a job.
Facts/Measures
Numbers that are related to the attributes. Facts and measures (the terms are synonymous) generally represent counts, sums or percentages and other ratios. They may be stored and retrieved. They may be calculated from stored measures as the query is executed. Examples of facts/measures are total enrollment, or the number of employees, or the amount of all gifts to the institution.
Fact Table
A table that contains measures or numerical information used to perform an analysis. Detailed Fact tables store the most granular level detail in the data warehouse, and support information audit when linked to the source database. Summary Fact tables provide faster responses for queries.
Fine Grained Access
Terminology used by Oracle to identify how security can be applied to different tables and views. The Banner ODS use fine grained access security to manage user profile access.
Freeze Process
A process maintained within the Administration tool that allows you to identify what file(s) to capture at a specific moment in time, or “freeze,” and store inside the Banner ODS as new tables for later access. You can use the freeze process to create ad hoc or scheduled “snapshot” database tables.
Function

© SunGard 2010 Advanced Cognos Reporting Page 243
A small piece of code that uses specified logic to get information from the source database that isn‟t stored as a single field. For example, “Age” may not be stored as a field. Using a function that subtracts birth date from today‟s date and then determines whether the birth month has passed, Age can be provided as an attribute in a view.
The Banner ODS is designed to use functions where practical to calculate values, or determine the location of information within the Presentation Views.
Grant, Revoke and Privileges
While DDL statements such as Grant and Revoke can‟t be used directly in PL/SQL, they do have an effect on which SQL statements are legal. In order to Insert or Delete information on an Oracle table, you need permission. Permissions are manipulated via the Grant and Revoke SQL commands.
Job Killer
Gives you the ability to stop a process while it is running using the JOB KILLER parameter.
Key Attribute
Attributes that determine the level of information returned by the view. It is important for you to know the level at which information in a view is returned. For example, key attributes can determine whether a view returns one row of information for each person per condition, or simply one row for each person.
Incremental Refresh
Data in the Banner ODS is updated, or refreshed, at predetermined intervals of time. Only the data that has changed in the source database since the last refresh is updated.
Information
Data that human beings assimilate and evaluate to solve problems or make decisions.
Mapping
The activity of associating elements in the source system with their corresponding elements in the Banner ODS. When you run a job (schedule a process via the Administration Tool), it calls the related mappings and loads or updates the data defined by them.
The Banner ODS includes two main categories of mappings:
LOAD mappings: load data from the source system into the Banner ODS. These mapping names have the prefix LOAD_.

© SunGard 2010 Advanced Cognos Reporting Page 244
REFRESH mappings: update the Banner ODS with data that has changed in the source database. Mappings in this category have the prefix UPDATE_ or DELETE_.
Typically, these mappings exist in pairs. To completely refresh the data, run the DELETE mapping followed by its associated UPDATE mapping.
SunGard Higher Education delivers the Banner ODS with hundreds of mappings already defined. LOAD and REFRESH mappings exist for each composite table in the Banner ODS. To make them easier to work with, they are organized into groups by product areas. This gives you the ability to run one job that includes a group of mappings, say all of the Finance-related mappings, at one time. You can also run a single mapping, if desired.
Master Instance
The database where production data are located. This is also the location where the snapshot logs are run. The master instance is also called the master database or the production database.
Measure/Fact
See Facts/Measures.
Meta data
Literally, data about data. Descriptions of what kind of information is stored where,
how it is encoded, how it is related to other information, where it comes from, and
how it is related to your institution. The information describes data and other
structures, such as objects, business rules, and processes.
Multidimensional Cube
See Cube.
Multidimensional Database
A Database Management System (DBMS) optimized to support multi-dimensional
data.
Normalize
See Denormalized.
ODBC
Open Database Connectivity. A product is considered to be ODBC compliant if it allows you
© SunGard 2010 Advanced Cognos Reporting Page 245
to access a relational database in a client/server environment. An example would be using your PC in your office to retrieve information in a database stored in another location.
Online Analytical Processing (OLAP)
Dynamic, multi-dimensional analysis of historical data which supports activities such as:
Calculating across dimensions and through hierarchies
Analyzing trends
Drilling up and down through hierarchies
Rotating to change the dimensional orientation
Banner Operational Data Store (Banner ODS)
See Data Store.
Banner ODS Instance
The database where all the Banner ODS functions, composite tables, and views are run.
OLAP
Online Analytical Processing. OLAP enables you to perform multi-dimensional analysis by allowing you to drill up, down, across and through information to see varying levels of detail.
Oracle Data Dictionary
Oracle stores information about the structure of the database in the Oracle data dictionary. The data itself is located in other areas and the data dictionary describes how the actual data is organized. The dictionary consists of tables and views that you can query in the same way you query any other database tables or views (the views are owned by Oracle user SYS).
Oracle Warehouse Builder (OWB)
OWB is the ETL tool used to extract data from the ERP and move it to composite tables in the Banner ODS. It is also the tool used to extract the data from the Banner ODS and load it into the Banner EDW.
It is designed to move and transform data, develop and implement data warehouses, perform meta data management, or create and manage Oracle databases and meta data. In

© SunGard 2010 Advanced Cognos Reporting Page 246
addition to its graphical user interface (GUI), Warehouse Builder provides an API in the form of Oracle MetaBase Plus (OMB Plus), where all Warehouse Builder functionality can be accessed using the OMB Scripting Language.
Package
A collection of functions and/or procedures that are managed and owned by a single object.
Physical Table
A table where data is actually stored in a database.
PL/SQL
The 3GL Oracle procedural language extension of SQL. PL/SQL enables you to mix SQL statements with procedural constructs. PL/SQL combines the ease and flexibility of SQL with the procedural functionality of a structured programming language, such as IF...THEN, WHILE, and LOOP. Even when PL/SQL is not stored in the database, applications can send blocks of PL/SQL to the database rather than individual SQL statements, thereby reducing network traffic. With PL/SQL, you can define and execute PL/SQL program units such as procedures, functions, and packages. PL/SQL is interpreted and parsed at runtime; it does not need to be compiled.
Presentation View
A view that joins together multiple base views to make the information easier to access and report from. The primary purpose of a presentation view is to eliminate the need to join base views, and add in display defaults when present. The presentation view invokes Oracle‟s fine grained access to ensure proper access to data by a user.
Presentation View and Reporting View are synonymous terms.
Primary Composite Table
A composite table that manages its stored data using a “unique row per key” format. Typically, these tables are the owners of data, and are supported by secondary composite tables.
Privilege: Object vs. System
An object privilege allows an operation on a particular object (such as a table). A system privilege allows operations on an entire class of objects.
Procedure

© SunGard 2010 Advanced Cognos Reporting Page 247
A database object that is designed to perform a designated process. A procedure is similar to a function -- it is written using rules that are typically difficult for a report developer to create within a reporting tool. The primary difference between a procedure and a function is that a procedure is used to update data in the database whereas functions can only return values.
The Banner ODS uses procedures within the ETL process of populating the Composite Tables.
Reporting Views
See Presentation View.
Relational Online Analytical Processing (ROLAP)
A form of Online Analytical Processing (OLAP) that performs dynamic multidimensional analysis of data stored in a relational database rather than in a multidimensional database (which is usually considered the OLAP standard).
Role Based Security
Security provided within the Banner ODS that permits you to control who can access reporting information based on each person‟s role at the institution. The Banner ODS uses Oracle‟s fine grained access to implement its security.
Secondary Composite Table
A composite table that manages its information on a “many per key” format. Typically, these tables are used to support primary composites because the data can be associated with a specific value within the primary composite tables.
A secondary composite view is also referred to as a repeating view. It is a building block that contains a defined set of data that has an unlimited number of records in the ERP. It is passed through a display rule filter that slots a limited number of the repeating items for use in reporting. It is usually used in combination with other base composite views, but it may be used alone.
Slotted View A view that brings back user-defined information from the source database rather than all information.
Source Code
The all_source, dba_source, and user_source views contain the source code for stored procedures, functions, packages, and package bodies. Trigger source code is in the all_triggers, dba_triggers, and user_triggers views. If the stored object is wrapped, these views contain the encoded source rather than clear text.
© SunGard 2010 Advanced Cognos Reporting Page 248
Note: Within the Banner ODS DED, when you view source code, you see the encoded source.
Star Join
An optimal, denormalized form of organizing data to access a group of people, usually a department. Star joins are usually associated with data marts.
Star Schema
A standard technique for designing the tables of a data warehouse. It is a collection of related database objects, including logical structures such as tables, views, sequences, stored procedures, synonyms, indexes, clusters, and database links.
Star schemata are made up of fact tables, dimension tables and surrogate or calculate keys.
Fact tables each join to a larger number of independent dimension tables. The tables may be partially denormalized for performance, but most queries still need to join in one or more of the star tables.
A schema is owned by a database user and has the same name as that user; relational schemata are grouped by database user ID.
Synonym
A renaming of a table reference, similar to an alias for a select list item. A synonym is a data dictionary object and is created by the CREATE SYNONYM DDL statement.
Table
The object within the database where data is stored in a row and column format.
Translating Code
A code that associates a code in the source database with different code values in the Banner EDW. A translating code can translate one-to-one, or by range. More than one code in the source database can be associated with one code in the Banner EDW.
Trigger
Triggers are used to populate the change tables which aid in the incremental refresh process.
View
© SunGard 2010 Advanced Cognos Reporting Page 249
A grouping of information, also called “logical view.” A view is “logical” because the information in the view is grouped in a logical order, putting related information in the same section of the view. For instance, in the people-related views, you find all the name information together at the beginning of the view, followed by personal, biographical, and demographic information.
Most of the information in a view comes from fields within the source database tables. Some information is calculated from database fields or retrieved using an Oracle function. A single view can include up to 255 pieces of information, called attributes.