Banking Disclosure Statement 30 June 2017 - HSBC€¦ · Banking Disclosure Statement 30 June 2017....
40
These disclosures are prepared under the Banking (Disclosure) Rules (Unaudited) Banking Disclosure Statement 30 June 2017
-
Upload
trankhuong -
Category
Documents
-
view
216 -
download
1
Transcript of Banking Disclosure Statement 30 June 2017 - HSBC€¦ · Banking Disclosure Statement 30 June 2017....

These disclosures are prepared under
the Banking (Disclosure) Rules
(Unaudited)
Banking Disclosure Statement
30 June 2017

BANKING DISCLOSURE STATEMENT (unaudited)
Contents
Page
Introduction
Purpose 4
Basis of preparation 4
The banking disclosure statement 4
Capital and other disclosures
Basis of consolidation 5
Balance sheet reconciliation 6
Regulatory capital disclosures 8
Capital instruments 12
Capital ratios and buffer requirements 13
Countercyclical capital buffer ratio 13
Leverage ratio 14
Loans and advances to customers 16
Mainland activities 20
International claims 20
Off-balance sheet exposures other than derivative transactions 21
Foreign exchange exposure 22
Liquidity information 23
RWAs
Overview of the minimum capital requirements and RWAs 25
Credit risk for non-securitisation exposures 26
Counterparty credit risk 33
Market risk 38
Other information
Abbreviations 40
2

BANKING DISCLOSURE STATEMENT (unaudited) (continued)
Tables
Page
Ref Title
Captial and other disclosures
1 List of subsidiaries outside the regulatory scope of consolidation 5
2 Reconciliation of balance sheets – accounting to regulatory scope of consolidation 6
3 Detailed reconciliation of balance sheets to transition disclosures template 7
4 Transition disclosures template 8
5 Capital instruments 12
6 Capital ratios 13
7 Capital buffers 13
8 Geographical breakdown of RWA in relation to private sector credit exposures 13
9 Leverage ratio 14
10 Leverage ratio common disclosure template 14
11 Summary comparison table 15
12 Segmental analysis of loans and advances to customers by geographical area 16
13 Gross loans and advances to customers by industry sector 17
14 Analysis of gross loans and advances to customers by categories based on internal classification
used by the Group 18
15 Overdue loans and advances to customers 18
16 Rescheduled loans and advances to customers 19
17 Mainland activities exposures 20
18 International claims 20
19 Off-balance sheet exposures other than derivative transactions 21
20 Foreign exchange exposure 22
21 Average liquidity coverage ratio 23
22 Total weighted amount of high quality liquid assets 23
23 Liquidity coverage ratio 24
RWAs
OV1 Overview of RWA 25
Credit risk for non-securitisation exposures
CR1 Credit quality of exposures 26
CR2 Changes in defaulted loans and debt securities 26
CR3 Overview of recognised credit risk mitigation 26
CR4 Credit risk exposures and effects of recognised credit risk mitigation – for STC approach 27
CR5 Credit risk exposures by asset classes and by risk weights – for STC approach 28
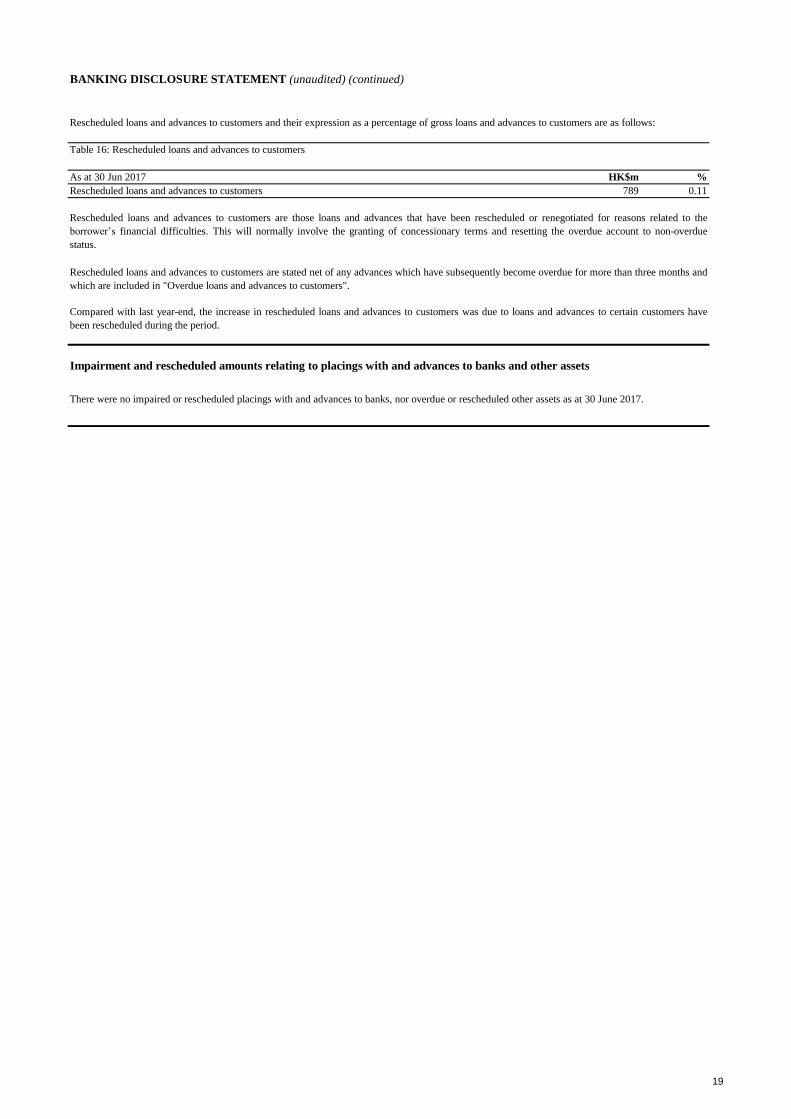
CR6 (1) Credit risk exposures by portfolio and PD ranges – for IRB approach (Wholesale) 29
CR6 (2) Credit risk exposures by portfolio and PD ranges – for IRB approach (Retail) 30
CR6 (3) Credit risk exposures by portfolio and PD ranges – for IRB approach (Total) 30
CR7 Effects on RWA of recognised credit derivative contracts used as recognised credit risk mitigation
– for IRB approach 31
CR8 RWA flow statement of credit risk exposures under IRB approach 31
CR10 (1) Specialised Lending under supervisory slotting criteria approach – other than HVCRE 32
CR10 (2) Equity exposures under the simple risk-weight method 32
Counterparty credit risk
CCR1 Analysis of counterparty default risk exposures (other than those to CCPs) by approaches 33
CCR2 CVA capital charge 33
CCR3 Counterparty default risk exposures (other than those to CCPs) by asset classes and by risk weights
– for STC approach 34
CCR4 Counterparty default risk exposures (other than those to CCPs) by portfolio and PD range – for IRB approach 35
CCR5 Composition of collateral for counterparty default risk exposures (including those for contracts or
transactions cleared through CCPs) 36
CCR8 Exposures to CCPs 37
Market risk
MR1 Market risk under STM approach 38
MR2 RWA flow statement of market risk exposures under IMM approach 38
MR3 IMM approach values for market risk exposures 39
MR4 Comparison of VaR estimates with gains or losses 39
3

BANKING DISCLOSURE STATEMENT (unaudited) (continued)
Introduction
Purpose
Basis of preparation
The banking disclosure statement
According to the BDR, disclosure of comparative information is not required unless otherwise specified in the standard disclosure templates.
Except where indicated otherwise, the financial information contained in this banking disclosure statement has been prepared on a consolidated
basis. The basis of consolidation for regulatory purposes is different from that for accounting purposes. Information regarding subsidiaries that
are not included in the consolidation for regulatory purposes is set out in the 'Basis of consolidation' section in this document.
The accounting policies applied in preparing this banking disclosure statement are the same as those applied in preparing the condensed
consolidated financial statements for the period ended 30 June 2017, as set out in note 2 on the condensed consolidated financial statements in the
2017 Interim Report.
The approaches used in calculating the Group’s regulatory capital or capital charge are in accordance with the Banking (Capital) Rules ("BCR").
The Group uses the advanced internal ratings-based approach to calculate its credit risk for the majority of its non-securitisation exposures. For
market risk, the Group uses an internal models approach to calculate its general market risk for the risk categories of interest rate and foreign
exchange (including gold) exposures and the standardised (market risk) approach for calculating other market risk positions. For operational risk,
the Group uses the standardised (operational risk) approach to calculate its operational risk.
The Hong Kong Monetary Authority ("HKMA") has implemented the Basel Committee on Banking Supervision ("BCBS") final standards on
revised Pillar 3 disclosures issued in January 2015. These disclosures are supplemented by specific additional requirements of the HKMA set out
in the Banking (Disclosure) (Amendment) Rules 2016 ("BDAR"). The banking disclosure statement includes the information required under the
BDR.
The information contained in this document is for Hang Seng Bank Limited ("the Bank") and its subsidiaries (together "the Group") to comply
with the Banking (Disclosure) Rules ("BDR") made under section 60A of the Banking Ordinance.
While the banking disclosure statement is not required to be externally audited, the document has been verified internally in accordance with the
Group’s policies on disclosure and its financial reporting and governance processes.
4

BANKING DISCLOSURE STATEMENT (unaudited) (continued)
Capital and other disclosures
Basis of consolidation
Table 1: List of subsidiaries outside the regulatory scope of consolidation
Principal activities Total assets* Total equity*
HK$m HK$m
Hang Seng Futures Ltd Futures brokerages 102 102
Hang Seng Investment Management Ltd Fund management 1,450 1,397
Hang Seng Investment Services Ltd 9 9
Hang Seng Securities Ltd Stockbroking 3,891 1,441
Hang Seng Insurance Co. Ltd and its subsidiaries 126,645 10,016
Hang Seng Qianhai Fund Management Co. Ltd Asset management 197 190
* Prepared in accordance with HKFRS
The Group maintains a regulatory reserve to satisfy the provisions of the Banking Ordinance and local regulatory requirements for prudential
supervision purposes. As at 30 June 2017, the effect of this requirement is to restrict the amount of reserves which can be distributed to shareholders
by HK$5,479m.
There are no relevant capital shortfalls in any of the Group’s subsidiaries which are not included in its consolidation group for regulatory purposes as
at 30 June 2017.
The Group operates subsidiaries in different territories where capital is governed by local rules and there may be restrictions on the transfer of
regulatory capital and funds between members of the Group.
The basis of consolidation for financial accounting purposes is in accordance with Hong Kong Financial Reporting Standards ("HKFRS"), as
described in note 2 on the condensed consolidated financial statements in the 2017 Interim Report.
The basis of consolidation for regulatory purposes is different from that for accounting purposes. Subsidiaries included in the consolidation for
regulatory purposes are specified in a notice from the HKMA in accordance with section 3C(1) of the BCR.
For insurance entities, the figures shown above exclude deferred acquisition cost assets as these are derecognised for consolidation purpose due to the
recognition of the present value of in-force long-term insurance business ("PVIF") on long-term insurance contracts and investment contracts with
discretionary participation features at group level. The PVIF asset of HK$14,406m and the related deferred tax liability, however, are recognised at
the consolidated group level only, and are therefore also not included in the asset or equity positions for the standalone entities shown above.
As at 30 June 2017, there are no subsidiaries which are included within both the accounting scope of consolidation and the regulatory scope of
consolidation but the method of consolidation differs.
There are also no subsidiaries which are included within the regulatory scope of consolidation but not included within the accounting scope of
consolidation.
A list of these subsidiaries is shown below:
As at 30 Jun 2017
Provision of investment commentaries
Retirement benefits and life assurance
Subsidiaries not included in consolidation for regulatory purposes are securities and insurance companies that are authorised and supervised by a
regulator and are subject to supervisory arrangements regarding the maintenance of adequate capital to support business activities comparable to those
prescribed for authorised institutions under the BCR and the Banking Ordinance. The capital invested by the Group in these subsidiaries is deducted
from the capital base subject to certain thresholds, as determined in accordance with Part 3 of the BCR.
5

BANKING DISCLOSURE STATEMENT (unaudited) (continued)
Balance sheet reconciliation
Table 2: Reconciliation of balance sheets – accounting to regulatory scope of consolidation
Under regulatory
scope of
consolidation
HK$m HK$m
Assets
Cash and sight balances at central banks 15,872 15,872
Placings with and advances to banks 101,685 97,781
Trading assets 45,100 45,100
Financial assets designated at fair value 9,914 -
Derivative financial instruments 7,834 7,981
Loans and advances to customers 743,179 747,270
Financial investments 394,671 298,296
Investment in subsidiaries - 7,104
Subordinated loans to subsidiaries - 915
Interest in associates 2,094 -
Investment properties 10,034 7,158
Premises, plant and equipment 27,543 27,535
Intangible assets 15,176 437
Other assets 28,239 17,980 Total assets 1,401,341 1,273,429
Liabilities
Current, savings and other deposit accounts 1,012,827 1,012,515
Repurchase agreements – non-trading 6,770 6,770
Deposits from banks 4,127 4,127
Trading liabilities 78,380 78,380
Financial liabilities designated at fair value 4,039 3,504
Derivative financial instruments 8,641 8,906
Certificates of deposit and other debt securities in issue 1,151 1,151
Other liabilities 18,606 23,771
Liabilities under insurance contracts 112,472 -
Current tax liabilities 1,392 1,345
Deferred tax liabilities 5,697 3,471
Subordinated liabilities 2,342 2,342
Total liabilities 1,256,444 1,146,282
Equity
Share capital 9,658 9,658
Retained profits 107,787 90,132
Other equity instruments 6,981 6,981
Other reserves 20,414 20,376
Total shareholders’ equity 144,840 127,147
Non-controlling interests 57 -
Total equity 144,897 127,147
Total equity and liabilities 1,401,341 1,273,429
condensed consolidated
financial statements
The following tables together provide a reconciliation of the Group’s condensed consolidated statement of financial position, as published in the 2017
Interim Report, to the transition disclosures template in Table 4 of this document.
The following table sets out the Group’s condensed consolidated statement of financial position based on the accounting scope of consolidation and the
corresponding balances based on the regulatory scope of consolidation.
As at 30 Jun 2017
Balance sheet as in
6

BANKING DISCLOSURE STATEMENT (unaudited) (continued)
Table 3: Detailed reconciliation of balance sheets to transition disclosures template
Under regulatory Cross-referenced
scope of to capital
consolidation component
HK$m HK$m definition
Assets
Cash and sight balances at central banks 15,872 15,872
Placings with and advances to banks 101,685 97,781
Trading assets 45,100 45,100
of which: Valuation adjustments 15 (1)
Financial assets designated at fair value 9,914 -
Derivative financial instruments 7,834 7,981
of which: Valuation adjustments 40 (2)
Loans and advances to customers 743,179 747,270
of which: Impairment allowances eligible for inclusion in Tier 2 capital 868 (3)
Financial investments 394,671 298,296
of which: Valuation adjustments 207 (4)
Investment in subsidiaries 7,104
Subordinated loans to subsidiaries 915 (5)
Interest in associates 2,094 -
Investment properties 10,034 7,158
Premises, plant and equipment 27,543 27,535
Intangible assets 15,176 437 (6)
Other assets 28,239 17,980
of which: Deferred tax assets 192 (7)
Defined benefit pension fund net assets 48 (8)
Total assets 1,401,341 1,273,429
Liabilities
Current, savings and other deposit accounts 1,012,827 1,012,515
Repurchase agreements – non-trading 6,770 6,770
Deposits from banks 4,127 4,127
Trading liabilities 78,380 78,380
of which: Valuation adjustments 9 (9)
Financial liabilities designated at fair value 4,039 3,504
of which: Gains and losses due to changes in own credit risk on fair valued liabilities 2 (10)
Derivative financial instruments 8,641 8,906
of which: Valuation adjustments 4 (11)
Certificates of deposit and other debt securities in issue 1,151 1,151
Other liabilities 18,606 23,771
Liabilities under insurance contracts 112,472 -
Current tax liabilities 1,392 1,345
Deferred tax liabilities 5,697 3,471
of which: Deferred tax liabilities related to intangible assets 39 (12)
Deferred tax liabilities related to defined benefit pension fund 8 (13)
Subordinated liabilities 2,342 2,342 (14)
Total liabilities 1,256,444 1,146,282
Equity
Share capital 9,658 9,658 (15)
Retained profits 107,787 90,132 (16)
of which: Revaluation gains of investment properties 6,372 (17)
Regulatory reserve for general banking risks 5,479 (18)
Regulatory reserve eligible for inclusion in Tier 2 capital 2,495 (19)
Other equity instruments 6,981 6,981 (20)
Other reserves 20,414 20,376 (21)
of which: Cash flow hedge reserve (2) (22)
Revaluation reserve of properties 17,612 (23)
Total shareholders’ equity 144,840 127,147
Non-controlling interests 57 -
Total equity 144,897 127,147
Total equity and liabilities 1,401,341 1,273,429
As at 30 Jun 2017
Balance sheet as in
condensed consolidated
financial statements
The following table expands the balance sheet under the regulatory scope of consolidation to show separately the capital components that are reported in
the transition disclosures template in Table 4. The capital components in this table contain a reference that shows how these amounts are included in the
transition disclosures template in Table 4.
7

BANKING DISCLOSURE STATEMENT (unaudited) (continued)
Regulatory capital disclosures
Table 4: Transition disclosures template
Amounts subject
to pre-Basel III
treatment*
HK$m
1 (15)
2 Retained earnings (16)
3 Disclosed reserves (21)
Public sector capital injections grandfathered until 1 January 2018
6 CET1 capital before regulatory deductions
7 (1) + (2) + (4) +
(9) + (11)
8
9 - (6) - (12)
10 (7)
11 (22)
12 -
13
14 - (10)
15 - (8) - (13)
16 -
17 -
20
22
23
24
25
26
26a
(17) + (23)
26b (18)
26c
26d
26e -
28
29 CET1 capital 89,798
Total regulatory deductions to CET1 capital 30,368
27 Regulatory deductions applied to CET1 capital due to insufficient AT1 capital and
Tier 2 capital to cover deductions -
26f Capital investment in a connected company which is a commercial entity (amount
above 15% of the reporting institution's capital base) - -
Cumulative losses below depreciated cost arising from the institution's holdings of
land and buildings -
Capital shortfall of regulated non-bank subsidiaries -
Regulatory reserve for general banking risks 5,479
Securitisation exposures specified in a notice given by the Monetary Authority -
National specific regulatory adjustments applied to CET1 capital 29,463
Cumulative fair value gains arising from the revaluation of land and buildings (own-
use and investment properties) 23,984
of which: mortgage servicing rights Not applicable
of which: deferred tax assets arising from temporary differences Not applicable
Amount exceeding the 15% threshold Not applicable
of which: significant investments in the common stock of financial sector entities Not applicable
21 Deferred tax assets arising from temporary differences (amount above 10%
threshold, net of related tax liability) Not applicable
Mortgage servicing rights (amount above 10% threshold) Not applicable
19 Significant capital investments in CET1 capital instruments issued by financial
sector entities that are outside the scope of regulatory consolidation (amount above
10% threshold) - -
18 Insignificant capital investments in CET1 capital instruments issued by financial
sector entities that are outside the scope of regulatory consolidation (amount above
10% threshold) - -
Investments in own CET1 capital instruments (if not already netted off paid-in
capital on reported balance sheet) -
Reciprocal cross-holdings in CET1 capital instruments -
Gains and losses due to changes in own credit risk on fair valued liabilities 2
Defined benefit pension fund net assets (net of associated deferred tax liabilities) 40
Excess of total EL amount over total eligible provisions under the IRB approach -
Gain-on-sale arising from securitisation transactions -
Deferred tax assets net of deferred tax liabilities 192
Cash flow hedge reserve (2)
Goodwill (net of associated deferred tax liability) -
Other intangible assets (net of associated deferred tax liability) 398
CET1 capital: regulatory deductions
Valuation adjustments 275
120,166
5 Minority interests arising from CET1 capital instruments issued by consolidated
bank subsidiaries and held by third parties (amount allowed in CET1 capital of the
consolidation group) -
Not applicable
90,132
20,376
The following table sets out the detailed composition of the Group's regulatory capital at 30 June 2017 using the transition disclosures template as
specified by the HKMA. The table also shows those items that are currently benefiting from the Basel III transitional arrangements, and are consequently
subject to the pre-Basel III treatment, as set out in Schedule 4H to the BCR.
As at 30 Jun 2017
Directly issued qualifying CET1 capital instruments plus any related share premium 9,658
Component of
regulatory capital
Cross-referenced to
condensed
consolidated
balance sheetHK$m
4 Directly issued capital subject to phase out from CET1 capital (only applicable to
non-joint stock companies) Not applicable
CET1 capital: instruments and reserves
8

BANKING DISCLOSURE STATEMENT (unaudited) (continued)
Table 4: Transition disclosures template (continued)
Amounts subject
to pre-Basel III
treatment*
HK$m
30
31 (20)
32
33
35
36
37 -
38 -
41
i
ii
iii
iv
42
43
44
45
46 (14)
47
49
50
(3) + (19)
51
Collective impairment allowances and regulatory reserve for general banking risks
eligible for inclusion in Tier 2 capital 3,363
Tier 2 capital before regulatory deductions 5,705
of which: capital instruments issued by subsidiaries subject to phase out
arrangements -
48 Tier 2 capital instruments issued by consolidated bank subsidiaries and held by third
parties (amount allowed in Tier 2 capital of the consolidation group) -
Qualifying Tier 2 capital instruments plus any related share premium 2,342
Capital instruments subject to phase out arrangements from Tier 2 capital -
Tier 1 capital (Tier 1 = CET1 + AT1) 96,779
Tier 2 capital: instruments and provisions
Total regulatory deductions to AT1 capital -
AT1 capital 6,981
Regulatory deductions applied to AT1 capital due to insufficient Tier 2 capital to
cover deductions -
vii of which: Significant capital investments in CET1 capital instruments, AT1 capital
instruments and Tier 2 capital instruments issued by financial sector entities that
are outside the scope of regulatory consolidation -
vi of which: Insignificant capital investments in CET1 capital instruments, AT1 capital
instruments and Tier 2 capital instruments issued by financial sector entities that
are outside the scope of regulatory consolidation -
of which: Reciprocal cross holdings in CET1 capital instruments issued by
financial sector entities -
v of which: Capital investment in a connected company which is a commercial entity
(amount above 15% of the reporting institution's capital base) -
of which: Capital shortfall of regulated non-bank subsidiaries -
of which: Investments in own CET1 capital instruments -
of which: Excess of total EL amount over total eligible provisions under the IRB
approach -
41a Portion of deductions applied 50:50 to core capital and supplementary capital based
on pre-Basel III treatment which, during transitional period, remain subject to
deduction from Tier 1 capital -
National specific regulatory adjustments applied to AT1 capital -
40 Significant capital investments in AT1 capital instruments issued by financial sector
entities that are outside the scope of regulatory consolidation - -
39 Insignificant capital investments in AT1 capital instruments issued by financial
sector entities that are outside the scope of regulatory consolidation (amount above
10% threshold) - -
Investments in own AT1 capital instruments -
Reciprocal cross-holdings in AT1 capital instruments -
AT1 capital before regulatory deductions 6,981
AT1 capital: regulatory deductions
of which: AT1 capital instruments issued by subsidiaries subject to phase out
arrangements -
34 AT1 capital instruments issued by consolidated bank subsidiaries and held by third
parties (amount allowed in AT1 capital of the consolidation group) -
of which: classified as liabilities under applicable accounting standards -
Capital instruments subject to phase out arrangements from AT1 capital -
Qualifying AT1 capital instruments plus any related share premium 6,981
of which: classified as equity under applicable accounting standards 6,981
Component of
regulatory capital
HK$m
AT1 capital: instruments
As at 30 Jun 2017
Cross-referenced to
condensed
consolidated
balance sheet
9

BANKING DISCLOSURE STATEMENT (unaudited) (continued)
Table 4: Transition disclosures template (continued)
Amounts subject
to pre-Basel III
treatment*
HK$m
52 -
53 -
56
i
ii
iii
iv
57
58
59
59a
i
ii
iii
iv
60
61
62
63
65
66
67
68 CET1 capital surplus over the minimum CET1 requirement and any CET1 capital
used to meet the Tier 1 and Total capital requirement under s.3A, or s.3B, as the
case requires, of the BCR 11.41%
of which: bank specific countercyclical buffer requirement 1.068%
of which: G-SIB or D-SIB buffer requirement 0.750%
of which: capital conservation buffer requirement 1.250%
64 Institution specific buffer requirement (minimum CET1 capital requirement as
specified in s.3A, or s.3B, as the case requires, of the BCR plus capital conservation
buffer plus countercyclical buffer requirements plus G-SIB or D-SIB requirements) 7.568%
Tier 1 capital ratio 17.41%
Total capital ratio 20.22%
Capital ratios (as a percentage of risk weighted assets)
CET1 capital ratio 16.16%
Total risk weighted assets 555,759
vi of which: Significant capital investments in CET1 capital instruments, AT1 capital
instruments and Tier 2 capital instruments issued by financial sector entities that
are outside the scope of regulatory consolidation -
of which: Capital investment in a connected company which is a commercial entity -
v of which: Insignificant capital investments in CET1 capital instruments, AT1 capital
instruments and Tier 2 capital instruments issued by financial sector entities that
are outside the scope of regulatory consolidation -
of which: Defined benefit pension fund net assets -
of which: Investments in own CET1 capital instruments, AT1 capital instruments
and Tier 2 capital instruments -
Deduction items under Basel III which during transitional period remain subject to
risk-weighting, based on pre-Basel III treatment -
of which: Mortgage servicing rights -
Tier 2 capital 15,583
Total capital (Total capital = Tier 1 + Tier 2) 112,362
Total regulatory deductions to Tier 2 capital (9,878)
vii of which: Significant capital investments in CET1 capital instruments, AT1 capital
instruments and Tier 2 capital instruments issued by financial sector entities that
are outside the scope of regulatory consolidation -
vi of which: Insignificant capital investments in CET1 capital instruments, AT1 capital
instruments and Tier 2 capital instruments issued by financial sector entities that
are outside the scope of regulatory consolidation -
of which: Reciprocal cross holdings in CET1 capital instruments issued by
financial sector entities -
v of which: Capital investment in a connected company which is a commercial entity
(amount above 15% of the reporting institution's capital base) -
of which: Capital shortfall of regulated non-bank subsidiaries -
of which: Investments in own CET1 capital instruments -
of which: Excess of total EL amount over total eligible provisions under the IRB
approach -
56b Portion of deductions applied 50:50 to core capital and supplementary capital based
on pre-Basel III treatment which, during transitional period, remain subject to
deduction from Tier 2 capital -
56a Add back of cumulative fair value gains arising from the revaluation of land and
buildings (own-use and investment properties) eligible for inclusion in Tier 2 capital (10,793) ((17) + (23))*45%
National specific regulatory adjustments applied to Tier 2 capital (10,793)
55 Significant capital investments in Tier 2 capital instruments issued by financial
sector entities that are outside the scope of regulatory consolidation 915 - (5)
Reciprocal cross-holdings in Tier 2 capital instruments -
54 Insignificant capital investments in Tier 2 capital instruments issued by financial
sector entities that are outside the scope of regulatory consolidation (amount above
10% threshold) - -
Tier 2 capital: regulatory deductions
Investments in own Tier 2 capital instruments -
As at 30 Jun 2017
Component of
regulatory capital
HK$m
Cross-referenced to
condensed
consolidated
balance sheet
10

BANKING DISCLOSURE STATEMENT (unaudited) (continued)
Table 4: Transition disclosures template (continued)
Amounts subject
to pre-Basel III
treatment*
HK$m
69
70
71
74
75
77
78
79
80
81
82
83
84
85
*
Notes to the template:
Elements where a more conservative definition has been applied in the BCR relative to that set out in Basel III capital standards:
Hong Kong
basis
Basel III
basis
HK$m HK$m
10 Deferred tax assets net of deferred tax liabilities 192 68
Explanation
The amount of the 10% /15% thresholds mentioned above is calculated based on the amount of CET1 capital determined under the Banking (Capital)
Rules.
As at 30 Jun 2017
As set out in paragraphs 69 and 87 of the Basel III text issued by the Basel Committee (December 2010), DTAs that rely on future profitability of the
bank to be realized are to be deducted, whereas DTAs which relate to temporary differences may be given limited recognition in CET1 capital (and hence
be excluded from deduction from CET1 capital up to the specified threshold). In Hong Kong, an AI is required to deduct all DTAs in full, irrespective of
their origin, from CET1 capital. Therefore, the amount to be deducted as reported in row 10 may be greater than that required under Basel III.
The amount reported under the column "Basel III basis" in this box represents the amount reported in row 10 (i.e. the amount reported under the "Hong
Kong basis") adjusted by reducing the amount of DTAs to be deducted which relate to temporary differences to the extent not in excess of the 10%
threshold set for DTAs arising from temporary differences and the aggregate 15% threshold set for MSRs, DTAs arising from temporary differences and
significant investments in CET1 capital instruments issued by financial sector entities (excluding those that are loans, facilities and other credit exposures
to connected companies) under Basel III.
Remarks:
Amount excluded from Tier 2 capital due to cap (excess over cap after redemptions
and maturities) -
This refers to the position under the Banking (Capital) Rules in force on 31 December 2012.
Amount excluded from AT1 capital due to cap (excess over cap after redemptions
and maturities) -
Current cap on Tier 2 capital instruments subject to phase out arrangements -
Amount excluded from CET1 due to cap (excess over cap after redemptions and
maturities) Not applicable
Current cap on AT1 capital instruments subject to phase out arrangements -
Capital instruments subject to phase-out arrangements
Current cap on CET1 capital instruments subject to phase out arrangements Not applicable
Provisions eligible for inclusion in Tier 2 in respect of exposures subject to the IRB
approach (prior to application of cap) 2,633
Cap for inclusion of provisions in Tier 2 under the IRB approach 2,694
Cap on inclusion of provisions in Tier 2 under the basic approach and the
standardised (credit risk) approach 730
76 Provisions eligible for inclusion in Tier 2 in respect of exposures subject to the basic
approach and the standardised (credit risk) approach (prior to application of cap) 732
Deferred tax assets arising from temporary differences (net of related tax liability) Not applicable
Applicable caps on the inclusion of provisions in Tier 2 capital
As at 30 Jun 2017
Component of
regulatory capital
HK$m
National Total capital minimum ratio Not applicable
Amounts below the thresholds for deduction (before risk weighting)
Mortgage servicing rights (net of related tax liability) Not applicable
73 Significant capital investments in CET1 capital instruments issued by financial
sector entities that are outside the scope of regulatory consolidation 7,701
72 Insignificant capital investments in CET1 capital instruments, AT1 capital
instruments and Tier 2 capital instruments issued by financial sector entities that are
outside the scope of regulatory consolidation 3,861
National CET1 minimum ratio Not applicable
National Tier 1 minimum ratio Not applicable
National minima (if different from Basel 3 minimum)
Cross-referenced to
condensed
consolidated
balance sheet
11

BANKING DISCLOSURE STATEMENT (unaudited) (continued)
Capital instruments
Table 5: Capital instruments
As at 30 June 2017
1
3
4
5
9
10
11
12
13
14
17
18
19
22
23
24
25
26
30
32
33
36
37
Footnote:
# Regulatory treatment of capital instruments subject to transitional arrangements provided for in Schedule 4H of the Banking (Capital) Rules
+ Regulatory treatment of capital instruments not subject to transitional arrangements provided for in Schedule 4H of the Banking (Capital) Rules
* Include solo-consolidated
1) Ordinary shares 2) Perpetual subordinated loan
(USD 900 million)
3) Subordinated loan due 2022
(USD 300 million)
Terms and conditionsTerms and conditions - Ordinary
shares
Terms and conditions – Perpetual
subordinated loan
Terms and conditions - Subordinated
loan due 2022
2Unique identifier (eg CUSIP, ISIN or Bloomberg
identifier for private placement)HK0011000095 N/A N/A
Issuer Hang Seng Bank Limited Hang Seng Bank Limited Hang Seng Bank Limited
Governing law(s) of the instrument Hong Kong law Hong Kong law Hong Kong law
Transitional Basel III rules# N/A N/A N/A
Regulatory treatment
6 Eligible at solo*/group/group &
soloGroup and Solo Group and Solo Group and Solo
Post-transitional Basel III rules+ Common Equity Tier 1 Additional Tier 1 Tier 2
8Amount recognised in regulatory capital
(Currency in million, as of most recent reporting date)HKD 9,658 million HKD 6,981 million HKD 2,342 million
7 Instrument type (types to be
specified by each jurisdiction)Ordinary shares Perpetual debt instrument Other Tier 2 instruments
Par value of instrument N/A USD 900 million USD 300 million
Original date of issuance Various 22-Dec-2014 06-Jul-2012
Accounting classification Shareholders' equity Shareholders' equity Liability – amortised cost
Original maturity date No maturity No maturity 06-Jul-2022
Perpetual or dated Perpetual Perpetual Dated
15 Optional call date, contingent call
dates and redemption amountN/A 22 December 2019 at par value N/A
Issuer call subject to prior supervisory approval N/A Yes No
16 Subsequent call dates, if
applicableN/A
Callable on any interest payment
date after first call dateN/A
Coupons / dividends
Fixed or floating dividend/coupon N/A Floating Floating
Existence of a dividend stopper N/A No No
Coupon rate and any related index N/A 12-month USD LIBOR + 3.84% 3-month USD LIBOR + 4.06%
21 Existence of step up or other
incentive to redeemN/A No No
20 Fully discretionary, partially
discretionary or mandatoryFully discretionary Fully discretionary Mandatory
Noncumulative or cumulative Noncumulative Noncumulative Cumulative
Convertible or non-convertible Non-convertible Non-convertible Non-convertible
If convertible, fully or partially N/A N/A N/A
If convertible, conversion trigger (s) N/A N/A N/A
27 If convertible, mandatory or optional
conversionN/A N/A N/A
If convertible, conversion rate N/A N/A N/A
29 If convertible, specify issuer of
instrument it converts intoN/A N/A N/A
28 If convertible, specify instrument
type convertible intoN/A N/A N/A
31 If write-down, write-down trigger(s) N/ANon-Viability Event. Hong Kong
Monetary Authority – Contractual
Non-Viability Event. Hong Kong
Monetary Authority – Contractual
Write-down feature No Yes Yes
If write-down, full or partial N/A Full Full
If write-down, permanent or temporary N/A Permanent Permanent
35
Position in subordination hierarchy in liquidation
(specify instrument type immediately senior to
instrument)
Represents the most subordinated
claim in liquidation
Subordinated to the claims of all
Senior Creditors (including any
holders of Tier 2 Instruments)
Subordinated to the claims of all Senior
Creditors
34 If temporary write-down, description of
write-up mechanismN/A N/A N/A
If yes, specify non-compliant features N/A N/A N/A
Non-compliant transitioned features No No No
The following is a summary of the Group’s common equity tier 1 ("CET1") capital, additional tier 1 ("AT1") capital and tier 2 capital instruments.
12

BANKING DISCLOSURE STATEMENT (unaudited) (continued)
Capital ratios and buffer requirements
Table 6: Capital ratios
30 Jun
2017
Footnote %
CET1 capital ratio 1 16.2
Tier 1 capital ratio 2 17.4
Total capital ratio 3 20.2
HK$m
CET1 captial 89,798
Tier 1 capital 96,779
Total capital 112,362
Total RWAs 555,759
1 CET1 capital ratio is equal to CET1 capital divided by total RWAs
2 Tier 1 capital ratio is equal to Tier 1 capital divided by total RWAs
3 Total capital ratio is equal to total capital divided by total RWAs
Table 7: Capital buffers
30 Jun
2017
%
Capital conservation buffer ratio 1.250
Countercyclical capital buffer ratio 1.068
Higher loss absorbency ratio 0.750
Total 3.068
Countercyclical capital buffer ratio
Table 8: Geographical breakdown of RWA in relation to private sector credit exposures
Jurisdiction
% HK$m % HK$m
1 Hong Kong 1.250 388,106
2 Mainland China - 55,121
3 Macau - 9,037
4 Singapore - 1,814
Total 454,078 1.068 4,851
The following tables show the capital ratios, risk-weighted assets ("RWAs") after the applicable scaling factor and capital buffers as contained in the
"Capital Adequacy Ratio" return required to be submitted to the HKMA on a consolidated basis under the requirements of section 3C(1) of the BCR.
Countercyclical capital buffer ("CCyB") is calculated as the weighted average of the applicable CCyB ratios in effect in the jurisdictions in which
banks have a private sector credit exposure. The Group uses booking country as the basis of geographical allocation for credit risk and risk country
for market risk, which is defined by considering the country of incorporation, location of guarantor, headquarter domicile, distribution of revenue and
booking country.
As at 30 June 2017, the applicable jurisdictional CCyB ("JCCyB") ratio in force in Hong Kong was 1.25%, as set by the HKMA. For the rest of the
jurisdictions in which the Bank had private sector credit exposures, the applicable JCCyB ratios were either at 0% or there was not yet an
announcement made by the corresponding regulators. The Hong Kong JCCyB ratio increased from 0.625% to 1.25% on 1 January 2017. The
exposure amounts of private sector increased comparing with last year-end, mainly driven by the loan growth.
CCyB amount
of AI
As at 30 June 2017
CCyB ratio of
AI
Applicable JCCyB ratio
in effect
Total RWA used in computation of
CCyB ratio of Authorised
Institution ("AI")
13

BANKING DISCLOSURE STATEMENT (unaudited) (continued)
Leverage ratio
Table 9: Leverage ratio
30 Jun
2017
Footnote %
Leverage ratio 4 7.3
Capital and leverage ratio exposure measure HK$m
Tier 1 capital 96,779
Total exposure measure 1,320,426
4 Leverage ratio is equal to Tier 1 capital divided by total exposure measure
Table 10: Leverage ratio common disclosure template
Leverage Ratio
Framework
30 Jun
2017
HK$m
On-balance sheet exposures
1 On-balance sheet items (excluding derivatives and SFTs, but including collateral) 1,259,115
2 Less: Asset amounts deducted in determining Basel III Tier 1 capital (reported as negative amounts) (30,354)
3 Total on-balance sheet exposures (excluding derivatives and SFTs) (sum of lines 1 and 2) 1,228,761
Derivative exposures
4 Replacement cost associated with all derivatives transactions (i.e. net of eligible cash variation margin) 2,296
5 Add-on amounts for PFE associated with all derivatives transactions 11,380
8 Less: Exempted CCP leg of client-cleared trade exposures (reported as negative amounts) -
9 Adjusted effective notional amount of written credit derivatives -
10 Less: Adjusted effective notional offsets and add-on deductions for written credit derivatives (reported as negative amounts) -
11 Total derivative exposures (sum of lines 4 to 10) 13,676
Securities financing transaction exposures
12 Gross SFT assets (with no recognition of netting), after adjusting for sales accounting transactions 7,323
13 Less: Netted amounts of cash payables and cash receivables of gross SFT assets (reported as negative amounts) -
14 CCR exposure for SFT assets 551
15 Agent transaction exposures -
16 Total securities financing transaction exposures (sum of lines 12 to 15) 7,874
Other off-balance sheet exposures
17 Off-balance sheet exposure at gross notional amount 419,068
18 Less: Adjustments for conversion to credit equivalent amounts (reported as negative amounts) (348,953)
19 Off-balance sheet items (sum of lines 17 and 18) 70,115
Capital and total exposures
20 Tier 1 capital 96,779
21 Total exposures (sum of lines 3, 11, 16 and 19) 1,320,426
Leverage ratio
22 Basel III leverage ratio 7.33%
6 Gross-up for derivatives collateral provided where deducted from the balance sheet assets pursuant to the
operative accounting framework
7 Less: Deductions of receivables assets for cash variation margin provided in derivatives transactions
(reported as negative amounts)
-
-
Leverage ratio decreased comparing with last year-end, reflecting the net effect of an increase in capital base and an increase in exposure mainly
driven by loan growth.
14

BANKING DISCLOSURE STATEMENT (unaudited) (continued)
Table 11: Summary comparison table
30 Jun
2017
HK$m
1 Total consolidated assets as per published financial statements 1,401,341
4 Adjustments for derivative financial instruments 5,695
5 Adjustment for securities financing transactions (i.e. repos and similar secured lending) 551
6 Adjustment for off-balance sheet items (i.e. conversion to credit equivalent amounts of off-balance sheet exposures) 70,115
7 Other adjustments (29,364)
8 Leverage ratio exposure 1,320,426
Leverage ratio
framework
Other adjustments mainly represent the regulatory deductions of property revaluation reserves and regulatory reserve to Tier 1 capital under the
leverage ratio framework.
2 Adjustment for investments in banking, financial, insurance or commercial entities that are consolidated
for accounting purposes but outside the scope of regulatory consolidation
3 Adjustment for fiduciary assets recognised on the balance sheet pursuant to the operative accounting
framework but excluded from the leverage ratio exposure measure
(127,912)
-
15

BANKING DISCLOSURE STATEMENT (unaudited) (continued)
Loans and advances to customers
Table 12: Segmental analysis of loans and advances to customers by geographical area
Individually
Gross impaired Overdue Individually Collectively
loans and loans and loans and assessed assessed
advances advances advances allowances allowances
As at 30 Jun 2017 HK$m HK$m HK$m HK$m HK$m
Hong Kong 630,275 1,939 1,656 614 715
Mainland China 87,950 918 239 509 229
Others 27,074 7 3 6 47
Total 745,299 2,864 1,898 1,129 991
Loans and advances to customers by geographical area are classified according to the location of the counterparties after taking into account the transfer of risk.
In general, risk transfer applies when a loan is guaranteed by a party located in an area that is different from that of the counterparty.
Compared with last year-end, gross loans and advances to customers increased by HK$44.4bn, or 6%, to HK$745.3bn at 30 June 2017.
16

BANKING DISCLOSURE STATEMENT (unaudited) (continued)
Table 13: Gross loans and advances to customers by industry sector
As at 30 Jun 2017 HK$m %
Industrial, commercial and financial sectors
- property development 57,788 41.5
- property investment 128,985 84.1
- financial concerns 6,574 56.8
- stockbrokers 50 60.0
- wholesale and retail trade 27,363 46.7
- manufacturing 24,359 40.4
- transport and transport equipment 13,255 56.0
- recreational activities 76 68.4
- information technology 5,211 7.8
- other 55,674 69.5
Individuals
- loans and advances for the purchase of flats under the
Government Home Ownership Scheme,
Private Sector Participation Scheme and
Tenants Purchase Scheme 20,361 100.0
- loans and advances for the purchase of other
residential properties 165,778 100.0
- credit card loans and advances 25,458 -
- other 24,222 51.7
Gross loans and advances for use in Hong Kong 555,154 72.8
Trade finance 43,230 22.9
Gross loans and advances for use outside Hong Kong 146,915 35.4
Gross loans and advances to customers 745,299 62.5
Trade finance lending maintained broadly the same level as last year-end.
Loans and advances for use outside Hong Kong rose by 3%, driven largely by lending on the Mainland. The Mainland loan portfolio grew by 10%, underpinned
by the expansion of corporate and commercial lending, trade finance and mortgages. The overall credit quality remained stable.
Collateral includes any tangible security that carries a fair market value and is readily marketable. This includes (but is not limited to) cash and deposits, stocks
and bonds, mortgages over properties and charges over other fixed assets such as plant and equipment. Where collateral values are greater than gross loans and
advances to customers, only the amount of collateral up to the gross loans and advances is included.
Compared with last year-end, loans and advances for use in Hong Kong increased by HK$39.6bn, or 8%, to HK$555.2bn at 30 June 2017. Lending to
industrial, commercial and financial sectors grew by 10%. Lending to property development and property investment sectors remained active, increasing by
11% and 8% respectively whilst lending to financial concern grew by 30%. The Bank’s continued efforts to support local business saw lending to wholesale
and retail trade and manufacturing sectors grew by 2% and 6% respectively. Lending to transport and transport equipment sector increased by 42% while
information technology sector decreased by 21%. Lending to ‘Other’ sector grew by 20%, due mainly to the granting of certain new working capital financing
facilities to large corporate customers.
Lending to individuals increased by 4%. We strengthened our mortgage sales capabilities in strategic areas to capture new business opportunities and grew our
residential mortgages and Government Home Ownership Scheme/Private Sector Participation Scheme/Tenants Purchase Scheme mortgages lending by 3% and
14% respectively. Credit card advances fell by 6%, due mainly to seasonal factors. Other loans to individuals grew by 19%.
Gross loans
and
advances
% of gross
advances
covered by
collateral
The analysis of gross loans and advances to customers by industry sector based on categories and definitions used by the HKMA is as follows:
17

BANKING DISCLOSURE STATEMENT (unaudited) (continued)
Table 14: Analysis of gross loans and advances to customers by categories based on internal classification used by the Group
Individually Collectively
assessed assessed Advances
loan loan New written off
Gross Overdue Impaired impairment impairment impairment during
advances advances advances allowances allowances allowances the period
As at 30 Jun 2017 HK$m HK$m HK$m HK$m HK$m HK$m HK$m
Residential mortgages 189,675 82 159 (4) (2) - -
Commercial, industrial and
international trade 168,242 1,314 2,234 (1,116) (628) 473 111
Commercial real estate 83,688 15 16 - (3) - -
Other property-related lending 166,393 349 429 (4) (14) 4 -
Table 15: Overdue loans and advances to customers
As at 30 Jun 2017 HK$m %
Gross loans and advances
which have been overdue with respect to
either principal or interest for periods of:
- more than three months but not more than six months 126 0.02
- more than six months but not more than one year 114 0.01
- more than one year 1,658 0.22
Total 1,898 0.25
of which:
- individually impaired allowances (465)
- covered portion of overdue loans and advances 1,200
- uncovered portion of overdue loans and advances 698
- current market value of collateral held against the
covered portion of overdue loans and advances 1,880
Loans and advances with a specific repayment date are classified as overdue when the principal or interest is overdue and remains unpaid at period-end.
Loans and advances repayable by regular instalments are treated as overdue when an instalment payment is overdue and remains unpaid at period-end.
Loans and advances repayable on demand are classified as overdue either when a demand for repayment has been served on the borrower but
repayment has not been made in accordance with the demand notice, or when the loans and advances have remained continuously outside the approved
limit advised to the borrower for more than the overdue period in question.
Overdue loans and advances decreased by HK$456m, or 19%, to HK$1,898m compared with last year-end, due mainly to the combined effect of the
downgrade of certain corporate and commercial customers, loan written off and rescheduled during the period. Overdue loans and advances as a
percentage of gross loans and advances to customers was down by 8 basis points to 0.25% at 30 June 2017.
The amount of repossessed assets as at 30 June 2017 was HK$31m.
Gross advances, overdue advances, impaired advances, individually assessed and collectively assessed loan impairment allowances, the amount of new
impairment allowances charged to income statement, and the amount of impaired loans and advances written off during the period in respect of
industry sectors which constitute not less than 10 per cent of gross loans and advances to customers are analysed as follows:
Compared with last year-end, the increase in individually assessed loan impairment allowances was due to downgrade of certain corporate customers.
Loans and advances to customers that are more than three months overdue and their expression as a percentage of gross loans and advances to
customers are as follows:
Collateral held with respect to overdue loans and advances is mainly residential properties, industrial properties, commercial properties and customer
deposits. The current market value of residential properties, industrial properties, commercial properties and customer deposits were HK$1,448m,
HK$29m, HK$295m and HK$53m respectively.
18
BANKING DISCLOSURE STATEMENT (unaudited) (continued)
Table 16: Rescheduled loans and advances to customers
As at 30 Jun 2017 HK$m %
Rescheduled loans and advances to customers 789 0.11
Impairment and rescheduled amounts relating to placings with and advances to banks and other assets
Rescheduled loans and advances to customers are stated net of any advances which have subsequently become overdue for more than three months and
which are included in "Overdue loans and advances to customers".
Compared with last year-end, the increase in rescheduled loans and advances to customers was due to loans and advances to certain customers have
been rescheduled during the period.
There were no impaired or rescheduled placings with and advances to banks, nor overdue or rescheduled other assets as at 30 June 2017.
Rescheduled loans and advances to customers and their expression as a percentage of gross loans and advances to customers are as follows:
Rescheduled loans and advances to customers are those loans and advances that have been rescheduled or renegotiated for reasons related to the
borrower’s financial difficulties. This will normally involve the granting of concessionary terms and resetting the overdue account to non-overdue
status.
19

BANKING DISCLOSURE STATEMENT (unaudited) (continued)
Mainland activities
Table 17: Mainland activities exposures
On-balance Off-balance
sheet sheet Total
exposure exposure exposures
As at 30 Jun 2017 HK$m HK$m HK$m
Type of Counterparties
1 Central government, central government-owned entities
and their subsidiaries and joint ventures ("JVs") 49,024 4,221 53,245
2 Local governments, local government-owned entities
and their subsidiaries and JVs 14,305 1,735 16,040
3 PRC nationals residing in Mainland China or other entities
incorporated in Mainland China and their subsidiaries and JVs 60,130 22,372 82,502
4 Other entities of central government not reported in item 1 above 4,902 872 5,774
5 Other entities of local governments not reported in item 2 above 3,560 222 3,782
6 PRC nationals residing outside Mainland China or
entities incorporated outside Mainland China where
the credit is granted for use in Mainland China 41,501 4,360 45,861
7 Other counterparties where the exposures are considered by
the reporting institution to be non-bank Mainland China exposures 16,897 1,161 18,058
Total 190,319 34,943 225,262
Total assets after provision 1,281,621
On-balance sheet exposures as percentage of total assets 14.85%
International claims
Table 18: International claims
Non Bank Non-Financial
Official Financial Private
Banks Sector Institution Sector Others Total
As at 30 Jun 2017 HK$m HK$m HK$m HK$m HK$m HK$m
Developed countries 63,396 42,742 13,581 46,587 - 166,306
Offshore centres 10,945 6,940 4,627 99,192 - 121,704
of which : Hong Kong SAR 2,952 1,347 3,548 81,651 - 89,498
Developing Asia and Pacific 73,913 8,132 7,172 57,993 - 147,210
of which : China 47,423 8,075 5,876 51,104 - 112,478
At 30 June 2017, only claims on Hong Kong SAR and China were the individual countries and territories or areas, which were not less than 10% of the
group’s total international claims.
The analysis of mainland activities exposures is based on the categories of non-bank counterparties and the type of direct exposures defined by the
HKMA Return of Mainland Activities - (MA(BS)20). This includes the mainland activities exposures extended by the Bank's Hong Kong offices and
its wholly owned banking subsidiary in mainland China.
On-balance sheet exposures as percentage of total assets remained stable as compared with 2016 year-end.
The Group’s country risk exposures in the table below are prepared in accordance with the HKMA Return of International Banking Statistics -
(MA(BS)21) guidelines. International claims are on-balance sheet exposures to counterparties based on the location of the counterparties after taking
into account the transfer of risk, and represent the sum of cross-border claims in all currencies and local claims in foreign currencies.
The table shows claims on individual countries and territories or areas, after recognised risk transfer, amounting to not less than 10% of the group’s
total international claims.
20

BANKING DISCLOSURE STATEMENT (unaudited) (continued)
Off-balance sheet exposures other than derivative transactions
Table 19: Off-balance sheet exposures other than derivative transactions
30 Jun
2017
HK$m
Contract amounts
Direct credit substitutes 7,717
Transaction-related contingencies 4,816
Trade-related contingencies 12,481
Forward forward deposits placed 982
Commitments that are unconditionally cancellable without prior notice 345,327
Commitments which have an original maturity of not more than one year 6,311
Commitments which have an original maturity of more than one year 41,436
Total 419,070
RWAs 47,237
The following table gives the nominal contract amounts and RWAs of contingent liabilities and commitments. The information is consistent with that in
the "Capital Adequacy Ratio" return required to be submitted to the HKMA by the Group. The return is prepared on a consolidated basis as specified by
the HKMA under the requirement of section 3C(1) of the BCR.
For accounting purposes, acceptances and endorsements are recognised on the balance sheet in "Other assets" and "Other Liabilities" in accordance with
HKAS 39 "Financial Instruments: Recognition and Measurement". For the purpose of the BCR, acceptances and endorsements are included in the
capital adequacy calculation as if they were contingencies.
21

BANKING DISCLOSURE STATEMENT (unaudited) (continued)
Foreign exchange exposure
The tables below summarise the net structural and non-structural foreign currency positions of the Group.
Table 20: Foreign exchange exposure
Other Total
foreign foreign
USD RMB currencies currencies
As at 30 Jun 2017 HK$m HK$m HK$m HK$m
Non-structural position
Spot assets 165,969 121,504 128,327 415,800
Spot liabilities (159,012) (112,374) (67,558) (338,944)
Forward purchases 408,651 226,295 32,538 667,484
Forward sales (412,951) (235,266) (93,327) (741,544)
Net options position 248 (252) (27) (31)
Net long/(short) non-
structural position 2,905 (93) (47) 2,765
Structural position - 14,700 1,053 15,753
The Group’s foreign exchange exposures mainly comprise foreign exchange dealing by Global Markets and currency exposures originated by its
banking business. The latter are transferred to Global Markets where they are centrally managed within foreign exchange position limits approved by the
Group’s Chief Risk Officer, noting the support of Risk Management Meeting ("RMM"). The net options position is calculated on the basis of delta-
weighted positions of all foreign exchange options contracts.
The Group’s gross structural foreign exchange exposure is represented by the net asset value of the Group’s foreign currency investments in
subsidiaries, branches and associates, and the fair value of the Group’s long-term foreign currency equity investments. The Group’s structural foreign
currency exposures are managed by the Group’s ALCO with the primary objective of ensuring, where practical, that the Group’s and the Bank’s capital
ratios are protected from the effect of changes in exchange rates.
At 30 June 2017, the US dollar ("USD"), was the currency in which the Group had non-structural foreign currency positions that was not less than 10%
of the total net position in all foreign currencies. The Group also had a Chinese renminbi ("RMB") structural foreign currency position, which was not
less than 10% of the total net structural position in all foreign currencies.
22

BANKING DISCLOSURE STATEMENT (unaudited) (continued)
Liquidity information
The average LCRs for the period are as follows:
Table 21 : Average liquidity coverage ratio
30 Jun
2017
31 Mar
2017
% %
Average LCR 256.7 267.7
Table 22: Total weighted amount of high quality liquid assets
30 Jun
2017
31 Mar
2017
HK$m HK$m
Level 1 assets 283,481 295,635
Level 2A assets 14,980 13,669
Level 2B assets 528 766
Total weighted amount of HQLA 298,989 310,070
Sources of funding
Currency mismatch
Additional contractual obligations
The Group allows currency mismatches to provide some flexibility in managing the balance sheet structure and to carry out foreign exchange trading, on
the basis that there is sufficient liquidity in the swap market to support currency conversion in periods of stress. The Group sets limits on LCR for all
material currencies based on liquidity in the swap markets. These limits are approved and monitored by Asset and Liability Management Committee
("ALCO").
Most of the Group’s derivative transactions are exchange rate contracts and interest rate contracts. Under the terms of our current collateral obligations
under derivative contracts (which are ISDA compliant CSA contracts), in the event of a three-notch downgrade in credit ratings, the additional collateral
required to post is immaterial.
Information relating to the Group’s approach to liquidity risk management can be found in the Risk Report of the Group’s Annual Report and Accounts
2016.
The composition of the Group's high quality liquid assets ("HQLA") as defined under Schedule 2 of the Banking (Liquidity) Rules is shown as below.
The majority of the HQLA held by the Group are Level 1 assets which consist mainly of government debt securities.
Weighted amount (Average
value) at quarter ended
Customer deposits in the form of current accounts and savings deposits payable on demand or at short notice form a significant part of our stable funding.
We also access wholesale funding markets by issuing senior secured and unsecured debt securities and borrowing from the secured repo markets against
high quality collateral, in order to supplement our customer deposits, to align asset and liability maturities and currencies and to maintain a presence in
local wholesale markets.
The liquidity position of the Group remained strong for the first half of 2017. The average LCR were 256.7% and 267.7% for the quarters ended 30 June
and 31 March 2017 respectively, compared with 257.1% for both the quarters ended 30 June and 31 March 2016.
The Banking (Liquidity) Rules were introduced by the HKMA in 2014 and became effective from 1 January 2015. Under rule 11(1), the Group is
required to calculate its Liquidity Coverage Ratio ("LCR") on a consolidated basis. During 2017 the Group is required to maintain a LCR of not less than
80%, increasing in steps of 10% each year to not less than 100% by January 2019. The NSFR is expected to be implemented in Hong Kong from 1
January 2018.
Quarter ended
23

BANKING DISCLOSURE STATEMENT (unaudited) (continued)
Table 23: Liquidity coverage ratio
Unweighted
amount
(Average
Value)
Weighted
amount
(Average
Value)
Unweighted
amount
(Average
Value)
Weighted
amount
(Average
Value)
HK$m HK$m HK$m HK$m
A High quality liquid assets
1 Total high quality liquid assets ("HQLA") 298,989 310,070
B Cash outflows
2 Retail deposits and small business funding, of which: 739,585 59,845 729,516 59,439
3 Stable retail deposits and stable small business funding 201,619 6,048 196,896 6,177
4 Less stable retail deposits and less stable small business funding 537,966 53,797 532,620 53,262
5 Retail term deposits and small business term funding - - - -
6 Unsecured wholesale funding (other than small business funding) and debt securities and
prescribed instruments issued by the institution, of which: 245,335 107,694 243,187 108,829
7 Operational deposits 54,826 13,061 54,436 13,512
8 Unsecured wholesale funding (other than small business funding) not covered in Row 7 190,436 94,560 188,751 95,317
9 Debt securities and prescribed instruments issued by the institution and redeemable
within the LCR period 73 73 - -
10 Secured funding transactions (including securities swap transactions) 9 10
11 Additional requirements, of which: 60,149 11,652 48,077 10,653
12 Cash outflows arising from derivative contracts and other transactions, and additional
liquidity needs arising from related collateral requirements 6,126 6,125 6,217 6,217
13 Cash outflows arising from obligations under structured financing transactions and
repayment of funding obtained from such transactions 502 502 554 554
14 Potential drawdown of undrawn committed facilities (including committed credit
facilities and committed liquidity facilities) 53,521 5,025 41,306 3,882
15 Contractual lending obligations (not otherwise covered in Section B) and other contractual
cash outflows 11,795 11,795 10,918 10,918
16 Other contingent funding obligations (whether contractual or non-contractual) 362,876 1,591 365,622 1,688
17 Total cash outflows 192,586 191,537
C Cash inflows
18 Secured lending transactions (including securities swap transactions) - - 38 -
19 Secured and unsecured loans (other than secured lending transactions covered in Row 18)
and operational deposits placed at other financial institutions 118,325 65,799 113,153 63,703
20 Other cash inflows 16,790 9,881 18,868 11,451
21 Total cash inflows 135,115 75,680 132,059 75,154
D Liquidity coverage ratio (Adjusted value)
22 Total HQLA 298,989 310,070
23 Total net cash outflows 116,906 116,383
24 LCR (%) 256.7% 267.7%
Basis of disclosure: consolidated
The following table sets out the required disclosure items under the Liquidity Coverage Ratio Standard Disclosure Template as specified by the HKMA. The number of
data points used in calculating the average value of the LCR and related components set out in this Template for the quarters ending on 30 June 2017 & 31 March 2017: (
71 and 73 data points respectively)
Quarter ended 30 Jun 2017
(71 data points)
Quarter ended 31 Mar 2017
(73 data points)
24

BANKING DISCLOSURE STATEMENT (unaudited) (continued)
RWAs
Overview of the minimum capital requirements and RWAs
Table OV1: Overview of RWA
30 Jun 31 Mar 30 Jun
2017 2017 2017
Footnote HK$m HK$m HK$m
1 Credit risk for non-securitisation exposures
2 of which: Standardised (credit risk) ("STC") approach
2a of which: Basic ("BSC") approach
3 of which: Internal ratings-based ("IRB") approach
4 Counterparty credit risk
5 of which: Standardised ("SA-CCR") approach 5
5a of which: Current exposure method ("CEM")
6 of which: Internal models (counterparty credit risk) ("IMM(CCR)") approach
7 Equity exposures in banking book under the market-based approach
8 Collective investment scheme ("CIS") exposures – Look-through approach ("LTA")
9 CIS exposures – Mandate-based approach ("MBA")
10 CIS exposures – Fall-back approach ("FBA")
11 Settlement risk
12 Securitisation ("S") exposures in banking book
13 of which: IRB(S) approach – ratings-based method
14 of which: IRB(S) approach – supervisory formula method
15 of which: STC(S) approach
16 Market risk
17 of which: Standardised (market risk) ("STM") approach
18 of which: Internal models ("IMM") approach
19 Operational risk
20 of which: Basic indicator ("BIA") approach
21 of which: Standardised (operational risk) ("STO") approach
21a of which: Alternative standardised ("ASA") approach
22 of which: Advanced measurement ("AMA") approach
23 Amounts below the thresholds for deduction (subject to 250% RW)
24 Capital floor adjustment
24a Deduction to RWA
24b
24c
25 Total
N/A: Not applicable in the case of Hong Kong
Using the standard template as specified by the HKMA, the following table provides an overview of the capital requirements in terms of detailed
breakdown of RWAs for credit risk (before any applicable scaling factor of 1.06 following a clarification from the HKMA in July 2017), market risk and
operational risk. Minimum capital requirement represents the amount of capital required to be held for that risk based on its RWAs after any applicable
scaling factor multiplied by 8%. Comparatives have been restated to align with the current period presentation.
- - -
2,838 3,330 239
4,609 5,324 381
386,178 378,645 32,748
5 Prior to the implementation of SA-CCR, exposures corresponding to the counterparty credit risk reported here are calculated using current exposure
method.
a b c
57,978 50,755 4,638
RWA
Minimum capital
requirements
444,156 429,400 37,386
- - -
- - -
- - -
15,652 14,768 1,327
- - -
- - -
- - -
- - -
- - -
- - -
7,588 7,081 607
- - -
7,570 7,074 606
18 7 1
- - -
52,284 51,597 4,183
- - -
52,284 51,597 4,183
19,250 19,265 1,632
N/A N/A N/A
(13,193) (12,766) (1,055)
- - -
530,346 514,669 44,461
of which: Portion of cumulative fair value gains arising from the revaluation of land
and buildings which is not included in Tier 2 Capital (13,191) (12,766) (1,055)
of which: Portion of regulatory reserve for general banking risks and collective
provisions which is not included in Tier 2 Capital (2) - -
Total RWAs (before any applicable scaling factor) increased by HK$15.7bn since last quarter. Credit risk RWA for non-securitisation exposures was
the main contributor and the key driver for its increase of HK$14.8bn was the changes in asset size (consisting of changes in book size and composition).
25

BANKING DISCLOSURE STATEMENT (unaudited) (continued)
Credit risk for non-securitisation exposures
Table CR1: Credit quality of exposures
As at 30 Jun 2017
1 Loans 3,136 852,337 2,120 853,353
2 Debt securities - 294,445 - 294,445
3 Off-balance sheet exposures - 419,070 - 419,070
4 Total 3,136 1,565,852 2,120 1,566,868
Table CR2: Changes in defaulted loans and debt securities
1 Defaulted loans and debt securities at end of the previous reporting period (31 Dec 2016) 3,235
2 Loans and debt securities that have defaulted since the last reporting period 868
3 Returned to non-defaulted status (120)
4 Amounts written off (452)
5 Other changes (395)
6 Defaulted loans and debt securities at end of the current reporting period (30 Jun 2017) 3,136
Table CR3: Overview of recognised credit risk mitigation
As at 30 Jun 2017 HK$m
1 Loans 311,840 541,513 390,673 116,609 -
2 Debt securities 287,263 7,182 - 6,590 -
3 Total 599,103 548,695 390,673 123,199 -
4 of which: Defaulted 764 1,243 1,046 2 -
HK$m HK$m HK$m HK$m
Using the standard templates as specified by the HKMA, the following tables provide detailed information relating to credit risk for non-securitisation
exposures and equity exposures under STC and IRB approaches.
a b c d
Gross carrying amounts of
Allowances/
impairments Net values
Defaulted
exposures
Non-defaulted
exposures
a
HK$m
HK$m HK$m HK$m HK$m
Amount
b1 b d fa
Exposures
unsecured:
carrying
amount
Exposures to be
secured
Exposures
secured by
recognised
collateral
Exposures secured
by recognised
guarantees
Exposures secured
by recognised
credit derivative
contracts
26

BANKING DISCLOSURE STATEMENT (unaudited) (continued)
Table CR4: Credit risk exposures and effects of recognised credit risk mitigation – for STC approach
As at 30 Jun 2017
%
Exposure classes
1 Sovereign exposures
2 Public sector entity ("PSE") exposures
2a of which: Domestic PSEs
2b of which: Foreign PSEs
4 Bank exposures
5 Securities firm exposures
6 Corporate exposures
7 Collective investment scheme ("CIS")
exposures
8 Cash items
10 Regulatory retail exposures
11 Residential mortgage loans
13 Past due exposures
15 Total
9
HK$m HK$m HK$m HK$m
3
721 815
-
-
1,493 20,695 721 2,092
-
- - - -
Multilateral development bank exposures -
1,493 3,352
1,277
202 300
Significant exposures to commercial
entities
Other exposures which are not past due
exposures
-
10,644
12
88,413 3,839 57,978
- - - -
95,214
14
-
20,695
-
10
- -
- - - -
3,352
17,343
130 1
17,343 -
-
63
Exposures in respect of failed delivery on
transactions entered into on a basis other
than a delivery-versus-payment basis -
100
149
-
- - - -
- 202
4,154 7,016 181 7,196
4,719 22,661 944
cba fed
On-balance sheet
amount
Off-balance
sheet amount
On-balance
sheet amount
Off-balance
sheet amount RWA densityRWA
Exposures pre-credit conversion
factor ("CCF")
and pre-credit risk mitigation
("CRM")
Exposures post-CCF
and post-CRM RWA and RWA density
HK$m
34,506
-
-
31
-
-
-
- -
20
7
4,766
- 7
17,516 32,912
3,586 15
35,640
-
-
10,115
-
20
50
99
-
-
-
75
43
5,311
22,691
1,977 34,682
- 31
6,624
27

BANKING DISCLOSURE STATEMENT (unaudited) (continued)
Table CR5: Credit risk exposures by asset classes and by risk weights – for STC approach
a b c d e f g h ha i j
As at 30 Jun 2017
Risk weight 0% 10% 20% 35% 50% 75% 100% 150% 250% Others
HK$m HK$m HK$m HK$m HK$m HK$m HK$m HK$m HK$m HK$m HK$m
Exposure class
1 Sovereign exposures 131 - - - - - - - - - 131
2 PSE exposures 10,958 - 10,458 - - - - - - - 21,416
2a of which: Domestic PSEs - - 4,073 - - - - - - - 4,073
2b of which: Foreign PSEs 10,958 - 6,385 - - - - - - - 17,343
4 Bank exposures - - 31 - - - - - - - 31
5 Securities firm exposures - - - - - - - - - - -
6 Corporate exposures - - - - 413 - 34,476 - - - 34,889
7 CIS exposures - - - - - - - - - - -
8 Cash items - - - - - - - - - - -
10 Regulatory retail exposures - - - - - 4,781 - - - - 4,781
11 Residential mortgage loans - - - 18,116 3,322 213 1,954 - - - 23,605
13 Past due exposures 2 - - - - - - 200 - - 202
15 Total 11,091 - 10,489 18,116 3,735 4,994 43,627 200 - - 92,252
Total credit
risk
exposures
amount
(post CCF
and post
CRM)
3 Multilateral development bank
exposures - - - - - - - - - -
- - - - -
9 Exposures in respect of failed
delivery on transactions
entered into on a basis other
than a delivery-versus-
payment basis - - - - - -
-
7,197 - - -
12 Other exposures which are not
past due exposures - - - -
14 Significant exposures to
commercial entities - - - - - -
7,197 - -
- - - - -
28
BANKING DISCLOSURE STATEMENT (unaudited) (continued)
Table CR6 (1): Credit risk exposures by portfolio and probability of default ("PD") ranges – for IRB approach (Wholesale)
a b c d e f g h i j k l
HK$m HK$m % HK$m % % years HK$m % HK$m HK$m
Sovereign
266,855 - - 266,855 0.02 37 24.8 1.26 11,766 4 15
677 - - 677 0.22 2 45.0 1.00 216 32 1
- - - - - - - - - - -
- - - - - - - - - - -
- - - - - - - - - - -
- - - - - - - - - - -
- - - - - - - - - - -
- - - - - - - - - - -
267,532 - - 267,532 0.02 39 24.9 1.26 11,982 4 16 -
Bank
116,602 1,021 97.3 117,596 0.04 1,001 41.0 1.23 16,597 14 21
735 233 49.8 852 0.22 89 44.4 0.62 301 35 1
3,770 - - 3,770 0.37 88 45.0 0.79 2,048 54 6
955 1 18.6 955 0.63 34 45.0 0.61 673 70 3
573 1 0.2 573 0.92 47 44.4 0.97 496 86 2
- - - - - 3 - - - - -
5 - - 5 19.00 5 45.0 0.74 13 260 -
- - - - - - - - - - -
122,640 1,256 88.3 123,751 0.06 1,267 41.2 1.20 20,128 16 33 -
Corporate – small-and-medium sized corporates
1,804 907 26.6 2,045 0.11 105 21.5 4.06 343 17 -
1,578 830 27.8 1,808 0.22 100 27.0 3.60 529 29 1
7,032 1,507 35.1 7,561 0.37 143 28.3 2.61 2,407 32 8
9,894 1,082 26.9 10,185 0.63 201 37.9 2.33 5,217 51 24
15,585 3,868 27.3 16,639 1.48 565 28.7 2.56 8,983 54 70
1,404 418 29.8 1,528 3.74 74 30.7 1.90 1,068 70 17
29 - 55.0 29 15.59 2 39.8 2.89 41 141 2
- - - - - - - - - - -
37,326 8,612 28.7 39,795 1.02 1,190 30.6 2.61 18,588 47 122 710
Corporate – others
85,921 44,272 41.2 104,164 0.09 616 44.2 2.35 27,192 26 42
51,521 30,237 35.5 62,257 0.22 488 42.3 2.36 25,497 41 58
59,896 31,445 31.9 69,914 0.37 668 39.2 2.09 33,027 47 101
45,786 22,191 26.6 51,693 0.63 657 33.2 2.20 27,278 53 108
114,991 55,351 25.1 128,878 1.42 2,098 36.5 1.86 95,020 74 658
17,392 16,988 23.2 21,325 3.93 428 40.3 1.60 24,021 113 337
451 558 22.1 574 10.44 29 34.4 2.37 835 145 20
2,610 - 9.7 2,610 100.00 119 44.4 2.48 - - 1,159
378,568 201,042 31.3 441,415 1.39 5,103 39.4 2.12 232,870 53 2,483 5,685
Provisions
PD scale
0.00 to < 0.15
0.15 to < 0.25
RWA
density
Expected
loss ("EL")RWAAs at 30 Jun 2017
0.50 to < 0.75
100.00 (Default)
Sub-total
0.75 to < 2.50
2.50 to < 10.00
10.00 to < 100.00
100.00 (Default)
Sub-total
0.00 to < 0.15
Sub-total
Original
on-balance
sheet gross
exposure
Off-balance
sheet
exposures
pre-CCF
Average
CCF
Exposure at
default
("EAD")
post-CRM
and post-
CCF
Average
PD
Number of
obligors
Average
loss given
default
("LGD")
Average
maturity
0.25 to < 0.50
0.50 to < 0.75
0.75 to < 2.50
2.50 to < 10.00
10.00 to < 100.00
100.00 (Default)
0.75 to < 2.50
2.50 to < 10.00
10.00 to < 100.00
0.50 to < 0.75
0.75 to < 2.50
2.50 to < 10.00
10.00 to < 100.00
100.00 (Default)
Sub-total
0.00 to < 0.15
0.15 to < 0.25
0.25 to < 0.50
0.15 to < 0.25
0.25 to < 0.50
0.00 to < 0.15
0.15 to < 0.25
0.25 to < 0.50
0.50 to < 0.75
29

BANKING DISCLOSURE STATEMENT (unaudited) (continued)
Table CR6 (2): Credit risk exposures by portfolio and PD ranges – for IRB approach (Retail)
a b c d e f g h i j k l
HK$m HK$m % HK$m % % years HK$m % HK$m HK$m
Retail – qualifying revolving retail exposures ("QRRE")
8,885 123,879 39.8 58,216 0.07 1,605,374 104.7 2,652 5 42
1,651 9,806 44.0 5,961 0.22 162,689 104.1 724 12 14
4,246 16,113 32.5 9,490 0.39 195,790 100.4 1,743 18 37
1,777 3,518 46.8 3,421 0.60 58,077 101.6 896 26 21
6,039 9,977 31.6 9,188 1.46 110,920 99.3 4,559 50 133
3,990 2,509 60.7 5,514 4.76 60,035 99.6 6,357 115 261
1,560 398 120.9 2,041 29.52 22,404 99.3 4,086 200 581
67 - - 67 100.00 854 93.5 - - 63
28,215 166,200 39.5 93,898 1.25 2,216,143 103.2 21,017 22 1,152 213
Retail – residential mortgage exposures
141,480 - - 141,480 0.04 72,788 10.0 21,268 15 6
8,066 - - 8,066 0.19 5,150 10.0 1,247 15 2
5,377 - - 5,377 0.35 3,217 10.0 832 15 2
2,232 - - 2,232 0.58 1,446 10.0 344 15 1
31,762 - - 31,762 1.63 15,260 10.0 5,666 18 52
1,418 - - 1,418 3.02 1,104 10.3 362 26 4
291 - - 291 13.30 268 10.0 146 50 4
210 - - 210 100.00 124 10.5 - - 22
190,836 - - 190,836 0.48 99,357 10.0 29,865 16 93 -
Retail – small business retail exposures
2,808 - - 2,808 0.07 1,027 4.4 22 1 -
439 - - 439 0.17 129 15.1 24 5 -
77 - - 77 0.43 15 23.8 12 16 -
369 - - 369 0.58 141 0.8 2 1 -
482 - - 482 1.23 205 5.5 29 6 -
520 - - 520 5.30 174 7.7 60 12 2
- - - - - - - - - -
- - - - - - - - - -
4,695 - - 4,695 0.82 1,691 5.9 149 3 2 -
Other retail exposures to individuals
2,850 1,951 10.2 3,049 0.07 27,815 12.1 80 3 -
1,284 1,947 13.3 1,543 0.20 23,838 14.3 89 6 -
869 1,070 15.2 1,032 0.43 13,505 48.8 327 32 2
2,352 8 21.1 2,354 0.54 16,439 71.5 1,261 54 9
3,086 983 26.5 3,347 1.57 28,504 55.0 2,231 67 31
3,002 166 26.6 3,046 4.81 26,003 65.6 2,939 96 98
634 16 38.3 640 15.91 7,336 71.8 895 140 74
19 - - 19 100.00 439 174.6 - - 33
14,096 6,141 15.2 15,030 2.28 143,879 47.3 7,822 52 247 114
Table CR6 (3): Credit risk exposures by portfolio and PD ranges – for IRB approach (Total)
a b c d e f g h i j k l
HK$m HK$m % HK$m % % years HK$m % HK$m HK$m
1,043,908 383,251 34.7 1,176,952 0.78 2,468,669 36.3 1.75* 342,421 29 4,148 6,722 Total (all portfolios)
*This refers to the total average maturity for wholesale portfolio only as maturity is not a parameter in the internal model approved by the HKMA on calculating risk-weight ("RW") on
retail portfolio.
ProvisionsEL
Original
on-balance
sheet gross
exposure
RWA
As at 30 Jun 2017
EL Provisions
RWA
RWA
density
Original
on-balance
sheet gross
exposure
Off-balance
sheet
exposures
pre CCF
Average
CCF
EAD
post CRM
and post-
CCF
Average
PD
Number
of obligors
Average
LGD
Average
maturity
RWA
density
0.15 to < 0.25
0.25 to < 0.50
0.50 to < 0.75
PD scale
Off-balance
sheet
exposures
pre CCF
Average
CCF
EAD
post CRM
and post-
CCF
Average
PD
Number
of obligors
Average
LGD
Average
maturity
0.75 to < 2.50
2.50 to < 10.00
10.00 to < 100.00
100.00 (Default)
Sub-total
0.00 to < 0.15
0.00 to < 0.15
0.15 to < 0.25
0.25 to < 0.50
0.50 to < 0.75
0.75 to < 2.50
2.50 to < 10.00
10.00 to < 100.00
100.00 (Default)
Sub-total
0.00 to < 0.15
0.15 to < 0.25
0.25 to < 0.50
0.50 to < 0.75
0.75 to < 2.50
2.50 to < 10.00
10.00 to < 100.00
100.00 (Default)
Sub-total
As at 30 Jun 2017
0.00 to < 0.15
0.15 to < 0.25
0.25 to < 0.50
0.50 to < 0.75
0.75 to < 2.50
2.50 to < 10.00
10.00 to < 100.00
100.00 (Default)
Sub-total
30

BANKING DISCLOSURE STATEMENT (unaudited) (continued)
Table CR7: Effects on RWA of recognised credit derivative contracts used as recognised credit risk mitigation – for IRB approach
As at 30 Jun 2017
1 Corporate – Specialised lending under supervisory slotting criteria approach (project finance)
2 Corporate – Specialised lending under supervisory slotting criteria approach (object finance)
3 Corporate – Specialised lending under supervisory slotting criteria approach (commodities finance)
5 Corporate – Specialised lending (high-volatility commercial real estate)
6 Corporate – Small-and-medium sized corporates
7 Corporate – Other corporates
8 Sovereigns
9 Sovereign foreign public sector entities
10 Multilateral development banks
11 Bank exposures – Banks
12 Bank exposures – Securities firms
13 Bank exposures – Public sector entities (excluding sovereign foreign public sector entities)
14 Retail – Small business retail exposures
15 Retail – Residential mortgages to individuals
16 Retail – Residential mortgages to property-holding shell companies
17 Retail – Qualifying revolving retail exposures ("QRRE")
18 Retail – Other retail exposures to individuals
19 Equity – Equity exposures under market-based approach (simple risk-weight method)
20 Equity – Equity exposures under market-based approach (internal models method)
23 Equity – Equity exposures under PD/LGD approach (other publicly traded equity exposures)
24 Equity – Equity exposures under PD/LGD approach (other equity exposures)
25 Equity – Equity exposures associated with equity investments in funds (CIS exposures)
26 Other – Cash items
27 Other – Other items
28 Total (under the IRB calculation approaches)
Table CR8: RWA flow statement of credit risk exposures under IRB approach
1 RWA as at end of previous reporting period (31 Mar 2017)
2 Asset size
3 Asset quality
4 Model updates
5 Methodology and policy
6 Acquisitions and disposals
7 Foreign exchange movements
8 Other
9 RWA as at end of reporting period (30 Jun 2017)
a b
11,082
(1,995)
-
- -
- -
Pre-credit
derivatives
RWA Actual RWA
HK$m HK$m
- -
4 Corporate – Specialised lending under supervisory slotting criteria approach (income-producing real estate) 7,093 7,093
18,588 18,588
232,870 232,870
- -
2,807 2,807
20,066 20,066
9,175 9,175
- -
149 149
28,672 28,672
62 62
- -
7,822 7,822
15,652 15,652
1,193 1,193
21,017 21,017
22 Equity – Equity exposures under PD/LGD approach (privately owned equity exposures held for long-term
investment) - -
- -
21 Equity – Equity exposures under PD/LGD approach (publicly traded equity exposures held for long-term
investment)
- -
- -
- -
36,447 36,447
401,830 401,830
- -
217 217
There is no effect in RWA, as the Group does not have credit derivative contracts used as recognised credit risk mitigation.
a
Amount
HK$m
378,645
212
-
1,672
(3,438)
386,178
RWA as at end of previous reporting period was restated to exclude 1.06 scaling factor following a clarification from the HKMA in July 2017. RWA
increased by HK$7.5bn during the second quarter of 2017, mainly due to the changes in asset size (consisting of changes in book size and composition).
31

BANKING DISCLOSURE STATEMENT (unaudited) (continued)
Table CR10 (1): Specialised lending under supervisory slotting criteria approach – other than high-volatility commercial real estate ("HVCRE")
As at 30 Jun 2017 a b c d(i) d(ii) d(iii) d(iv) d(v) e f
Project
finance
("PF")
Object
finance
("OF")
Commo-
dities
finance
("CF")
Income-
producing
real estate
("IPRE") Total
HK$m HK$m HK$m HK$m HK$m HK$m HK$m HK$m HK$m
Less than 2.5 years 825 434 50% - - - 1,066 1,066 533 -
Less than 2.5 years 576 28 70% - - - 583 583 408 3
Equal to or more than 2.5 years 5,251 715 70% - - - 5,432 5,432 3,802 21
Less than 2.5 years 29 - 70% - - - 29 29 20 -
Less than 2.5 years 1,353 91 90% - - - 1,388 1,388 1,250 11
Equal to or more than 2.5 years 1,164 45 90% - - - 1,175 1,175 1,059 9
19 - 115% - - - 19 19 21 1
- - 250% - - - - - - -
- - 0% - - - - - - -
9,217 1,313 - - - 9,692 9,692 7,093 45
^ Use of preferential risk-weights.
Table CR10 (2): Equity exposures under the simple risk-weight method
As at 30 Jun 2017 c e
Categories HK$m
Publicly traded equity exposures 69 - 300% 69 208
All other equity exposures 3,861 - 400% 3,861 15,444
Total 3,930 - 3,930 15,652
Strong^
Expected
loss
amountSupervisory
Rating
Grade Remaining Maturity
On-
balance
sheet
exposure
amount
Off-
balance
sheet
exposure
amount
Supervi-
sory risk-
weighted
("SRW")
EAD amount
Strong
RWA
Strong
Good^
Good
Good
Satisfactory
Weak
Default
Total
On-balance sheet
exposure amount
Off-balance sheet
exposure amount SRW EAD amount RWA
a b d
HK$m HK$m HK$m
32

BANKING DISCLOSURE STATEMENT (unaudited) (continued)
Counterparty credit risk
Table CCR1: Analysis of counterparty default risk exposures (other than those to CCPs) by approaches
As at 30 Jun 2017 Footnote
1 SA-CCR (for derivative contracts) 6
1a CEM
2 IMM (CCR) approach
3 Simple Approach (for SFTs)
4 Comprehensive Approach (for SFTs)
5 VaR for SFTs
6 Total
Table CCR2: CVA capital charge
As at 30 Jun 2017
Netting sets for which CVA capital charge is calculated by the advanced CVA method
1 (i) VaR (after application of multiplication factor if applicable)
2 (ii) Stressed VaR (after application of multiplication factor if applicable)
3 Netting sets for which CVA capital charge is calculated by the standardised CVA method
4 Total
HK$m HK$m HK$m
c d e f
HK$m HK$m
Replacement
cost ("RC")
Potential
exposure
("PFE")
Effective
expected
positive
exposure
("EPE")
Alpha (α)
used for
computing
default risk
exposure
Default risk
exposure after
CRM RWA
a b
Using the standard templates as specified by the HKMA, the following tables provide detailed information relating to counterparty credit risk arising from
derivative contracts and securities financing transactions ("SFT") with central counterparty ("CCP") or non-CCP and credit valuation adjustment ("CVA").
1,900 8,259 N/A 10,159 2,836
- - - - -
- - - -
- -
642 39
- -
2,875
a
6 Prior to the implementation of SA-CCR, exposures reported here are calculated using current exposure method.
-
b
RWA
HK$m
EAD post-
CRM
HK$m
-
1,710 10,120
-
1,710 10,120
-
33

BANKING DISCLOSURE STATEMENT (unaudited) (continued)
Table CCR3: Counterparty default risk exposures (other than those to CCPs) by asset classes and by risk weights – for STC approach
As at 30 Jun 2017 a b c ca d e f g ga h i
Risk weight
HK$m HK$m HK$m HK$m HK$m HK$m HK$m HK$m HK$m HK$m HK$m
Exposure class
1 Sovereign exposures - - - - - - - - - - -
2 PSE exposures - - 6 - - - - - - - 6
2a of which: Domestic PSEs - - 6 - - - - - - - 6
2b of which: Foreign PSEs - - - - - - - - - - -
- - - - - - - - - - -
4 Bank exposures - - - - - - - - - - -
5 Securities firm exposures - - - - - - - - - - -
6 Corporate exposures - - - - - - 354 - - - 354
7 CIS exposures - - - - - - - - - - -
8 Regulatory retail exposures - - - - - 46 - - - - 46
9 Residential mortgage loans - - - - - - - - - - -
- - - - - - - - - - -
- - - - - - - - - - -
12 Total - - 6 - - 46 354 - - - 406
11 Significant exposures to commercial
entities
10
0%
Other exposures which are not past due
exposures
Others
Total
default
risk
exposure
after
CRM250%
3 Multilateral development bank
exposures
150%10% 20% 35% 50% 75% 100%
34

BANKING DISCLOSURE STATEMENT (unaudited) (continued)
Table CCR4: Counterparty default risk exposures (other than those to CCPs) by portfolio and PD range – for IRB approach
As at 30 Jun 2017
PD scale
EAD post-
CRM Average PD
Number of
obligors Average LGD
Average
maturity RWA RWA density
ga b c d e f
Sovereign
%HK$m % % years HK$m
0.00 to < 0.15 - - - - - - -
- -
0.25 to < 0.50 - - - - - - -
0.15 to < 0.25 - - - - -
- -
0.75 to < 2.50 - - - - - - -
0.50 to < 0.75 - - - - -
- -
10.00 to < 100.00 - - - - - - -
2.50 to < 10.00 - - - - -
Bank
0.00 to < 0.15 8,683 0.05 114 37.5
- - Sub-total - - - - - - -
100.00 (Default) - - - - -
1.24 1,252 14
0.15 to < 0.25 556 0.22 13 36.7 1.09 196 35
0.25 to < 0.50 100 0.37 6 45.0 1.01 57 57
24 77
0.75 to < 2.50 229 0.97 5 45.0 1.01 210 92
0.50 to < 0.75 32 0.63 1 45.0 1.00
- -
10.00 to < 100.00 - - - - - - -
2.50 to < 10.00 - - - - -
Corporates
0.00 to < 0.15 37 0.11 12 50.1
- - Sub-total 9,600 0.09 139 37.7 1.22 1,739 18
100.00 (Default) - - - - -
2.01 12 32
0.15 to < 0.25 46 0.22 11 57.6 1.43 21 46
0.25 to < 0.50 87 0.37 17 54.4 1.60 52 60
85 72
0.75 to < 2.50 468 1.57 77 56.2 1.18 515 110
0.50 to < 0.75 117 0.63 22 54.5 1.15
58 150
10.00 to < 100.00 1 13.00 2 59.0 1.00 3 256
2.50 to < 10.00 39 3.84 15 56.7 1.05
Retail
0.00 to < 0.15 - - - -
- - Sub-total 795 1.29 156 55.6 1.27 746 94
100.00 (Default) - - - - -
- - -
0.15 to < 0.25 - - - - - - -
0.25 to < 0.50 - - - - - - -
- -
0.75 to < 2.50 - - - - - - -
0.50 to < 0.75 - - - - -
- -
10.00 to < 100.00 - - - - - - -
2.50 to < 10.00 - - - - -
- - Sub-total - - - - - - -
100.00 (Default) - - - - -
2,485 24
The Group has not used IMM(CCR) approach to calculate its default risk exposure.
Total (sum of all portfolios) 10,395 0.18 295 39.1 1.22
35

BANKING DISCLOSURE STATEMENT (unaudited) (continued)
Table CCR5: Composition of collateral for counterparty default risk exposures (including those for contracts or transactions cleared through CCPs)
As at 30 Jun 2017
1 Cash – domestic currency
2 Cash – other currencies
3 Domestic sovereign debt
4 Other sovereign debt
5 Government agency debt
6 Corporate bonds
7 Equity securities
8 Other collateral
9 Total
a b c d e f
Derivative contracts SFTs
Fair value of recognised
collateral received
Fair value of
posted collateral
Fair value of
recognised
collateral
Fair value of
posted
collateralSegregated Unsegregated Segregated Unsegregated
HK$m HK$m HK$m HK$m HK$m HK$m
- - - 99 - -
- 107 - - 6,770 -
- - - - - -
- - - - - 7,412
- - - - - -
- - - - - -
- - - - - -
- - - - - -
- 107 - 99 6,770 7,412
36

BANKING DISCLOSURE STATEMENT (unaudited) (continued)
Table CCR8: Exposures to CCPs
As at 30 Jun 2017
1 Exposures of the AI as clearing member or client to qualifying CCPs (total)
2 Default risk exposures to qualifying CCPs (excluding items disclosed in rows 7 to 10), of which:
3 (i) OTC derivative transactions
4 (ii) Exchange-traded derivative contracts
5 (iii) Securities financing transactions
6 (iv) Netting sets subject to valid cross-product netting agreements
7 Segregated initial margin
8 Unsegregated initial margin
9 Funded default fund contributions
10 Unfunded default fund contributions
11 Exposures of the AI as clearing member or client to non-qualifying CCPs (total)
12 Default risk exposures to non-qualifying CCPs (excluding items disclosed in rows 17 to 20), of which:
13 (i) OTC derivative transactions
14 (ii) Exchange-traded derivative contracts
15 (iii) Securities financing transactions
16 (iv) Netting sets subject to valid cross-product netting agreements
17 Segregated initial margin
18 Unsegregated initial margin
19 Funded default fund contributions
20 Unfunded default fund contributions
a b
Exposure after
CRM RWA
HK$m HK$m
24
118 2
118 2
- -
- -
- -
-
99 19
50 3
- -
-
- -
- -
- -
- -
- -
-
- -
- -
- -
37

BANKING DISCLOSURE STATEMENT (unaudited) (continued)
Market risk
Table MR1: Market risk under STM approach
a
RWA
As at 30 Jun 2017 HK$m
Outright product exposures
1 Interest rate exposures (general and specific risk) 18
2 Equity exposures (general and specific risk) -
3 Foreign exchange (including gold) exposures -
4 Commodity exposures -
Option exposures
5 Simplified approach -
6 Delta-plus approach -
7 Other approach -
8 Securitisation exposures -
9 Total 18
Table MR2: RWA flow statement of market risk exposures under IMM approach
1
3,686 3,388 - - - 7,074
2 Movement in risk levels (660) 1,123 - - - 463
3 Model updates/changes - - - - - -
4 Methodology and policy - - - - - -
5 Acquisitions and disposals - - - - - -
6 Foreign exchange movements 17 16 - - - 33
7 Other - - - - - -
8 3,043 4,527 - - - 7,570
a b c e fd
Using the standard templates as specified by the HKMA, the following tables provide detailed information relating to market risk under STM and IMM
approaches.
Stressed
VaR
Incremental risk
charge ("IRC") Other
Total
RWA
Comphrehensive
risk charge
("CRC")
HK$m HK$m HK$m HK$m HK$m
RWA as at end of reporting
period (30 Jun 2017)
RWA as at end of previous
reporting period (31 Mar 2017)
HK$m
Value at risk
("VaR")
38

BANKING DISCLOSURE STATEMENT (unaudited) (continued)
Table MR3: IMM approach values for market risk exposures
a
Value
As at 30 Jun 2017 HK$m
VaR (10 days – one-tailed 99% confidence interval)
1 Maximum Value 128
2 Average Value 87
3 Minimum Value 53
4 Period End 87
Stressed VaR (10 days – one-tailed 99% confidence interval)
5 Maximum Value 105
6 Average Value 85
7 Minimum Value 68
8 Period End 82
Incremental risk charge ("IRC") (99.9% confidence interval)
9 Maximum value -
10 Average value -
11 Minimum value -
12 Period end -
Comphrehensive risk charge ("CRC") (99.9% confidence interval)
13 Maximum value -
14 Average value -
15 Minimum value -
16 Period end -
17 Floor -
Table MR4: Comparison of VaR estimates with gains or losses
While comparing the daily VaR measures to the actual and hypothetical profit and loss ("P&L") for the backtesting, no loss side exception is observed.
Some profit side exceptions are identified for actual P&L and those are mainly driven by intraday profit arising from trading activities.
The backtesting process applies only to regulatory trading book positions. The actual P&L excludes reserve which are resulted from regulatory banking
book positions and also fee and commission which are non-modelled items.
39

BANKING DISCLOSURE STATEMENT (unaudited) (continued)
Other information
Abbreviations
A J
AI Authorised institution JCCyB Jurisdictional countercyclical capital buffer
ALCO Asset and Liability Management Committee JVs Joint ventures
AMA Advanced measurement approach L
ASA Alternative standardised approach LCR Liquidity coverage ratio
AT1 Additional tier 1 LGD Loss given default
B LTA Look through approach
Bank Hang Seng Bank Limited M
BCBS Basel Committee on Banking Supervision MBA Mandate-based approach
BCR Banking (Capital) Rules MSRs Mortgage servicing rights
BDAR Banking (Disclosure) (Amendment) Rules 2016 N
BDR Banking (Disclosure) Rules N/A Not applicable
BIA Basic indicator approach O
BSC Basic approach OF Object finance
C OTC Over-the-counter
CCF Credit conversion factor P
CCP Central counterparty P&L Profit and loss
CCR Counterparty credit risk PD Probability of default
CCyB Countercyclical capital buffer PF Project finance
CDS Credit default swap PFE Potential future exposure
CEM Current exposure method PRC People’s Republic of China
CET1 Common equity tier 1 PSE Public sector entity
CF Commodities finance PVIF Present value of in-force long-term
CIS Collective investment scheme insurance business
CRC Comprehensive risk charge Q
CRM Credit risk mitigation QRRE Qualifying revolving retail exposures
CSA Credit support annex R
CVA Credit valuation adjustment RC Replacement cost
D RMB Renminbi
D-SIB Domestic systematically important authorised RMM Risk Management Meeting
institution RNIV Risks not in VaR
DTAs Deferred tax assets RW Risk-weight
E RWA Risk-weighted asset/risk-weighted amount
EAD Exposure at default S
EL Expected loss S Securitisation
EPE Expected positive exposure SA-CCR Standardised approach for counterparty
F credit risk
FBA Fall-back approach SFT Securities financing transaction
G SRW Supervisory risk-weighted
G-SIB Global systematically important authorised institution STC Standardised (credit risk) approach
Group Hang Seng Bank Limited together with its subsidiaries STC(S) Standardised (securitisation) approach
H STM Standardised (market risk) approach
HK$bn Billions (thousands of millions) of Hong Kong dollars STO Standardised (operational risk) approach
HK$m Millions of Hong Kong dollars U
HKAS Hong Kong Accounting Standard USD US dollar
HKMA Hong Kong Monetary Authority V
HKFRS Hong Kong Financial Reporting Standards VaR Value at risk
Hong Kong The Hong Kong Special Administrative Region of the
People’s Republic of China
HVCRE High-volatility commercial real estate
HQLA High quality liquid assets
I
IMM Internal models approach
IMM(CCR) Internal models (counterparty credit risk) approach
IPRE Income-producing real estate
IRB Internal ratings-based approach
IRB(S) Internal ratings-based (securitisation) approach
IRC Incremental risk charge
ISDA International Swaps and Derivatives Association
40