Bank Recycling of Petro Dollars to Emerging Market ... · Bank Recycling of Petro Dollars to...
28
Bank Recycling of Petro Dollars to Emerging Market Economies During the Current Oil Price Boom Johannes Wiegand WP/08/180
Transcript of Bank Recycling of Petro Dollars to Emerging Market ... · Bank Recycling of Petro Dollars to...

Bank Recycling of Petro Dollars to Emerging Market Economies During the
Current Oil Price Boom
Johannes Wiegand
WP/08/180


© 2008 International Monetary Fund WP/08/180 IMF Working Paper Research Department
Bank Recycling of Petro Dollars to Emerging Market Economies During the Current Oil Price Boom
Prepared by Johannes Wiegand
Authorized for distribution by Krishna Srinivasan
July 2008
Abstract
This Working Paper should not be reported as representing the views of the IMF. The views expressed in this Working Paper are those of the author(s) and do not necessarily represent those of the IMF or IMF policy. Working Papers describe research in progress by the author(s) and are published to elicit comments and to further debate.
High oil prices have once again led to large external surpluses of oil exporting countries, similar to the 1970s and 1980s. This paper analyzes the extent to which (i) oil exporters use bank deposits to invest these surpluses, and (ii) banks are lending on these funds to emerging market economies. Bank recycling of petro dollars to emerging market economies is found to be almost as important as in the 1970s and 1980s, even though during the current boom, petro dollar bank flows tend to originate in countries like Russia, Libya, or Nigeria rather than in the Middle East. As one consequence, a fall in oil prices could yet again disrupt financing flows to emerging economies. Especially at risk could be countries that rely heavily on bank loans to finance external deficits, many of them in Emerging Europe. JEL Classification Numbers: F32, F34, G15, G21, Q33 Keywords: Petro dollars, capital flows, oil exporters, emerging markets, bank lending Author’s E-Mail Address: [email protected] The author is grateful to Helge Berger, Charles Collyns, Florence Jaumotte, Gianni de Nicolo, Krishna Srinivasan, and seminar participants at the IMF and the European Central Bank for helpful comments and suggestions. Xiangming Fang provided excellent research assistance.

2
Contents Page
I. Introduction………………......................................................………................……..........4
II. Data and Some Stylized Facts …………………………………………..............................6
III. Identification and Estimation Strategy ……........................................................................7
IV. Results………………………………………...…………..............................……...........10
A. Descriptive Statistics…......…........................................................................................10
B. Basic Estimation Results................................................................................................11
C. Detailed Results………...……………...........................................................................12
D. Region Specific Estimates.............................................................................................13
E. Robustness Checks and Extensions................................................................................14
Parameter Stability…….................................................................................................14
Dynamic Specifications….............................................................................................16
Feedback and Reverse Causality…...............................................................................17
Assets and Liabilities vs. Loans and Deposits………...……………............................18
V. Summary: Key Results and Implications for Emerging Market Vulnerabilities………....19
References………………………………………………….…………..……………….……21
Figures
1. Bank Flows to Emerging Markets, 1970-1985………...……………………………...……4 2. Emerging Markets: Current Account, 1970-2007……………………………………...…..4 3. Identifying and Estimating Petro-Dollar Bank Flows: Basic Scheme……………...…..…..8 4. Identifying and Estimating Petro-Dollar Bank Flows: Extended Scheme………...…..…..9 5. Cross-Border Loans, 1990-2007……………………………………...………………….11 6. Bank Loans by Recipient Region…………………...………………………………….…13 7. Regression Residuals...………………………………………………………....................15 8. Re-Recursive Estimation……….……………………………………………...……….....16 9. Non-Loan Asset Flows, 1996-2007...……………………………………………………..19 aFigure
Tables
1. Emerging Markets: Current Account Position by Region…………………………...........4 2. Oil Exporters: External Position and Deposit Flows into BIS-Reporting Banks, 2001-06...5 3. Correlation of Deposit Outflows with the IMF Average Oil Price.………………...…..…..7 4. Quarterly Flows into and out of BIS Reporting Bank, Q2 2001-Q4 2006...…………...…10 5. Basic Regression Results…....……….……………………………………………………11

3
6. Extended Regression Results...………………………………………………....................12 7. Region Specific Estimates..…….……………………………………………...……….....14 8. Dynamic Specifications………….....……………………………………………………..17 9. Feedback…….…………………………………………………………………………….18 10. Assets and Liabilities…………………………………………………………………….18 Appendices I. Country and Territory Groupings….….………………………………………….………..23 II. Detailed Descriptive Statistics ………………………………………...…………………25

4
I. INTRODUCTION
Petro dollar recycling is a familiar story from the 1970s. When oil prices rose sharply in the fall of 1973, oil exporting countries were faced with a windfall in export receipts. Much of these funds were saved and deposited with banks in industrial countries. The banks, in turn, lent on a large part of these fund to emerging economies, especially in Latin America (Figure 1). When the oil boom subsided in the early 1980s, bank flows to emerging markets reversed sharply, triggering the Latin American debt crisis. Petro dollar recycling is rarely considered a feature of the current oil price boom, however. Two factors may contribute to this perception.
• In contrast to the 1970s, emerging markets as a group have been running a sizeable and rising current account surplus in recent years (Figure 2). At least in the aggregate, no debt overhang comparable to the 1970s can therefore have built up.
• Bank flows are widely believed to have lost importance as a vehicle of investing oil (and other) surpluses. Instead, much attention has focused on vehicles that allow oil exporters to invest in global securities markets, such as Sovereign Wealth Funds.1
Neither point holds up to scrutiny, however.
• First, not all emerging market countries have been running external surpluses. In particular, Emerging Europe (excluding oil exporters) had on average a current account deficit of 4½ percent of GDP between 2001 and 2007—fully comparable to external deficits prevailing
1 See, for example, Johnson (2007) or Kimmit (2008).
Source: World Bank, Global Development Finance. Bank flows include short-term financing.
Figure 1: Bank Flows to Emerging Markets, 1970-1985 (billions of US$)
-30
-20
-10
0
10
20
30
40
1970 1973 1976 1979 1982 1985
All emerging markets
Latin America
Source: WEO (projections for 2007).
Figure 2: Emerging Markets: Current Account, 1970-2007 (percent of GDP)
-4-3-2
-1
012
34
1970 1976 1982 1988 1994 2000 2006
All emerging markets
Excluding oil exporters
incl. excl. incl. excl.
Africa and Middle East -0.1 -4.4 2.0 -2.4Emerging Asia -1.0 -1.0 3.7 3.7Europe and Central Asia -0.1 -1.4 0.3 -4.2Latin America -3.6 -4.1 0.2 -0.2
All regions -1.1 -2.2 1.8 0.9
Source: WEO.
oil exporters oil exporters
Table 1: Emerging Markets--Current Account Position by Region (percent of GDP)
2001-071973-83

5
in the 1970s and the early 1980s. Second, deposit outflows from oil exporting countries have not become negligible. Between 2001 and 2006, gross deposit outflows as reported by banks in BIS reporting countries accounted for 27 percent of oil exporters’ total gross financial outflows (Table 2).2 This compares to 44 percent reported by Boughton and Kumarapthy (2006) for the period 1973-79. The share is much higher for certain individual oil exporters, such as Russia, Libya, and Nigeria.
This paper uses an innovative empirical approach to analyze the scope and direction of bank recycling of petro dollars to emerging economies during the current oil price boom. Few other pieces of analysis share—to the author’s knowledge—this specific focus. An important exception is Boorman (2006), who draws similar conclusions as this paper but does so on the basis of simple descriptive statistics that would, in principle, also allow alternative interpretations. A recent paper by McGuire and Tarashev (2008) also contains some information on petro dollar bank flows, but falls short of identifying the final recipients of these flows. In a wider context, the paper contributes to a rapidly growing literature on the macroeconomic and financial effects of oil surpluses and the capital flows they trigger. Related work includes:
• Kilian et al. (2007) and Rebucci and Spatafora (2006) on oil surpluses and the financing of external imbalances. Balakrishnan et al. (2007) analyze petro dollar flows as one factor facilitating the financing of the U.S. current account deficit;
• Hartelius et al. (2008), Ahrend et al. (2006), Basher and Sadorsky (2006) and Maghyereh (2004) on the effect of oil prices on the valuation of traded securities, such as long-term bonds in industrial countries (Ahrend et. al), emerging market debt (Hartelius et al.), or emerging market equity;
2 Gross financial outflows are composed of outward portfolio flows, outward other flows, reserves outflows, and errors and omissions as reported in the World Economic Outlook (WEO) database. The reasons for focusing on the period 2001-2006 will be explained further below.
Current Gross fin. Deposit flows /account outflows flows gross fin. outfl.
All oil exporters 1464 2108 560 27
Russia 338 418 209 50Saudi Arabia 287 282 40 14Norway 214 419 101 24Kuwait 114 99 16 16Canada 106 274 1 0Venezuela 90 50 14 28United Arab Emirates 89 186 34 18Algeria 82 60 4 7Libya 59 44 49 111Mexico 55 39 8 21Qatar 53 56 6 11Iran 48 47 11 23Nigeria 22 41 27 66
Data: WEO, BIS, and author's computations
Deposit
(in billions of U.S. dollars) (in percent)
Table 2: Oil Exporters -- External Position and Deposit Flows into BIS Reporting Banks, 2001-2006

6
• Kilian (2008 a,b), Elekdag et al. (2008), Hamilton (2008), and Barsky and Kilian (2004) on oil price movements and macroeconomic outcomes (mostly) in advanced economies.
The remainder of the paper is organized as follows. Section II describes the data and presents some more stylized fact. Section III outlines the identification and estimation strategy, while section IV contains the results. Section V concludes.
II. DATA AND SOME STYLIZED FACTS
Attempts to analyze oil exporters’ investment patterns are often frustrated by the absence of data that directly trace cross-border capital flows.3 An alternative—and the one pursued here—is to infer patterns indirectly, by correlating capital outflows from oil exporters (and other countries) with capital inflows elsewhere, including to emerging markets. In principle, this could be done with balance of payments data. The drawback, however, is that compilation methods and data quality differ greatly between countries, and that balance of payments data are typically available at an annual frequency only—hence they provide insufficient data points for statistical analysis. These complications are largely absent for bank flows, however, owing to the locational banking statistics (LBS) compiled by the Bank for International Settlements (BIS). The LBS provide estimates of quarterly bank flows between banks in BIS reporting countries and 210 countries and territories. The raw information is provided by the banks themselves. They are located in 40 countries and territories, including most industrial countries and important off-shore centers, aw well as several large emerging market economies: Brazil, Chile, India, Mexico, South Korea, Turkey, and Taiwan Province of China (see appendix I). The BIS estimates that the LBS cover more than 95 percent of all global cross-border banking flows. The LBS contain estimates for bank flows in a narrow and in a broader sense. Flows in a narrow sense include only loans and deposits. Flows in a broader sense also include equity shares and other participations, holdings of international debt securities, derivative instruments, and working capital supplied by head offices to their branches abroad (see Bank for International Settlements, 2006). Making use of the LBS, Table 3 (next page) reports correlation coefficients between the IMF average oil price and a country’s quarterly gross deposit outflows. Between Q2 2001 and Q4 2006, the average correlation coefficient for oil exporting countries was 0.29, somewhat larger than for the overall cross-country average (0.21). These averages hide large within-
3 The main exception is the U.S. Treasury’s TICS database that identifies the origin of some—but by no means all—securities inflows into the United States.

7
group differences, however. Deposit outflows from some important oil exporters—notably Libya, Nigeria, and Russia—displayed among the highest correlations with the oil price, while for others—including Saudi Arabia and other Middle Eastern oil exporters—the correlation was only modest. Similar to Table 2, this suggests that some but not all oil exporting countries used bank deposits as a regular vehicle to invest oil surpluses, while others pursued different investment strategies. Table 3 also shows that bank outflows from offshore centers (following the BIS definition) displayed above-average correlation with oil prices. Five of the 11 countries with the highest correlations are offshore centers. While these simple correlations fall short of conclusive evidence, they suggest at least the possibility that some oil surpluses may first have been invested with off-shore centers, from where they are deposited with banks in BIS reporting countries.
III. IDENTIFICATION AND ESTIMATION STRATEGY
Bank recycling of petro dollars involves two investment decisions that trigger two financial flows: • oil exporters’ decision of how to allocate surpluses across various investment vehicles,
one of them deposits with internationally active banks (as discussed above), and
• the banks’ decision of how to invest the funds they receive.
Table 3: Correlation of Quarterly Deposit Outflows with IMF Average Oil Price
Country Correlation Oil Offshore BIScoefficient exporter center reporting
Country groups (#) av. (std. error)All countries (210) 0.21 (.02) 8018
Oil exporters (28) 0.29 (.05) 541Offshore centers (19) 0.40 (.05) 1624Other (163) 0.18 (.02) 5853
11 highest correlationsLibya 0.89 yes 48Panama 0.84 yes yes 28Nigeria 0.72 yes 27Samoa 0.70 yes 3Macao SAR 0.69 yes yes 13Jersey 0.67 yes yes 234Philippines 0.64 8Cyprus 0.63 20Turkey 0.61 yes 33Russia 0.59 yes 255West Indies UK 0.59 yes 97
Other major oil exportersUnited Arab Emirates 0.48 yes 30Kuwait 0.43 yes 13Iran 0.42 yes 11Saudi Arabia 0.38 yes 36Norway 0.17 yes yes 93Venezuela 0.12 yes 13
Other major offshore centersHong Kong 0.53 yes yes 53Guernsey 0.45 yes yes 56Bahamas 0.27 yes yes 140Singapore 0.26 yes yes 65Cayman Islands 0.25 yes yes 761Bermuda -0.04 yes yes 60
Source: BIS, IMF, and author's computations.
Tot. deposit outflowsQ2 2001-Q4 2006(billions of US$)

8
Figure 3: Identifying and Estimating Petro-Dollar Bank Flows--Basic Scheme
Deposit flows Loan flows
Oil exporter O
Emerging markets E
Other loan recipients
Bank I
Bank II
α1
1-α1
βI
βII
Other depositor X
O
α2
1-α2 ___________________________________________________________________________ For the sake of the exposition, suppose there are only two banks: bank I is an internationally active investment bank, while bank II is a savings and loans association. Also assume there are two depositors: an oil exporter O and another depositor X—say, a local business or household. Both banks receive inflows from both depositors, and both banks lend a part of these inflows on to emerging markets E, but they do so at different degrees. As illustrated by the simple flow scheme in Figure 3, bank flows to emerging markets are then (1) tE = , ,I I t II II tB Bβ β+
= [ ]1 1(1 )I II tOα β α βγ
+ −144424443
+[ ]2 2(1 )I II tXδ
α β α β+ −144424443
where ,I tB and ,II tB denote deposit inflows in period t into banks I and II, Iβ and IIβ are the
shares of deposits that banks I and II lend to emerging markets, and 1α / 2α [(1- 1α )/(1- 2α )] are the shares of oil surpluses/other deposits deposited with bank I [bank II]. 1α , 2α , Iβ and
IIβ capture the structure of bank flows and depend on expected risks and returns of the various investment vehicles, risk preferences, investor habits, etc.—in short, unobserved structural factors that may be constant or variable over time. The α - and β -parameters cannot be inferred, however, as the LBS do not report flows into and out of individual banks (or groups of banks). Inferable are only the “reduced form” parameters γ and δ that link emerging market loans directly to deposits. Note that if 1α = 2α or Iβ = IIβ —i.e., either depositors or banks pursue identical investment strategies—γ = δ, hence the original sources of bank deposits do not affect the amount of lending to emerging markets. All that matters is then the total amount of deposit inflows into banks. If these equalities do not hold, however—i.e., local businesses use different banks than oil exporters and investment banks lend to different borrowers than savings and loans associations—the sources of deposit inflows are a crucial determinant of emerging market bank financing.

9
The empirical work in the following section is therefore based on a “reduced form” equation (2) t i it j jt t
i j
E O X uγ δ= + +∑ ∑ .
(2) relaxes the constraint in (1) that oil exporters and/or other depositors are homogenous.
itX may also contain a constant term. tu is a random disturbance.4 Of particular interest is whether the iγ and jδ parameters are constant—a testable hypothesis. With parameter constancy, the pattern of emerging market loans over time is explained exclusively by changes in iO and jX , i.e., the size and composition of deposit inflows into banks. By contrast, if parameter constancy does not hold, unobserved shifts in the investment strategies of depositors and/or banks account for at least some time variation in bank loans to emerging markets. In this case, the effects of changing sources of deposit inflows on the one hand and of changing investment strategies on the other cannot be distinguished. Several practical issues arise in the estimation of (2). They are sketched in the extended flow scheme in Figure 4.
________________________________________________________________________
Figure 4: Identifying and Estimating Petro-Dollar Bank Flows--Extended Scheme
Deposit flows Loan flows
BIS reported flows
Other flows
Same country
Other countries in BIS
Oil exporters Emerging markets
Other loan recipients
Other countries outside BIS
BIS Bank type I
BIS Bank type II
Non-BIS bank
1.
2.
3.
4 Equations corresponding to (2) can also be specified for bank assets other than emerging market loans. Summing over all asset classes results in the balance sheet identity of the overall banking system.
10
1. The LBS report only cross-border flows. Unbiased estimation of (2) requires controlling for all sources of deposit inflows, however, including domestic flows. To this end, quarterly deposit flows for the banking systems of all BIS reporting countries were calculated from the IMF’s International Financial Statistics (IFS), aggregated across countries, and included as a covariate in (2).
2. Oil exporters (and other countries) may deposit funds with banks that do not report to the BIS. If these banks lend to emerging markets, the estimated coefficient will again suffer from omitted variable bias. Little can be done to address this issue. As mentioned above, however, the LBS cover more than 95 percent of all global cross-border banking flows. Any bias from this source is therefore likely to be minor.
3. Oil exporters may channel oil revenues to a country whose banks do not report to the BIS, notably offshore centers. The intermediaries in these third countries may then transfer funds into BIS-reporting banks, which, in turn, may lend part of the funds on to emerging markets. As a consequence, a flow that originated with an oil exporter will be recorded as having originated in the “third” country, biasing γ downwards. Again, little can be done to address this issue. This said, most offshore centers do report to the BIS: between 2001 and 2006, only 8 percent of deposit flows from offshore centers into BIS-reporting banks came from non-reporting centers. Hence, the potential for bias is again small.
IV. RESULTS
A. Descriptive Statistics
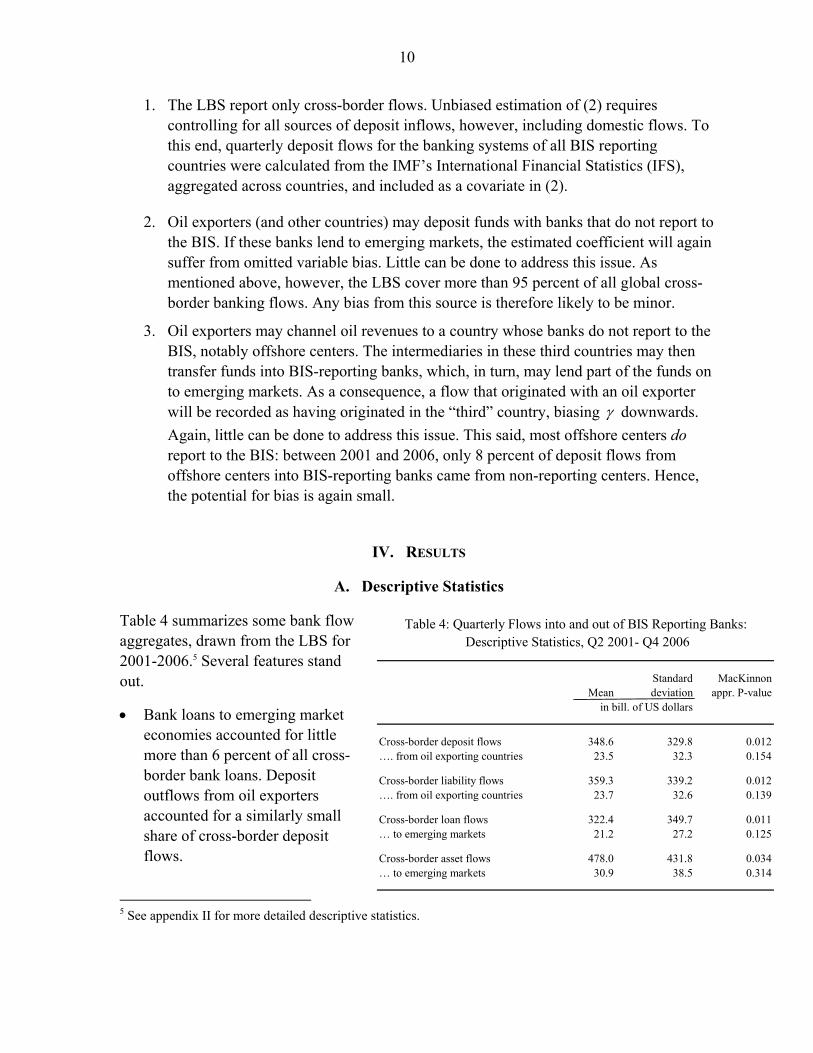
Table 4 summarizes some bank flow aggregates, drawn from the LBS for 2001-2006.5 Several features stand out.
• Bank loans to emerging market economies accounted for little more than 6 percent of all cross-border bank loans. Deposit outflows from oil exporters accounted for a similarly small share of cross-border deposit flows.
5 See appendix II for more detailed descriptive statistics.
Standard MacKinnonMean deviation appr. P-value
Cross-border deposit flows 348.6 329.8 0.012…. from oil exporting countries 23.5 32.3 0.154
Cross-border liability flows 359.3 339.2 0.012…. from oil exporting countries 23.7 32.6 0.139
Cross-border loan flows 322.4 349.7 0.011… to emerging markets 21.2 27.2 0.125
Cross-border asset flows 478.0 431.8 0.034… to emerging markets 30.9 38.5 0.314
in bill. of US dollars
Table 4: Quarterly Flows into and out of BIS Reporting Banks: Descriptive Statistics, Q2 2001- Q4 2006

11
• Cross-border deposit and liability flows were nearly identical in size, but asset flows exceeded loan flows by a large margin.
• Most variables are trending. As an example, Figure 5 shows total cross-border loans and loans to emerging markets, both of which increased steadily from about 2002/03. More formally, an augmented Dickey-Fuller fails to reject the hypothesis of a unit root at conventional test levels for both emerging markets loans and deposit outflows from oil exporters. This implies testing for co-integration is crucial when estimating (2) to exclude spurious correlation.
B. Basic Estimation Results
Tables 5-7 show estimates based on various specifications of equation (2). To anticipate a key result that will be elaborated only further below (sub-section E.), all estimates reported in these tables cover the period Q2 2001 to Q4 2006, as only over this period a stable relationship between deposits and emerging market loans is identified. Table 5 column 1 reports the regression of emerging market loans on the change in total deposits of banks in BIS reporting countries. The relationship is significant and implies that banks lend on about 6½ percent of their deposit inflows to emerging markets. Moreover, deposit inflows and emerging market loans are cointegrated (as is the case for all subsequent regressions also). However, a Breusch-Godfrey lagrange multiplier test fails to reject residual auto-correlation, and the model fits the data relatively poorly. Column 2 distinguishes between domestic flows and cross-border flows, suggesting that cross-border deposit flows are primarily passed on to emerging markets. Column 3 differentiates between cross-border deposit flows that originated in countries whose banks do/do not report to the BIS. The first group contains what may be called the “core” of the global economy—most industrial
(1) (2) (3)Change in…..
Total deposits 0.066 - -2.97
Deposits from same country - 0.033 -0.0181.44 -0.078
Deposits from other countries - 0.075 -3.82
Deposits from other countries - - -0.008within BIS -0.030
Deposits from countries - - 0.507outside BIS 4.11
Constant -4022 -6183 4573-0.41 -0.72 0.61
Adj. R-squared 0.262 0.434 0.641Mc Kinnon approx. p-value 0.000 0.000 0.000Breusch-Godfrey LM test 0.142 0.074 0.142
t-values below point estimates. Coefficients significant at the10 percent level are bold.
Table 5: Basic Regression Results
Figure 5: Cross-Border Loans, 1996-2007 (quarterly, billions of U.S. dollars)
-1000
-500
0
500
1000
1500
2000
1996 1998 2000 2002 2004 2006-100
-50
0
50
100
150
200All cross-border loans(left scale)Loans to emergingmarkets (right scale)

12
(1) (2) (3)Change in…..
Deposits from the same country -0.038 - --1.88
Deposits from other countries within BIS
Oil exporters 0.408 0.464 0.4632.16 3.26 3.35
Emerging markets (non oil 0.427 0.476 0.468exporting) 2.35 2.64 2.88
Offshore centers -0.057 - --1.33
Industrial countries (non oil -0.054 - -exporting) -2.14
Deposits from countries outside BIS
Oil exporters, high correlation 0.976 0.599 0.599with oil price 3.54 3.22 3.31
Oil exporters, low correlation -0.561 - -with oil price -1.62
Emerging markets (non oil 1.018 0.559exporting) 3.06 2.42
Offshore centers 0.795 0.651 4.811.21 1.32
Industrial countries (non oil 1.066 - -exporting) 0.59
Constant 5878 -2834 -27541.01 -0.87 -0.88
Adj. R-squared 0.856 0.847 0.856Mc Kinnon approx. p-value 0.000 0.000 0.000Breusch-Godfrey LM test 0.041 0.008 0.008
t-values below point estimates. Coefficients significant atthe 5 percent level are bold.
Table 6: Extended Regression Results
0.586
countries, the majority of offshore centers, and some large emerging markets—while the second group consists mostly of the “periphery”. Column (3) shows that Banks in BIS reporting countries passed almost half of deposit inflows received from the “periphery” on to emerging market economies, while funds received from the “core” were typically put to other uses. This is the paper’s key result.
C. Detailed Results
Table 6 breaks deposit flows down further. Both the “core” and the “periphery” are split up into oil exporters, off-shore centers, non-oil exporting emerging markets, and non-oil exporting industrial countries.6 Moreover, oil exporters are distinguished between those that systematically used deposit outflows to export oil surpluses and those that did not (see section II above). The cutoff point is chosen at a correlation coefficient of 0.5 between deposit outflows and the IMF average oil price. Only Libya, Russia, Nigeria and Angola exceeded this threshold, all non-BIS reporting countries. This procedure leads to a grossly overparameterized model, with 10 coefficients being estimated from only 23 observations (column 1). From this general specification, coefficients without explanatory value were sequentially eliminated, in the spirit of David Hendry’s “general to specific modeling” strategy.7 This yields the more parsimonious models reported in columns 2 and 3. Overall, the results suggest that bank loans to emerging markets were funded from the following sources: • Oil surpluses. Banks in BIS reporting countries
lent on almost half of deposit received from oil exporters to emerging market economies. The share was highest for oil exporters that use deposit outflows regularly to invest surpluses
6 Bahrain is both an oil exporter according to the World Economic Outlook and an offshore-center according to the BIS. In this paper it is considered an oil exporter. 7 See Campos et al. (2005) and the literature cited therein.

13
(about 60 percent), and lowest for oil exporters that neither report to the BIS nor make regular use of deposit outflows to invest oil surpluses (indistinguishable from zero).
• Deposits from emerging markets that are not oil exporters. Again, banks in BIS reporting countries passed about half of these funds on to emerging markets, independent of whether the flows originated in BIS reporting or non BIS reporting countries.
By contrast, deposits from industrial countries and offshore centers display little or no statistical relationship with loans to emerging markets.8 For offshore centers this may be somewhat surprising, in particular as Table 3 suggested that off-shore centers’ deposit outflows are even stronger correlated with the oil price than oil exporters’ outflows. It appears that funds channeled through off-shore centers—including oil surpluses—are largely invested outside emerging markets.
The LBS data were sliced in various other ways, aiming at detecting more refined correlation structures. Similar to oil exporters, industrial countries and offshore centers countries were grouped according to whether the correlation coefficient of deposit flows with the IMF average oil price exceeded 0.5. Industrial countries were distinguished by region (Europe, Asia, North America, etc.). Deposit flows from individual countries and territories were also included as covariates, including from those with especially large outflows—such as the United States, the United Kingdom, and the Cayman Islands–and countries with large external surpluses—such as Japan, Germany, and Switzerland. None of these specifications revealed a correlation structure that would go beyond Table 6, however.
D. Region Specific Estimates
Emerging market loans have evolved quite differently across regions in recent years. As Figure 6 shows, since 2001 more than one-half of new (net) emerging market loans have gone to Emerging Europe, a bit less than one-third to Emerging Asia, and a bit more than one-sixth to the Middle East and Africa, while the stock of emerging market loans to Latin America was—in U.S. dollar terms—roughly the same in 2007 as in 2001. Also, lending to Emerging Europe started to pick up markedly in late 2002, while lending to Asia 8 Table 6 column 2 suggests that there may be a relationship between emerging market loans and deposits from non-BIS reporting off-shore centers. The coefficient is fairly large but it is estimated with little precision. Closer inspection shows strong muticollinearity between deposits from non-BIS reporting offshore centers and from non-BIS reporting emerging markets that prevents precise estimation of either coefficient, while the joint coefficient (column 3) is highly significant. As mentioned above, however, deposits from non-BIS reporting offshore centers account for less than 10 percent of total outflows from offshore centers, hence any possible link is of little quantitative importance.
Figure 6: Bank Loans by Recipient Region (quarterly, cumulative since Q2 2001, in US$ billion)
-100
0
100
200
300
400
500
2001 2002 2003 2004 2005 2006 2007
Emerging EuropeEmerging AsiaMiddle East and AfricaLatin America

14
Dep. variable: loans to…. (1) (2) (3) (4) (5)All EM EM Middle East Latin
EMs Europe Asia and Africa America
Oil exporters in BIS 0.463 -0.053 0.590 -0.029 -0.0543.35 -0.49 3.83 -0.71 -0.86
Emerging markets (non oil 0.468 -0.093 0.449 0.094 0.018exporting) in BIS 2.88 -0.73 2.48 1.93 0.29
Oil exporters, high correlation 0.599 0.262 0.174 0.115 0.048with oil price, non BIS 3.31 1.85 0.86 2.12 0.71
EMs (non oil exporting) & 0.586 0.348 -0.088 0.191 0.132offshore centers, non BIS 4.81 3.65 -0.65 5.22 2.90
Constant -2754 2103 937 -1535 -4259-0.88 0.86 0.27 -1.64 -3.60
Adj. R-squared 0.856 0.544 0.518 0.771 0.363Mc Kinnon approx. p-value 0.000 0.004 0.000 0.000 0.112Breusch-Godfrey LM test 0.008 0.231 0.734 0.575 0.001
t-values below point estimates. Coefficients significant at the 10 percent level are bold.
Table 7: Region Specific Estimates
and the Middle East accelerated from 2004 only. Latin America did not join the global emerging markets bank lending boom before mid-2005. Table 7 reports region-specific estimates, taking as starting point the specification in Table 6 column 3.9 It suggests that all four regions have benefited from the recycling of oil deposits. Moreover, all regions except Latin America have received deposits from non-oil exporting emerging markets. Deposits from BIS-reporting countries—the “core” of the global economy—seem to get passed on especially to Emerging Asia.10 This said, loans to specific regions tend to correlate less well with deposits than the total of all emerging market loans, and the error term for Latin America contains a unit root, suggesting misspecification.
E. Robustness Checks and Extensions
Parameter Stability As discussed in section III, parameter stability is crucial for a meaningful interpretation of the results in Tables 5 and 6. As a precursor to a more formal procedure, Figure 7 shows the residual of the model in Table 6 column 3, as well as the residual of an identically specified 9 Testing down the richer specification in Table 6 column 1 yields somewhat different estimates in some cases, but the differences are not substantive. 10 Also, loans to Emerging Europe are particularly closely correlated with deposit outflows from Russia, while loans to Middle Eastern countries appear more closely linked to outflows from Libya, Nigeria and Angola.

15
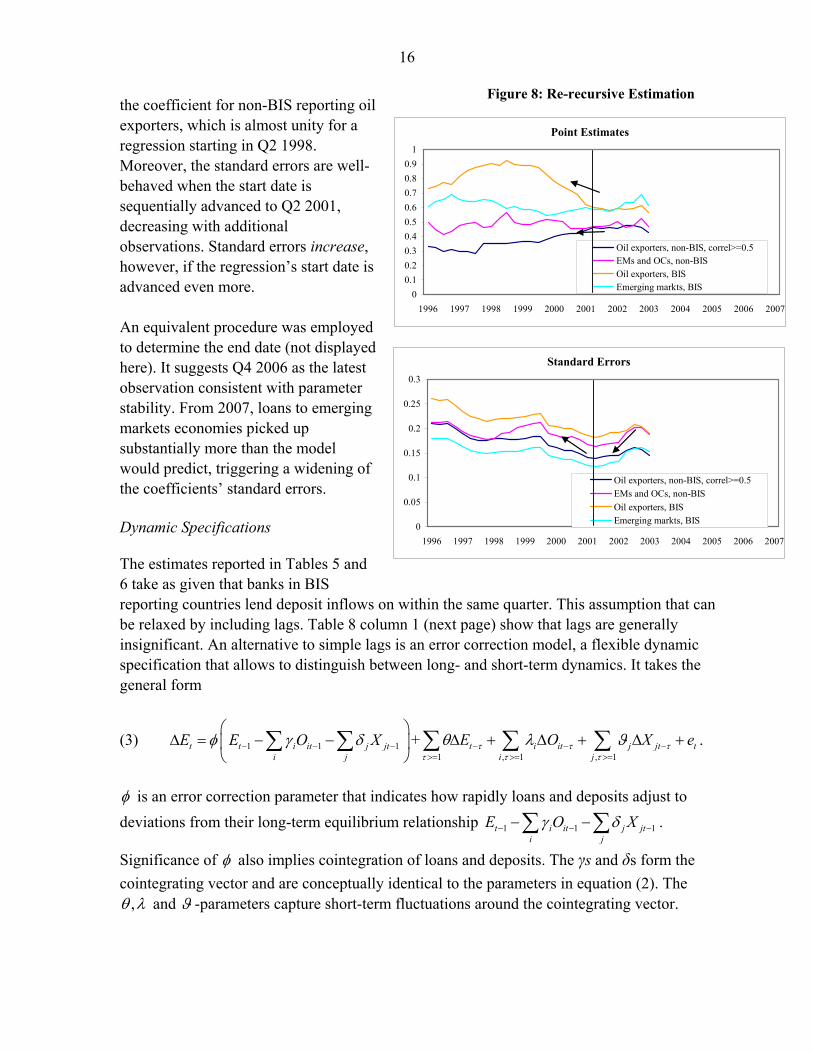
model estimated for Q1 1996 to Q3 2007 (a period twice as long). The point estimates of both models are statistically indistinguishable, but the longer-term model’s fit is worse. The graph shows that prior to 2001 the specification in Table 6 column 3 is clearly inadequate, yielding strongly autocorrelated residuals that display a systematic pattern: sharply down from 1996/97 to mid-1999, and up from mid-1999 to 2001. Between 2001 and 2006 the residuals are well-behaved, but in 2007 they are systematically positive and out of range.11 Various other specifications were tried, but no empirical model could be found whose residual would not display a similar pattern. This suggests that shifts in investment strategies are disturbing the picture. Between 1996/97 and 1999, banks in BIS reporting countries cut exposure to emerging markets sharply and systematically, before re-engaging cautiously.12 This pattern just mirrors of course the standard narrative of bank lending during and after the Asian and Russian crises. By contrast, in 2001-2006, a period without major financial turbulences, the data are consistent with constant investment behavior of both depositors and banks. In 2007, however, there appears to be a systematic shift of bank lending into emerging markets. This shift coincided with deteriorating asset quality in industrial economies, notably the United States. For a more formal analysis, the model reported in Table 6 column 3 was estimated re-recursively (or backward recursively), with Q4 2006 as end date. The minimum number of periods was set at 16, hence the model with the fewest observations covers the period Q1 2003 through Q4 2006. The start date was then stepwise advanced. The results are shown in Figure 8. The regression coefficients appear to be stable from about 2001 onward. Moving the start date further upfront than 2001, however, changes in particular
11 Preliminary data for Q4 2007 that became available right before this draft of the paper was completed confirm this pattern.
12 Alternatively—although perhaps somewhat implausibly—depositors may have moved funds from banks that lend heavily to emerging markets to banks with other investment strategies. As explained in section III, the investment behavior of depositors on the one hand and of banks on the other cannot be distinguished from these data alone.
Figure 5: Parameter StabilityFigure 7: Regression Residuals (billions of U.S. dollars)
-60
-40
-20
0
20
40
60
80
100
1996 1997 1998 1999 2000 2001 2002 2003 2004 2005 2006 2007
Model Q2 2001 -Q4 2006
Model Q1 1996 -Q3 2007
16
the coefficient for non-BIS reporting oil exporters, which is almost unity for a regression starting in Q2 1998. Moreover, the standard errors are well-behaved when the start date is sequentially advanced to Q2 2001, decreasing with additional observations. Standard errors increase, however, if the regression’s start date is advanced even more. An equivalent procedure was employed to determine the end date (not displayed here). It suggests Q4 2006 as the latest observation consistent with parameter stability. From 2007, loans to emerging markets economies picked up substantially more than the model would predict, triggering a widening of the coefficients’ standard errors. Dynamic Specifications The estimates reported in Tables 5 and 6 take as given that banks in BIS reporting countries lend deposit inflows on within the same quarter. This assumption that can be relaxed by including lags. Table 8 column 1 (next page) show that lags are generally insignificant. An alternative to simple lags is an error correction model, a flexible dynamic specification that allows to distinguish between long- and short-term dynamics. It takes the general form
(3) 1 1 1t t i it j jti j
E E O Xφ γ δ− − −
⎛ ⎞Δ = − −⎜ ⎟
⎝ ⎠∑ ∑ +
1 , 1 , 1t i it j jt t
i jE O X eτ τ τ
τ τ τ
θ λ ϑ− − −>= >= >=
Δ + Δ + Δ +∑ ∑ ∑ .
φ is an error correction parameter that indicates how rapidly loans and deposits adjust to deviations from their long-term equilibrium relationship 1 1 1t i it j jt
i jE O Xγ δ− − −− −∑ ∑ .
Significance of φ also implies cointegration of loans and deposits. The γs and δs form the cointegrating vector and are conceptually identical to the parameters in equation (2). The
,θ λ and ϑ -parameters capture short-term fluctuations around the cointegrating vector.
Figure 8: Re-recursive Estimation
Point Estimates
00.10.20.30.40.50.60.70.80.9
1
1996 1997 1998 1999 2000 2001 2002 2003 2004 2005 2006 2007
Oil exporters, non-BIS, correl>=0.5EMs and OCs, non-BISOil exporters, BISEmerging markts, BIS
Standard Errors
0
0.05
0.1
0.15
0.2
0.25
0.3
1996 1997 1998 1999 2000 2001 2002 2003 2004 2005 2006 2007
Oil exporters, non-BIS, correl>=0.5EMs and OCs, non-BISOil exporters, BISEmerging markts, BIS

17
Column 2 reports a large and highly significant error correction parameter, suggesting rapid adjustment to deviations from the cointegrating relationship. Moreover, the coefficients of the cointegrating vector resemble those in Table 6 column 3, except that the coefficient on BIS-reporting oil exporters drops out as insignificant. There are no significant short-term dynamics, except possibly from deposits of non-BIS reporting oil exporters. In spite of its desirable statistical properties, the error correction model has drawbacks in this specific context, however, as it does not correspond exactly to the accounting framework between deposits and loans displayed in Figures 3 and 4. This renders in particular the short-term dynamics difficult to interpret. Feedback and Reverse Causality Thus far it has implicitly been assumed that deposit flows are the result of exogenous or pre-determined factors, and banks just lend on the resources they receive to emerging markets. There are cases where causality could go the other way round, however. Suppose, for example, that a company in an emerging market country pre-finances an investment project with a large loan, and deposits the excess funds temporarily with a BIS reporting bank. In this case loans pre-determine deposit flows rather than the other way round. One way to address this issue would in principle be by instrumental variable estimation. It turns out to be difficult to find valid and strong instruments for deposit flows, however, in part because deposit flows from some sources are only weakly correlated over time, preventing instrumentation with leads and lags. A more indirect approach is pursued in Table 9 (next page). Feedback should occur only for deposits from and loans to the same country. To control whether deposit flows from, say, oil exporters are affected by feedback, loans are therefore split up into loans to oil-exporting (column 2) and non-oil exporting (column 3) emerging markets. The focus is on the coefficients on oil exporters’ deposits (shaded). Only in column 2 could these (but not need to) be affected by feedback, while the shaded coefficients in column 3 should be feedback free.
(1) (2)Change in….. ECM*
Instantenous/cointegrating vector
Oil exporters in BIS 0.5683.05
Emerging markets (non oil 0.421 0.365exporting) in BIS 2.03 2.41
Oil exporters, high correlation 0.723 0.896with oil price, non BIS 2.89 4.11
EMs (non oil exporting) & 0.786 0.532offshore centers, non BIS 3.52 3.44
Lagged one quarter
Oil exporters in BIS -0.094-0.49
Emerging markets (non oil -0.014exporting) in BIS -0.06
Oil exporters, high correlation -0.271with oil price, non BIS -0.91
EMs (non oil exporting) & -0.169offshore centers, non BIS -0.70
Lagged, first difference (short term)
Oil exporters, high correlation -0.708with oil price, non BIS -2.07
Error correction parameter -1.781-5.90
Constant -1544 233-0.44 0.05
Adj. R-squared 0.836 0.639Mc Kinnon approx. p-value 0.000 -Breusch-Godfrey LM test 0.037 -
t-values below point estimates. Coefficients significant at the10 percent level are bold.* Dependent variable first differenced, variables in cointegrating vector lagged
Table 8: Dynamic Specifications

18
The estimates in column 3 resemble very closely those of Table 6 column 3, however (which for convenience are reported again here in column 1). Overall, banks lent on more than 90 percent of oil exporters’ deposits to non-oil exporting countries. Hence any bias from feedback is bound to be small. Similar arguments can be made for the other coefficients in column 1 (not displayed here). Assets and Liabilities vs. Loans and Deposits The estimates thus far have used the LBS’ narrow loans and deposits concept for bank flows. Column 2 of Table 10 uses bank liabilities rather than deposits as covariates—a slightly broader concept that also includes issues of international debt securities. As had already been shown in Table 4 above, however, bank liability flows exceed deposit flows by a small margin only. It is therefore no surprise that a change to this concept has no significant impact on the regression results. More significant is the move from bank loans to total bank assets as dependent variable. As mentioned in section II above, bank assets also include bank holdings of international debt securities, equity participations, derivative instruments, and working capital supplied by head offices to their branches abroad. Figure 9 shows that non-loan asset flows have surged in particular from 2004, both in general and as regards flows to emerging market countries. As illustrated by Table 4, asset flows to emerging markets were some 45 percent larger than loan flows between 2001 and 2006. Total cross-border asset outflows from banks in BIS reporting countries also exceeded cross-border liability inflows to these banks by a substantial margin. Asset flows are therefore likely to have as counterparts not only recorded liability inflows, but also retained earnings that add to banks’ capital base and that are not captured by BIS banking statistics.
Dep. variable: loans to…. (1) (2) (3)All Oil exp. Non-oil exp.
EMs EMs EMs
Oil exporters in BIS 0.463 -0.124 0.5863.35 -1.88 4.99
Emerging markets (non oil 0.468 0.088 0.381exporting) in BIS 2.88 1.14 2.75
Oil exporters, high correlation 0.599 0.101 0.499with oil price, non BIS 3.31 1.17 3.24
EMs (non oil exporting) & 0.586 0.277 0.309offshore centers, non BIS 4.81 4.78 2.98
Constant -2754 -139 -2615-0.88 -0.09 -0.99
Adj. R-squared 0.856 0.675 0.835Mc Kinnon approx. p-value 0.000 0.005 0.000Breusch-Godfrey LM test 0.008 0.246 0.007
t-values below point estimates. Coefficients significant at the 10 percent level are bold.
Table 9: Feedback
(1) (2) (3)Loans & Loans & Assets &deposits liabilties liabilties
Oil exporters in BIS 0.463 0.464 0.3013.35 3.45 1.75
Emerging markets (non oil 0.468 0.450 0.710exporting) in BIS 2.88 2.80 3.38
Oil exporters, high correlation 0.599 0.556 1.096with oil price, non BIS 3.31 3.07 4.73
EMs (non oil exporting) & 0.586 0.588 0.808offshore centers, non BIS 4.81 4.79 5.14
Constant -2754 -2648 -4854-0.88 -0.86 -1.23
Adj. R-squared 0.856 0.859 0.884Mc Kinnon approx. p-value 0.000 0.000 0.000Breusch-Godfrey LM test 0.008 0.013 0.231
t-values below point estimates. Coefficients significant at the 10 percentlevel are bold.
Table 10: Assets and Liabilities

19
The results in column 3 closely resemble those of the standard regression of loans on deposits (column 1), however, except that the coefficient on deposits of oil exporters outside the BIS becomes very large. This may be interpreted as an indication that assets other than loans were channeled from oil exporters to emerging market assets, even though far reaching conclusions from Table 10 should be avoided without further analysis.
V. SUMMARY: KEY RESULTS AND IMPLICTIONS FOR EMERGING MARKET VULNERABILITIES
The paper’s core results may be summarized as follows. • Bank recycling of petro dollars matters also during the current oil price boom. Since
2001, more than a quarter of gross capital outflows from oil exporting countries has been in the form of deposits to banks in BIS reporting countries. While this share is smaller than in the 1970s and 80s, bank deposits have remained an important vehicle to invest petro dollars.
• The relative importance of deposit flows differs sharply between countries, however. Large deposit outflows have come especially from Russia—the world’s second largest oil exporter—as well as Libya, Nigeria, and Angola. Middle Eastern oil exporters, by contrast, have made little use of bank deposits during the current boom.
• Banks in BIS reporting countries pass on a large part of funds received from oil exporters to emerging market economies. This phenomenon is part of a wider pattern, according to which banks in BIS reporting countries lend in particular funds received from the “periphery” of the global economy to emerging markets. This implies that the current environment of large global external imbalances—with surpluses concentrated in emerging market economies and developing countries—is particularly conducive to emerging market bank lending. Between 2001 and 2006, the surge in bank lending to emerging markets can be explained entirely by higher deposit inflows into banks from the “periphery”. In 2007—when credit quality problems in industrial countries became apparent—there are indications of a shift in investment strategies that boosted bank lending to emerging markets even more.
Figure 9: Non-Loan Asset Flows, 1996-2007 (quarterly, billions of U.S. dollars)
0
50
100
150
200
250
300
350
400
450
500
1996 1998 2000 2002 2004 2006-10
0
10
20
30
40
50
All cross-country flows(left scale)Flows to emergingmarkets (right scale)

20
These findings have several implications for the vulnerability of emerging market economies to external shocks.
• An unwinding of global imbalances—including through a drop in oil prices—could entail substantial risks for some emerging markets, by drying up sources of funding, to the extent that banks cannot replace petro dollars with other sources. Especially countries that depend heavily on bank flows to finance external deficits could experience a severe funding squeeze, even though to some degree falling oil prices would also help non-oil exporting emerging markets by improving their trade balances and reducing financing needs. In contrast to the 1970s and 80s, the bulk of vulnerable countries is not in Latin America but in Emerging Europe.13
• Even if imbalances persist, however, bank lending could still reverse if banks reassess the viability of emerging markets lending, similar to the events that triggered the Asian crisis. It is worth noting that a reassessment could in principle go either way, however. As mentioned before, banks seem to have shifted their lending portfolios in favor of emerging markets in early 2007.
13 For a discussion of the financial and macroeconomic risks triggered by these bank inflows, see, e.g., the contributions in Enoch and Ötker-Robe (2007).

21
References Ahrend, R., P. Catte and R. Price, 2006, ”Factors Behind Low Long-Term Interest Rates,”
OECD Working Paper 2006/18 (Paris, France: Organization for Economic Co-Operation and Development)
Balakrishnan, R., T. Bayoumi, and V. Tulin, 2007, “Globalization, Gluts, Innovation or
Irrationality: What Explains the Easy Financing of the U.S. Current Account Deficit?” IMF Working Paper 07/160 (Washington D.C.: International Monetary Fund)
Bank for International Settlements, 2006, “Guidelines to the International Locational
Banking Statistics,” (Basle, Switzerland: Bank for International Settlements) Barsky, R. and L. Kilian, 2004, “Oil and the Macroeconomy since the 1970s,” The Journal of
Economic Perspectives, Vol. 18, No. 4, pp. 115-134 Basher, S. and P. Sadorsky, 2006, “Oil Price Risk and Emerging Stock Markets,” Global
Finance Journal, Vol. 17, pp. 224-251 Boorman, J., 2006, “Global Imbalances and Capital Flows to Emerging Market Countries,”
Emerging Markets Forum Background Paper (Washington D.C.: Emerging Markets Forum)
Boughton, J. and S. Kumarapathy, 2006, “Recycling Petrodollars in the 1970s,” in IMF
World Economic Outlook, April 2006: Globalization and Inflation, Box 2.2 (Washington D.C., International Monetary Fund), pp. 85-87
Campos, J., N. Ericsson, and D. Hendry, 2005, “General-to-Specific Modeling: An Overview
and Selected Bibliography,” FRB International Finance Discussion Paper No. 838, (Washington D.C.: Federal Reserve Board)
Elekdag, S., R. Lalonde, D. Laxton, D. Muir, and P. Pesenti, 2008, “Oil Price Movements
and the Global Economy: A Model-Based Assessment,” NBER Working Paper 13792 (Cambridge, Massachusetts: National Bureau of Economic Research)
Enoch, C. and I. Ötker-Robe (eds.), 2007, “Rapid Credit Growth in Central and Eastern
Europe—Endless Boom or Early Warning?” (New York: Palgrave Macmillan) Hamilton, J., 2008, “Oil and the Macroeconomy”, in The New Palgrave Dictionary of
Economics, second edition, edited by Steven N. Durlauf and Lawrence E. Blume (London: Palgrave Macmillan)
Hartelius, K., K. Kashiwase, and L. Kodres, 2008, “Emerging Market Spread Compression:
Is it Real or is it Liquidity?” IMF Working Paper 08/10 (Washington D.C., International Monetary Fund)

22
Johnson, S., 2007, “The Rise of Sovereign Wealth Funds,” Finance and Development,
Vol. 44 No. 3, pp. 56-67. Kilian, L., 2008a, “Exogenous Oil Supply Shocks: How Big Are They and How Much Do
They Matter for the U.S. Economy?” Review of Economics and Statistics, Vol. 90 No. 2, pp. 216-240
Kilian, L., 2008b, “A Comparison of the Effects of Exogenous Oil Supply Shocks on Output
and Inflation in the G7 Countries,” Journal of the European Economic Association, Vol. 6 No. 1, pp. 78-121
Kilian, L., A. Rebucci and N. Spatafora, 2007, “Oil Shocks and External Balances,” IMF
Working Paper 07/110 (Washington D.C., International Monetary Fund) Kimmit, R., 2008, “Public Footprints in Private Markets: Sovereign Wealth Funds and the
World Economy”, Foreign Affairs, Vol. 87 No. 1, pp. 119-30 Maghyereh, A., 2004, “Oil Price Shocks and Emerging Stock Markets: A Generalized VAR
Approach,” International Journal of Applied Econometrics and Quantitative Studies, Vol. 1-2, pp. 27-40
McGuire, P. and N. Tarashev, 2008, “Global Monitoring with the BIS International Banking
Statistics,” BIS Working Paper No. 244 (Basle, Switzerland: Bank for International Settlements)
Rebucci, A. and N. Spatafora, 2006, “Oil Prices and Global Imbalances”, in IMF World
Economic Outlook, April 2006: Globalization and Inflation, Chapter II (Washington D.C., International Monetary Fund), pp. 71-96
23
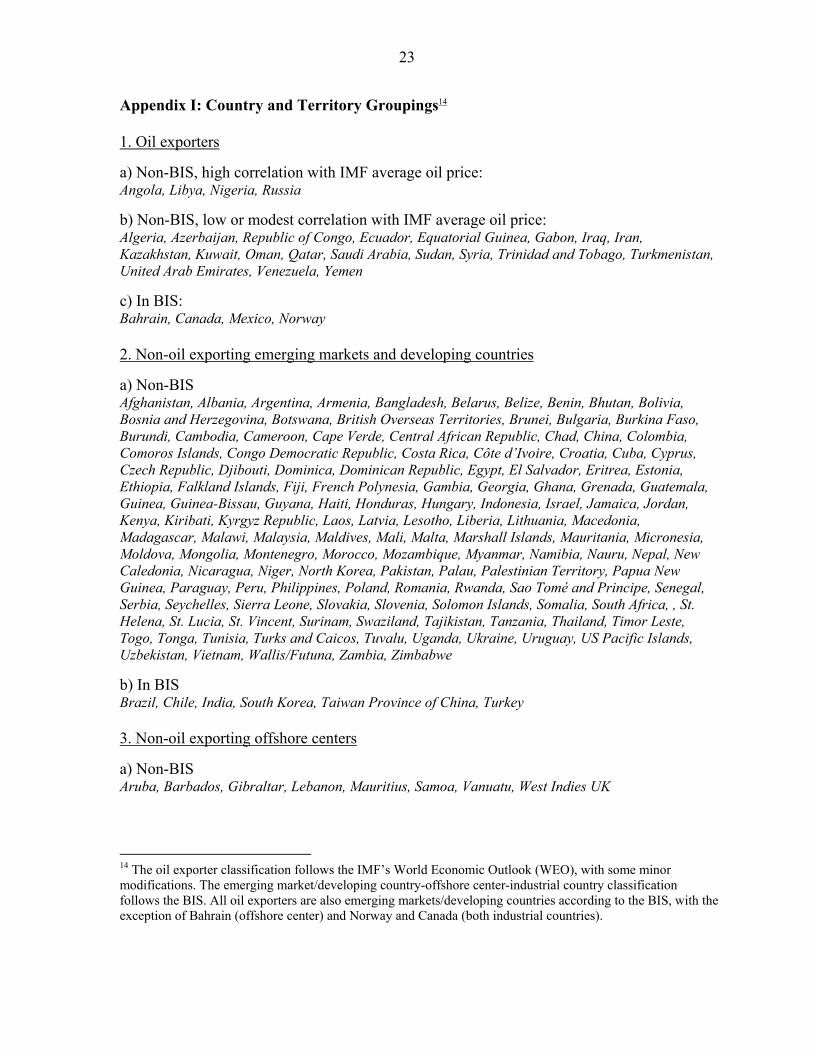
Appendix I: Country and Territory Groupings14 1. Oil exporters a) Non-BIS, high correlation with IMF average oil price: Angola, Libya, Nigeria, Russia b) Non-BIS, low or modest correlation with IMF average oil price: Algeria, Azerbaijan, Republic of Congo, Ecuador, Equatorial Guinea, Gabon, Iraq, Iran, Kazakhstan, Kuwait, Oman, Qatar, Saudi Arabia, Sudan, Syria, Trinidad and Tobago, Turkmenistan, United Arab Emirates, Venezuela, Yemen c) In BIS: Bahrain, Canada, Mexico, Norway 2. Non-oil exporting emerging markets and developing countries a) Non-BIS Afghanistan, Albania, Argentina, Armenia, Bangladesh, Belarus, Belize, Benin, Bhutan, Bolivia, Bosnia and Herzegovina, Botswana, British Overseas Territories, Brunei, Bulgaria, Burkina Faso, Burundi, Cambodia, Cameroon, Cape Verde, Central African Republic, Chad, China, Colombia, Comoros Islands, Congo Democratic Republic, Costa Rica, Côte d’Ivoire, Croatia, Cuba, Cyprus, Czech Republic, Djibouti, Dominica, Dominican Republic, Egypt, El Salvador, Eritrea, Estonia, Ethiopia, Falkland Islands, Fiji, French Polynesia, Gambia, Georgia, Ghana, Grenada, Guatemala, Guinea, Guinea-Bissau, Guyana, Haiti, Honduras, Hungary, Indonesia, Israel, Jamaica, Jordan, Kenya, Kiribati, Kyrgyz Republic, Laos, Latvia, Lesotho, Liberia, Lithuania, Macedonia, Madagascar, Malawi, Malaysia, Maldives, Mali, Malta, Marshall Islands, Mauritania, Micronesia, Moldova, Mongolia, Montenegro, Morocco, Mozambique, Myanmar, Namibia, Nauru, Nepal, New Caledonia, Nicaragua, Niger, North Korea, Pakistan, Palau, Palestinian Territory, Papua New Guinea, Paraguay, Peru, Philippines, Poland, Romania, Rwanda, Sao Tomé and Principe, Senegal, Serbia, Seychelles, Sierra Leone, Slovakia, Slovenia, Solomon Islands, Somalia, South Africa, , St. Helena, St. Lucia, St. Vincent, Surinam, Swaziland, Tajikistan, Tanzania, Thailand, Timor Leste, Togo, Tonga, Tunisia, Turks and Caicos, Tuvalu, Uganda, Ukraine, Uruguay, US Pacific Islands, Uzbekistan, Vietnam, Wallis/Futuna, Zambia, Zimbabwe b) In BIS Brazil, Chile, India, South Korea, Taiwan Province of China, Turkey 3. Non-oil exporting offshore centers a) Non-BIS Aruba, Barbados, Gibraltar, Lebanon, Mauritius, Samoa, Vanuatu, West Indies UK
14 The oil exporter classification follows the IMF’s World Economic Outlook (WEO), with some minor modifications. The emerging market/developing country-offshore center-industrial country classification follows the BIS. All oil exporters are also emerging markets/developing countries according to the BIS, with the exception of Bahrain (offshore center) and Norway and Canada (both industrial countries).

24
b) In BIS Bahamas, Bermuda, Cayman Islands, Guernsey, Hong Kong SAR, Isle of Man, Jersey, Macao SAR, Netherlands Antilles, Panama, Singapore 4. Non-oil exporting industrial countries a) Non-BIS Andorra, Iceland, Liechtenstein, New Zealand, Vatican b) In BIS Australia, Austria, Belgium, Denmark, Finland, France, Germany, Greece, Ireland, Italy, Japan, Luxembourg Netherlands, Portugal, Spain, Sweden, Switzerland, United Kingdom, United States

25
Appendix II: Detailed Descriptive Statistics
Standard MacKinnon Standard MacKinnonMean deviation appr. P-value Mean deviation appr. P-value
Deposit flows 385.7 285.1 0.000 382.4 224.4 0.077
Liability Flows 539.7 277.1 0.000 564.0 298.8 0.091
Q2 2001-Q4 2006
in bill. of US dollarsin bill. of US dollars
IFS Data--Quarterly Flows
Q1 1996-Q3 2007
Standard MacKinnon Standard MacKinnonMean deviation appr. P-value Mean deviation appr. P-value
A) Deposit flows
Total 313.6 368.0 0.012 348.6 329.8 0.003
From oil exporters 19.1 28.6 0.003 23.5 32.3 0.154Non-BIS, high correlation
IMF average oil price 8.2 13.5 0.000 12.6 14.2 0.097Non-BIS, low correlation
IMF average oil price 5.2 11.2 0.001 6.1 13.3 0.071In BIS 5.7 13.6 0.000 4.9 16.8 0.002
From non-oil exporting emerging markets 16.1 24.9 0.000 19.5 27.6 0.124Non-BIS 12.2 16.2 0.174 13.5 17.0 0.707In BIS 3.9 15.5 0.000 6.1 15.0 0.000
From non-oil exporting offshorecenters 59.3 72.3 0.000 70.6 83.5 0.000Non-BIS 4.9 5.9 0.014 5.9 6.9 0.196In BIS 54.4 68.4 0.000 64.6 76.0 0.000
From non-oil exporting industrialcountries 219.1 295.5 0.000 235.0 259.4 0.000Non-BIS 0.8 2.2 0.000 1.2 2.8 0.173In BIS 218.3 295.4 0.000 233.8 258.3 0.000
Q2 2001-Q4 2006
in bill. of US dollarsin bill. of US dollars
BIS Data--Quarterly Cross-Border Flows
Q1 1996-Q3 2007

26
Standard MacKinnon Standard MacKinnonMean deviation appr. P-value Mean deviation appr. P-value
B) Liability Flows
Total 326.5 378.5 0.003 359.3 339.2 0.012
From oil exporters 19.5 29.1 0.002 23.5 32.3 0.154Non-BIS, high correlation
IMF average oil price 8.2 13.5 0.000 12.6 14.2 0.097Non-BIS, low correlation
IMF average oil price 5.2 11.2 0.000 6.1 13.3 0.071In BIS 6.1 14.1 0.000 4.9 16.8 0.002
From non-oil exporting emerging markets 16.5 25.6 0.000 19.9 28.1 0.102Non-BIS 12.1 16.4 0.318 13.3 16.8 0.729In BIS 4.4 16.1 0.000 6.7 15.2 0.000
From non-oil exporting offshorecenters 60.2 73.2 0.000 71.6 84.5 0.001Non-BIS 5.1 6.2 0.016 6.2 7.3 0.355In BIS 55.2 69.0 0.000 65.4 80.2 0.000
From non-oil exporting industrialcountries 230.4 302.9 0.000 244.0 267.4 0.000Non-BIS 0.9 2.2 0.000 1.2 3.0 0.149In BIS 229.5 302.5 0.000 242.8 266.2 0.000
C) Loan flows
Total 288.7 386.0 0.001 322.4 349.7 0.006
To emerging market economies 17.8 37.1 0.303 21.2 27.2 0.125Oil exporting 5.6 12.0 0.903 6.4 8.6 0.220Non-oil exporting 12.2 28.3 0.033 14.8 21.7 0.021
In Europe/Central Asia 10.0 15.9 0.947 11.3 12.0 0.288In East and South Asia 2.9 19.1 0.000 7.0 16.6 0.000In the Middle East and Africa 3.6 7.1 0.042 4.0 6.5 0.352In Latin America 1.3 7.5 0.286 -1.2 4.9 0.715
D) Asset flows
Total 420.9 463.2 0.010 478.0 431.8 0.034
To emerging market economies 26.3 48.6 0.347 30.9 38.5 0.314
Q2 2001-Q4 2006
in bill. of US dollarsin bill. of US dollars
BIS Data--Quarterly Cross-Border Flows (continued)
Q1 1996-Q3 2007