BANK OF UGANDA · PDF fileAnnual Supervision Report December 2015 | Bank Of Uganda iii ... CRS...
48
BANK OF UGANDA ANNUAL SUPERVISION REPORT December 2015 | Issue No. 6 © Bank of Uganda 2016 Address: 37/45 Kampala Road Postal: P.O. Box 7120, Kampala Tel: +256 414 258 441-6 Fax: +256 414 233 818 Email: [email protected] Web: www.bou.or.ug ISSN print: 2079-6293 ISSN web: 2079-6307
-
Upload
trinhtuong -
Category
Documents
-
view
217 -
download
0
Transcript of BANK OF UGANDA · PDF fileAnnual Supervision Report December 2015 | Bank Of Uganda iii ... CRS...

BANK OF UGANDA
ANNUAL SUPERVISION REPORT
December 2015 | Issue No. 6
© Bank of Uganda 2016
Address: 37/45 Kampala Road
Postal: P.O. Box 7120, Kampala
Tel: +256 414 258 441-6
Fax: +256 414 233 818
Email: [email protected]
Web: www.bou.or.ug
ISSN print: 2079-6293
ISSN web: 2079-6307

ii Annual Supervision Report December 2015 | Bank Of Uganda

Annual Supervision Report December 2015 | Bank Of Uganda iii
Contents FOREWORD ................................................................................................................................. v PART I: SUPERVISION OF FINANCIAL INSTITUTIONS .............................................................................. 1 Chapter 1: Supervision of Financial Institutions ................................................................................ 2 1.1 Introduction ............................................................................................................................................. 2 1.2 On-site inspection.................................................................................................................................... 2 1.3 Off-site analysis of banks .......................................................................................................................... 3 Chapter 2: Regulatory Reforms and New Developments to Strengthen the Financial Sector ................ 5 2.1 Licensing, approvals and expansion ......................................................................................................... 5 2.2 Regulatory reforms.................................................................................................................................. 6 2.4 Deposit Protection Fund (DPF) ................................................................................................................. 7 2.5 Credit reference bureau services .............................................................................................................. 8 2.6 Strengthening capacity for supervision ................................................................................................... 8 2.7 Regional cooperation ............................................................................................................................... 9 PART II: ASSESSMENT OF FINANCIAL STABILITY ................................................................................... 11 Chapter 3: Performance of the Banking Sector ............................................................................... 12 3.1 Changes in banks’ assets and liabilities ................................................................................................... 12 3.4 Performance of credit ............................................................................................................................. 14 3.5 Earnings and profitability ....................................................................................................................... 16 3.6 Sensitivity to market risk ........................................................................................................................ 17 3.7 Performance of Domestic Systemically Important Banks........................................................................ 17 Chapter 4: Performance of Non-Bank Financial Institutions and Oversight of Payment Systems ........ 18 4.1 Credit institutions ................................................................................................................................... 19 4.2 Microfinance deposit-taking institutions (MDIs) .................................................................................... 20 4.4 Oversight of payment systems .............................................................................................................. 22 Chapter 5: Macroprudential Assessment and Outlook ..................................................................... 25 5.1 Risks from the macroeconomy ...............................................................................................................25 5.2 Risks from bank lending ..........................................................................................................................25 PART III: SPECIAL TOPIC ............................................................................................................................ 27 Chapter 6: Highlights of the Financial Institutions Act (2004) Amendments ...................................... 28 6.1 Introduction ........................................................................................................................................... 28 6.3 Agent Banking ....................................................................................................................................... 28 6.4 Islamic Banking ..................................................................................................................................... 28 6.5 Bancassurance ........................................................................................................................................ 30 6.6 The Deposit Protection Fund .................................................................................................................. 30 6.7 Revision of Capital .................................................................................................................................. 30 6.8 Credit Reference Bureau......................................................................................................................... 31 6.10 Conclusion ............................................................................................................................................ 32 PART IV: STATISTICAL APPENDICES ........................................................................................................ 32 APPENDIX 1: FINANCIAL SOUNDNESS INDICATORS FOR SUPERVISED FINANCIAL INSTITUTIONS ....... 33 APPENDIX 2: AGGREGATED BALANCE SHEETS FOR SUPERVISED FINANCIAL INSTITUTIONS ............... 36 APPENDIX 3: INCOME STATEMENTS FOR SUPERVISED FINANCIAL INSTITUTIONS ................................ 39 APPENDIX 4: CREDIT REFERENCE BUREAU ACTIVITIES (CUMULATIVE FIGURES)................................... 42

iv Annual Supervision Report December 2015 | Bank Of Uganda
ABBREVIATIONS AFRITAC Africa Regional Technical Assistance Centre
BCBS Basel Committee on Banking Supervision
BCPs Basel Core Principles
BOU Bank of Uganda
COMESA Common Market for Eastern and Southern Africa
CBR Central bank rate
CDS Central Depository System
CRB Credit Reference Bureau
CRS Credit Reference System
CSD Central Securities Depository
DPF Deposit Protection Fund
EAC East African Community
EAPS East African Payment System
ECS Electronic Clearing System
EFT Electronic Funds Transfer
FCS Financial Card System
FEA Foreign Exchange Act 2004
FIA Financial Institutions Act 2004
FL Financial Literacy
FSAP Financial Sector Assessment Program
GDP Gross Domestic Product
GIZ Deutsche Gesellschaft für Internationale Zusammenarbeit
IADI International Association of Deposit Insurers
IMF International Monetary Fund
KfW German Kreditanstalt fur Wiederaufbau
LCR Liquidity Coverage Ratio
LTV Loan to Value
MAC Monetary Affairs Committee
MDIs Microfinance deposit-taking institutions
MFPED Ministry of Finance, Planning and Economic Development
NIM Net Interest Margin
NPLs Non-performing loans
NSSF National Social Security Fund
REPSS Regional Payment and Settlement System
ROA Return on average assets
ROE Return on average equity
RTGS Real Time Gross Settlement System
SACCO Savings and credit cooperative
SFI Supervised Financial Institution
SIFI Systemically Important Financial Institution
UNISS Ugandan National Inter-bank Settlement System
URBRA Uganda Retirement Benefits Regulatory Authority
Ushs Uganda Shillings

Annual Supervision Report December 2015 | Bank Of Uganda v
FOREWORD
The Annual Supervision Report is published by Bank of Uganda to provide information on the Bank’s
supervisory activities during the year and the reforms to the regulatory framework, along with the
performance of the financial system and potential risks to stability.
The banking industry in Uganda remains resilient to shocks with
adequate capital and liquidity buffers. The key Financial Soundness
Indicators show that banks performance improved in the year to
December 2015, compared to the year to December 2014.The Ratio of
Tier 1 capital held by Commercial banks was 18.6 percent in 2015, well
above the regulatory minimum of 8 percent. Annual net after tax
profits increased by 11.5 percent to USh. 541.2 billion between
December 2014 and December 2015. However, asset quality
deteriorated with the ratio of non-performing loans (NPLs) to total
gross loans rising from 4.1 percent to 5.3 percent between December
2014 and December 2015. Notwithstanding the above, the banking
sector has adequate capital to absorb losses.
During 2015, Bank of Uganda instituted several regulatory reforms
aimed at improving the soundness of the financial system. The
Financial Institutions Act 2004 was amended in January 2016. This has
paved way for the implementation of Agent Banking, Islamic Banking, bancassurance, the revision of
capital requirements and the reform of the Deposit Protection Fund (DPF). Bank of Uganda has put in place
initiatives to implement these reforms in 2016. The implementation of the Capital Conservation Buffer will
be expedited in order to further strengthen bank soundness. The DPF for Commercial Banks, Credit
Institutions and for the Microfinance Deposit-taking Institutions will be merged into a single Fund, which
shall be a separate legal entity from the Central Bank. Metropol (U) Ltd was licensed in November, 2015 as
the second Credit Reference Bureau in Uganda, which is expected to further improve loan quality.
Throughout the year ending December 2015, systemically important payment systems operated efficiently
and did not experience any major disruption or downtime.
Prof. E. Tumusiime-Mutebile
GOVERNOR


Annual Supervision Report December 2015 | Bank Of Uganda 1
PART I: SUPERVISION OF FINANCIAL INSTITUTIONS

2 Annual Supervision Report December 2015 | Bank Of Uganda
Chapter 1: Supervision of Financial Institutions
1.1 Introduction
This chapter presents the highlights of the activities
undertaken by Bank of Uganda to conduct
oversight of supervised financial institutions (SFIs)
through on-site inspections and offsite surveillance.
1.2 On-site inspection
The objective of on-site examination is to
determine the financial condition of SFIs and review
their risk management processes and their
compliance with all applicable laws, regulations,
prudential guidelines and supervisory
recommendations.
Commercial banks
During 2015, BOU conducted on-site examinations
of all the 25 licensed commercial banks. In line with
the risk based supervision approach, the on-site
examinations focused on the areas that posed the
highest risks to the banks All banks were
adequately capitalized. However, some banks
exhibited weaknesses in the management of
strategic, credit and Money Laundering and
Financing of Terrorism (ML/TF) risks as detailed
below;
a) Key supervisory concerns regarding strategic
risk include; unrealistic assumptions
underlying banks’ strategic objectives, delayed
implementation of initiatives and projects and
high staff turnover coupled with weak
succession planning.
b) With regard to credit risk, most banks’ credit
portfolios were highly concentrated among
the top 20 borrowers in each bank.
c) Some banks were yet to effectively automate
the suspicious transaction monitoring process,
undermining their ML/TF risk management
framework.
Following the on-site examinations, specific
directives were issued to banks to address the
identified supervisory concerns and follow-up
examinations were undertaken to assess
compliance thereof.
Credit institutions
During 2015, BOU conducted full scope on-site examinations of three out of the four Credit Institutions (CIs) and a follow-up examination of the other institution. Overall, all the credit Institutions remained well capitalized, liquid and financially sound during the year ended December 2015.
However, examination findings revealed
weaknesses in the management of most risks
inherent in the CI’s business activities. The key
supervisory concerns related to strategic and
corporate governance, credit and operational risks.
Specific and time-bound directives were issued to
the institutions to address the concerns raised.
BOU will continue to exercise close supervision of
the CIs through off-site surveillance, review of both
internal and external audit reports and targeted
onsite examinations in a bid to ensure safety of
depositors’ funds, financial soundness and
compliance with statutory and regulatory
requirements. All the CIs are expected to remain
well capitalized, profitable and financially sound in
the coming year.
Microfinance deposit-taking institutions
As at December 31, 2015, the three Microfinance
Deposit-taking Institutions (MDI) were financially
sound, liquid and adequately capitalized. The
overall financial rating of the MDIs was satisfactory.
The onsite inspections of MDIs revealed a number
of challenges. The key supervisory concerns
highlighted in the on-site inspections related to
high levels of risk in the strategic, operational,
credit and compliance risk.

Annual Supervision Report December 2015 | Bank Of Uganda 3
Foreign exchange bureaus and money remittance
companies
The Foreign Exchange Bureau and Money
remittance sector remained financially sound and
well capitalized. All foreign exchange bureaus and
money remitters maintained total capital and
reserves above the statutory requirement of
Ushs.20 million. The total number of foreign
exchange bureaus and money remittance outlets
increased from 471 as at end December, 2014 to
505 as at end December, 2015. This comprised of
280 Foreign Exchange Bureau outlets) and 225
money remittance outlets. As at December, 2015,
the Money Remitters comprised of 60 Foreign
Exchange Bureaus, 3 Credit Institutions and 3
Microfinance Deposit-taking Institutions.
Forty nine (49) onsite examinations and thirty five
(35) follow-up examinations for foreign exchange
bureaus and money remitters were conducted
during the year. The findings indicated that there
were some lapses with regard to the identification
of suspicious transactions and the recording of the
source and purpose of funds. It was also noted that
there was limited understanding of the provisions
of the AML Act, 2013, particularly the requirement
for enhanced due diligence for suspicious customer
transactions. Directives were issued for the
institutions to address the gaps identified.
All foreign exchange bureaus continued to submit
periodic offsite returns throughout the year. In
order to improve the accuracy and timeliness of
offsite reports, foreign exchange bureaus were
directed to procure and install Management
Information Systems (MIS) with the capacity of
generating electronic receipts. These MIS solutions
have supported the submission of electronic returns
via the Banking Supervision Application and greatly
enhanced electronic processing of information.
Payment Systems
Bank of Uganda oversees payment systems to
support confidence in the national currency and
financial stability. There were a number of payment
system oversight activities conducted by the BoU
during 2015 and these include; monitoring the
usage and operational performance of Uganda’s
Real Time Gross Settlement System (RTGS) and
the Electronic Clearing System (ECS) as well as
payment instruments’ such as mobile money and
Automated Teller Machines (ATMs).
In 2015, payment and settlement systems
continued to operate satisfactorily, with key
systems processing payments effectively, and
exhibiting a high degree of availability.
1.3 Off-site analysis of Supervised Financial
Institutions (SFIs)
Bank of Uganda continued to conduct periodic off-
site surveillance of SFIs through the collection and
analysis of financial information submitted to it Off-
site analysis plays a key role in the planning of
scheduled on-site examinations of SFIs and in the
implementation of the risk-based supervision
methodology. It also ensures that the SFIs comply
with statutory and prudential requirements.
Stress testing
Stress tests were conducted on a quarterly basis to
quantify the magnitude of losses which banks
would incur in the event that they encounter
specific shocks, and the impact of these losses on
the banks’ capital. The shocks included in the stress
tests were:
a) Decline in net interest margin,
b) Decrease in interest income on government
securities,

4 Annual Supervision Report December 2015 | Bank Of Uganda
c) Depreciation of the Uganda Shilling against the
United States dollar,
d) Increase in non-performing loans and,
e) A 100 percent loan loss of each bank’s largest
borrowers.
The shocks chosen were those considered plausible
and realistic while others are pegged to previous
adverse experiences such as the bank closures of
1999 to 2001 and the economic downturn of
2011/2012. The results of the tests conducted on
the banks’ financial positions at the end of
December 2015 are shown in Table 1.
Table 1: Stress test shock for quarter ended 31st
December, 2015
Source: Bank of Uganda
Notes:
a) The number of banks which fail the stress test in each
category.
b) This is the amount of additional capital that would be required
to restore the affected institutions’ capital to the minimum
statutory levels.
The analysis of default by the banks’ three largest
borrowers and an increase in NPLs by 200 percent
revealed large potential losses. It showed that if
each bank’s three largest borrowers were to
default, with a loan loss of 100 percent, 17 banks
would become under-capitalised with an aggregate
capital shortfall of Ush. 595.4 billion. If NPLs were
to increase by 200 percent, assuming the increase is
in the loss category which requires full
provisioning, 11 banks would become under-
capitalised with an aggregate capital shortfall of
Ush.310.0 billion. A decline in the net interest
margin, decrease in interest income from
government securities and depreciation of the
Uganda shilling would not require any additional
capital from the banks.
Stress Test Variable
Number
of
banks a)
Aggregate l
capital
shortfall
(Ush. billion)
b)
Decline in net interest margin
Decrease in net interest income by
20 percent 0 0.0
Decrease in net interest income by
50 percent 0 0.0
Decrease in interest income from
government securities
Decrease in income from
government securities by 20
percent 0 0
Decrease in income from
government securities by 50
percent 0 0
Depreciation of Shilling against US
dollar
Depreciation of Ush. against US
Dollar by 20 percent 0 0.0
Depreciation of Ush. against US
Dollar by 30 percent 0 0.0
Increase in non-performing loans
Increase in NPLs by 100 percent 4 25.5
Increase in NPLs by 200 percent 11 310.0
Loan loss of each bank’s largest
borrowers
Default by single largest borrower 9 43.2
Default by 3 largest borrowers 17 595.4

Annual Supervision Report December 2015 | Bank Of Uganda 5
Chapter 2: Regulatory Reforms and New Developments to Strengthen the Financial
Sector
2.1 Licensing, approvals and expansion
Statutory Management of Imperial Bank (U) Ltd On October 13, 2015, the Central Bank of Kenya
(CBK) placed Imperial Bank Kenya Limited, the
majority Shareholder of Imperial Bank (U) Limited
(IBUL), under receivership. Consequently, Bank of
Uganda took over the management of IBUL and
subsequently appointed a statutory manager to
control the affairs of the bank until resolution of
IBUL’s Shareholding.
Bank of Uganda formally exited the statutory
management of Imperial Bank (U) Limited (IBUL)
on March 7, 2016 and withdrew the statutory
manager following a sale of the 58.6 percent
ordinary shares of IBUL formerly held by Imperial
Bank Kenya Limited to Exim Bank (Tanzania)
Limited.
Licencing
BOU issued a Microfinance Deposit-taking Institution licence to Yako Microfinance Limited in September 2015.
In addition, Bank of Uganda licensed Bata Forex
Bureau Limited, based in Arua town. Two branch
licences were issued to Guild Frank Forex Bureau,
Kabalagala Branch and Dahabshiil Money Transfer,
Mbale Branch.
Bank branches and automated teller machines
The expansion of financial services continued as
indicated by the increase in the number of bank
branches, which rose from 564 in 2014 to 573 in
2015, while the total number of automated teller
machines (ATMs) operated by commercial banks
increased from 830 to 842 in 2015, an increase of
1.4 percent. However, 56.0 per cent of bank
branches and 63.2 per cent of ATMs are located in
the Kampala and metro regions of Uganda.
Table 2: Number of licensed branches/outlets for
supervised financial institutions
2012 2013 2014 2015
Commercial bank branches 496 542 564 573
Bank ATMs 714 768 830 842
Foreign exchange bureaus 205
248 267 280
Money remitters 205
186 204 225
MDIs branches 99 70** 70 76
Credit institutions branches 47 52 55 57
Source: Bank of Uganda
**The decrease in number of branches was due to the upgrade
of Uganda Finance Trust to a commercial bank.
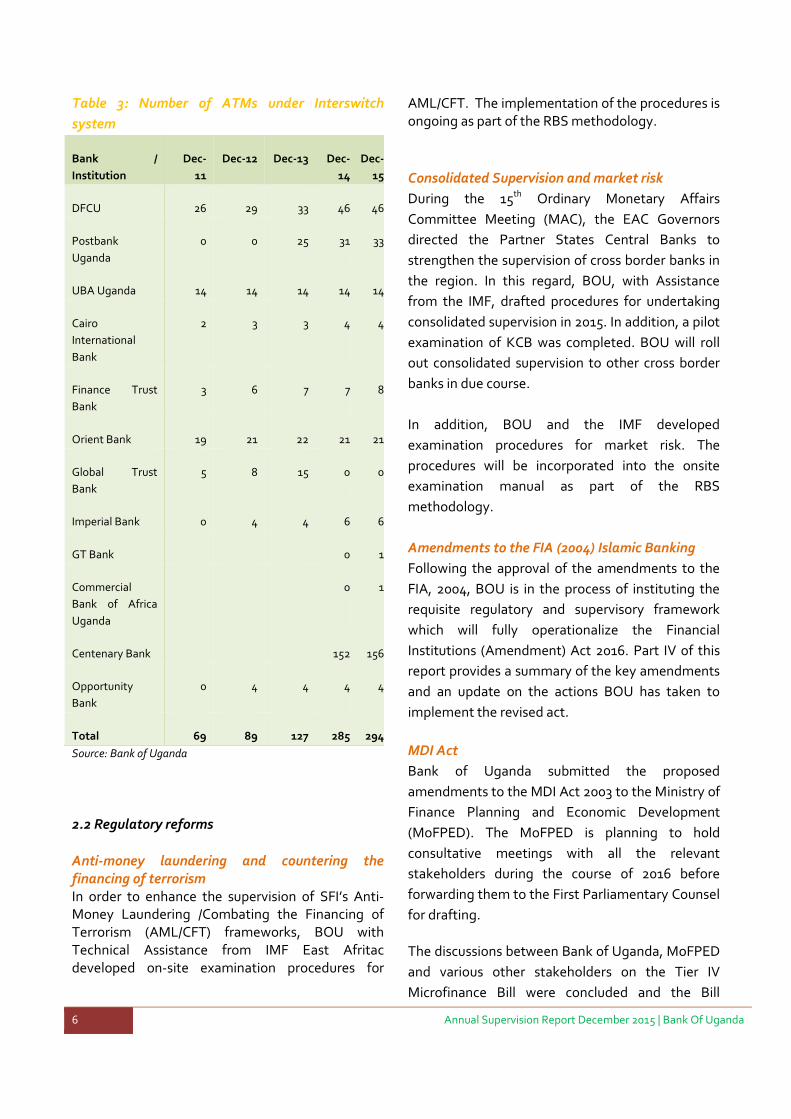
In addition, as at the end of December 2015, there
were 11 institutions connected to the Interswitch
network.1 Interswitch East Africa (Uganda) Limited
provides solutions that facilitate interoperability of
ATMs for a number of banks. Table 3 shows the
change in the number of ATMs linked to Interswitch
over the last 5 years.
1 Banks connected to the Interswitch network are; Guaranty
Trust Bank, Opportunity Bank, Postbank Uganda, United Bank for Africa, Cairo International Bank, DFCU, Commercial Bank of Africa, Finance Trust Bank, Imperial Bank Uganda, Orient Bank and Centenary Bank.
6 Annual Supervision Report December 2015 | Bank Of Uganda
Table 3: Number of ATMs under Interswitch
system
Bank /
Institution
Dec-
11
Dec-12 Dec-13 Dec-
14
Dec-
15
DFCU 26 29 33 46 46
Postbank
Uganda
0 0 25 31 33
UBA Uganda 14 14 14 14 14
Cairo
International
Bank
2 3 3 4 4
Finance Trust
Bank
3 6 7 7 8
Orient Bank 19 21 22 21 21
Global Trust
Bank
5 8 15 0 0
Imperial Bank 0 4 4 6 6
GT Bank 0 1
Commercial
Bank of Africa
Uganda
0 1
Centenary Bank 152 156
Opportunity
Bank
0 4 4 4 4
Total 69 89 127 285 294
Source: Bank of Uganda
2.2 Regulatory reforms
Anti-money laundering and countering the financing of terrorism In order to enhance the supervision of SFI’s Anti-Money Laundering /Combating the Financing of Terrorism (AML/CFT) frameworks, BOU with Technical Assistance from IMF East Afritac developed on-site examination procedures for
AML/CFT. The implementation of the procedures is ongoing as part of the RBS methodology.
Consolidated Supervision and market risk
During the 15th Ordinary Monetary Affairs
Committee Meeting (MAC), the EAC Governors
directed the Partner States Central Banks to
strengthen the supervision of cross border banks in
the region. In this regard, BOU, with Assistance
from the IMF, drafted procedures for undertaking
consolidated supervision in 2015. In addition, a pilot
examination of KCB was completed. BOU will roll
out consolidated supervision to other cross border
banks in due course.
In addition, BOU and the IMF developed
examination procedures for market risk. The
procedures will be incorporated into the onsite
examination manual as part of the RBS
methodology.
Amendments to the FIA (2004) Islamic Banking
Following the approval of the amendments to the
FIA, 2004, BOU is in the process of instituting the
requisite regulatory and supervisory framework
which will fully operationalize the Financial
Institutions (Amendment) Act 2016. Part IV of this
report provides a summary of the key amendments
and an update on the actions BOU has taken to
implement the revised act.
MDI Act
Bank of Uganda submitted the proposed
amendments to the MDI Act 2003 to the Ministry of
Finance Planning and Economic Development
(MoFPED). The MoFPED is planning to hold
consultative meetings with all the relevant
stakeholders during the course of 2016 before
forwarding them to the First Parliamentary Counsel
for drafting.
The discussions between Bank of Uganda, MoFPED
and various other stakeholders on the Tier IV
Microfinance Bill were concluded and the Bill

Annual Supervision Report December 2015 | Bank Of Uganda 7
passed by Cabinet. It is due to be presented to
Parliament for discussion. Once the bill is approved
by Parliament, Tier IV institutions, including
Savings and Credit Cooperative Organisations
(SACCOs) which meet a certain threshold of
volume of voluntary savings will come under the
regulation and supervision of the Bank of Uganda.
Those below the threshold will be under the
purview of the proposed Uganda Microfinance
Regulatory Authority.
Foreign Exchange Act and Regulations
There are gaps in regulatory framework for foreign
exchange bureau, which have posed challenges in
the enforcement of compliance and the evaluation
of product innovations. For example, the law does
not explicitly provide for civil penalties as
administrative sanctions. In addition, the law does
not provide room for new product innovations that
have emerged over the years, such as transmission
of money remittances into beneficiaries mobile
phones/mobile wallets.
To address the regulatory gaps and promote the
continued safety and stability, Bank of Uganda
finalised the proposed amendment of the Foreign
Exchange Act, 2004 and the Foreign Exchange
(Forex Bureaus and Money Remittance)
Regulations, 2006. The amendments were
submitted to MoFPED and Bank of Uganda shall
continue to follow-up to ensure that they are acted
on expeditiously.
Nevertheless, BOU has received applications for new products with most of them aiming at leveraging the wide and cost effective outreach of the mobile money platforms. Given that these products were not envisaged at the time of enacting the current laws, the proposals are being evaluated on a case by case basis by BOU.
In addition, supervisory activities in the foreign
exchange bureau and money remittance sector
have continued to be negatively impacted by the
low levels of governance awareness in the industry.
This is being addressed through continued public
awareness workshops. The signing of the MOU
with the Uganda Forex Bureau and Money
Remittance Association (UFBMRA) for example will
pave way for the joint coordination and
arrangement of training workshops for the players
in the sector.
2.4 Deposit Protection Fund (DPF)
During the year, Bank of Uganda continued to
administer the Deposit Protection Funds (DPF) for
Commercial Banks and Credit Institutions (under
the FIA, 2004) and Microfinance Deposit-taking
Institutions (under the MDI Act, 2003). All
institutions paid their annual premiums for 2015
while those whose performance was rated marginal
and unsatisfactory paid the risk-adjusted premiums
accordingly.
The FIA 2004 was amended in January 2016 which
paved way for the reform of the Deposit Protection
Fund. Key highlights in the amended Act include;
the Deposit Protection Funds (DPF) for Commercial
Banks and Credit Institutions (under the FIA, 2004)
and Microfinance Deposit-taking Institutions (under
the MDI Act, 2003) will be merged into a single
Fund, the Fund shall be a separate legal entity from
the Central Bank and the Fund may act as a receiver
or liquidator of a financial institution, if appointed
for that purpose by the Central Bank.
Deposit Protection Fund for Commercial banks
and Credit Institutions
The market value of the DPF for banks under the
FIA 2004 increased in 2015. The total fund

8 Annual Supervision Report December 2015 | Bank Of Uganda
amounted to Ushs. 312.8 billion as at December
31,2015, comprising of treasury bills (Ushs. 117.2
billion), treasury bonds (Ushs. 175.8 billion) and
cash (Ushs. 19.8 billion).
Deposit Protection Fund for Microfinance Deposit-
taking Institutions
As at December 31, 2015, the market value of the
DPF under the MDI Act, 2003 amounted to Ushs.
9.6 billion, comprising of treasury bills (Ushs. 4.7
billion), treasury bonds (Ushs. 4.7 billion) and cash
(Ushs.0.2 million).
2.5 Credit reference bureau services
The number of financial cards delivered to
Participating Institutions during 2015 were 142,738,
raising the cumulative number of cards to 1,235,845
registered from 617 branches installed on the
financial card system. A total of 613,829 credit
enquiry records were recorded on the CRB, raising
the cumulative number of credit enquiry records to
2,948,915 as at end December,2015.
During the course of the year, Metropol U Limited
was granted full licence to operate credit reference
bureau in Uganda, bringing the number of CRB
operators to two. Metropol was expected to go live
in March 2016.
As part of the opening up the market to
competition, the process of separation of the
financial card system from the Credit Reference
bureau had commenced. However following the
enactment of the Registration of Persons Act 2015,
there was a perceived conflict between Bank of
Uganda's mandate to licence a biometric system
provider and the Act. Consequently the licensing
process was halted pending clearance from
Solicitor General's Office which was received in
January 2016. The negotiations with M/s
Technobrain Limited are set to resume.
Following the amendment of the Financial
Insitutions Act in January 2016, the proposed
expansion of the CRB system to other lenders
outside the ambit of Bank of Uganda was hence
permitted. Consequently, BOU is finalising the draft
Credit Reference Service Regulations to regulate
the competitive market environment and the
acredited Credit providers.
Other developments
The Federal Republic of Germany through KFW
agreed to support Bank of Uganda to undertake the
following activities:
a) Public awareness for the credit reference
system deposit protection fund and financial
literacy linked to the 2016 World savings Day
Activities.
b) Support Bank of Uganda and Participating
Institutions in improving the utilisation of
credit reference bureau data.
2.6 Strengthening capacity for supervision
Home-Host Supervisory Relationships
In line with the Basel Core Principle 13 on Home-
Host relationships, the BOU was represented at
supervisory colleges for Standard Chartered Bank,
Stanbic bank, Barclays Africa Group, United Bank
for Africa, Equity Bank, Kenya Commercial Bank
and Diamond Trust Bank.
The supervisory college meetings emable BOu to
obtain a better understanding of the operations of
the Parent Banking Groups of Ugandan banks, the
risks they face and ability to address the challenges.
A key objective for all groups is to put in place
‘living wills’ that would facilitate the efficient
resolution of these groups. Following a directive
from the Reserve Bank of South Africa, which is the
home supervisor of Barclays Africa Group and
Stanbic bank, the two banks have embarked on

Annual Supervision Report December 2015 | Bank Of Uganda 9
drafting group resolution plans which will also apply
to their Ugandan subsidiaries.
Uganda Forex Bureau and Money Remittance
Association
Bank of Uganda signed a Memorandum of
Understanding with the Uganda Forex Bureau and
Money Remittance Association (UFBMRA). The
MOU is expected to increase the cooperation
between BOU and UFBMRA and to promote self-
regulation in the forex bureau and money
remittance sub-sector.
In an effort to improve Governance awareness in
the sector a training workshop was held for the
Directors and Managers of Forex Bureaus and
Money Remittance companies on October 8, 2015.
Discussions were held with participants on a
number of areas, including; submission of statutory
returns to Bank of Uganda, consolidated reporting,
Risk Based Supervision, operational and
compliance risk management, cyber security
vulnerabilities and the relevant mitigation
strategies.
Oversight of Payment Systems
In the two years since BOU created a unit to
conduct oversight of payment systems, the
capacity for conducting compliance assessments
has been significantly strengthened through
training and TA from the IMF. A Draft Oversight
Framework and an Oversight Procedures Manual
were completed in 2015 with assistance from the
IMF and Systemically Important Payment Systems
(SIPS) were identified using CPSS-IOSCO
principles. In addition, a data reporting framework
was implemented and rolled out to all banks to
compile data for monitoring the safety and
reliability of payment services.
BOU is working with other stakeholders to follow
up the expeditious enactment of the National
Payments Systems Act. A consultant has been
hired to the National Payments System policy,
which is expected to be completed by May 2016.
2.7 Regional cooperation
Regulatory harmonisation in the East African
Community
The EAC Secretariat constituted the Technical
Working Group on Microfinance (TWG), comprising
of representatives from the MFIs
Regulatory/supervisory Authorities, the Association
of MFIs, the EAC Partner States’ Ministries of
Finance and the East African Microfinance Network
to review and conclude on the main tenets of the
draft EAC Microfinance Policy.
The EAC TWG on Macroprudential Statistics
harmonized definitions for a list of Financial
Soundness Indicators (FSIs) for banks. This will
enable the EAC region to produce and disseminate
cross-country comparable indicators in order to
improve the capacity to monitor regional financial
stability and inform policy decisions.
Under the TWG on Macroprudential Analysis and
Stress Testing, the EAC Partner states are working
with the IMF to enhance systemic risk analysis and
aim to undertake a regional stress test exercise and
draft a risk assessment report for MAC by
December 2016. This is aimed at harmonising
financial stability practices across the East African
region as a convergence criterion for the monetary
union.
In addition, during 2015, the TWG on Crisis
Management agreed and harmonised a list of
10 Annual Supervision Report December 2015 | Bank Of Uganda
measures to enhance the resolution powers,
processes and enabling legislation for financial
institutions in the EAC Partner States. With IMF TA
in January 2016 the TWG also developed ten
harmonised principles for Emergency Liquidity
Assistance (ELA) frameworks for the EAC. This will
facilitate harmonisation and convergence of crisis
management arrangements in the EAC region and
enhance the orderly resolution of domestic
financial crises, cross-border banks and limit the
potential for contagion across borders.

Annual Supervision Report December 2015 | Bank Of Uganda 11
PART II: ASSESSMENT OF FINANCIAL STABILITY
12 Annual Supervision Report December 2015 | Bank Of Uganda
Chapter 3: Performance of the Banking Sector
This chapter provides an overview of the Banking Sector performance in 2015. Overall, the banking system
remained sound, with bank liquidity and capital buffers remaining well above the minimum requirement.
However, there was a rise in credit risk as shown by the increase in the ratio of non-performing loans to total
loans.
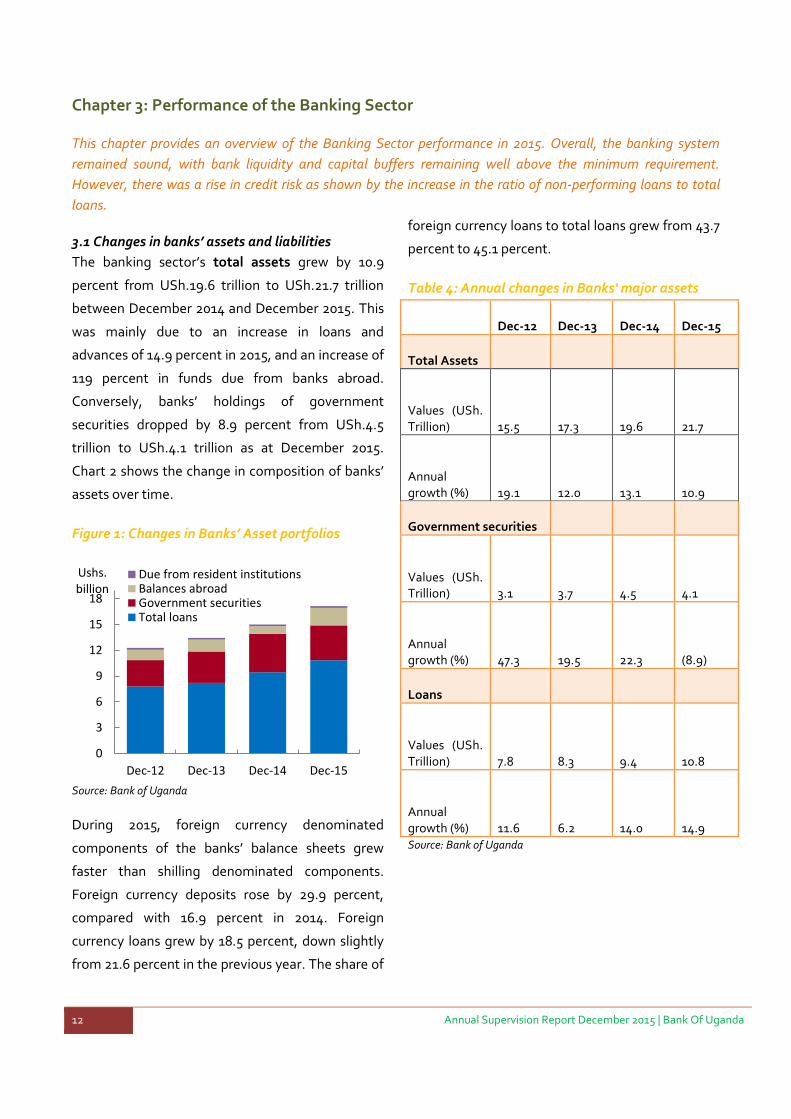
3.1 Changes in banks’ assets and liabilities
The banking sector’s total assets grew by 10.9
percent from USh.19.6 trillion to USh.21.7 trillion
between December 2014 and December 2015. This
was mainly due to an increase in loans and
advances of 14.9 percent in 2015, and an increase of
119 percent in funds due from banks abroad.
Conversely, banks’ holdings of government
securities dropped by 8.9 percent from USh.4.5
trillion to USh.4.1 trillion as at December 2015.
Chart 2 shows the change in composition of banks’
assets over time.
Figure 1: Changes in Banks’ Asset portfolios
Source: Bank of Uganda
During 2015, foreign currency denominated
components of the banks’ balance sheets grew
faster than shilling denominated components.
Foreign currency deposits rose by 29.9 percent,
compared with 16.9 percent in 2014. Foreign
currency loans grew by 18.5 percent, down slightly
from 21.6 percent in the previous year. The share of
foreign currency loans to total loans grew from 43.7
percent to 45.1 percent.
Table 4: Annual changes in Banks' major assets
Dec-12 Dec-13 Dec-14 Dec-15
Total Assets
Values (USh. Trillion) 15.5 17.3 19.6
21.7
Annual growth (%) 19.1 12.0 13.1
10.9
Government securities
Values (USh. Trillion) 3.1 3.7 4.5
4.1
Annual growth (%) 47.3 19.5 22.3
(8.9)
Loans
Values (USh. Trillion) 7.8 8.3 9.4
10.8
Annual growth (%) 11.6 6.2 14.0
14.9 Source: Bank of Uganda
0
3
6
9
12
15
18
Dec-12 Dec-13 Dec-14 Dec-15
Ushs. billion
Due from resident institutionsBalances abroadGovernment securitiesTotal loans

Annual Supervision Report December 2015 | Bank Of Uganda 13
Table 5: Foreign Currency denominated assets and
liabilities (percentage ratios)
Dec-
12
Dec-
13
Dec-
14
Dec-
15
Foreign currency
assets to total
assets
31.7 30.8 31.8 37.5
Foreign currency
liabilities to total
liabilities
36.2 38.1 39.2 44.2
Foreign currency
loans to total
loans
40.7 41.0 43.7 45.1
Foreign currency
deposits to total
deposits
34.9 36.1 36.7 42.5
Source: Bank of Uganda
3.2 Adequacy of banks’ capital
The banking sector held adequate capital to
withstand shocks at the end of December 2015. All
commercial banks met the minimum regulatory
capital adequacy requirements, with an aggregate
industry-wide tier 1 capital adequacy ratio and total
capital adequacy ratio of 18.6 percent and 21.0
percent respectively. The leverage ratio (regulatory
tier 1 capital to total assets plus off-balance sheet
items) was relatively stable at 11.1 during 2015.
Table 6: Capital Adequacy Ratios
Dec-
12
Dec-
13
Dec-
14
Dec-
15
Total Capital
Adequacy
Ratio
21.9 22.9 22.2 21.0
Tier 1 Capital
Adequacy
Ratio
18.8 19.9 19.7 18.6
Leverage Ratio 10.6 11.1 11.0 11.1
Source: Bank of Uganda
The total shareholders’ equity of the banking
system grew by 12.6 percent from USh.3.2 trillion
to USh.3.6 trillion between December 2014 and
December 2015.
Figure 2: Composition of banks’ capital
Source: Bank of Uganda
3.3 Funding and liquidity
Deposit Growth
Bank funding conditions remained stable with
deposits contributing 81.8 percent of the total
funding of the banking sector. The year-on-year
growth rate of deposits in 2015 was 12.1 percent,
down from 14.9 percent in 2014. Shilling deposits
grew by 1.8 percent to Ushs8.52 trillion compared
to a growth of 13.8 percent the previous year.
Foreign currency denominated deposits increased
by 30 percent to USh.6.3 trillion during the period
which was higher than the 16.9 percent growth in
the previous year.
0.0
0.5
1.0
1.5
2.0
2.5
3.0
3.5
Dec-12 Dec-13 Dec-14 Dec-15
Ushs. trillion
Other
Share premium
Retained reserves
Paid-up capital

14 Annual Supervision Report December 2015 | Bank Of Uganda
Figure 3: Annual growth in Customer Deposits
Source: Bank of Uganda
Interbank Activity
Total interbank volumes traded during 2015
amounted to USh.22.3 trillion, dropping from
USh.27.7 trillion in the previous year. The 7-day
weighted average and the overnight interbank
rates increased from 11 percent and 8.4 percent
respectively to 18.2 percent and 12.5 percent,
respectively.
Figure 4: Banks' sources of funding (as a percent of
total liabilities)
Source: Bank of Uganda
Liquidity
Commercial banks’ liquidity improved during 2015.
The nominal amount of liquid assets grew by 18.4
percent from USh.5.8 trillion to USh.6.9 trillion in
2015. The increase in liquid assets was largely due
to the rise in in funds due from banks abroad which
grew by 119 percent from Ush.0.92 trillion to USh.2
trillion between December 2014 and December
2015. The ratio of liquid assets to total deposits
stood at 46.4 percent, above the regulatory
minimum of 20 percent. In addition, the monthly
LCR results in December 2015 indicate that all but
one bank held sufficiently high quality liquid assets
to sustain them through a 30-day stress scenario.
Table 7: Key Indicators of bank liquidity (percent)
Dec-12 Dec-13 Dec-14 Dec-15
Liquid
assets to
total
deposits
42.0 42.5 43.9 46.4
Liquid
assets to
total
assets
28.4 28.2 29.7 31.7
Total loans
to total
deposits
7435 71.9 71.4 73.1
Interbank
borrowings
to total
deposits
3.3 4.1 2.6 2.7
Source: Bank of Uganda
3.4 Performance of credit
Lending activity
The annual credit growth increased from 14.0 percent in
2014 to 14.9 percent in December 2015. This was due to
the growth in shilling loans by 12 percent to Ush 5.9
trillion compared to the 8.7 percent growth in the
previous year. Growth of foreign currency loans declined
to 18.5 percent in 2015 to reach USh.4.9 trillion,
compared to the 21.6 percent growth in 2014.
-20
-5
10
25
40
55
% Shilling deposits
foreign currency deposits
76 81 86
Dec-12
Dec-13
Dec-14
Dec-15 Customerdeposits
Due toresidentinstitutions
Due to non-residentinstitutions

Annual Supervision Report December 2015 | Bank Of Uganda 15
Figure 5: Annual percentage growth of loans
Source: Bank of Uganda
The growth in shilling loans was despite the growth
in the commercial banks’ weighted average lending
rate that stood at 24.6 in December 2015 compared
to 20.7 percent in the previous year. The Central
Bank Rate (CBR) was increased from 11 percent in
December 2014 to 17 percent in December 2015.
The weighted average lending rate for foreign
currency loans decreased from 10.8 percent at the
end of December 2014 to 9.4 percent at the end of
December 2015.
Figure 6: Weighted average lending rates for
commercial banks
Source: Bank of Uganda
Analysis of bank lending by sector shows a shift
with the highest growth in loans during 2015 being
recorded in the manufacturing sector. Loans to the
manufacturing sector grew by 19.9 percent over the
period, compared to a growth of 7.1 percent in the
previous year. Building and construction sector
grew by 19.1 percent in 2015, compared to a 36.9
percent growth rate experienced in 2014.
Figure 7: Annual growth of bank loans by sector
(percentage)
Source: Bank of Uganda
Loan quality and non-performing loans
Commercial banks’ asset quality declined in 2015.
The Non– performing loans (NPL) ratio (NPLs to
total gross loans) rose from 4.1 percent in
December 2014 to 5.3 percent at the end of
December 2015. The volume of NPLs grew from
USh.389.6 billion in December 2014 to USh.573.4
billion in December 2015.
-10
5
20
35
50
65
80
Dec-12 Dec-13 Dec-14 Dec-15
% Shilling loans
Foreign currency loans
5
10
15
20
25
Dec-12 Dec-13 Dec-14 Dec-15
% Local Currency Rates
Foreign Currency Rates
Central Bank Rate (CBR)
-20
0
20
40
60
80
100
%
Agriculture
Manufacturing
Trade
Building & Construction
Personal loans

16 Annual Supervision Report December 2015 | Bank Of Uganda
Figure 8: Changes in banks’ NPLs
Source: Bank of Uganda
The industry NPL ratio for foreign currency loans
and shilling loans rose from 3.2 percent and 4.9
percent respectively in December 2014, to 5.0
percent and 5.6 percent respectively at the end of
December 2015. The shilling non-performing loans
grew by USh.40.3 billion and the foreign currency
non-performing loans grew by USh.143.5 billion in
the year to December 2015
Sectoral analysis of NPLs shows that Trade and
Commerce sector accounted for the largest share
of NPLs with 20.2 percent at the end of December
2015. The agriculture sector recorded the biggest
increase in its total bad loans by USh.117.8 billion,
majorly in foreign currency denominated NPLs. As
such, the sector’s NPL ratio rose from 5.6 percent
to 16.2 percent between December 2014 and
December 2015. On the other hand, the
manufacturing sector showed the most
improvement in loan performance. The sector’s
NPLs dropped by USh.36.4 billion, improving its
NPL ratio from 3.2 percent in December 2014 to 0.4
percent at the end of December 2015.
Figure 9: Sectoral non-performing loans (as a
percentage of total NPLs)
Source: Bank of Uganda
Table 8: NPLs for major business sectors (percent)
NPL Ratio
Dec 2014
Mar 2015
June 2015
Sept 2015
Dec 2015
Agriculture
Foreign currency 6.5 8.1 7.5 8.3 23.7
Shillings 4.5 5.2 4.6 4.8 6.7
Manufacturing
Foreign currency 2.3 2.3 2.7 0.0 0.2
Shillings 5.6 5.7 7.8 1.3 0.8
Trade & commerce
Foreign currency 1.9 2.1 5.2 6.3 1.4
Shillings 5.9 5.0 2.6 4.7 7.1
Transport
Foreign currency 5.5 6.0 5.1 4.0 3.2
Shillings 9.4 9.2 7.7 3.7 7.9
Building & construction
Foreign currency 3.4 4.3 4.0 3.7 5.6
Shillings 3.3 3.0 2.6 3.2 6.7
Personal & household loans
Foreign currency 4.7 5.7 5.7 6.4 4.8
Shillings 2.9 2.9 4.0 4.5 4.5
Industry ratio
Foreign currency 3.2 3.8 4.2 3.7 5.0
Shillings 4.9 4.6 3.8 4.0 5.6
Source: Bank of Uganda
3.5 Earnings and profitability
Banks’ annual after tax profits rose by 11.5 percent
to USh.541.2 billion in 2015. Provisions for bad
0.0
1.0
2.0
3.0
4.0
5.0
6.0
7.0
0
100
200
300
400
500
600
700
Sep-05 Sep-07
% Ushs. billion
NPLs (in billions)
NPLs to total gross loans(RHS)
0
5
10
15
20
25
30
35
Dec-12 Dec-13 Dec-14 Dec-15
AGRICULTURE
MANUFACTURING
TRADE &COMMERCE
TRANSPORT&COMMUNICATION
BUILDING &CONSTRUCTION
PERSONALANDHOUSEHOLDLOANS

Annual Supervision Report December 2015 | Bank Of Uganda 17
debts grew by only 2.6 percent to from USh.212.2
billion to USh.217.7 billion during 2015. However,
bank profitability ratios remained unchanged.
Average return on equity (ROE) dropped slightly
from 16.1 percent to 16.0 percent while return on
assets (ROA) was stable at 2.6 percent during 2015.
Income from loans and advances continued to
provide the largest share (54 percent) of total
banking sector income in 2015.
Figure 10: Composition of banks' income
Source: Bank of Uganda
Table 9: Profitability indicators for the banking
sector (percent)
2012 2013 2014 2015
ROA 3.9 2.5 2.6 2.6
ROE 24.2 15.2 16.1 16.0
Cost to income 70.9 77.2 68.7 69.2
Source: Bank of Uganda
3.6 Sensitivity to market risk
The proportion of the banks’ foreign currency
assets to total assets grew from 31.8 percent to 37.5
percent while the share of foreign currency deposits
to total deposits increased from 36.7 percent to
42.5 percent between December 2014 and
December 2015. The ratio of foreign currency
exposure to regulatory tier 1 (core) capital was at
5.9 percent at the end of December 2015 which was
well within the regulatory requirement of +/-25
percent. The ratio of foreign currency loans to
foreign currency deposits reduced from 64.5
percent in the previous year to 59.2 percent in
December 2015, which was still within the statutory
limit of 80 percent.
Table 10: Banks' foreign currency exposure
(percent)
Forex
exposure
to core
capital
Forex
assets to
forex
liabilities
Forex
loans to
forex
deposits
Forex
assets
to total
assets
Dec-12 -0.6 105.0 79.3 31.7
Dec-13 -3.0 96.8 62.2 30.8
Dec-14 -6.9 97.1 64.5 31.8
Dec-15 -5.9 101.8 59.2 37.5
Source: Bank of Uganda
3.7 Performance of Domestic Systemically
Important Banks
The performance of domestic systemically
important banks (D-SIBs)2 is crucial because of the
potential risks these banks pose, on account of their
systemic importance, to the financial system. In
2015, Ugandan D-SIBs accounted for 35.9 percent
of total banking sector assets, lower than 42.2
percent they accounted for in 2014. Indicators show
that the systemic risk posed by the three D-SIBs
remained low during 2015. However, there was a
decline in asset quality among D-SIBS with NPL
ratio rising from 3.5 percent in December 2014 to
7.6 percent in December 2015. While this reflected
the general performance of the banking sector, the
decline in quality among DSIBs was also on account
of the performance of one bank with a significant
2 The D-SIBs at December 2015 were Stanbic bank, Standard
Chartered bank and Crane bank.
-
500
1,000
1,500
2,000
2,500
3,000
3,500
Dec-12 Dec-13 Dec-14 Dec-15
USh. Billion
Charges & fees
Foreign currency operations
Off-balance sheet activities
Deposits with resident institutions
Government securities
Loans and advances

18 Annual Supervision Report December 2015 | Bank Of Uganda
exposure to one borrower. All the DSIBs have
adequate capital to absorb losses.
Table 11: Selected Indicators for D-SIBs (percent)
Indicator Dec-12 Dec-13 Dec-14 Dec-15
Tier 1 capital adequacy ratio 20.6 22.7 22.9 15.4
NPLs to total gross loans (NPL
ratio) 4.0 5.2 3.5 7.6
Total D-SIB assets to total
industry assets 49.71 44.7 42.2 35.9
Source: Bank of Uganda
3.8 Conclusion
In 2015, the performance of the banking sector
remained sound. Bank liquidity and capital buffers
remained well above the minimum requirements.
Profitability remained stable throughout 2015.
However, there was an increase in credit risk, with
the growth in the NPL ratio. Most of this credit
deterioration was in foreign currency denominated
loans. Moving forward, commercial banks should
remain vigilant to ensure that loan quality does not
deteriorate.
`

Annual Supervision Report December 2015 | Bank Of Uganda 19
Chapter 4: Performance of Non-Bank Financial Institutions and Oversight of Payment
Systems
This chapter presents the financial indicators for the non-bank financial institutions (NBFI) sector including
credit institutions, microfinance deposit-taking institutions, foreign exchange bureaux and money remittance
outlets. The Performance of Systemically Important Payment Systems is also presented.
4.1 Credit institutions
Overview
Total assets of the Credit Institutions (CIs) grew
strongly during 2015. Overall, total assets inceased
by 25.3 percent to USh.389.6 billion in 2015. The
increase is largely due to increased lending activity
and commencement of operations by Top Finance
Bank Limited (TFBL) in May 2015. The increase in
assets was also reflected in the rise in net loans and
advances by 20.3 percent from USh.187.3 billion as
at end December, 2014 to USh.225.3 billion as at
end December, 2015, while total deposits rose by
30.3 percent to UShs.254.3 billion over the same
period.
Indicators of financial soundness
Overall, all the credit Institutions remained well
capitalized, liquid and financially sound during the
year ended December 2015.
a) Capital adequacy
All the institutions maintained their respective
paid-up capital above the statutory minimum of
USh.1billion. The sector’s core capital and total
capital to risk weighted assets (RWA) ratios stood
at 21.4 percent and 23.4 percent respectively. The
core capital ratio had improved from 20.9 percent
as at end of December 2014. However, the total
capital ratio had declined from 25.5 percent as at
end of December 2014, largely due to the expiry of
a subordinated debt previously held at one of the
CIs. The overall core capital of the CIs stood at
USh.61.1 billion while total capital amounted to
USh.66.7 billion.
Figure 11: Capital adequacy ratios for credit
institutions
Source: Bank of Uganda
b) Asset quality
In 2015 Credit Institutions’ asset quality declined.
Non-performing loans increased by 11.7 percent
from USh.7.7 billion as at the end of December,
2014 to USh.8.6 billion as at the end December,
2015. However, a concurrent more than
proportionate increase in loans and advances
resulted in a decline in the ratio of non-performing
advances to total advances from 4.1 percent to 3.7
percent over the same period.
c) Earnings
Credit Institutions recorded overall year-to-date
profits of USh.1.0 billion during 2015. This reflected
a substantial drop in profitability of 80.0 percent
below the profits of USh.5.0 billion earned during
2014.This was largely attributed to an increase in
loan loss provisions and newly licensed Credit
institution(s) which are yet to recover their start-up
costs. Consequently, the resultant ROA and ROE
ratios stood at 0.3 percent and 1.4 percent
0
5
10
15
20
25
30
35
40
Dec-10 Dec-11 Dec-12 Dec-13 Dec-14 Dec-15
%
Core capital/RWA
Total capital/RWA
20 Annual Supervision Report December 2015 | Bank Of Uganda
respectively. Interest income continued to be the
major source of income for the CIs, contributing
USh.69.0 billion during 2015.
d) Liquidity
The Credit Institutions’ key liquidity indicators were
satisfactory. Liquid assets stood at USh.117.7 billion
while the ratios of liquid assets to total deposits and
loans to deposits were 46.3 percent and 82.4
percent respectively.
4.2 Microfinance deposit-taking institutions
(MDIs)
Overview
Total assets of MDIs grew by 24.2 percent, from
UShs.322.9 billion as at end December, 2014 to
UShs.401.0 billion as at end December, 2015. Gross
loans increased by 31.3 percent from UShs.206.0
billion to UShs.270.4 billion. Customer deposits
increased by 25.9 percent from UShs.145.2 billion
to UShs.182.9 billion over the review period. The
increase in deposits was attributed to the
continuous mobilization drive implemented by the
MDIs.
Indicators of financial soundness
Overall, MDIs were financially sound, profitable,
well capitalised and liquid during the year ended
December, 2015.
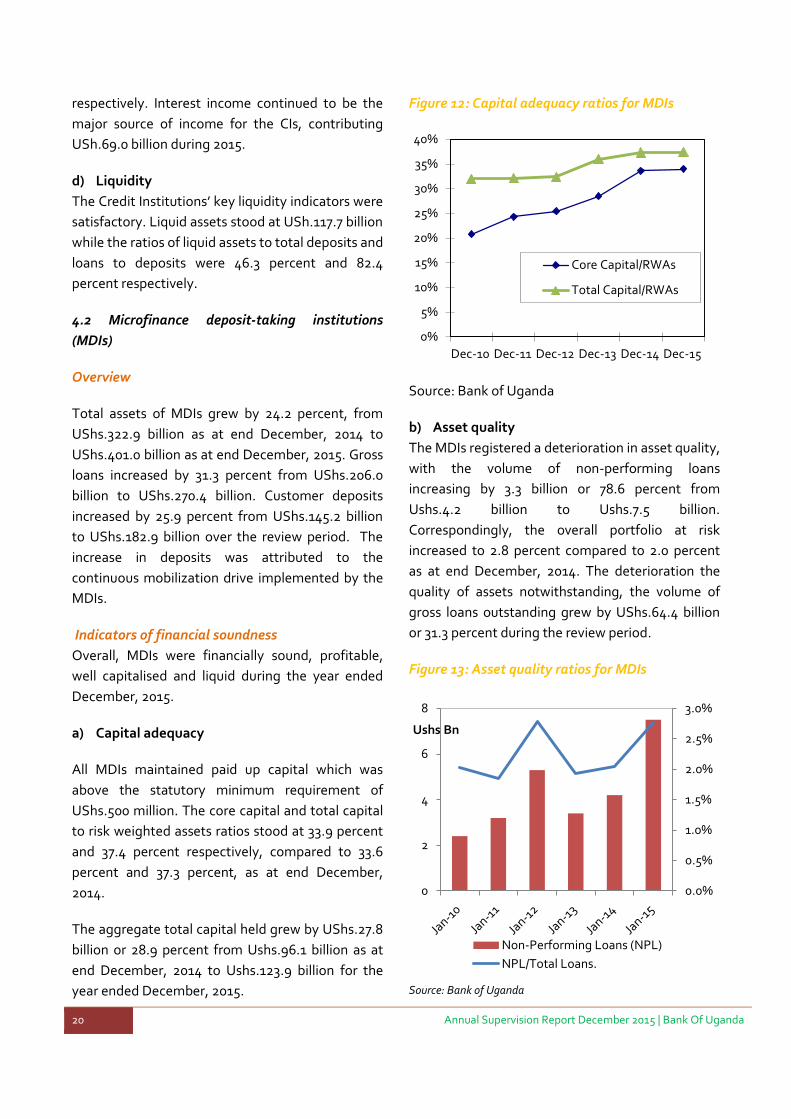
a) Capital adequacy
All MDIs maintained paid up capital which was
above the statutory minimum requirement of
UShs.500 million. The core capital and total capital
to risk weighted assets ratios stood at 33.9 percent
and 37.4 percent respectively, compared to 33.6
percent and 37.3 percent, as at end December,
2014.
The aggregate total capital held grew by UShs.27.8
billion or 28.9 percent from Ushs.96.1 billion as at
end December, 2014 to Ushs.123.9 billion for the
year ended December, 2015.
Figure 12: Capital adequacy ratios for MDIs
Source: Bank of Uganda
b) Asset quality
The MDIs registered a deterioration in asset quality,
with the volume of non-performing loans
increasing by 3.3 billion or 78.6 percent from
Ushs.4.2 billion to Ushs.7.5 billion.
Correspondingly, the overall portfolio at risk
increased to 2.8 percent compared to 2.0 percent
as at end December, 2014. The deterioration the
quality of assets notwithstanding, the volume of
gross loans outstanding grew by UShs.64.4 billion
or 31.3 percent during the review period.
Figure 13: Asset quality ratios for MDIs
Source: Bank of Uganda
0%
5%
10%
15%
20%
25%
30%
35%
40%
Dec-10 Dec-11 Dec-12 Dec-13 Dec-14 Dec-15
Core Capital/RWAs
Total Capital/RWAs
0.0%
0.5%
1.0%
1.5%
2.0%
2.5%
3.0%
0
2
4
6
8
Ushs Bn
Non-Performing Loans (NPL)
NPL/Total Loans.

Annual Supervision Report December 2015 | Bank Of Uganda 21
c) Earnings
The net after tax profits declined from Ushs. 17.7
billion in 2014 to Ushs. 12.2 billion in 2015. The
decline in earnings was partly due the cost of
loanable funds during the period. Subsequently,
the annualised ROA and ROE ratios declined to 3.2
percent and 10.4 percent from 5.6 percent and 20.3
percent, respectively.
d) Liquidity
All the MDIs maintained liquid asset ratios in excess
of the statutory minimum requirement of 15
percent of total deposit liabilities. Total liquid
assets held increased by UShs.4.3 billion or 5.4
percent from UShs.80.1 billion as at end December,
2014 to UShs.84.4 billion as at end December,
2015. However, liquid assets as a proportion of
deposits decreased to 46.1 percent from 55.2
percent as at December 31, 2014.
4.3 Foreign Exchange Bureaus and Money
Remittance Outlets
Overview
The Foreign Exchange Bureaus and Money
Remittances sub-sector continued to be financially
sound, profitable and most were adequately
capitalized for the period ended December, 2015.
The number of foreign exchange bureau outlets
stood at 280 compared to 267 as at end December,
2014, while the money remitters rose to 66 from 57
as at end December, 2014.
Key Indicators for foreign exchange bureaus and
money remittance outlets
a) Profitability
Profitability of the sub-sector declined by 25.9
percent, from Ushs.2.7 billion in2014 to Ushs.2.0
billion in 2015. This was caused by increased
expenses of some foreign exchange bureaus.
b) Assets
Total assets held by the sub-sector stood at
Ushs.99.7 billion as at end December, 2015,
reflecting a 21.6 percent growth from Shs.82.0
billion as at end December, 2014. This growth
was largely driven by increased cash and bank
balances.
c) Capital and reserves
Total capital and reserves held by the sub sector
as at end December, 2015 stood at Shs.58.0
billion an increase of Shs.10.3 billion or 21.0
percent from Shs.47.8 billion as at end
December, 2014. The top ten (10) foreign
exchange bureaus accounted for Shs.30.9 billion
which was 53.2 percent of the total capital in the
sector. With the exception of seven, all foreign
exchange bureaus and money remitters maintained
total capital and reserves above the statutory
requirement of Ushs.20 million. Directives were
issued for the undercapitalized institutions to raise
more capital in order to meet the statutory
minimum requirements.
d) Money remittances
Total inflows increased by US$ 47.0 million or 15.9
percent from US$294.9 million for the year ended
December 2014 to US$341.9 million as at end
December 2015. The outflows on the other hand
decreased by US$14.5 million or 5.3 percent from
US$275.6 million as at end December 2014 to
US$261.1 million as at December 2015. Reports
from forex bureaus indicated that they attributed
the reduction in outward remittances partly to the
depreciation in the foreign exchange rate that was
experienced for most of the year, which affected
trade flows.

22 Annual Supervision Report December 2015 | Bank Of Uganda
Figure 14: Money remittances
Source: Bank of Uganda
4.4 Oversight of payment systems
UNISS performance in Ugandan Shillings
In 2015, the UNISS operations did not encounter
any major disruptions. The volumes in terms of
domestic and foreign denominated currency
continued to grow but the values reduced during
the same period. The volume of UNISS transactions
in 2015 rose by 9 percent to 665,773 as compared to
612,510 witnessed in the previous year. On the
contrary, the value of these transactions declined
by 14.7 percent from USh.251.1 trillion in 2014 to
USh.214.2 trillion in 2015.
Figure 156: UNISS Annual Transactions by volume
and value (in USh. billions)
Source: Bank of Uganda
UNISS performance in foreign denominated
currencies
The transactions in dollars continue to register
robust activity in terms of both value and volumes
settled in 2015, with USD7.64 billion settled in
104,633 transactions (Table 5). This was a
significant increase from USD6.9 billion settled in
90,751 transactions in 2014. The Kenyan shilling
recorded the second highest number of
transactions with an equivalent of USD 3.4 billion.
100
150
200
250
300
350
400
2011 2012 2013 2014 2015
Am
ou
nt
in U
SD
Mil
lio
ns
Inflows Outflows
50
100
150
200
250
300
400
500
600
700
2011 2012 2013 2014 2015
Value (USh.trill
ion)
Volume ('000s)
Total volumesettled
Total value settled(RHS)

Annual Supervision Report December 2015 | Bank Of Uganda 23
Table 12: UNISS volume and values transacted in
foreign currencies
2013 2014 2015
Total value settled (USD millions)
5,117 7,161 8,328
Proportion by currency (value)
USD (percent) 97.7 96.4 91.7
EUR (percent) 2.0 1.7 3.5
GBP (percent) 0.2 0.3 0.6
KES (percent) 0.02 1.67 4.10
TZS (percent) 0.00 0.00 0.04
RWF (percent) 0.00 0.00 0.00
Total volume settled
73,805 95,154 111,56
0
Proportion by currency (volume) USD (percent)
96.7 95.4 93.8
EUR (percent) 2.3 1.6 2.0
GBP (percent) 0.7 0.6 0.6
KES (percent) 0.19 2.27 3.42
TZS (percent) 0.08 0.09 0.14
RWF (percent) 0.00 0.00 0.01
Source: Bank of Uganda
East African Payment System (EAPS)3
The East African Payment System (EAPS) is a multicurrency system, which connects the RTGS Systems of the EAC member countries. EAPS successfully completed the year 2015 with no significant disruption or downtime. The volumes and values of transaction continue to register significant growth month on month. Table 2 shows that in terms of value, the majority of EAPS transactions were made in Kenyan Shillings representing 83.7 percent for inward transactions and 84.7 percent for outward transactions.
3 note that all cross border transactions in KES and TZS are now considered as EAPS transactions. In previous classification, they were considered UNISS transactions.
Table 13: Performance of EAPS (2015)
Inward
Outward
Total value settled (USh. billions) 550.36 563.85
Proportion by currency (value) UGX (percent) 15.2 14.1
KES (percent) 83.7 84.7
TZS (percent) 1.1 1.1
RWF (percent) 0.01 0.03
Total volume settled 2,398 4,461
Proportion by currency (volume)
UGX (percent) 64.5 37.5
KES (percent) 34.0 59.4
TZS (percent) 1.2 2.8
RWF (percent) 0.3 0.2
Source: Bank of Uganda
Common Market for Eastern and Southern Africa (COMESA) Regional Payment and Settlement System (REPSS)
REPSS is a cross-border clearing system for transfer of funds within the Common Market for Eastern and Southern Africa (COMESA) in both United States dollars and Euros. In 2015, a total of 194 transactions were made, 7 Euro and 187 US dollar transactions. This is equivalent to EUR 767,788.7 and USD 7.39 million.
ECS – Electronic Funds Transfers and cheques:
performance in Ugandan Shillings
ECS is a clearing system which automates the
processing of cheque clearing and execution of
Electronic Funds Transfer (EFT) transactions. In
2015, 1.27 million cheque transactions valued at
USh.6.21 trillion were cleared in the ECS as
compared to the 1.36 million cheque transactions
valued at 6.24 trillion cleared in 2014. The total
volume EFT transactions including credits and
debits, dropped by 8.0 percent to 7.6 million in 2015
as compared to the 8.2 million transactions
recorded the in the previous year. On the other
hand, the value of these transactions rose by 4.7

24 Annual Supervision Report December 2015 | Bank Of Uganda
percent to USh.15.8 trillion in 2015, an increase
from the USh.15.1 trillion witnessed in the previous
year.
Mobile money services
Mobile money continues to grow significantly with
regards to the volume and value of transactions, as
well as the number of registered users. The number
of registered mobile money telephone lines
increased in the year 2015 by 12.2 percent from
18.8 million to 21.1 million. Annual transactions
were valued at USh.32.5 trillion, up from USh.24.1
trillion recorded in 2014. The number of
transactions increased by 39.8 percent from 496.3
million transactions recorded in 2014 to 693.6
million transactions in 2015. There were six mobile
money service providers as at the end of December
2015; MTN, Airtel, Uganda Telecom, Africell, M-
Cash and EzeeMoney.
Table 14: Performance of mobile money services
Number of transactions
(‘000s)
Value of transactions
(USh. billion)
Number of registered customers
2011 87,481 3.75 2,879,968
2012 241,728 11.6 8,870,873
2013 399,461 18.64 14,243,379
2014 496,269 24.05 18,800,416
2015 693,514 32.5 21,102,851
Source: Bank of Uganda

Annual Supervision Report December 2015 | Bank Of Uganda 25
Chapter 5: Macroprudential Assessment and Outlook
Overall, systemic risk has been benign over the year to December 2015. However, both micro and macro risks to
the banking system are likely to rise in 2016 associated with credit risk and potential for a slowdown in capital
inflows.
5.1 Risks from the macroeconomy
The macro environment remains challenging for
banks. The IMF reduced World Economic Growth
projections for 2016 to 3.2 percent in April 2016
down 0.6 percentage point from the previous
estimates made last October 2015. Soft consumer
demand in the developed countries and China
which are a major market for Uganda’s exports,
risks from capital outflows and a reduction in
commodity prices remain the main risks.
In Uganda, the forecast for GDP growth in 2016 has
been revised downwards from 5.8 percent to 5.0
percent. This is mainly due to a drop in export
performance and projected decline in private sector
investment and consumption4.
Banks have indicated that they may tighten lending
conditions as reported in the latest bank lending
survey for 2015/165, where commercial banks
expect the projected macro-economic conditions to
negatively impact the ability of small and medium
size enterprises to repay their loans.
This scenario is further augmented by the risk of
offshore capital outflows because of the likely
increase of interest rates in developed economies
and the weaknesses in emerging markets and the
recent reduction in interest rates in Uganda. This
could lead to a reduction of capital inflows and a
withdrawal of offshore deposits held with
commercial banks. At the moment, the banks hold
adequate reserves to absorb risks from capital
outflows..
4 State of the economy report December 2015
5 Bank Lending Survey Report Q2 FY 2015/16
Figure 17: Real GDP growth rates for Uganda
Source: Bank of Uganda
5.2 Risks from bank lending
Credit risk heightened during 2015 following the
upward trend in commercial banks weighted
lending rates from 20.4 percent in March 2015 to
24.3 percent in December 2015. Higher lending
rates are likely to increase the debt service-to-
income ratio (DIR) repayment burden for
households and enterprises which affected their
ability to service existing debt. While the CBR was
reduced in March 2016, the stickiness of lending
rates is likely to affect loan quality and continue to
increase NPLs in the medium term.
The rising trend of bank lending in foreign currency
also poses challenges to banks. The increase in the
ratio of foreign currency loans to total loans could
affect borrower’s ability to repay their loans if they
earn in local currency. The ratio of foreign currency
loans to total loans adjusted for depreciation
effects has risen from 24 percent in December 2010
to 43.2 percent in December 2015.
0
3
6
% Real GDP growth rate

26 Annual Supervision Report December 2015 | Bank Of Uganda
Focusing on sectoral credit risk, the building and
construction sector had the largest share of foreign
currency bank loans at end December 2015. A rapid
rise in property and land prices can lead to the
build-up of risks if lenders and borrowers speculate
on prices going up further for example by extending
mortgages at high Loan-to-Value Ratios (LTV). For
now indicators show that these risks are still
moderate, with the average LTV ratio for the
banking sector between 50-70 percent in December
2015 for lending for residential and commercial
mortgages. In addition, the ratio of foreign
currency loans to foreign currency deposits was
59.2 percent in December 2015, well below the limit
of 80 percent.
A concern however, arose from data indicating that
the LTV for foreign currency loans for land purchase
had risen to 75 percent as at end September 2015.
To address this risk, the Bank’s Financial Stability
Committee introduced an upper limit of 70 percent
on the LTV of foreign currency loans for land
purchase. Banks should also remain vigilant in
enforcing the requirement for foreign currency
borrowers to have cash streams in foreign currency.
Figure 168: Average commercial bank Lending
rates
Source: Bank of Uganda
5.3 Conclusion
Overall, the banking sector remains resilient. Stress
tests conducted by BOU in December 2015, showed
that banks have sufficient capital and liquidity
buffers to absorb losses and withstand offshore
withdrawals of deposits.
BOU will continue to conduct surveillance and take
appropriate policy actions to ensure that the
banking sector remains sound.
15
18
21
24
27
Dec
-14
Jan
-15
Fe
b-1
5
Mar
-15
Ap
r-15
May
-15
Jun
-15
Jul-
15
Au
g-1
5
Sep
-15
Oct
-15
No
v-15
Dec
-15
%

Annual Supervision Report December 2015 | Bank Of Uganda 27
PART III: SPECIAL TOPIC

28 Annual Supervision Report December 2015 | Bank Of Uganda
Chapter 6: Highlights of the Financial Institutions Act (2004) Amendments
6.1 Introduction
In January 2016, Parliament passed the Financial
Institutions (Amendment) Act, 2016. This Chapter
provides highlights of the amendments and the FIA
and the actions BOU will take to implement them.
6.2 Rationale for revising the FIA (2004)
The main objectives for the amendments were;
a) Make provisions for Agent banking, Islamic
banking and Bancassurance.
b) Give BOU the powers to prescribe the post
crisis regulatory agenda through revision of
bank capital especially by including Basel III
measures.
c) To strengthen the banking sector, while
allowing for innovation. Among others this
will reform the Deposit Protection Fund
(DPF), Credit Reference Bureau (CRB) and
other amendments.
The amendments will enhance financial inclusion
and strengthen the functioning and resilience of the
financial system to both macro and macro risks.
6.3 Agent Banking
Section 4 of the principal FIA has been amended to
allow a person licensed to carry out financial
institution business to conduct the licensed
business through an Agent. The place or places at
which the licensee is authorized to conduct Agent
banking will have a license that indicates the word
“Agents” (amended Section 12 of the FIA).
Agents will be authorized to carry out activities
such as account opening, cash withdrawing and
cash depositing on behalf of licensed financial
institutions. The new regulations will also authorize
the use of already existing retail infrastructure and
agents, and widespread information and
communications technologies to transmit
transaction details.
Agent Banking and Branchless Banking will have
several advantages. Key among them is that it will
increase the outreach of financial services in
Uganda, particularly in the rural areas.
Bank of Uganda has drafted the regulations for
Agent Banking and expects to circulate them to
stakeholders for review during May 2016.
6.4 Islamic Banking
The FIA was amended to allow for Islamic Banking.
By definition, An Islamic financial institution is one
whose statute, rules and procedures expressly state
its commitment to the principles of Islamic Shari’ah
and to the banning of the receipt and payment of
interest on any of its operations’ (Organization of
Islamic Conference)6
Islamic banks can thus be viewed as depository
institutions whose core business is financial
intermediation on the basis of a combination of
profit and loss sharing (PLS) or equity as opposed to
debt financing.
An already licensed financial institution carrying on
business, may apply to the Central Bank in
accordance with this Act to carry on Islamic
financial business and offer Islamic financial
products to its customers in addition to its existing
licensed business (amended FIA Part XIIIA, 115A).
6 Uganda became a member of the OIC in 1974

Annual Supervision Report December 2015 | Bank Of Uganda 29
BOX 1: What is Islamic Banking?
1. Introduction and Pillars
Islamic Banking (IB) is defined as banking that is consistent with Shari’ah. Shari’ah stipulates the dos and
don’ts in the execution of financial transactions, which can be classified under four (4) main pillars;
i) Prohibitions: Shari’ah prohibits interest, products with excessive uncertainty, gambling, as well as the
financing of activities that are considered harmful to society say, alcohol, pornography, armaments, etc.
ii) Fairness and honesty: Parties should honour the principles of fair treatment and the sanctity of contracts.
iii) Real Economic Activities: Transactions must be underpinned by real economic activities.
iv) Risk sharing: There must be risk sharing in economic transactions.
2. Sources of funds
Apart from their own equity, Islamic banks rely on two main sources of funds;
Transaction deposits such as savings and current accounts, which are risk free but yield no return. Current
Account depositors do not receive remuneration for their funds, because the guaranteed funds will not be
used for Profit and Loss Sharing (PLS) ventures.
Investment deposits, which carry the risks of capital loss. The depositor earns a profit or incurs a loss
depending on the performance of the funded project. Investment Deposits are further divided into two
categories; Unrestricted Investment Deposits in which the Institution has absolute freedom in the
deployment of the deposited funds and Restricted Investment Deposits where the customer specifies the
project in which the Financial Institution should invest their funds.
3. Uses of Funds
Islamic Financial Institutions utilize funds (Equity and Customer deposits) to offer financing contracts to
customers using the following broad contracts;
Debt-like financing which may be structured in two ways; i) Murabahah or cost plus, where a Financial
Institution buys an asset on behalf of the customer and sells it to the customer at a mark-up. The customer
can pay upfront or in instalments. If the client delays to repay the mark-up does not increase. This is the
most popular form of contract used in Islamic Banking. i) Ijarah or lease which is similar to the lease in
Conventional Banking. The bank buys and leases out an asset or equipment to its client for a rental fee.
The ownership of the asset remains with the lessor who bares any inherent risks of maintaining the asset.
Profit and loss sharing contracts, which are subdivided into two main types (i) Mudarabah (Finance by
way of Trust) where the financier provides funds and the customer provides labour and skills towards a
venture jointly owned by both parties. Profits are shared according to a pre-agreed ratio but losses are
borne by the financier unless there is evidence of negligence by the customer (ii) Musharakah (Finance by
way of partnership) where the financier and the customer both contribute capital towards an investment
venture and are active partners in the day-to-day running of the business. In practice, the Financial
Institution appoints the customer as their agent in the management of the business. Profits and losses are
shared in accordance with a pre-determined ratio, which is normally proportionate to the capital
contribution of the parties.
Fee based financing contracts e.g Wakalah or Agency contracts where one party ( say an importer)
authorizes a Financial Institution to issue on its behalf a letter of credit to the bank of an exporter) for a
specified fee or commission.
Salaam (Advance Purchase). Forward purchase of specified goods for full forward payment. Mainly used

30 Annual Supervision Report December 2015 | Bank Of Uganda
to finance agricultural products. Istisna (commissioned manufacture). One party buys the goods and the other undertakes to manufacture them according to agreed specifications. Used to finance construction and manufacturing contracts.
4. Main differences between Islamic and Conventional Banking
1) As a result of prohibition of interest, Islamic Financial Institutions (IFIs) are funded by non-interest bearing accounts as well as profit-sharing investment accounts.
2) On the asset side, IFIs do not engage in lending, but in sales, leases, profit-and-loss sharing financing and fee-based services.
3) Unlike in Conventional Banking, Islamic Banking transactions must be backed by real assets or economic activity.
Any financial institution wishing to conduct Islamic
Banking will institute a Shari’ah Advisory Board to
advise, approve and review its Islamic financial
business in order to ensure that it complies with the
Shari’ah (amended FIA Part XIIIA, 115B).
BOU has undertaken several initiatives in the period
leading to the enactment of the amendments to
prepare for implementing Islamic banking in
Uganda. The supervisory capacity of the bank has
been enhanced with skills on regulating Islamic
banking with assistance from the IMF and the
Islamic Development Bank. In addition, a
consultant was engaged to develop Islamic Banking
Regulations and Supervisory tools, which are
expected to be ready by end May 2016. A Sharia
Advisory Board will also be established at BOU.
Islamic Banking is expected to enhance access to
banking services (financial sector widening) and
increase the range of financial products offered in
the sector (financial sector deepening). It is also
envisaged that Islamic banking will attract foreign
capital investment, which will boost employment.
6.5 Bancassurance
Banks in many countries now provide insurance
services to their customers in collaboration with an
insurance company. However, the FIA (2004)
prohibited financial institutions from among other
things, engaging in insurance business.
The amendments in the FIA (Part XIIB) permit the
Central Bank to grant permission to a bank to
provide Bancassurance business subject to
compliance with the regulations issued by the
Central Bank and the provisions of the Insurance
Act implemented by the Insurance Regulatory
Authority. “Bancassurance” means using a financial
institution and its branches, sales network and
customer relationships to sale insurance products.
The Insurance Regulatory Authority and BOU are
working together to complete the regulations for
bancassurrance.
6.6 The Deposit Protection Fund
The amended FIA provides for the reform of the
Deposit Protection Fund (DPF). The Deposit
Protection Funds (DPF) for Commercial Banks,
Credit Institutions and for the Microfinance
Deposit-taking Institutions will be merged into a
single Fund. The Fund shall be a separate legal
entity from the Central Bank. It may act as a
receiver or liquidator of a financial institution, if
appointed for that purpose by the Central Bank.
This revision will ensure that the Uganda DPF
operates in line with EAC regional and international
best practice.
6.7 Revision of Capital
The Amendments to the FIA (2004) will allow Bank
of Uganda to revise the minimum capital
requirements for commercial banks in Uganda, in
line with the decision of the EAC Monetary Affairs
Committee to harmonise capital requirements in
the region and implement Basel III capital buffers.
Higher capital requirements will strengthen the
capacity of banks to withstand negative shocks and
thus make them more resilient to risks.

Annual Supervision Report December 2015 | Bank Of Uganda 31
The capital requirements that will be implemented
by BOU include;
a) A Capital Conservation Buffer of 2.5
percent of Risk Weighted Assets (RWA)
that will apply to all commercial banks.
b) Additional capital requirements for D-SIBs,
which will range from 1-3.5 percent of RWA.
BOU published the framework for
classifying banks as Domestic Systemically
Important banks (DBSIBs) in the Financial
Stability Report of June 2014.
c) A macroprudential countercyclical buffer of
up to 2.5 percent of Risk Weighted Assets
(RWA) that will apply to all commercial
banks when triggered by BOU during
periods of excessive credit growth. A
special topic on the countercyclical buffer
and its application to Uganda was
published in the Financial Stability Report of
June 2012. A guiding note for banks will
follow later this year.
The Table below provides a summary of the
revised minimum capital requirements.
Table 15: Minimum Capital Requirements for
Banks in Uganda
Sector
Tier 1
Capital/
RWA
(%)
Total
Capital/
RWA
(%)
Minimum Requirement
(Harmonised in the EAC) 10 12
Add; Capital Conservation
Buffer (all Banks) 12.5 14.5
Add: Capital for DSIBs - (1-
3.5%). 16.0 18.0
Source: Bank of Uganda
The implementation of the buffers will be effected
in 2016. BOU issued a guiding note in 2014
directing to all banks to set aside adequate reserves
to meet the revised capital buffers and all banks
already meet the enhanced Capital Requirements.
6.8 Credit Reference Bureau
The Financial Institutions Act 2004 amendments
enacted in January 2016 provide for expansion of
the CRB to other credit providers or service
providers and the licensing of a Biometric
Information Provider for the Financial Card System.
The draft Credit Reference System Regulations to
regulate the competitive CRB market are
undergoing review and will be submitted to the
First Parliamentary Counsel by April 30, 2016.
6.9 Other Amendments
The FIA amendments also the following issues;
a) Regarding allotment of shares, Section 20 of the
principal Act provides that the registrar of
companies shall not register any transfer or
allotment of shares of a bank without the
written consent of the Central Bank.
b) There are restrictions on mortgage banks under
Section 45 of the principal Act. A mortgage
bank shall not advance or make more than
twenty five percent of all its loans or other
credit accommodations for a purpose other
than real estate.
c) All fines and penalties recovered by the Central
Bank shall be retained by the Central Bank and
used to offset the costs of supervision.
d) Regarding money laundering, Section 130 of the
principal Act provides that a financial institution
shall promptly report to the Financial
Intelligence Authority any suspected money
laundering activity related to any account held
with the financial institution

32 Annual Supervision Report December 2015 | Bank Of Uganda
6.10 Conclusion
The FIA Amendments (2016) are timely and will
strengthen the stability and efficiency of the
Ugandan banking system, while allowing for
growth and innovation.
PART IV: STATISTICAL APPENDICES

Annual Supervision Report December 2015 | Bank Of Uganda 33
APPENDIX 1: FINANCIAL SOUNDNESS INDICATORS FOR SUPERVISED FINANCIAL INSTITUTIONS
Table 1A: Financial soundness indicators for commercial banks (percent)
Dec-09 Dec-10 Dec-11 Dec-12 Dec-13 Dec-14 Dec-15
Capital Adequacy
Regulatory capital to risk-weighted assets 20.9 20.2 20.3 21.9 22.9 22.2 21.0
Regulatory tier 1 capital to risk-weighted assets 18.7 17.5 17.9 18.8 19.9 19.7 18.6
Total qualifying capital to total assets 13.6 13.0 14.6 14.8 14.9 16.3 16.5
Asset quality
NPLs to total gross loans 4.2 2.1 2.2 4.2 5.6 4.1 5.3
NPLs to total deposits 3.0 1.4 1.7 3.1 4.1 3.0 3.9
Specific provisions to NPLs 57.2 65.0 50.9 45.9 47.2 48.9 41.6
Earning assets to total assets 78.0 77.1 74.0 71.3 69.7 71.5 69.2
Large exposures to gross loans 32.2 35.7 34.6 34.6 36.3 38.3 41.0
Large exposures to total capital 94.3 124.4 120.9 104.7 105.2 113.2 123.5
Earnings & profitability
Return on assets 3.0 2.7 4.0 3.9 2.5 2.6 2.6
Return on equity 18.8 18.0 27.3 24.2 15.2 16.1 16.0
Net interest margin 10.8 10.0 11.7 12.8 11.5 11.0 11.3
Cost of deposits 3.7 2.9 3.2 4.1 3.7 3.6 3.3
Cost to income 75.4 75.7 68.1 70.9 77.2 68.7 69.3
Overhead to income 52.3 53.1 43.9 40.1 46.7 40.0 42.0
Liquidity
Liquid assets to total deposits 44.7 39.8 37.6 42.0 42.5 44.0 46.4
Total loans to total deposits 71.7 68.0 78.4 74.5 74.2 74.2 74.2
Market Sensitivity
Foreign currency exposure to regulatory tier 1 capital -0.7 -1.6 -3.6 -0.6 -3.0 -7.0 -5.9
Foreign currency loans to foreign currency deposits 57.9 61.4 62.8 79.3 62.2 64.5 59.2
Foreign currency assets to foreign currency liabilities 107.0 98.0 100.2 105.0 96.8 97.1 101.8
Source: Bank of Uganda

34 Annual Supervision Report December 2015 | Bank Of Uganda
Table 1B: Financial soundness indicators for credit institutions (percent)
Dec-10 Dec-11 Dec-12 Dec-13
Dec-14
Dec-15
Capital Adequacy
Core capital (Ushs. billion) 26.2 31.6 44.2 45.9 49.5 61.1
Total capital (Ushs. billion) 31.6 39.3 53.0 55.5 60.5 66.7
Risk-weighted assets (Ushs. billion) 114.6 141.4 157.6 195.6 236.8 285.5
Core capital to risk-weighted assets (% ratio) 22.9 22.3 28.1 23.5 20.9 21.4
Total capital to risk-weighted assets (% ratio) 27.5 27.7 33.6 28.4 25.5 23.4
Provisions to core capital (% ratio) 4.8 3.1 5.7 6.8 6.9 7.3
Asset Quality
Loans and advances (Ushs. billion) (Net) 79.7 107.2 115.9 147.6 187.3 225.3
Total provisions (Ushs. billion) 1.3 1.0 2.5 3.2 3.4 4.5
Non-performing loans (Ushs. billion) 3.3 1.7 4.9 5.2 7.7 8.6
Non-performing loans to total loans (% ratio) 4.1 1.6 4.2 3.5 4.1 3.7
Profitability
Year-to-date profit/loss (Ushs. billion) 0.3 2.9 5.2 3.7 5.0 1.0
Quarterly net profits (Ushs. billion) 0.4 1.2 0.9 4.6 0.4 0.3
Quarterly return on assets (% ratio) 0.2 0.6 0.4 1.7 0.2 0.1
Year-to-date return on assets (% ratio) 0.1 1.5 2.4 1.4 1.6 0.3
Liquidity
Total public deposits (Ushs. billion) 107.7 121.6 133.0 164.9 195.1 254.3
Liquid assets (Ushs. billion) 54.3 58.3 76.8 83.1 82.5 117.7
Liquid assets to deposits (% ratio) 50.4 47.9 57.8 50.4 42.3 46.3
Loans to deposits ( % ratio) 56.1 62.6 58.5 68.9 75.9 82.4
Source: Bank of Uganda

Annual Supervision Report December 2015 | Bank Of Uganda 35
Table 1C: Financial soundness indicators for microfinance deposit-taking institutions (percent)
Dec-09 Dec-10 Dec-11 Dec-12 Dec-13 Dec-14 Dec-15
Capital Adequacy
Core capital (Ushs. billion) 26.1 29.8 48.1 58.0 61.8 86.6 106.8
Total capital (Ushs. billion) 35.3 45.9 63.6 73.7 77.9 96.1 117.9
Risk-weighted assets (Ushs. billion) 143.6 197.9 227.5 216.6 257.6 308.6
Core capital to risk-weighted assets (% ratio) 22.0 20.8 24.3 25.4 28.5 33.6 34.6
Total capital to risk-weighted assets (% ratio) 29.8 32.0 32.1 32.4 36.0 37.3 38.2
Asset Quality
Total loans (Ushs. billion) 83.4 120.3 171.4 190.3 175.8 206.0 252.6
Non-performing loans (Ushs. billion) 2.3 2.4 3.2 5.3 3.4 4.2 6.6
Total provisions (Ushs. billion) 2.8 3.7 5.6 4.0 4.5 6.8
Portfolio at risk (% ratio) 2.4 2.0 1.9 2.7 1.9 2.0 2.7
Profitability
Year-to-date profit/loss (Ushs. billion) 4.6 4.3 10.1 11.6 10.4 17.7 14.7
Year-to-date return on assets (% ratio) 3.4 2.6 4.3 4.2 3.5 5.6 3.9
Year-to-date return on equity (% ratio) 10.2 8.6 17.2 17.2 12.0 20.3 13.0
Liquidity
Liquid assets to deposits (% ratio) 62.4 49.3 51.6 58.5 62.4 55.1 43.8
Loans to deposits ( % ratio) 77.4 75.1 77.0 69.9 78.0 72.4 83.1
Source: Bank of Uganda

36 Annual Supervision Report December 2015 | Bank Of Uganda
APPENDIX 2: AGGREGATED BALANCE SHEETS FOR SUPERVISED FINANCIAL INSTITUTIONS
Table 2A: Commercial banks’ aggregated balance sheet
Dec-09 Dec-10 Dec-11 Dec-12 Dec-13 Dec-14 Dec-15
ASSETS (Ushs. Billion)
Cash & cash assets 401.5 472.9 583.0 667.4 692.0 786.6 811.3
Balances with BOU 623.6 802.7 835.8 1,341.6 1,730.1 2,104.81 1,982.6
Due from financial institutions 1,032.9 1,317.8 1,736.5 1,622.2 2,043.7 1,692.8 2,634.8
Government securities 1,832.3 2,532.5 2,073.5 3,053.2 3,648.7 4,463.2 4,064.8
Total gross loans & advances 4,038.9 5,461.1 6,981.0 7,789.7 8,274.6 8,247.3 9,501.8
LESS: Provisions -96.9 -88.0 -89.5 -187.9 -261.7 -229.3 -285.6
Net loans & advances 3,942.0 5,373.1 6,891.5 7,601.8 8,012.9 8,018.0 9,216.2
Net fixed assets 472.9 401.7 429.5 519.3 583.2 821.3 925.9
Other assets 327.9 409.9 432.6 660.4 610.3 671.6 691.9
TOTAL ASSETS 8,633.0 11,310.5 12,982.4 15,465.9 17,320.9 19,586.1 21,722.2
LIABILITIES (Ushs. Billion)
Deposits 5,630.5 8,041.7 8,903.7 10,457.7 11,504.3 13,218.7 14,821.1
Due to financial institutions 603.3 529.1 730.2 513.7 825.9 563.4 630.1
Administered funds 279.2 309.6 339.9 359.1 1,033.2 1,187.6 1,255.9
Other liabilities 773.5 864.8 1,007.0 1,558.3 892.9 1,425.7 1,398.1
TOTAL LIABILITIES 7,286.6 9,745.2 10,980.8 12,888.8 14,463.8 16,395..4 18,129.1
SHAREHOLDERS’ FUNDS (Ushs.
Billion)
Paid-up capital 485.8 591.9 789.6 973.6 1,272.3 1,287.4 1,346.8
Share premium 55.1 80.3 81.5 75.7 91.8 102.3 115.4
Retained reserves 456.7 534.1 581.2 830.6 914.3 1,174.3 1,446.6
Other reserves 112.8 90.3 61.0 152.7 159.7 139.2 143.2
Profit – Loss (current year) 236.1 268.7 488.3 544.5 414.0 487.4 541.1
TOTAL SHAREHOLDERS' FUNDS 1,346.5 1,565.3 2,001.6 2,577.0 2,857.1 2,857.1 2,857.1
OFF BALANCE SHEET ITEMS (Ushs.
Billion)
Letters of Credit 201.9 335.6 392.4 352.0 354.2 354.2 354.2
Guarantees & performance bonds 520.5 608.5 786.6 1,046.3 1,157.3 1,157.3 1,157.3
Unused loans/overdrafts commitment 318.1 678.4 802.2 1,023.3 1,092.8 1,092.8 1,092.8
Other off balance sheet items 147.2 334.9 1,000.2 765.1 483.5 483.5 483.5
TOTAL OFF BALANCE SHEET ITEMS 1,187.8 1,957.4 2,981.4 3,186.7 3,087.8 3,582.0 3,829.6
Source: Bank of Uganda

Annual Supervision Report December 2015 | Bank Of Uganda 37
Table 2B: Aggregated balance sheet for credit institutions
Dec-10 Dec-11 Dec-12 Dec-13
Dec -14
Dec-15
ASSETS (Ushs. billion)
Cash 6.1 6.7 7.7 11.5 14.6 16.4
Balances with institutions in Uganda 41.7 41.0 55.9 63.1 56.2 70.3
Balances with commercial banks outside Uganda 0.8 0.2 0.7 0.5 0.3 1.0
Investments 5.7 10.5 12.5 7.9 11.4 29.9
of which Government securities 5.7 10.4 12.5 7.9 11.4 29.9
Loans and advances (Net) 79.7 107.2 115.9 147.6 187.3 225.3
of which Administered funds* - - - - - -
Premises and fixed assets (Net) 16.3 19.2 20.2 23.4 28.4 32.3
Other Assets 8.6 8.9 8.1 11.7 12.8 14.4
Total assets 158.9 193.7 221.1 265.7 311.0 389.6
LIABILITIES (Ushs. billion)
Total deposit liabilities to depositors 107.7 121.6 133.0 164.9 195.1 254.3
Loan Insurance Fund 3.4 3.6 4.3 4.8 4.9 4.9
Balances due to commercial banks/associated
companies/residents/non-residents 7.5 13.2 17.2
21.5
21.9 27.3
Borrowings at Bank of Uganda 0.8 0.7 0.6 0.6 0.4 0.3
Administered funds - - - - - -
Other Liabilities 10.7 16.0 14.5 16.3 22.4 17.5
Provisions 0.5 0.7 2.0 3.1 5.3 2.4
Capital 28.0 35.0 44.3 50.7 56.3 81.9
of which paid up capital 16.9 17.9 21.9 21.8 21.8 54.1
Profit for current year 0.3 2.9 5.2 3.7 5.0 1.0
Total liabilities 158.9 193.7 221.1 265.7 310.9 389.6
Source: Bank of Uganda

38 Annual Supervision Report December 2015 | Bank Of Uganda
Table 2C: Aggregated balance sheet for microfinance deposit-taking institutions
Dec-09 Dec-10 Dec-11 Dec-12 Dec-13 Dec-14 Dec-15
ASSETS (Ushs. billion)
Notes and coins 4.0 4.9 6.9 9.0 5.7 6.2 8.3
Balances with institutions in Uganda 14.5 23.7 25.8 48.7 52.2 73.9 70.1
Government securities 4.5 2.4 7.4 0.9 0.0 0.0 1.1
Net loans outstanding 94.8 118.7 169.3 186.5 173.6 203.1 248.3
Inter branch/ due from own offices - 35.0 374.0 0.0 0.0 0.1 0
Net fixed assets 9.9 11.1 12.0 13.6 12.8 15.8 23.6
Long-term investments - - - - - - -
Other assets 8.2 9.0 11.1 17.6 19.7 23.9 22.3
Total assets 135.8 169.9 232.9 276.3 264.0 323.0 374.2
LIABILITIES (Ushs. billion)
Deposit liabilities 36.6 62.9 76.8 99.9 92.7 145.3 181.6
Loan insurance fund 14.2 12.1 13.5 14.0 16.9 12.1 9.2
Borrowings 29.2 28.5 52.4 57.2 46.9 32.3 24.9
Other liabilities 9.2 10.0 15.6 18.3 18.9 22.5 26.3
Grants/deferred income 1.7 1.8 6.0 7.4 5.5 5.5 6.8
Inter branch/ Due to own Offices 10.0 - - - - - -
Other long-term Liabilities - - 0.1 0.1 0.1 0.3 0.0
Total liabilities 90.9 115.3 164.2 196.7 181.0 218.0 256.6
FINANCED BY: (Ushs. billion)
Capital 28.4 33.2 56.4 66.8 69.9 99.0 102.8
Subordinated debt 16.5 21.4 12.2 12.7 13.1 6.0 7.7
Preference shares - - - - - - -
Total liabilities & equity 135.8 169.9 232.9 276.3 264.0 323.0 374.2
Source: Bank of Uganda

Annual Supervision Report December 2015 | Bank Of Uganda 39
APPENDIX 3: INCOME STATEMENTS FOR SUPERVISED FINANCIAL INSTITUTIONS
Table 3A: Commercial banks’ aggregated income statement (annual)
Dec-09 Dec-10 Dec-11 Dec-12 Dec-13 Dec-14 Dec-15
INCOME (Ushs. Billion)
Interest income
Advances 690.4 789.7 1,178.1 1,465.3 1,389.5 1,464.1 1,722.0
Government securities 166.4 182.9 210.7 296.5 349.8 416.1 497.6
Deposits abroad 12.4 10.7 22.2 49.3 29.5 8.6 12.0
Other 58.1 44.2 70.0 23.6 91.0 132.0 68.8
Charges, fees & commissions 218.0 214.7 252.6 326.9 335.3 376.1 419.3
Foreign exchange income 130.3 132.9 186.4 250.6 216.4 197.6 257.6
Other income 55.8 100.7 94.9 183.3 127.2 153.9 147.9
TOTAL INCOME 1,331.3 1,475.8 2,014.7 2,595.5 2,538.7 2,802.3 3,196.6
EXPENSES (Ushs. Billion)
Interest expense on deposits 188.5 196.8 267.0 401.4 406.8 438.5 467.6
Other interest expenses 64.5 57.3 145.2 193.3 119.8 154.3 189.8
Provisions for bad debts 56.3 79.0 77.8 205.9 247.9 212.2 217.7
Salaries, wages, staff costs 284.8 330.3 381.4 437.8 504.4 583.9 646.9
Premises, depreciation, transport 144.3 153.8 178.5 198.1 221.7 253.9 296.5
Other expenses 266.9 296.2 322.9 405.2 458.3 494.8 612.6
TOTAL EXPENSES 1,005.4 1,113.4 1,372.8 1,841.7 1,958.9 1,925.4 2,213.5
ADD: Extraordinary
credits/charges 0.0 -0.4 -0.7 0.9 0.1 0.0 0.0
Net profit before tax 325.9 362.0 641.3 754.7 579.9 664.7 765.3
LESS: Corporation tax 89.8 93.3 153.0 199.9 165.9 179.5 224.1
NET PROFIT AFTER TAX 236.1 268.7 488.3 544.8 414.0 485.2 541.2
Source: Bank of Uganda

40 Annual Supervision Report December 2015 | Bank Of Uganda
Table 3B: Aggregated income statement for credit institutions (annual)
Dec-10 Dec-11 Dec-12 Dec-13 Dec-14 Dec-15
INCOME (Ushs. Billion)
Interest on loans and advances 21.0 27.3 31.7 37.2 49.8 60.1
Interest on government securities 0.5 0.8 2.2 1.6 4.6 3.1
Other interest income 3.1 4.1 0.3 8.1 1.3 5.8
Total interest income 24.5 32.1 41.0 46.9 55.7 69.0
Total non-interest income 9.8 13.5 15.4 20.0 20.2 25.3
TOTAL INCOME 34.3 45.6 56.4 66.9 75.9 94.3
EXPENSES (Ushs. Billion)
Total interest expense 2.3 3.8 4.6 6.6 7.8 12.2
Provisions for bad debts 1.1 1.6 2.8 6.3 4.2 8.0
Salaries & other staff costs 14.3 17.4 19.9 24.3 28.4 33.8
Other non-interest expense 16.2 19.5 21.9 24.4 29.3 36.7
TOTAL EXPENSES 33.9 42.3 49.2 61.6 69.7 90.7
Taxation 0.1 0.4 1.9 1.6 1.0 2.6
NET INCOME 0.3 2.9 5.2 3.7 5.2 1.0
Source: Bank of Uganda

Annual Supervision Report December 2015 | Bank Of Uganda 41
Table 3C: Aggregated income statement for microfinance deposit-taking institutions (annual)
Dec-09 Dec-10 Dec-11 Dec-12 Dec-13 Dec-14 Dec-15
INCOME (Ushs. Billion)
Total credit income 51.2 57.0 79.1 99.0 82.5 97.8 110.0
Total other income 7.3 4.3 7.3 10.6 11.2 13.8 16.9
GROSS FINANCIAL INCOME 58.5 61.3 86.3 109.6 93.7 111.6 126.9
EXPENSES (Ushs. Billion)
Total financial expenses of lending funds 6.2 5.6 9.4 15.7 12.0 15.8 16.9
Provision for bad debts 2.5 2.4 3.0 5.0 3.4 4.6 5.3
Net financial income 49.8 53.3 74.0 88.9 78.3 91.3 104.8
Total operating expenses on financial
services 44.5 48.2 63.6 75.5
66.3
73.3
84.3
NET INCOME FROM OPERATIONS 5.3 5.1 10.4 13.4 11.9 17.9 20.5
Total grant income for financial services 0.4 0.3 1.1 1.1 1.7 2.9 0.8
Total grant income for non-financial
services - - - -
-
-
-
Income from non-financial services 0.0 0.1 0.2 0.01 0.03 0.005 0.3
Total operating expenses on non-financial
services 0.0 0.0 0.1 0.09
0.08
0.004
0.8
Net operating profit/loss from non-financial
services 0.0 0.0 0.1 -0.1
-0.05
0.001
-0.5
NET PROFIT FOR THE PERIOD 5.7 5.4 11.6 14.4 13.6 20.8 20.8
Corporation tax 1.1 1.1 1.5 2.7 3.2 3.1 6.1
NET PROFIT AFTER TAX 4.6 4.3 10.1 11.6 10.4 17.7 14.7
RETAINED EARNINGS 4.6 4.3 10.1 11.6 10.4 17.7 14.7
Source: Bank of Uganda

42 Annual Supervision Report December 2015 | Bank Of Uganda
APPENDIX 4: CREDIT REFERENCE BUREAU ACTIVITIES (CUMULATIVE FIGURES)
Quarter Dec-2010 Dec-2011 Dec-2012
Dec-2013
Dec-2014
Dec-2015
Branches on FCS 505 528 547 590 600 617
Branches on CRB 503 525 542 579 580 593
Financial cards issued 478,568 667,412 802,906 948,936 1,093,107 1,235,845
Number of enquiries 146,435 682,459 1,154,690 1,723,191 2,335,086 2,948,915
Source: Bank of Uganda