Bank Failures, Capital Bu ers, and Exposure to the Housing Market Bubble … · · 2017-11-29Bank...
36
Finance and Economics Discussion Series Divisions of Research & Statistics and Monetary Affairs Federal Reserve Board, Washington, D.C. Bank Failures, Capital Buffers, and Exposure to the Housing Market Bubble Gazi I. Kara and Cindy M. Vojtech 2017-115 Please cite this paper as: Kara, Gazi I., and Cindy M. Vojtech (2017). “Bank Failures, Capital Buffers, and Exposure to the Housing Market Bubble,” Finance and Economics Discussion Se- ries 2017-115. Washington: Board of Governors of the Federal Reserve System, https://doi.org/10.17016/FEDS.2017.115. NOTE: Staff working papers in the Finance and Economics Discussion Series (FEDS) are preliminary materials circulated to stimulate discussion and critical comment. The analysis and conclusions set forth are those of the authors and do not indicate concurrence by other members of the research staff or the Board of Governors. References in publications to the Finance and Economics Discussion Series (other than acknowledgement) should be cleared with the author(s) to protect the tentative character of these papers.
Transcript of Bank Failures, Capital Bu ers, and Exposure to the Housing Market Bubble … · · 2017-11-29Bank...

Finance and Economics Discussion SeriesDivisions of Research & Statistics and Monetary Affairs
Federal Reserve Board, Washington, D.C.
Bank Failures, Capital Buffers, and Exposure to the HousingMarket Bubble
Gazi I. Kara and Cindy M. Vojtech
2017-115
Please cite this paper as:Kara, Gazi I., and Cindy M. Vojtech (2017). “Bank Failures, Capital Buffers, andExposure to the Housing Market Bubble,” Finance and Economics Discussion Se-ries 2017-115. Washington: Board of Governors of the Federal Reserve System,https://doi.org/10.17016/FEDS.2017.115.
NOTE: Staff working papers in the Finance and Economics Discussion Series (FEDS) are preliminarymaterials circulated to stimulate discussion and critical comment. The analysis and conclusions set forthare those of the authors and do not indicate concurrence by other members of the research staff or theBoard of Governors. References in publications to the Finance and Economics Discussion Series (other thanacknowledgement) should be cleared with the author(s) to protect the tentative character of these papers.

Bank Failures, Capital Buffers, and Exposure to the Housing
Market Bubble
Gazi I. Karaa and Cindy M. Vojtecha,∗
aFederal Reserve Board
November 24, 2017
Abstract
We empirically document that banks with greater exposure to high home price-to-incomeratio regions in 2005 and 2006 have higher mortgage delinquency and charge-off rates andsignificantly higher probabilities of failure during the last financial crisis even after controllingfor capital, liquidity, and other standard bank performance measures. While high price-to-income ratios present a greater likelihood of house price correction, we find no evidence thatbanks managed this risk by building stronger capital buffers. Our results suggest that there isscope for improved measures of mortgage loan risk that could be considered for regulatory andrisk management applications.
JEL: G01 G21 G28 R31Keywords: Residential real estate, bank failure, credit risk, mortgage risk
∗Address: 20th and Constitution Ave. NW, Washington, DC 20551. E-mails: [email protected] [email protected]. The idea for this paper emerged during our conversations with Christoph Ungerer. We aregrateful for his contributions during the initial stage of this project. We thank William Bassett, Andrew Cohen, FilipZikes, Levent Altinoglu, and seminar participants at the Federal Reserve Board and Georgetown Center for EconomicResearch 2017 Conference for helpful comments. Excellent research assistance was provided by Justin Shugarmanand Margaret Yellen. The views expressed in this paper are those of the authors, and not necessarily those of theFederal Reserve Board or their respective staffs.

1 Introduction
The financial crisis was marked by a large decline in residential housing prices which led to many
short sales, foreclosures, and houses with negative equity. Given the large number of subsequent
bank failures, one might believe that residential mortgage losses were the prime driver. Surprisingly,
research on banking failures that has used traditional mortgage exposure measures generally dis-
misses any significant contribution from residential mortgage exposures during the financial crisis of
2007–09. The standard mortgage exposure measures used in these studies, however, do not account
for the riskiness of the loans held on balance sheet. Thus, it may make sense to consider measures
of mortgage risk used by the real estate industry in assessing the effect of mortgage exposures on
bank failures. The challenge for assessing the mortgage risk in the banking industry is that many
measures are not available at the bank level, or if they are, they are not available across all banks.1
This paper develops a bank level mortgage risk measure covering most of the industry by
combining geographic measures of risk and Home Mortgage Disclosure Act (HMDA) data to identify
the geographic exposures of a bank. Our baseline results use the home price-to-income (PTI) ratio
at the county level to capture the risk of mortgages originated in that location. We then combine
this ratio with the geographic distribution of mortgages originated and held by each bank in our
sample to create a bank-specific mortgage exposure measure. We empirically document that banks
that have greater exposure of mortgages to high PTI regions have higher mortgage delinquency and
charge-off rates and significantly higher probabilities of failure even after controlling for capital,
liquidity, and other standard bank performance measures. Thus, our results suggest that there is
scope for improved measures of risks associated with residential mortgage lending that could be
considered for regulatory and risk management applications.
We calculate a bank level weighted PTI in a given year using each bank’s mortgage originations
by county over the past three years as weights. PTI is a good indicator of risk across markets and
through time because it links the asset value to fundamentals. The value of a house should be
related to the stream of housing services it provides. Davis and Ortalo-Magne (2011) document
that housing services tend to be a constant fraction of household income. If prices are growing faster
1For example, the FR Y-14 has mortgage loan level data with risk variables, but this regulatory form is onlyrequired for bank holding companies subject to the stress tests run by the Federal Reserve. In addition, the datahave only been collected after the crisis.
1

than household income, housing is becoming more unaffordable. PTI captures this risk because
PTI will also increase.
Historical evidence from several countries suggests that PTI, along with some other price-based
indicators such as the growth rate of house prices and the price-to-rent ratio, are good forward
looking measures of financial stability risk. Cross-country studies indicate that both the level
and the growth rate of PTI typically rises in the years ahead of major financial crises and signal a
build-up of vulnerabilities and imminent distress (BOE, 2016; ESRB, 2014). Even more, during the
financial crisis in the United States, our sample of county-level data shows that a large deviation of
house prices from the fundamentals such as household income is associated with bigger corrections
in house prices and employment.
We first show that PTI captures mortgage risk by showing that banks with high exposure to
PTI in 2005 and 2006 have higher mortgage delinquencies and ultimately charge-offs during and
in the early aftermath of the 2007–09 financial crisis. Though most studies use RRE loans as
a percent of assets to control for mortgage exposures, this measure is not positively related to
mortgage delinquency rates and charge-offs in the crisis episode.
With this relationship between PTI exposure and RRE asset quality established, we examine the
relationship between exposure to PTI in 2005 and 2006 and bank failures in the 2008–11 period.2
In particular, we run probabilistic regressions of a failure indicator on common bank performance
measures and focus on the interaction term between PTI exposure and residential mortgages. We
show that banks with large exposures to high PTI counties are more likely to fail, and as expected,
PTI exposure is a better predictor of bank failure than just using RRE loans held on balance sheet.
While PTI exposure is a good proxy for actual mortgage risk, our results confirm existing studies,
finding that high CRE exposure and low regulatory capital were also significant drivers of bank
failure during the last crisis.
We also show that banks that experienced large increases in PTI exposure before the crisis
did not increase their capital buffers relatively more to counteract this extra risk. Given that
regulatory capital risk weights for mortgages generally do not depend on the characteristics of a
bank’s mortgage portfolio under Basel, this result is not surprising.
2While the financial crisis is often dated as 2007–09, the significant increase in bank failures lagged a bit andbegan in 2008.
2

Finally, our results may help inform macroprudential regulations that have been, and are being,
enacted to address financial stability concerns emanating from the real estate sector. Macropruden-
tial tools that focus on the real estate lending are broadly grouped into two categories: instruments
that target lenders and those that target borrowers (ESRB, 2014). In this paper, we focus on
instruments that target a particular type of lender, that is, banks. By incorporating mortgage
risk measures such as PTI, banks and regulators can monitor building vulnerabilities in the bank-
ing system. One way to do this would be to explicitly relate mortgage risk weights to forward
looking risk measures such as PTI. Alternatively, if banks track PTI exposure for their mortgage
portfolio, they may better monitor risk and be positioned to take appropriate steps to hedge that
risk through, for example, building additional capital buffers and diversifying their RRE portfolios
along geographic lines.
The next section further discusses research on real estate risk, systemic risk, and bank failure.
Section 3 describes the data used in this paper and explains how to construct our primary measure
of mortgage risk. Section 4 explores the relationship between this risk measure and asset outcomes
such as delinquency rates. Subsection 4.2 specifically analyzes the relationship between mortgage
risk and bank failure. Section 5 contains the robustness tests. Section 6 then turns to capital and
discusses how macroprudential policies can improve building capital buffers for mortgage exposures.
Section 7 concludes.
2 Related Literature
Several studies have examined the underlying causes of the large number of bank failures in the
U.S. during the financial crisis.3 These studies have generally pointed to commercial real estate
(CRE) as being the primary driver of bank failures, while dismissing any significant contribution
from residential mortgage exposures. For example, the Inspector General of the Federal Reserve
Board concludes that the main driver of bank failure was rapid loan growth without matching risk
management expertise (FRB, 2011). Specifically, asset concentrations in CRE, especially loans to
support construction and land development (CLD), are identified as drivers of bank failure.
3The general insights from these studies are in line with an earlier literature that examined the bank and thriftfailures during the late 1980s and early 1990s (Thomson, 1991; Whalen, 1991; Wheelock and Wilson, 2000; DeYoung,2003; Oshinsky and Olin, 2006, are some examples).
3

While FRB (2011) is based on a relatively small sample of banks, similar conclusions are backed
by other broad-based research such as Cole and White (2012), Berger and Bouwman (2013), DeY-
oung and Torna (2013), and Antoniades (2016). Across these studies, real estate construction
and development loans, commercial mortgages, and multifamily mortgages are consistently associ-
ated with a higher likelihood of bank failure, whereas residential single-family mortgages are either
neutral or associated with a lower likelihood of bank failure. In particular, Cole and White (2012)
argue that exposures to the residential mortgages, especially to “toxic” residential mortgage-backed
securities (MBS) and subprime mortgages, were not among the primary culprits for bringing down
nearly 300 commercial banks during 2008–10. Whereas Antoniades (2016) only finds some marginal
effect of private-level MBS held by large banks (assets greater than $1 billion). The measured im-
pact of residential real estate (RRE) loans in these and similar bank failure studies is relatively
small for two main reasons: 1) banks offloaded a large amount of RRE risk by selling them into se-
curitization structures (Mian and Sufi, 2009; Loutskina and Strahan, 2009; Demyanyk and Hemert,
2011), 2) standard bank mortgage measures do not account for the riskiness of the loans held on
balance sheet.
Berger and Bouwman (2013) and DeYoung and Torna (2013) also construct somewhat similar
measures to ours for residential mortgage exposures, but there are crucial differences which lead
to different conclusions. To control for banks’ exposures to the residential housing market, they
both calculate weighted-average house price growth for each bank using deposits in each state as
weights. Berger and Bouwman (2013) analyze bank failures in the United States over a longer
horizon between 1984 and 2010, and they do not find any significant effect of this index on the
survival probability of banks. Meanwhile, DeYoung and Torna (2013) focus on the last crisis and
find that stronger home price appreciation tends to reduce the probability of bank failure. Our
results differ in part because we do not just focus on house price growth but PTI. Growth is good
for collateral values, but unsupported growth is not sustainable and will eventually correct. Second,
we use the location of the actual mortgages not the location of branch deposits to calculate each
banks’ exposure to housing market developments. Third, we use data at the more granular county
level. In fact, Mian and Sufi (2009) show that using data at the state level instead of at the local
level (ZIP code) for the financial crisis can lead to opposite conclusions.
Additionally, Mian and Sufi (2009) show that mortgage defaults during the 2007–09 crisis in the
4

United States were concentrated in ZIP codes that experienced a much larger growth of mortgage
credit between 2002 and 2005 without improving fundamentals such as higher income growth. In
fact, the authors show that during the boom period there was a negative correlation between credit
growth and income growth. This fact leads to higher home price growth in ZIP codes with high
concentrations of borrowers with low credit scores despite lower relative or in some cases absolute
income growth. Their analysis indicates that a growth in house prices faster than what could be
justified based on fundamentals, such as income, is a harbinger of increased probability of defaults.
More broadly, a large number of studies focusing on early-warning systems, especially after the
financial crisis, show that house price growth is a strong predictor of banking crises historically
(Barrell et al., 2010; Borio and Drehmann, 2009; Claessens et al., 2010; Drehmann et al., 2010;
Mendoza and Terrones, 2008; Riiser, 2005). Cross country analyses by the European Systemic Risk
Board and Bank of England show that both house price growth and PTI are robust predictors of
banking crises (ESRB, 2014; BOE, 2016). A more recent and detailed study by Kalatie, Laakkonen
and Tolo (2015) uses data from 28 European Union countries and span the time period 1970–2012.
Importantly, the study shows that PTI outperforms transformations of the house price-to-rent ratio
or real house prices as an early warning signal for banking crises.
3 Data and Measuring Mortgage Risk
In this section, we discuss our main data sources: Home Mortgage Disclosure Act, bank financial
statements, house price data, and income data. In addition, we use bank failure data from the
Federal Deposit Insurance Corporation (FDIC). At the end of the section, we show how PTI
exposure is constructed. Variable definitions are provided in table 1.
3.1 The Home Mortgage Disclosure Act (HMDA)
The Home Mortgage Disclosure Act of 1975 is a law requiring most banks, savings and loan as-
sociations, credit unions, and consumer finance companies to report every mortgage application
received. As a result, the data provide substantial coverage of the United States mortgage market.
Avery, Brevoort and Canner (2007) estimate that HMDA covers approximately 80 percent of all
5

home lending nationwide in 2006.4 The mandatory reporting threshold for depository institutions
has changed over time but includes almost all commercial banks. Any bank with assets above
$44 million, with a branch in a metropolitan statistical area (MSA), and that originated at least
one mortgage loan had to file a HMDA report in 2015.
HMDA data include county and state codes to determine the location of the home. For baseline
testing, we use only data on originated and purchased loans that are kept (not sold in the same
year). The loan amount is used to weight PTI in each geographic area (county). To exclude outliers,
individual mortgage loans with amounts that are smaller than $10,000 or larger than $10 million
are dropped.
3.2 Bank Financial Statements
Each quarter commercial banks must file either “Consolidated Reports of Condition and Income for
a Bank with Domestic and Foreign Offices” (FFIEC 031) or “Consolidated Reports of Condition
and Income for a Bank with Domestic Offices Only” (FFIEC 041). These reports (hereafter, “Call
Reports”) provide detailed financial statements.
In order to capture risks associated with bank failure, we use Call Report data to construct
variables often used in prior research that are also proxies for the CAMELS ratings (Berger and
Bouwman, 2013; Antoniades, 2016).5 These variables should control for idiosyncratic causes of
bank insolvency or general risk taking at the bank level. In addition, we construct variables that
capture asset concentration risk, namely CRE loans given the findings of prior research. Table 1
provides more detail on how the control variables are constructed. Call Reports also contain data
on asset quality such as delinquency rates and net charge-offs. These variables are used as outcome
variables to assess whether PTI exposure captures mortgage risk. We match annual HMDA data
to Call Reports filed by commercial banks every December for the period between 2000 and 2013.
The sample used in baseline testing excludes banks that have total assets below $50 million,
banks that disappear from the sample before December 2011 but did not fail,6 and banks that enter
the sample in 2005 or later. We also drop banks that do not file a HMDA form. The resulting
4See Avery et al. (2007) for an extensive discussion of HMDA data.5The CAMELS rating system is used by bank examiners to assess the safety and soundness of a bank. More
specifically, CAMELS is an acronym of six measures: 1) capital adequacy, 2) asset quality, 3) management, 4)earnings, 5) liquidity, and 6) sensitivity to market risk.
6These “missing banks” are generally due to mergers and acquisitions or a bank changing its charter.
6

sample contains about 2,500 unique banks.
3.3 House Price and Income Data
The baseline results presented in this paper use house price data from Moody’s. Moody’s is slightly
preferred to other data sources because it has better coverage of counties. We separately test using
house price data from CoreLogic and Zillow to confirm our results. We obtain annual median
household income data at the county level from the Census Bureau.
3.4 Price-to-Income (PTI)
PTI is the primary mortgage risk measure used in this paper. It is calculated at the county level
as the median house price divided by the median household income. PTI has the advantage over
other measures as being based on good quality data that are available for most housing markets.
As discussed above, the ratio ties house prices to asset pricing fundamentals and has been shown
to outperform other measures such as the house price-to-rent ratio or real house prices as an early
warning signal for banking crises (Kalatie et al., 2015). PTI is also widely used by the real estate
industry to assess risk (e.g., Shiller (2015)).
Figure 1 is a United States map showing the distribution of PTI across counties. The dark blue
regions indicate high PTI counties. The map shows that PTI was highest mainly in sand states
(California, Nevada, Arizona, Florida), western states such as Oregon and Washington as well as
states in the northeast. Figure 2 shows the change in PTI between 2006 and 2010. It is almost a
mirror image of the previous map. The biggest declines in house prices relative to incomes during
the crisis occurred generally in counties where house prices had shown the biggest deviations from
incomes in the pre-crisis period. Data show that the same counties were also more likely to have
larger unemployment rates and bigger declines in household incomes after the crisis. This evidence
suggests that PTI is a good predictor of vulnerabilities in the housing market.
To measure PTI exposure precisely at the bank level, one would need to know every mortgage
that a bank has on balance sheet. HMDA data just report which mortgages a bank originated and
kept in that year. Mortgages can be sold off or repaid in subsequent years. For instance, early
prepayments are generally done by refinancing a mortgage. In order to get a good estimate of
a bank’s market exposure while controlling for early prepayments, we construct a weighted PTI
7

exposure measure using the last three years of mortgage data in HMDA. In particular, bank i’s
PTI exposure is calculated as follows:
PTIi,t =C∑c=1
wi,c,t × PTIc,t, (1)
where
c = the county; t = year,
wi,c,t =loans kepti,c,t→t−2
loans kepti,t→t−2
= the percent of mortgage lending to county c based on the dollar amounts
of kept owner-occupied mortgages for the past three years at bank i, and
PTIc,t = the median price-to-household income of county c in year t.
3.5 Summary statistics
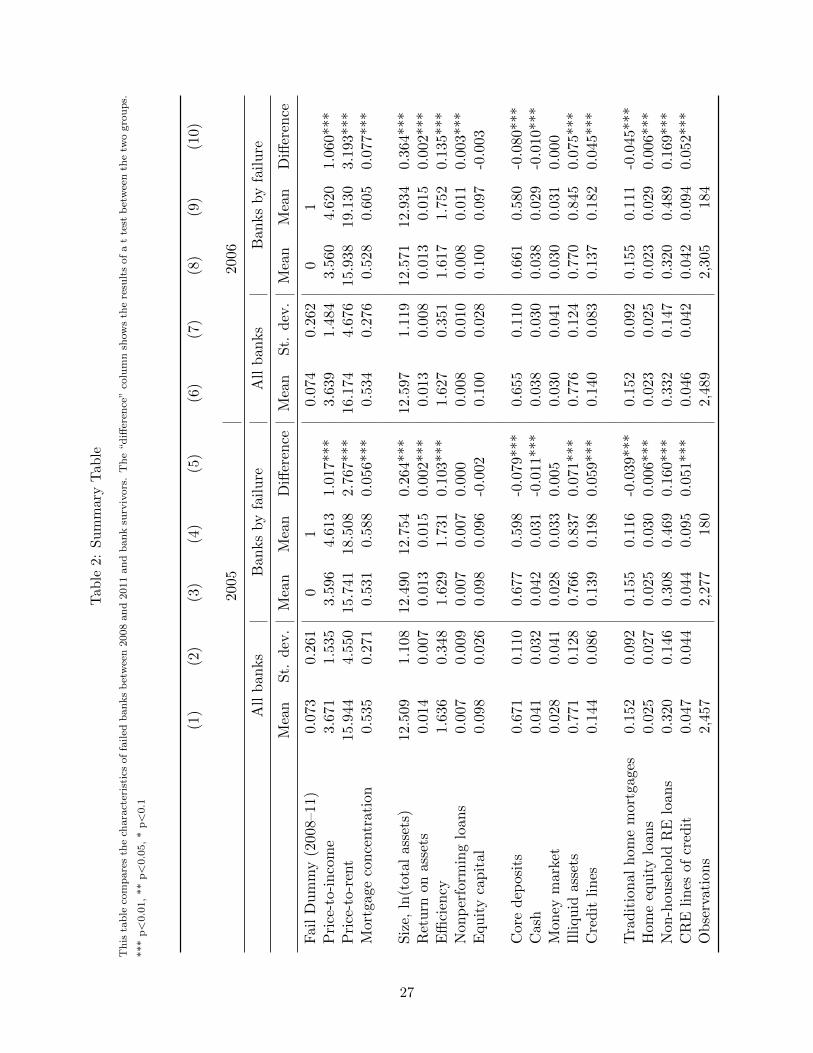
Table 2 shows the summary statistics for PTI exposure and bank control variables at the end of
2005 and 2006. All balance sheet measures are divided by total assets, except nonperforming loans
are divided by loans and size is the natural log of total assets. All variables are winsorized at the
1 percent and 99 percent levels. The data indicate that the average PTI exposure across the banks
in our sample was around 3.7 in 2005. This ratio was already leveling off in 2006.
The table also includes the means of these variables for banks that failed between 2008 and
2011 and for those that did not fail, and reports the results of a t-test of the mean differences
between the two groups (columns (5) and (10)). Notice that failed banks had significantly higher
PTI exposure in 2005 and 2006. Interestingly, the ratio of total traditional home mortgage portfolio
to total assets was significantly smaller for failed banks, indicating that this may not be a good
measure of mortgage risk. The table shows significantly higher exposures to on- and off-balance
sheet CRE exposures for failed banks (the last two variables in the table). Failed banks were also
larger on average, and they had less stable sources of funding, smaller cash buffers, more illiquid
assets, and larger credit lines.
8

4 Empirical Results
4.1 Testing Mortgage Risk Measures: RRE Delinquencies and Charge-offs
To demonstrate that PTI exposure is a good measure of ex post mortgage risk, we test the relation-
ship between PTI exposure and ultimate RRE loan delinquencies and net charge-offs.7 Specifically,
we test the relationship between PTI exposure during the build-up phase of the crisis and RRE
loan outcomes several years later.
Table 3 reports the delinquency results. Columns (1)–(3) show the results of regressing RRE
delinquency rates (delinquent RRE loans divided by total RRE loans) in 2009 on variables from
2005. Columns (4)–(6) use control variables from 2006.8 In the first specification, the control
variables include exposure to traditional home mortgages (RRE loans divided by total assets) and
bank size (natural logarithm of total assets). In the next specification, PTI exposure is added, and
in the last, the traditional home mortgages variable is removed.
As expected, the coefficient on PTI exposure is positive and significant. Banks with mortgage
exposure to high PTI markets had higher delinquency rates in subsequent years. Using the point
estimate on the interacted term and average PTI exposure in 2005 provides an estimated delin-
quency rate of 0.018 (=3.671*0.005). Given that the average delinquency rate in 2009 was 0.026,
PTI exposure is estimating approximately 70 percent of the measure. Also notice that adding
PTI exposure markedly improves the the performance of the regressions in terms of R-squared.
Meanwhile, across all of the specifications, the coefficient on traditional home mortgages is nega-
tive. Banks with a larger share of mortgages on their balance sheet actually had, on average, lower
delinquency rates during the crisis. This variable does not appear to be proxying for mortgage
risk as much as it is controlling for a bank’s business model. Banks that have relatively large
mortgage lending operations did not have large losses. The coefficient on bank size is positive and
significant in the simple regression (columns (1) and (4)) but loses significance after PTI exposure
is added. These results are consistent with larger banks generally taking more mortgage risk and
PTI exposure appropriately capturing that risk taking.
Table 4 reports similar regressions as table 3 but replaces the left hand side variable of RRE
7Delinquencies are defined as RRE loans that are more than 30 days past due or are nonaccrual.8Testing 2010 outcomes on variables in 2005 or 2006 produce similar results.
9

delinquency rate with cumulative RRE net charge-offs between 2008 and 2011 (that is, sum of net
charge-offs between 2008 and 2011 divided by RRE loans). Once again, the coefficient on traditional
home mortgages is negative. Basic on-balance sheet mortgage measures do not capture risk. In
contrast, higher values of PTI exposure are associated with higher charge-offs between two and five
years later. Note that again PTI exposure significantly improves the R-squared. In addition, taking
the point estimate and the average PTI exposure provides an estimated cumulative charge-off rate
of 0.040 (=3.671*0.011). The average cumulative charge-off rate was 0.043.
4.2 Bank Failures
Because we have established that PTI exposure captures mortgage risk, we now examine if the
measure is useful in explaining bank failures. Summary statistics in table 2 show that failed banks
had significantly higher PTI exposure in 2005 and 2006. Figure 3 plots the median PTI exposure
for failed and survived banks between 2000 and 2008. The figure shows that banks that failed
during the crisis already had higher PTI exposure in 2000, and this gap widened until right before
the crisis in 2006. In this section we test whether PTI exposure is a significant predictor of bank
failures after controlling for important bank risk characteristics.
Our main specification for the probability of a bank failing is:
Yi = α+ β1PTIi + β2PTIi ∗ RRE + β3RRE + γXi + εi, (2)
where Yi is a dummy variable that is equal to 1 if bank i fails between 2008 and 2011, RRE is
traditional home mortgages as used above, and Xi is a vector of controls for bank characteristics.
The coefficient of interest is β2. While PTI exposure captures risk, it is the interaction between
that risk and the total balance sheet exposure that is of interest. Given that higher PTI exposure
indicates higher risk, the expected sign on the interacted term is positive. Note that this specifica-
tion is a cross-sectional regression. We run separate regressions during the years leading up to the
financial crisis.
We estimate this binary dependent variable model using a logistic regression.9 Results are
shown in table 5, which reports the average marginal effects. Columns (1)–(3) use a benchmark
9The main conclusions of the results are similar if a probit regression is used.
10

specification using three different years: 2005, 2006, and 2007. This benchmark includes variables
used in the previously discussed literature. Importantly, the results in the first three columns
confirm the findings in those studies. When residential mortgage risk is measured by the size of
the mortgage book alone (traditional home mortgages), it is an insignificant predictor of bank
failures. Columns (4)–(6) present our baseline specification that adds PTI exposure and PTI
exposure interacted with traditional home mortgages. Across all three years, the coefficients on
the interaction term is significant, with a p-value ranging from 0.006 in 2005 to 0.029 in 2007.
This result suggests that banks with large residential mortgage exposures concentrated in over
appreciated housing markets were more likely to fail during the crisis. Meanwhile, the coefficient
of traditional home mortgages becomes negative and significant, which indicates that banks with
a large mortgage business were generally solvent as long as they were well diversified or did not
concentrate most of their business in high PTI counties.
Both the benchmark and baseline specifications also include proxies for CAMELS measures. In
particular, we include the equity ratio for capital adequacy ; nonperforming loans to total loans for
asset quality ; efficiency ratio (ratio of revenue to operational expense) for management capability ;
return on assets (ROA) for earnings; cash ratio, money market assets, and illiquid assets to total
assets for liquidity ; and core deposits ratio for sensitivity to interest rates. We also include other
important risk characteristics such as size, unused lines of credit to total assets, and additional
real estate controls such as on- and off-balance sheet CRE exposures and home equity loans. The
results are consistent with the findings in the literature, such as Cole and White (2012), Berger
and Bouwman (2013), and Antoniades (2016), and indicate that banks that relied less on stable
sources of funding, such as equity capital and core deposits and instead relied more on brokered
deposits and commercial paper, were more likely to fail during the crisis. Furthermore, smaller
cash buffers, more illiquid assets, bigger credit lines, and more nonperforming loans increased the
probability of failure. Finally, as shown in prior research, CRE exposure is an important predictor
of bank failure. The coefficients on both CRE loans and CRE commitment loans are positive and
statistically significant.
11

4.3 Economic Significance
The average marginal effects reported in table 5 do not reveal the economic significance, and the
coefficients are not comparable across variables as each variable has a different distribution. To test
the economic significance of these results, we do the following exercise: For each variable that enters
the logit regression with a positive and significant coefficient, we set the value of each observation
to the 25th quartile of this variable. We keep all other variables at their original values. One
exception to this rule is when we change the PTI exposure to the lowest quartile, we also recalculate
the interaction of PTI exposure with traditional home mortgages. Therefore, the reported effect
of PTI exposure is the sum of the direct effect of PTI exposure and the indirect effect that comes
from the interaction of PTI exposure with traditional home mortgages. In this experiment, we
keep the traditional home mortgages at their original values, so that the test result measures the
effect of exposing banks to riskier housing markets while keeping their overall mortgage business
size constant. We then use the baseline regression results with household mortgage risk controls,
presented in columns (4)–(6) of table 5, to calculate the predicted probability of failure for each
bank.
For variables that enter the logit regression with a negative and significant coefficient, such
as traditional home mortgages, equity capital, and core deposits, we raise the values to the 75th
quartile of the distribution and repeat the exercise. For traditional home mortgages, this time we
keep PTI exposure stable but recalculate the interaction term after raising the values of traditional
home mortgages to its 75th quartile in a given year. Therefore, the reported values show the
sum of the direct and indirect effect of this variable through its interaction with PTI exposure.
Table 6 shows the results of this exercise. Reported values are the differences between the average
probability of failure under this exercise for each variable and the predicted probability of failure
from baseline specification, reported in the last row.
The test shows that reducing PTI exposure for each bank to the 25th quartile of its distribution
in the sample lowers the average probability of failure across banks by 2.02 percentage points in
2005, 2.19 percentage points in 2006, and 1.93 percentage points in 2007. This effect is economically
significant because it corresponds to an approximate 28 percent (2.02/7.33) reduction in the failure
rate. Meanwhile, increasing the traditional home mortgages to the 75th quartile of its distribution
12

leaves the average probability of bank failure in 2005 almost unchanged because the indirect effect
coming from the interaction term cancels out the direct effect. However, this exercise lowers the
average probability of failure across banks by 0.75 percentage points in 2006 and 0.25 percentage
points in 2007.
To summarize all of these results, the economic significance of PTI exposure adjusted for ex-
posure is larger than that of equity capital and home equity loans, is close to the effect of core
deposits, but it is smaller than measures of CRE exposures. In fact, CRE exposures have the
largest economic significance among all variables, and this result is consistent with the literature.
However, unlike the results presented here, the literature dismisses any statistically or economically
significant effect of residential mortgage exposures on bank failures during the crisis.
5 Robustness Tests
5.1 Alternative Samples
In this section we subject our main bank failure results to a battery of robustness tests. First,
we show that results reported in table 5 are robust to changes in the sample. In table 7 we redo
the analysis with a variety of samples: include the small banks (under $50 million) in column
(1), exclude large banks (over $10 billion) in column (2), and change the time windows for bank
failures to between 2008 and 2013 in column (3). The general results still hold. We present the
results for 2006, but we obtain similar results for 2005 and 2007. In particular, the coefficient of
the interaction term between PTI exposure and traditional home mortgages remains positive and
significant. Its p-value increases when we include acquired banks indicating that the effect mainly
comes from failed banks not from those acquired during the crisis. The p-value also increases when
we exclude the large banks, but the coefficient is still significant at the 95 percent level, indicating
that our results are not driven by the large banks.
13

5.2 Additional Controls
5.2.1 Local Economic Factors
It is possible that banks that operated in counties with overheated housing markets are more likely
to fail due to deteriorating local economic conditions that are not necessarily related to the housing
market developments. For example, these counties may experience shocks to their economy which
result in higher unemployment rates and lower incomes which then increases banks’ likelihood of
failure because of its exposures to this market through non-housing related credit such as business
loans, auto loans, personal loans, and credit card debt. Because we do not observe each bank’s
exposure to these products at the county level, we develop a proxy variable to control for local
non-housing related shocks that can affect banks.
We measure the size of the local economic shock by the change in the unemployment rate
between 2006 and 2009 at the county level. In order to obtain the part of this shock that is not
related to the developments in the residential housing market in the pre-crisis period, we obtain
the residuals from an OLS regression of the change in unemployment rate during the crisis on PTI
exposure using a cross-section of counties in 2005, 2006, and 2007. We then use the Summary of
Deposits data to calculate each banks’ exposure to this non-housing related local economic shock.
In particular, we calculate a weighted average shock for each bank using a bank’s deposits in each
county as weights. We then include this weighted shock as a control variable in our baseline logit
regression of bank failures. These robustness tests are presented in the first two columns of table 8.
While the coefficient on the local economic shock variable is positive and significant, the mortgage
risk measure also remains positive and significant.10
5.2.2 Mortgage Concentration
When considering the mortgage risk of a bank, it may also be important to consider how geograph-
ically concentrated a bank is. A bank that only has exposure to a handful of counties may be more
at risk to local area asset bubbles. To control for this we also construct a mortgage concentration
10Results for 2007 are not reported in table 8 due to space constraints, but they are similar to 2005 and 2006.
14

variable calculated like the Herfindahl-Hirschman Index (HHI) as
Mortgage concentrationi,t =C∑c=1
(loans kepti,c,t→t−2
loans kepti,t→t−2
)2
(3)
for bank i in year t. As before, loans kept equals the dollar amount of loans originated and purchased
in a year and not sold. Because the mortgage concentration variable is higher for banks that hold
most of their mortgage loans in a small number of counties, the variable captures the extent to
which a bank can diversify its mortgage portfolio. We add this control to our baseline specification
and present the results in the last two columns of table 8. Our results remain largely unchanged.
The coefficient on the interacted term remains positive and significant and has a similar magnitude.
5.3 Other Possible Measures of Mortgage Risk
5.3.1 Considering Regional Dynamics of PTI
One main concern about using PTI as a regional mortgage risk measure is whether it would penalize
areas that tend to have high PTI. A sustainable level of PTI is determined by several factors such
as demographic and supply dynamics, changes in real interest rates, shifts in term or inflation
premia, and changes credit availability (BOE, 2016). As these underlying factors could differ
across regions, so can the sustainable level of the PTI. In fact, there are significant variations
across different geographies in the long-run averages of PTI and its deviation from this average in
a given year. For example, figure 4 plots the dynamics of PTI for four different states between
1990 and 2015. First, the figure shows that the level of PTI is significantly higher in California and
Florida throughout the period compared with West Virginia and Kansas. Second, there are some
regional trends that differ from the national average. For example, in West Virginia, PTI continues
to decline after the crisis in the first half of 2010s, whereas in the three other states it starts to
increase again in 2011 or 2012. Nevertheless, the substantial increase in the ratio at the onset of
the crisis and the collapse afterwards is common to almost all 50 states.
In order to address this concern that some areas have consistently higher PTIs, we re-estimate
our regressions for delinquency rates, charge-offs, and bank failures using the changes in PTI
exposure instead of the levels of this variable. In particular, we focus on two measures of change:
15

deviation of current PTI exposure from a medium-run average of 8 years and average log-change
in PTI exposure in the past five years. We present the results with these alternative measures
in the first two columns of table 9. Our results remain robust to using these change variables:
the coefficients on the interaction between the new PTI exposure measure and traditional home
mortgages are positive and significant. In general, deviations from medium to long-run average
yield lower p-values compared with the average changes in later years. In particular, the coefficient
on the interacted term using average change is less significant in 2007 as house prices start to
decrease (not shown).
5.3.2 Price-to-Rent (PTR)
Alternatively, PTR could be used to capture mortgage risk across geographic markets. This measure
also ties house prices to market fundamentals, namely the price of a substitute good, rented housing
services. If house prices increase much more than rents, PTR increases, capturing evidence of miss-
pricing in the market. The weakness of this measure is data comparability. In many markets, the
houses that are rented are likely not representative of the houses that are owned. As a result, our
preferred measure is PTI. We nevertheless also repeat the analysis with PTR exposure instead of
PTI exposure. The results presented in column (3) of table 9 show that PTR also predicts bank
failures during the crisis. However, PTR exposure performs somewhat worse compared with the
PTI exposure based risk measures. For example, the interaction term for PTR is insignificant with
p-value of 0.17 in 2005 and only significant at 90 percent level with a p-value of 0.062 in 2007.
5.3.3 Alternative House Price Indexes and House Price Growth
We separately test using house price data from CoreLogic and Zillow to construct the PTI measure.
Zillow and Corelogic have smaller coverage of county level house prices compared with the Moody’s
data. Nevertheless, we obtain similar results using these alternative data sources. Results with
Zillow in 2006 are presented in column (4) of table 9.
Price growth could also be used to proxy for mortgage risk. However, this measure does not
control for market conditions, in particular, the driver of price increases. For example, price in-
creases due to economic growth are more sustainable than price increases driven by overly optimistic
expectations.
16

6 Mortgage Risk and Macroprudential Policies
In this section we test to see how banks managed their mortgage risk. As mortgage risk was building
in the system, were banks individually accounting for this risk and increasing their capital? Figure
5 plots the relationship between PTI exposure and equity capital in the run up to the crisis. The
four charts show the plot separately for each year between 2004 and 2007. The red line is the
estimated regression line. The lines are generally flat, showing that the linear relationship between
PTI exposure and equity is effectively zero. While high PTI exposure presents a greater likelihood
of house price correction, we find no evidence that banks reacted to this vulnerability by bolstering
loss-absorption capacity.
This lack of capital build can partially be attributed to the notion that markets did not antic-
ipate an imminent house price correction in the 2000s. It may also reflect moral hazard—the fact
that banks expected to be bailed out by the government in case of a downturn and therefore did
not voluntarily provision for such a scenario. However, it may also reflect incentives created by
regulatory capital requirements in which differences in the quality of RRE portfolios across banks
can be obscured.11 The risk-weighting on most residential mortgages is 50 percent. Our results
suggest that there is scope for risk-weights that vary with the vulnerability of a bank’s mortgage
portfolio.
One way make RRE risk weights more risk sensitive would be to explicitly relate them to forward
looking measures of risk such as PTI. In fact, the European Union’s 2013 Capital Requirements
Regulation (CRR) law allows national authorities to set risk weights up to 150 percent for real estate
exposures due to financial stability concerns. More specifically, the article allows setting higher risk
weights for different loans, where geographic area is one factor. Higher risk weights based on
forward looking measures such as PTI would also address overheating in specific housing markets
that may develop into systemic risk concerns (ESRB (2014), p. 59). Indeed, several countries have
begun using PTI in determining macroprudential policies. For example, the Financial Stability
Committee of the United Kingdom includes PTI among the core real estate indicators used in
adjusting housing policy instruments such as LTV and DTI limits. The European Systemic Risk
11Basel II, which allows large and internationally active banks to implement internal risk models to calculaterequired regulatory capital under the advanced approach, was not fully implemented in the U.S. before the crisis.The effective date was April 1, 2008.
17

Board (ESRB) also lists PTI among a list of promising indicators that can be monitored by national
authorities to adjust macroprudential policies directed at the real estate sector.
Using macroprudential policy instruments that target banks by relating risk weights to PTI
may pose its own set of issues, but it does have some advantages over policy instruments that set
limits on loan characteristics such as LTV and borrower DTI. First, higher risk weights have a
clear effect on bank resilience and can target specific regional real estate markets. Second, LTV
and DTI limits are subject to frontloading of loan applications in anticipation of the enactment of
or changes in the limit. Third, individual limits are easier to manipulate by banks for example by
overvaluing the property in the case of LTV limits or by increasing the maturity of loan in the case
of debt-service-to-income caps (ESRB, 2014).
There may also be other areas where PTI can be used to measure mortgage risk, and these
could include regulatory and company-run stress tests. Bank internal risk measures can similarly
account for local area effects specific to their geographic markets. By using measures like PTI,
risk managers can account for local area miss-pricing as well as economic conditions. Notice that
county level PTI is easy for a bank to calculate and can capture varying risks for specific mortgage
portfolios. In addition, while our measure was limited to mortgages originated in the last three
years, the bank can calculate a more precise measure of risk using the exact composition of its
portfolio. If banks appropriately measure mortgage risk, they can take steps to hedge that risk. In
the cross-section, that could push banks with more vulnerable mortgage portfolios to build stronger
capital buffers.
7 Conclusion
During and following the crisis, hundreds of banks failed. The financial crisis was marked by a large
decline in residential housing prices which led to many defaults, foreclosures, and bankruptcies.
However, research has generally found commercial real estate to be the primary driver of bank
failures, while dismissing any significant contribution from RRE exposures. We provide evidence
that this result in the literature may be attributable to the fact that RRE exposure is generally
measured by mortgage loans or MBS held on balance sheet, which does not account for real financial
risk from the underlying asset, namely the deviation of assets prices from fundamentals. Our
18

measure of residential mortgage risk, which is based on direct exposure to counties where house
prices have grown faster than household income, is significant in predicting bank failure, RRE
delinquencies, and RRE charge-offs. Because PTI exposure can be calculated for nearly every
bank that holds residential mortgages, it can be used to identify growing vulnerabilities in the
financial system and to assess the possible effects of a housing price correction in specific markets.
In addition, we find that banks that experienced large increases in PTI exposure before the crisis
did not increase their capital buffers relatively more to counteract this extra risk. Therefore, our
results suggest that it could be appropriate to consider regulation that would provide stronger
incentives to build capital against vulnerable mortgage portfolios.
19

References
Antoniades, Adonis, “Commercial Bank Failures During The Great Recession: The Real (Estate)
Story,” 2016. National University of Singapore Working Paper.
Avery, Robert B., Kenneth P. Brevoort, and Glenn B. Canner, “Opportunities and Issues
in Using HMDA Data,” Journal of Real Estate Research, October 2007, 29 (4), 351–379.
Barrell, Ray, E Philip Davis, Dilruba Karim, and Iana Liadze, “Bank regulation, property
prices and early warning systems for banking crises in OECD countries,” Journal of Banking &
Finance, 2010, 34 (9), 2255–2264.
Berger, Allen N. and Christa H.S. Bouwman, “How Does Capital Affect Bank Performance
During Financial Crises?,” Journal of Financial Economics, 2013, 109, 146–176.
BOE, (Bank of England), “The Financial Policy Committee’s powers over housing policy in-
struments,” 2016.
Borio, Claudio and Mathias Drehmann, “Assessing the risk of banking crises-revisited,” BIS
Quarterly Review, 2009.
Claessens, Stijn, M Ayhan Kose, and Marco E Terrones, “Financial cycles: What? How?
When?,” in “NBER International Seminar on Macroeconomics 2010” University of Chicago Press
2010, pp. 303–343.
Cole, Rebel A. and Lawrence J. White, “Deja Vu All Over Again: The Causes of U.S.
Commercial Bank Failures This Time Around,” Journal of Financial Services Research, 2012,
42, 5.
Davis, Morris A. and Francois Ortalo-Magne, “Household Expenditures, Wages, Rents,”
Review of Economic Dynamics, 2011, 14, 248.
Demyanyk, Yuliya and Otto Van Hemert, “Understanding the Subprime Mortgage Crisis,”
Review of Financial Studies, 2011, 24 (2), 1848–1880.
20

DeYoung, Robert, “The failure of new entrants in commercial banking markets: a split-
population duration analysis,” 2003, 12 (1), 7–33.
and Gokhan Torna, “Nontraditional banking activities and bank failures during the financial
crisis,” Journal of Financial Intermediation, 2013, 22 (3), 397–421.
Drehmann, Mathias, Claudio EV Borio, Leonardo Gambacorta, Gabriel Jimenez, and
Carlos Trucharte, “Countercyclical capital buffers: exploring options,” BIS Working Papers,
2010, (317).
ESRB, (European Systemic Risk Board), “The ESRB Handbook on Operationalizing Macro-
prudential Policy in the Banking Sector,” 2014.
FRB, (Board of Governors of the Federal Reserve Board), “Summary Analysis of Failed
Bank Reviews,” Office of the Inspector General Report, 2011.
Kalatie, Simo, Helina Laakkonen, and Eero Tolo, “Indicators used in setting the counter-
cyclical capital buffer,” Bank of Finland Research Discussion Paper, 2015, (No. 8/2015).
Loutskina, Elena and Philip E. Strahan, “Securitization and the Declining Impact of Bank
Finance on Loan Supply: Evidence from Mortgage Originations,” Journal of Finance, 2009, 64
(2), 861–889.
Mendoza, Enrique G and Marco E Terrones, “An anatomy of credit booms: evidence from
macro aggregates and micro data,” NBER Working Paper, 2008, (14049).
Mian, Atif and Amir Sufi, “The Consequences of Mortgage Credit Expansion: Evidence from
the U.S. Mortgage Default Crisis,” Quarterly Journal of Economics, 2009, 124 (4), 1449.
Oshinsky, Robert and Virginia Olin, “Troubled Banks: Why Don’t They All Fail,” FDIC
Banking Rev., 2006, 18, 23.
Riiser, Magdalena D, “House prices, equity prices, investment and credit-what do they tell us
about banking crises? A historical analysis based on Norwegian data,” Norges Bank. Economic
Bulletin, 2005, 76 (3), 145.
Shiller, Robert J., Irrational Exuberance, Princeton, NJ: Princeton University Press, 2015.
21

Thomson, James B, “Predicting bank failures in the 1980s,” Economic Review-Federal Reserve
Bank of Cleveland, 1991, 27 (1), 9.
Whalen, Gary, “A proportional hazards model of bank failure: an examination of its usefulness
as an early warning tool,” Economic Review-Federal Reserve Bank of Cleveland, 1991, 27 (1),
21.
Wheelock, David C and Paul W Wilson, “Why do banks disappear? The determinants of US
bank failures and acquisitions,” The Review of Economics and Statistics, 2000, 82 (1), 127–138.
22

Figures and Tables
Figure 1: Banks’ Exposure to Mortgage Risk 2006
Figure 2: Change in the Price-to-Income between 2006 and 2010
23

Figure 3: Banks’ Exposure to the Mortgage Risk and Failures
2.5
33.
54
4.5
Med
ian
Wei
ghte
d Pr
ice
to In
com
e Ra
tio
2000 2002 2004 2006 2008Year
Survived Banks Failed Banks 2008-11
Figure 4: Price-to-Income 1990–2015
24

Figure 5: Equity Capital and Banks’ Exposure to Mortgage Risk
.05
.1.1
5.2
.25
.3Eq
uity
Cap
ital
2 4 6 8 10Weighted Price to Household Income
2004
.05
.1.1
5.2
.25
.3Eq
uity
Cap
ital
2 4 6 8 10Weighted Price to Household Income
2005
.05
.1.1
5.2
.25
.3Eq
uity
Cap
ital
2 4 6 8 10Weighted Price to Household Income
2006
.05
.1.1
5.2
.25
.3Eq
uity
Cap
ital
2 4 6 8 10Weighted Price to Household Income
2007
25

Table 1: Variable Definitions
Variable Definition
Price-to-income A median house price to median household income ratio is calculated annuallyfor each county. The weights for each bank are based on the dollar amounts ofloans that are originated or purchased by that bank and kept (not sold withinthe year). Weights use such loans over the past three years. See equation 1.
Price-to-rent A median house price to median annual rent for a 3-bedroom house ratio iscalculated annually for each county. The weights for each bank are based onthe dollar amounts of loans that are originated or purchased by that bank andkept (not sold within the year). Weights use such loans over the past threeyears. See equation 1 and replace income with rent.
Mortgage concentration A Herfindahl-Hirschman Index (HHI) of mortgages by county for each bank.See equation 3.
Traditional home mort-gages
first lien + junior lientotal assets
Size ln(total assets)
Return on assets net incomeaverage annual assets
Efficiencyinterest income − interest expense + noninterest income
noninterest expense
Delinquent loanstotal nonaccuring loans + total past due loans
total loans
Equity capitaltotal equitytotal assets
Core depositstransaction deposits + savings + small time deposits
total assets
Cashcash + balances at depository insitutions
total assets
Money marketfederal funds sold + securities purchased under agreements to resell
total assets
Illiquid assetstotal assets − cash − money market − total securities − trading assets
total assets
Credit lines unused commitmentstotal assets
Home equity loanshome equity lines of credit
total assets
Commercial real estate(CRE) loans
multifamily, nonfarm nonresidential, construction, and land development loanstotal assets
CRE lines of creditcommitments to fund commercial real estate, secured and unsecured
total assets
26
Tab
le2:
Su
mm
ary
Tab
le
Th
ista
ble
com
pare
sth
ech
ara
cter
isti
csof
failed
ban
ks
bet
wee
n2008
an
d2011
an
db
an
ksu
rviv
ors
.T
he
“d
iffer
ence
”co
lum
nsh
ow
sth
ere
sult
sof
at
test
bet
wee
nth
etw
ogro
up
s.
***
p<
0.0
1,
**
p<
0.0
5,
*p<
0.1
(1)
(2)
(3)
(4)
(5)
(6)
(7)
(8)
(9)
(10)
2005
200
6
All
banks
Banks
by
failure
All
ban
ks
Ban
ks
by
failure
Mea
nSt.
dev
.M
ean
Mea
nD
iffer
ence
Mea
nSt.
dev
.M
ean
Mea
nD
iffer
ence
Fai
lD
um
my
(200
8–11
)0.
073
0.2
610
10.
074
0.2
62
01
Pri
ce-t
o-in
com
e3.
671
1.53
53.5
96
4.61
31.
017**
*3.
639
1.4
84
3.56
04.6
201.
060
***
Pri
ce-t
o-re
nt
15.9
444.
550
15.7
4118
.508
2.7
67***
16.1
74
4.67
615
.938
19.
130
3.19
3**
*M
ortg
age
conce
ntr
ati
on0.
535
0.271
0.5
31
0.58
80.
056**
*0.
534
0.2
76
0.52
80.6
050.
077
***
Siz
e,ln
(tot
alas
sets
)12
.509
1.10
812
.490
12.7
540.2
64***
12.5
97
1.11
912
.571
12.
934
0.36
4**
*R
eturn
onass
ets
0.0
140.
007
0.0
13
0.01
50.
002**
*0.
013
0.0
08
0.01
30.0
150.
002
***
Effi
cien
cy1.
636
0.34
81.6
29
1.73
10.
103**
*1.
627
0.3
51
1.61
71.7
520.
135
***
Non
per
form
ing
loan
s0.
007
0.0
090.0
07
0.00
70.
000
0.008
0.0
10
0.00
80.0
110.
003
***
Equit
yca
pit
al0.
098
0.026
0.0
98
0.09
6-0
.002
0.100
0.0
28
0.10
00.0
97-0
.003
Cor
edep
osi
ts0.
671
0.11
00.6
77
0.59
8-0
.079*
**
0.655
0.1
10
0.66
10.5
80-0
.080
***
Cas
h0.0
410.
032
0.0
42
0.03
1-0
.011*
**
0.038
0.0
30
0.03
80.0
29-0
.010
***
Mon
eym
arke
t0.0
280.
041
0.0
28
0.03
30.
005
0.030
0.0
41
0.03
00.0
310.
000
Illiquid
asse
ts0.
771
0.12
80.7
66
0.83
70.
071**
*0.
776
0.1
24
0.77
00.8
450.
075
***
Cre
dit
lines
0.1
440.
086
0.1
39
0.19
80.
059**
*0.
140
0.0
83
0.13
70.1
820.
045
***
Tra
dit
ional
hom
em
ortg
ages
0.15
20.0
92
0.1
55
0.11
6-0
.039*
**
0.152
0.0
92
0.15
50.1
11-0
.045
***
Hom
eeq
uit
ylo
ans
0.02
50.
027
0.0
25
0.03
00.
006**
*0.
023
0.0
25
0.02
30.0
290.
006
***
Non
-hou
sehol
dR
Elo
ans
0.32
00.1
46
0.3
08
0.46
90.
160**
*0.
332
0.1
47
0.32
00.4
890.
169
***
CR
Elines
ofcr
edit
0.04
70.
044
0.0
44
0.09
50.
051**
*0.
046
0.0
42
0.04
20.0
940.
052
***
Obse
rvati
ons
2,4
572,2
77
180
2,489
2,30
518
4
27

Table 3: Regression of Delinquencies on Price-to-Income
This table shows the results of regressing the delinquency rates of RRE loans (delinquent RRE loans divided by total RRE
loans) in 2009 on bank characteristics from three years earlier. Price-to-income is a county price-to-income ratio weighted at
the bank level using three years of data on the dollar amounts of loans that are originated or purchased by that bank and kept
(not sold within the year). Traditional home mortgages is first lien and junior lien residential mortgage loans divided by total
assets.
(1) (2) (3) (4) (5) (6)Estimate 2009 Delinquencies Estimate 2009 Delinquencies
VARIABLES using 2005 using 2006
Price-to-income 0.005*** 0.005*** 0.005*** 0.005***(0.000) (0.000) (0.000) (0.000)
Traditional home mortgages -0.015** -0.007 -0.021*** -0.014**(0.028) (0.318) (0.001) (0.021)
Size, ln(total assets) 0.003*** 0.001 0.001 0.003*** 0.001 0.001(0.000) (0.292) (0.236) (0.000) (0.194) (0.107)
Constant -0.007 -0.001 -0.003 -0.009 -0.000 -0.005(0.341) (0.910) (0.683) (0.242) (0.961) (0.472)
Observations 2,392 2,392 2,392 2,426 2,426 2,426R-squared 0.014 0.080 0.079 0.019 0.074 0.072
Robust pval in parentheses*** p<0.01, ** p<0.05, * p<0.1
28

Table 4: Regression of Cumulative Net Charge-offs on Price-to-Income
This table shows the results of regressing cumulative net charge-offs of RRE loans between 2008 and 2011 (sum of net charge-
offs between 2008 and 2011 divided by RRE loans) on bank characteristics in 2005 and 2006. Price-to-income is a county
price-to-income ratio weighted at the bank level using three years of data on the dollar amounts of loans that are originated or
purchased by that bank and kept (not sold within the year). Traditional home mortgages is first lien and junior lien residential
mortgage loans divided by total assets.
(1) (2) (3) (4) (5) (6)VARIABLES 2005 2006
Price-to-income 0.010*** 0.011*** 0.008*** 0.009***(0.000) (0.000) (0.000) (0.000)
Traditional home mortgages -0.159*** -0.142*** -0.126*** -0.115***(0.000) (0.000) (0.000) (0.000)
Size, ln(total assets) 0.007*** 0.003* 0.004*** 0.007*** 0.003*** 0.004***(0.000) (0.063) (0.003) (0.000) (0.009) (0.000)
Constant -0.019 -0.005 -0.049*** -0.028** -0.012 -0.050***(0.238) (0.758) (0.002) (0.034) (0.368) (0.000)
Observations 2,457 2,457 2,457 2,489 2,489 2,489R-squared 0.071 0.123 0.085 0.075 0.118 0.082
Robust pval in parentheses*** p<0.01, ** p<0.05, * p<0.1
29

Table 5: Logit Regression of Bank Failure on Bank Characteristics
This table shows the results of using a logit regression of bank failure on bank characteristics. The reported values are the
average marginal effects. Price-to-income is a county price-to-income ratio weighted at the bank level using three years of data
on the dollar amounts of loans that are originated or purchased by that bank and kept (not sold within the year). Traditional
home mortages is first lien and junior lien residential mortgage loans divided by total assets. Other variable definitions are
provided in table 1.
(1) (2) (3) (4) (5) (6)Comparison Specification Baseline Specification
VARIABLES 2005 2006 2007 2005 2006 2007
Price-to-income (PTI) 0.001 0.003 0.002(0.819) (0.556) (0.637)
PTI * Traditional home mortgages 0.077*** 0.077*** 0.056**(0.006) (0.007) (0.029)
Traditional home mortgages -0.013 -0.101 -0.046 -0.373** -0.465*** -0.298**(0.876) (0.227) (0.563) (0.019) (0.005) (0.036)
Home equity loans 0.364* 0.692*** 0.498** 0.236 0.596*** 0.429**(0.072) (0.002) (0.015) (0.236) (0.004) (0.032)
Non-household RE loans 0.287*** 0.232*** 0.244*** 0.234*** 0.182*** 0.205***(0.000) (0.000) (0.000) (0.001) (0.005) (0.001)
CRE lines of credit 0.562*** 0.915*** 0.581*** 0.565*** 0.906*** 0.590***(0.000) (0.000) (0.001) (0.000) (0.000) (0.001)
Equity capital -0.366 -0.499** -0.839*** -0.364 -0.580** -0.883***(0.119) (0.043) (0.005) (0.126) (0.023) (0.004)
Core deposits -0.259*** -0.248*** -0.203*** -0.247*** -0.227*** -0.176***(0.000) (0.000) (0.000) (0.000) (0.000) (0.001)
Cash -0.619** -0.374 -0.401 -0.719** -0.467* -0.470*(0.030) (0.140) (0.126) (0.013) (0.061) (0.067)
Money market 0.318*** 0.285** 0.184 0.255** 0.232* 0.158(0.007) (0.023) (0.300) (0.024) (0.053) (0.386)
Illiquid assets 0.027 0.115 0.149** 0.072 0.156** 0.179**(0.717) (0.141) (0.047) (0.322) (0.042) (0.016)
Size 0.001 0.011** 0.011** -0.003 0.006 0.008*(0.857) (0.034) (0.019) (0.605) (0.307) (0.093)
Return on assets 0.150 -0.009 -2.555*** 0.201 0.226 -2.459***(0.866) (0.990) (0.000) (0.820) (0.763) (0.000)
Efficiency -0.028 -0.022 0.022 -0.026 -0.020 0.026(0.140) (0.212) (0.164) (0.156) (0.236) (0.103)
Non-performing loans 0.739* 1.602*** 1.435*** 0.878** 1.656*** 1.405***(0.057) (0.000) (0.000) (0.023) (0.000) (0.000)
Credit lines 0.041 -0.265** -0.210* 0.017 -0.285*** -0.240**(0.626) (0.017) (0.083) (0.837) (0.009) (0.041)
Observations 2,457 2,489 2,536 2,457 2,489 2,536Pseudo R-squared 0.236 0.270 0.327 0.249 0.286 0.336
Robust pval in parentheses. *** p<0.01, ** p<0.05, * p<0.1
30

Table 6: Economic Significance of Logit Regression Results
To test the economic significance of the main results, we do the following exercise. For each variable that enter the logit
regression with a positive coefficient, we set the value of each observation to the 25th quartile of this variable. We keep all
other variables at their original values. We then use the regression results with real estate controls, presented in columns (4)-(6)
of 5, to calculate the predicted probability of failure for each bank. Reported values are the differences between the average
probability of failure under this exercise for each variable and the predicted probability of failure from the baseline model,
reported in the last row. The reported effect of PTI is the sum of the direct effect of PTI and the indirect effect that comes
from the interaction of PTI with the traditional home mortgages. For variables that enter the logit regression with a negative
coefficient, such as equity capital and core deposits, we raise the values to the 75th quartile of the distribution and repeat the
exercise. The reported values for traditional home mortgages show sum of the direct effect of this variable and indirect effect
through its interaction with PTI. The other variable definitions are provided in table 1.
Economic ImpactVariable 2005 2006 2007
Price-to-income (PTI) 2.02 2.19 1.93Non-household RE loans 3.81 3.36 3.57Home equity loans 0.60 1.28 0.96CRE lines of credit 3.11 4.22 2.59
Traditional home mortgages 0.00 0.75 0.25Equity capital 0.37 0.57 1.05Core deposits 2.50 2.35 1.72
Number of banks 2,457 2,489 2,536Failed 180 184 177Loss rate in data 7.33 7.39 6.98Loss rate from the model 7.33 7.39 9.98
31

Table 7: Robustness: Alternative Samples
This table shows the results of using a logit regression of bank failure with alternative samples compared with our baseline
model in table 5. We change one dimension of the baseline sample at a time. In the first column we include banks that were
acquired between 2008 and 2011 in the list of failed banks. In the second column we exclude large banks (over $10 billion
in total assets). In the third column we change the time windows for bank failures to between 2008 and 2013. The variable
definitions are provided in table 1.
(1) (2) (3) )Include Acquired Banks Exclude Large Banks Failures 2008-13
VARIABLES 2006 2006 2006
Price-to-income (PTI) 0.002 0.003 0.002(0.558) (0.488) (0.647)
PTI * Traditional home mortgages 0.060** 0.065** 0.092***(0.021) (0.028) (0.003)
Traditional home mortgages -0.380** -0.429** -0.608***(0.012) (0.012) (0.001)
Home equity loans 0.429** 0.605*** 0.700***(0.019) (0.004) (0.003)
Non-household RE loans 0.145*** 0.197*** 0.215***(0.009) (0.003) (0.003)
CRE lines of credit 0.790*** 0.939*** 1.003***(0.000) (0.000) (0.000)
Equity capital -0.516*** -0.523** -0.611**(0.007) (0.039) (0.019)
Core deposits -0.188*** -0.206*** -0.267***(0.000) (0.000) (0.000)
Cash -0.379* -0.484* -0.793**(0.075) (0.065) (0.011)
Money market 0.203** 0.200 0.388***(0.035) (0.109) (0.003)
Illiquid assets 0.109* 0.151* 0.221**(0.089) (0.055) (0.011)
Size 0.003 0.004 0.003(0.482) (0.485) (0.593)
Return on assets 0.794 0.236 -0.407(0.206) (0.752) (0.660)
Efficiency -0.023* -0.023 -0.010(0.099) (0.163) (0.619)
Non-performing loans 1.440*** 1.634*** 1.858***(0.000) (0.000) (0.000)
Credit lines -0.238** -0.321*** -0.397***(0.011) (0.003) (0.002)
Observations 3,052 2,441 2,329Pseudo R-squared 0.253 0.289 0.292
Robust pval in parentheses. *** p<0.01, ** p<0.05, * p<0.1
32

Table 8: Robustness: Additional Controls
This table shows the results of using a logit regression of bank failure on bank characteristics after controlling for additional
factors. In columns (1)-(2) the additional control variable is equal to each banks’ exposure to non-housing related local economic
factors. We measure non-housing related local shocks as the change in unemployment rate at the county level between 2006
and 2009 that cannot be explained by PTI. Specifically, it is equal to the residuals from an OLS regression of the change in
unemployment rate between 2006-09 on PTI for each year reported in table below (2005 and 2006) in a cross-section of U.S.
counties. We calculate each banks’ exposure to this risk using three years of data on the dollar amounts of loans that are
originated or purchased by that bank and kept (not sold within the year) in each county as weights. The reported values are
the average marginal effects. In columns (3)-(4) the additional control variable is mortgage concentration, and it is the HHI of
mortgages by county at the bank level (see equation 3). The other variable definitions are provided in table 1.
(1) (2) (3) (4)Non-housing local factors Mortgage concentration
VARIABLES 2005 2006 2005 2006
Price-to-income (PTI) 0.001 0.002 0.000 0.001(0.881) (0.725) (0.956) (0.834)
PTI * Traditional home mortgages 0.085*** 0.084*** 0.077*** 0.076***(0.003) (0.004) (0.005) (0.007)
Traditional home mortgages -0.446*** -0.530*** -0.364** -0.445***(0.005) (0.002) (0.022) (0.007)
Home equity loans 0.011 0.341 0.239 0.607***(0.957) (0.121) (0.230) (0.003)
Non-household RE loans 0.196*** 0.151** 0.232*** 0.165***(0.003) (0.015) (0.001) (0.009)
CRE lines of credit 0.515*** 0.858*** 0.556*** 0.921***(0.000) (0.000) (0.000) (0.000)
Equity capital -0.361 -0.568** -0.361 -0.575**(0.124) (0.023) (0.128) (0.023)
Core deposits -0.235*** -0.215*** -0.243*** -0.223***(0.000) (0.000) (0.000) (0.000)
Cash -0.756** -0.421* -0.728** -0.474**(0.011) (0.073) (0.012) (0.048)
Money market 0.248** 0.200* 0.259** 0.214*(0.034) (0.095) (0.021) (0.077)
Illiquid assets 0.100 0.171** 0.079 0.172**(0.162) (0.026) (0.278) (0.024)
Size -0.002 0.006 0.000 0.011**(0.768) (0.275) (0.977) (0.049)
Return on assets 0.530 0.351 0.202 0.333(0.549) (0.634) (0.819) (0.650)
Efficiency -0.033* -0.022 -0.027 -0.024(0.080) (0.199) (0.137) (0.150)
Non-performing loans 0.867** 1.736*** 0.934** 1.677***(0.027) (0.000) (0.015) (0.000)
Credit lines 0.047 -0.224** 0.017 -0.298***(0.559) (0.036) (0.842) (0.006)
Additional Control 0.015*** 0.013*** 0.021 0.040**(0.000) (0.000) (0.276) (0.026)
Observations 2,455 2,488 2,457 2,489Pseudo R-squared 0.276 0.304 0.250 0.289
Robust pval in parentheses. *** p<0.01, ** p<0.05, * p<0.1
33

Table 9: Robustness: Alternative Mortgage Measures
This table shows the results of using a logit regression of bank failure on alternative measures of mortgage
risk. Deviation from 8-year average = PTIt − average(PTIt−7⇒t). Average change in the past five years =
average(∆PTIt,∆PTIt−1,∆PTIt−2,∆PTIt−3,∆PTIt−4). Price-to-rent is a county price-to-rent ratio weighted at the bank
level using three years of data on the dollar amounts of loans that are originated or purchased by that bank and kept (not sold
within the year). The other variable definitions are provided in table 1.
(1) (2) (3) (4)Deviation from Average Change in the Price-to-rent PTI Based on8-year Average Past 5 years ratio Zillow
VARIABLES 2006 2006 2006 2006
Mortgage Risk 0.009 0.051 0.000 0.000(0.446) (0.824) (0.994) (0.923)
Mortgage Risk * Traditional home mortgages 0.186** 2.924* 0.031*** 0.090***(0.019) (0.054) (0.008) (0.001)
Traditional home mortgages -0.263** -0.279** -0.719*** -0.550***(0.015) (0.022) (0.005) (0.002)
Home equity loans 0.603*** 0.601*** 0.537** 0.776***(0.005) (0.006) (0.013) (0.001)
Non-household RE loans 0.189*** 0.198*** 0.180*** 0.208***(0.003) (0.002) (0.005) (0.006)
CRE lines of credit 0.883*** 0.884*** 0.926*** 1.063***(0.000) (0.000) (0.000) (0.000)
Equity capital -0.566** -0.536** -0.569** -0.599**(0.023) (0.030) (0.026) (0.040)
Core deposits -0.235*** -0.244*** -0.238*** -0.257***(0.000) (0.000) (0.000) (0.000)
Cash -0.467* -0.426* -0.429* -0.586**(0.065) (0.089) (0.080) (0.048)
Money market 0.241** 0.251** 0.248** 0.269*(0.048) (0.040) (0.039) (0.059)
Illiquid assets 0.146* 0.143* 0.157** 0.141(0.056) (0.064) (0.042) (0.114)
Size 0.007 0.009* 0.007 0.006(0.203) (0.099) (0.163) (0.309)
Return on assets 0.217 0.163 0.184 1.101(0.772) (0.830) (0.811) (0.211)
Efficiency -0.021 -0.022 -0.023 -0.034*(0.207) (0.192) (0.173) (0.081)
Non-performing loans 1.688*** 1.663*** 1.654*** 1.517***(0.000) (0.000) (0.000) (0.000)
Credit lines -0.279** -0.276** -0.296*** -0.370***(0.012) (0.013) (0.007) (0.003)
Observations 2,489 2,489 2,489 2,090Pseudo R-squared 0.285 0.279 0.284 0.294
Robust pval in parentheses. *** p<0.01, ** p<0.05, * p<0.1
34