Bank anytime, anywhere in the world on WhatsApp
8
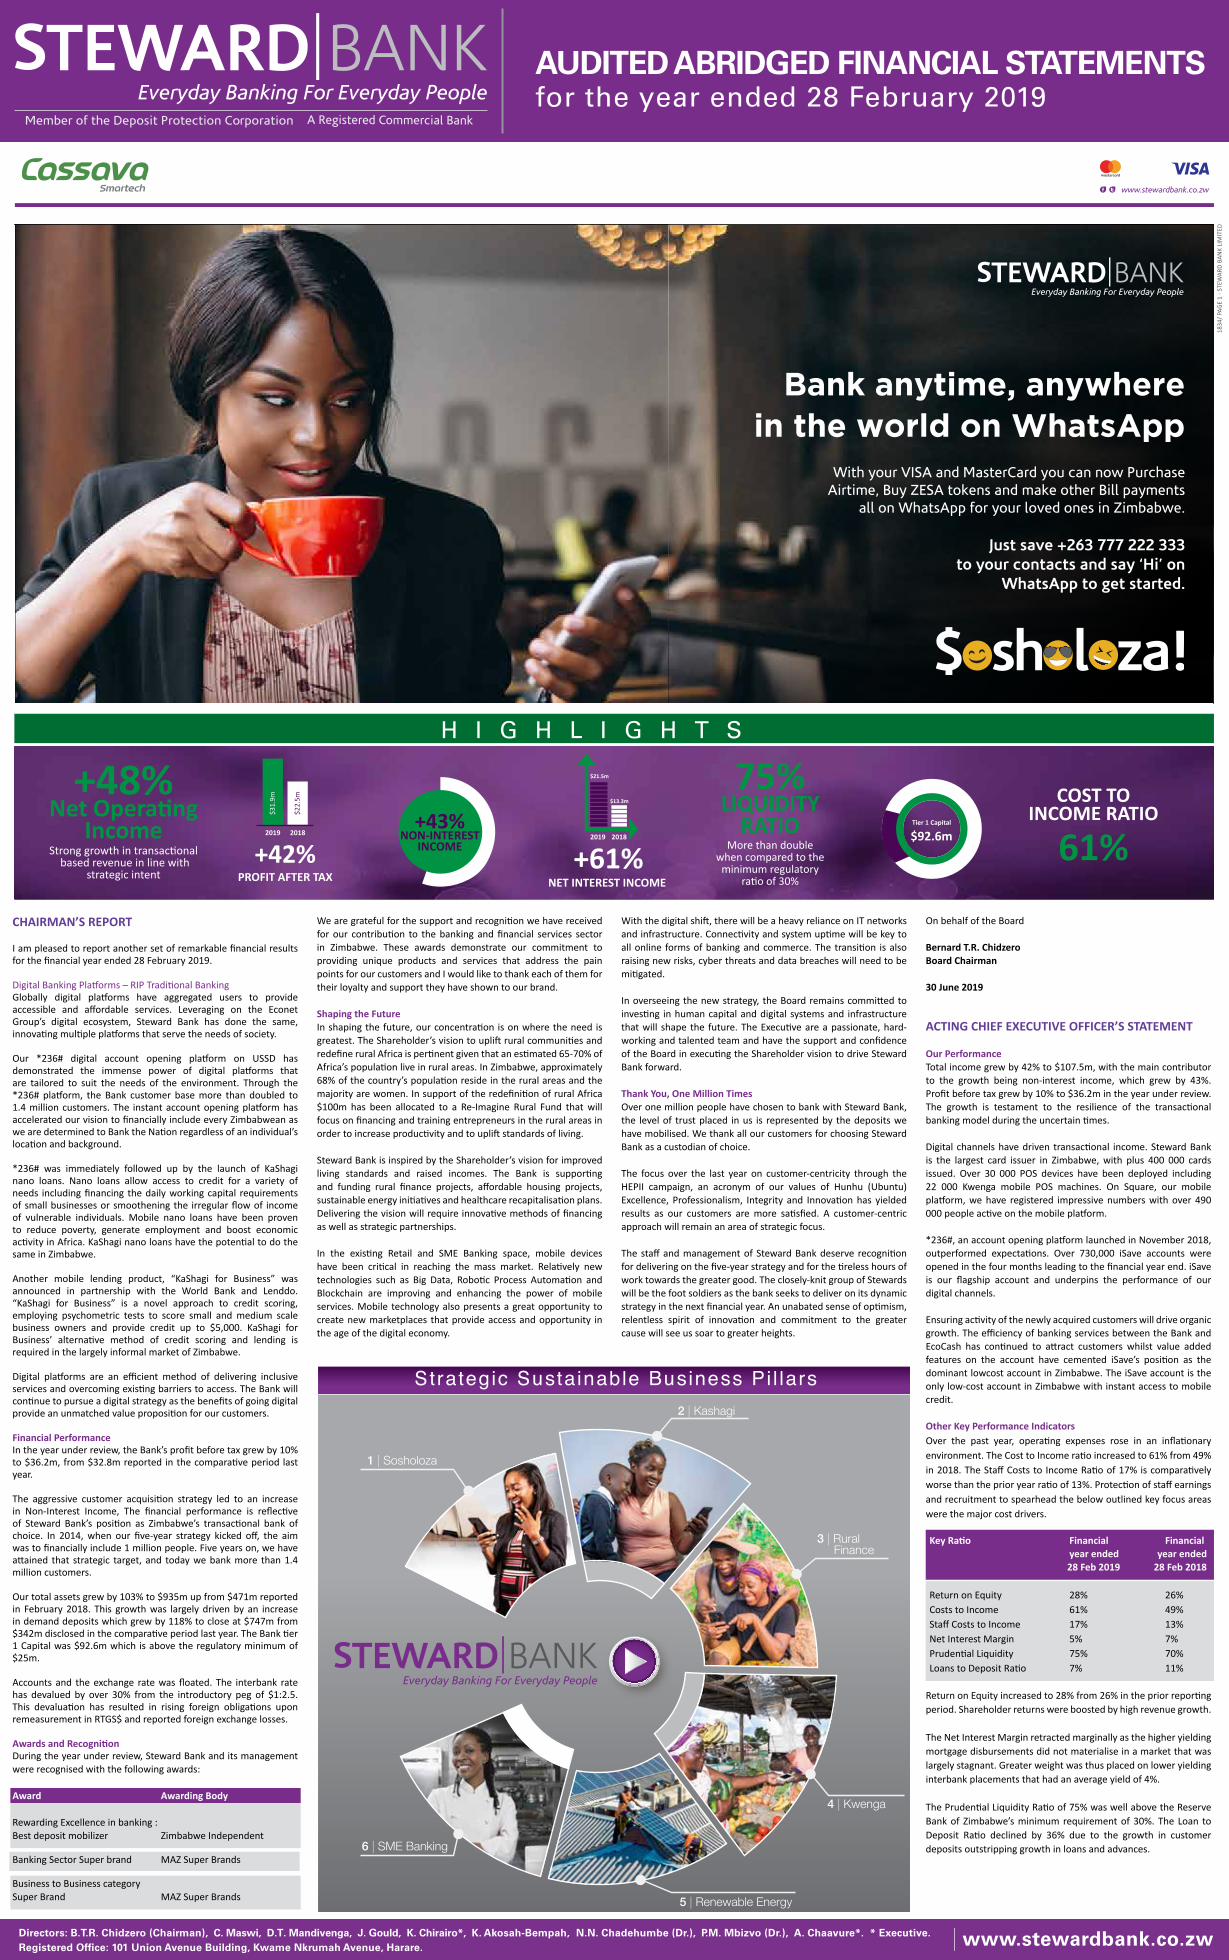
H I G H L I G H T S +43% NON-INTEREST INCOME +48% Net Operang Income Strong growth in transaconal based revenue in line with strategic intent Tier 1 Capital $92.6m COST TO INCOME RATIO 61% 75% LIQUIDITY RATIO More than double when compared to the minimum regulatory rao of 30% +61% NET INTEREST INCOME 2019 $21.5m 2018 +42% PROFIT AFTER TAX 2018 2019 $31.9m $22.5m $13.3m Bank anytime, anywhere in the world on WhatsApp With your VISA and MasterCard you can now Purchase Airtime, Buy ZESA tokens and make other Bill payments all on WhatsApp for your loved ones in Zimbabwe. Just save +263 777 222 333 to your contacts and say ‘Hi’ on WhatsApp to get started. AUDITED ABRIDGED FINANCIAL STATEMENTS for the year ended 28 February 2019 1834/ PAGE 1 - STEWARD BANK LIMITED CHAIRMAN’S REPORT I am pleased to report another set of remarkable financial results for the financial year ended 28 February 2019. Digital Banking Plaorms – RIP Tradional Banking Globally digital plaorms have aggregated users to provide accessible and affordable services. Leveraging on the Econet Group’s digital ecosystem, Steward Bank has done the same, innovang mulple plaorms that serve the needs of society. Our *236# digital account opening plaorm on USSD has demonstrated the immense power of digital plaorms that are tailored to suit the needs of the environment. Through the *236# plaorm, the Bank customer base more than doubled to 1.4 million customers. The instant account opening plaorm has accelerated our vision to financially include every Zimbabwean as we are determined to Bank the Naon regardless of an individual’s locaon and background. *236# was immediately followed up by the launch of KaShagi nano loans. Nano loans allow access to credit for a variety of needs including financing the daily working capital requirements of small businesses or smoothening the irregular flow of income of vulnerable individuals. Mobile nano loans have been proven to reduce poverty, generate employment and boost economic acvity in Africa. KaShagi nano loans have the potenal to do the same in Zimbabwe. Another mobile lending product, “KaShagi for Business” was announced in partnership with the World Bank and Lenddo. “KaShagi for Business” is a novel approach to credit scoring, employing psychometric tests to score small and medium scale business owners and provide credit up to $5,000. KaShagi for Business’ alternave method of credit scoring and lending is required in the largely informal market of Zimbabwe. Digital plaorms are an efficient method of delivering inclusive services and overcoming exisng barriers to access. The Bank will connue to pursue a digital strategy as the benefits of going digital provide an unmatched value proposion for our customers. Financial Performance In the year under review, the Bank’s profit before tax grew by 10% to $36.2m, from $32.8m reported in the comparave period last year. The aggressive customer acquision strategy led to an increase in Non-Interest Income, The financial performance is reflecve of Steward Bank’s posion as Zimbabwe’s transaconal bank of choice. In 2014, when our five-year strategy kicked off, the aim was to financially include 1 million people. Five years on, we have aained that strategic target, and today we bank more than 1.4 million customers. Our total assets grew by 103% to $935m up from $471m reported in February 2018. This growth was largely driven by an increase in demand deposits which grew by 118% to close at $747m from $342m disclosed in the comparave period last year. The Bank er 1 Capital was $92.6m which is above the regulatory minimum of $25m. Accounts and the exchange rate was floated. The interbank rate has devalued by over 30% from the introductory peg of $1:2.5. This devaluaon has resulted in rising foreign obligaons upon remeasurement in RTGS$ and reported foreign exchange losses. Awards and Recognion During the year under review, Steward Bank and its management were recognised with the following awards: Award Awarding Body Rewarding Excellence in banking : Best deposit mobilizer Zimbabwe Independent Banking Sector Super brand MAZ Super Brands Business to Business category Super Brand MAZ Super Brands We are grateful for the support and recognion we have received for our contribuon to the banking and financial services sector in Zimbabwe. These awards demonstrate our commitment to providing unique products and services that address the pain points for our customers and I would like to thank each of them for their loyalty and support they have shown to our brand. Shaping the Future In shaping the future, our concentraon is on where the need is greatest. The Shareholder’s vision to upliſt rural communies and redefine rural Africa is pernent given that an esmated 65-70% of Africa’s populaon live in rural areas. In Zimbabwe, approximately 68% of the country’s populaon reside in the rural areas and the majority are women. In support of the redefinion of rural Africa $100m has been allocated to a Re-Imagine Rural Fund that will focus on financing and training entrepreneurs in the rural areas in order to increase producvity and to upliſt standards of living. Steward Bank is inspired by the Shareholder’s vision for improved living standards and raised incomes. The Bank is supporng and funding rural finance projects, affordable housing projects, sustainable energy iniaves and healthcare recapitalisaon plans. Delivering the vision will require innovave methods of financing as well as strategic partnerships. In the exisng Retail and SME Banking space, mobile devices have been crical in reaching the mass market. Relavely new technologies such as Big Data, Roboc Process Automaon and Blockchain are improving and enhancing the power of mobile services. Mobile technology also presents a great opportunity to create new marketplaces that provide access and opportunity in the age of the digital economy. With the digital shiſt, there will be a heavy reliance on IT networks and infrastructure. Connecvity and system upme will be key to all online forms of banking and commerce. The transion is also raising new risks, cyber threats and data breaches will need to be migated. In overseeing the new strategy, the Board remains commied to invesng in human capital and digital systems and infrastructure that will shape the future. The Execuve are a passionate, hard- working and talented team and have the support and confidence of the Board in execung the Shareholder vision to drive Steward Bank forward. Thank You, One Million Times Over one million people have chosen to bank with Steward Bank, the level of trust placed in us is represented by the deposits we have mobilised. We thank all our customers for choosing Steward Bank as a custodian of choice. The focus over the last year on customer-centricity through the HEPII campaign, an acronym of our values of Hunhu (Ubuntu) Excellence, Professionalism, Integrity and Innovaon has yielded results as our customers are more sasfied. A customer-centric approach will remain an area of strategic focus. The staff and management of Steward Bank deserve recognion for delivering on the five-year strategy and for the reless hours of work towards the greater good. The closely-knit group of Stewards will be the foot soldiers as the bank seeks to deliver on its dynamic strategy in the next financial year. An unabated sense of opmism, relentless spirit of innovaon and commitment to the greater cause will see us soar to greater heights. On behalf of the Board Bernard T.R. Chidzero Board Chairman 30 June 2019 ACTING CHIEF EXECUTIVE OFFICER’S STATEMENT Our Performance Total income grew by 42% to $107.5m, with the main contributor to the growth being non-interest income, which grew by 43%. Profit before tax grew by 10% to $36.2m in the year under review. The growth is testament to the resilience of the transaconal banking model during the uncertain mes. Digital channels have driven transaconal income. Steward Bank is the largest card issuer in Zimbabwe, with plus 400 000 cards issued. Over 30 000 POS devices have been deployed including 22 000 Kwenga mobile POS machines. On Square, our mobile plaorm, we have registered impressive numbers with over 490 000 people acve on the mobile plaorm. *236#, an account opening plaorm launched in November 2018, outperformed expectaons. Over 730,000 iSave accounts were opened in the four months leading to the financial year end. iSave is our flagship account and underpins the performance of our digital channels. Ensuring acvity of the newly acquired customers will drive organic growth. The efficiency of banking services between the Bank and EcoCash has connued to aract customers whilst value added features on the account have cemented iSave’s posion as the dominant lowcost account in Zimbabwe. The iSave account is the only low-cost account in Zimbabwe with instant access to mobile credit. Other Key Performance Indicators Over the past year, operang expenses rose in an inflaonary environment. The Cost to Income rao increased to 61% from 49% in 2018. The Staff Costs to Income Rao of 17% is comparavely worse than the prior year rao of 13%. Protecon of staff earnings and recruitment to spearhead the below outlined key focus areas were the major cost drivers. Key Rao Financial Financial year ended year ended 28 Feb 2019 28 Feb 2018 Return on Equity 28% 26% Costs to Income 61% 49% Staff Costs to Income 17% 13% Net Interest Margin 5% 7% Prudenal Liquidity 75% 70% Loans to Deposit Rao 7% 11% Return on Equity increased to 28% from 26% in the prior reporng period. Shareholder returns were boosted by high revenue growth. The Net Interest Margin retracted marginally as the higher yielding mortgage disbursements did not materialise in a market that was largely stagnant. Greater weight was thus placed on lower yielding interbank placements that had an average yield of 4%. The Prudenal Liquidity Rao of 75% was well above the Reserve Bank of Zimbabwe’s minimum requirement of 30%. The Loan to Deposit Rao declined by 36% due to the growth in customer deposits outstripping growth in loans and advances. 1 ǀ Sosholoza 6 ǀ SME Banking 2 ǀ Kashagi 4 ǀ Kwenga 5 ǀ Renewable Energy 3 ǀ Rural Finance www.stewardbank.co.zw Directors: B.T.R. Chidzero (Chairman), C. Maswi, D.T. Mandivenga, J. Gould, K. Chirairo*, K. Akosah-Bempah, N.N. Chadehumbe (Dr.), P.M. Mbizvo (Dr.), A. Chaavure*. * Executive. Registered Office: 101 Union Avenue Building, Kwame Nkrumah Avenue, Harare.
Transcript of Bank anytime, anywhere in the world on WhatsApp
H I G H L I G H T S
+43%NON-INTEREST
INCOME
+48%Net Operating
IncomeStrong growth in transactional
based revenue in line withstrategic intent
Tier 1 Capital
$92.6m
COST TOINCOME RATIO
61%
75%LIQUIDITY
RATIOMore than double
when compared to theminimum regulatory
ratio of 30%+61%
NET INTEREST INCOME
2019
$21.5m
2018
+42%PROFIT AFTER TAX
20182019
$31.
9m
$22.
5m $13.3m
Bank anytime, anywherein the world on WhatsApp
With your VISA and MasterCard you can now PurchaseAirtime, Buy ZESA tokens and make other Bill payments
all on WhatsApp for your loved ones in Zimbabwe.
Just save +263 777 222 333to your contacts and say ‘Hi’ on
WhatsApp to get started.
AUDITED ABRIDGED FINANCIAL STATEMENTSfor the year ended 28 February 2019
1834
/ PAG
E 1
- STE
WAR
D BA
NK
LIM
ITED
CHAIRMAN’S REPORT
I am pleased to report another set of remarkable financial results for the financial year ended 28 February 2019.
Digital Banking Platforms – RIP Traditional BankingGlobally digital platforms have aggregated users to provide accessible and affordable services. Leveraging on the Econet Group’s digital ecosystem, Steward Bank has done the same, innovating multiple platforms that serve the needs of society.
Our *236# digital account opening platform on USSD has demonstrated the immense power of digital platforms that are tailored to suit the needs of the environment. Through the *236# platform, the Bank customer base more than doubled to 1.4 million customers. The instant account opening platform has accelerated our vision to financially include every Zimbabwean as we are determined to Bank the Nation regardless of an individual’s location and background.
*236# was immediately followed up by the launch of KaShagi nano loans. Nano loans allow access to credit for a variety of needs including financing the daily working capital requirements of small businesses or smoothening the irregular flow of income of vulnerable individuals. Mobile nano loans have been proven to reduce poverty, generate employment and boost economic activity in Africa. KaShagi nano loans have the potential to do the same in Zimbabwe.
Another mobile lending product, “KaShagi for Business” was announced in partnership with the World Bank and Lenddo. “KaShagi for Business” is a novel approach to credit scoring, employing psychometric tests to score small and medium scale business owners and provide credit up to $5,000. KaShagi for Business’ alternative method of credit scoring and lending is required in the largely informal market of Zimbabwe.
Digital platforms are an efficient method of delivering inclusive services and overcoming existing barriers to access. The Bank will continue to pursue a digital strategy as the benefits of going digital provide an unmatched value proposition for our customers.
Financial PerformanceIn the year under review, the Bank’s profit before tax grew by 10% to $36.2m, from $32.8m reported in the comparative period last year.
The aggressive customer acquisition strategy led to an increase in Non-Interest Income, The financial performance is reflective of Steward Bank’s position as Zimbabwe’s transactional bank of choice. In 2014, when our five-year strategy kicked off, the aim was to financially include 1 million people. Five years on, we have attained that strategic target, and today we bank more than 1.4 million customers.
Our total assets grew by 103% to $935m up from $471m reported in February 2018. This growth was largely driven by an increase in demand deposits which grew by 118% to close at $747m from $342m disclosed in the comparative period last year. The Bank tier 1 Capital was $92.6m which is above the regulatory minimum of $25m.
Accounts and the exchange rate was floated. The interbank rate has devalued by over 30% from the introductory peg of $1:2.5. This devaluation has resulted in rising foreign obligations upon remeasurement in RTGS$ and reported foreign exchange losses.
Awards and RecognitionDuring the year under review, Steward Bank and its management were recognised with the following awards:
Award Awarding Body
Rewarding Excellence in banking :Best deposit mobilizer Zimbabwe Independent Banking Sector Super brand MAZ Super Brands
Business to Business category Super Brand MAZ Super Brands
We are grateful for the support and recognition we have received for our contribution to the banking and financial services sector in Zimbabwe. These awards demonstrate our commitment to providing unique products and services that address the pain points for our customers and I would like to thank each of them for their loyalty and support they have shown to our brand.
Shaping the FutureIn shaping the future, our concentration is on where the need is greatest. The Shareholder’s vision to uplift rural communities and redefine rural Africa is pertinent given that an estimated 65-70% of Africa’s population live in rural areas. In Zimbabwe, approximately 68% of the country’s population reside in the rural areas and the majority are women. In support of the redefinition of rural Africa $100m has been allocated to a Re-Imagine Rural Fund that will focus on financing and training entrepreneurs in the rural areas in order to increase productivity and to uplift standards of living.
Steward Bank is inspired by the Shareholder’s vision for improved living standards and raised incomes. The Bank is supporting and funding rural finance projects, affordable housing projects, sustainable energy initiatives and healthcare recapitalisation plans. Delivering the vision will require innovative methods of financing as well as strategic partnerships.
In the existing Retail and SME Banking space, mobile devices have been critical in reaching the mass market. Relatively new technologies such as Big Data, Robotic Process Automation and Blockchain are improving and enhancing the power of mobile services. Mobile technology also presents a great opportunity to create new marketplaces that provide access and opportunity in the age of the digital economy.
With the digital shift, there will be a heavy reliance on IT networks and infrastructure. Connectivity and system uptime will be key to all online forms of banking and commerce. The transition is also raising new risks, cyber threats and data breaches will need to be mitigated.
In overseeing the new strategy, the Board remains committed to investing in human capital and digital systems and infrastructure that will shape the future. The Executive are a passionate, hard-working and talented team and have the support and confidence of the Board in executing the Shareholder vision to drive Steward Bank forward.
Thank You, One Million TimesOver one million people have chosen to bank with Steward Bank, the level of trust placed in us is represented by the deposits we have mobilised. We thank all our customers for choosing Steward Bank as a custodian of choice.
The focus over the last year on customer-centricity through the HEPII campaign, an acronym of our values of Hunhu (Ubuntu) Excellence, Professionalism, Integrity and Innovation has yielded results as our customers are more satisfied. A customer-centric approach will remain an area of strategic focus.
The staff and management of Steward Bank deserve recognition for delivering on the five-year strategy and for the tireless hours of work towards the greater good. The closely-knit group of Stewards will be the foot soldiers as the bank seeks to deliver on its dynamic strategy in the next financial year. An unabated sense of optimism, relentless spirit of innovation and commitment to the greater cause will see us soar to greater heights.
On behalf of the Board
Bernard T.R. ChidzeroBoard Chairman
30 June 2019
ACTING CHIEF EXECUTIVE OFFICER’S STATEMENT
Our PerformanceTotal income grew by 42% to $107.5m, with the main contributor to the growth being non-interest income, which grew by 43%. Profit before tax grew by 10% to $36.2m in the year under review. The growth is testament to the resilience of the transactional banking model during the uncertain times.
Digital channels have driven transactional income. Steward Bank is the largest card issuer in Zimbabwe, with plus 400 000 cards issued. Over 30 000 POS devices have been deployed including 22 000 Kwenga mobile POS machines. On Square, our mobile platform, we have registered impressive numbers with over 490 000 people active on the mobile platform.
*236#, an account opening platform launched in November 2018, outperformed expectations. Over 730,000 iSave accounts were opened in the four months leading to the financial year end. iSave is our flagship account and underpins the performance of our digital channels.
Ensuring activity of the newly acquired customers will drive organic growth. The efficiency of banking services between the Bank and EcoCash has continued to attract customers whilst value added features on the account have cemented iSave’s position as the dominant lowcost account in Zimbabwe. The iSave account is the only low-cost account in Zimbabwe with instant access to mobile credit.
Other Key Performance IndicatorsOver the past year, operating expenses rose in an inflationary environment. The Cost to Income ratio increased to 61% from 49% in 2018. The Staff Costs to Income Ratio of 17% is comparatively worse than the prior year ratio of 13%. Protection of staff earnings and recruitment to spearhead the below outlined key focus areas were the major cost drivers.
Key Ratio Financial Financial year ended year ended 28 Feb 2019 28 Feb 2018
Return on Equity 28% 26%Costs to Income 61% 49%Staff Costs to Income 17% 13%Net Interest Margin 5% 7%Prudential Liquidity 75% 70%Loans to Deposit Ratio 7% 11%
Return on Equity increased to 28% from 26% in the prior reporting period. Shareholder returns were boosted by high revenue growth.
The Net Interest Margin retracted marginally as the higher yielding mortgage disbursements did not materialise in a market that was largely stagnant. Greater weight was thus placed on lower yielding interbank placements that had an average yield of 4%.
The Prudential Liquidity Ratio of 75% was well above the Reserve Bank of Zimbabwe’s minimum requirement of 30%. The Loan to Deposit Ratio declined by 36% due to the growth in customer deposits outstripping growth in loans and advances.
1 ǀ Sosholoza
6 ǀ SME Banking
2 ǀ Kashagi
4 ǀ Kwenga
5 ǀ Renewable Energy
3 ǀ Rural Finance
www.stewardbank.co.zwDirectors: B.T.R. Chidzero (Chairman), C. Maswi, D.T. Mandivenga, J. Gould, K. Chirairo*, K. Akosah-Bempah, N.N. Chadehumbe (Dr.), P.M. Mbizvo (Dr.), A. Chaavure*. * Executive. Registered Office: 101 Union Avenue Building, Kwame Nkrumah Avenue, Harare.

AUDITED ABRIDGED FINANCIAL STATEMENTSfor the year ended 28 February 2019
1834
/ PAG
E 2
- STE
WAR
D BA
NK
LIM
ITEDACTING CHIEF EXECUTIVE OFFICER’S STATEMENT (CONTINUED)
Key Focus Areas
• Sustainable Finance Funds have been allocated for Rural Finance, Healthcare, Energy and Housing. The drive
for financial inclusion and sustainable development is a key part of the Bank’s strategy going forward. Over $300m dollars is to be invested in these sectors in the coming financial year.
The $100m Rural Finance Fund aims to empower entrepreneurs who add value to production processes, diversify opportunities and innovate. From experience, financing of rural projects has yielded adequate returns.
The investment in entrepreneurial people will be supported by development of sustainable infrastructure that results in improved living standards.
This holistic approach to banking is the Shareholder’s vision and is unique to Steward Bank. We believe in doing well, by doing good.
• Digitisation
Crowdfunding: Kanzatu-nzatu “Kanzatu-nzatu” was the first digital platform to be launched in 2018. The crowdfunding
platform allows Zimbabweans to raise funds through setting up an account and sharing a link to contacts to deposit funds. Besides mobilising resources for the National Cholera campaign, Zimbabweans have joined hands to raise funds for friends and family for weddings, medical procedures, university fees and church events.
USSD Digital Account Opening: *236# Following the launch of Kanzatu-Nzatu, *236# was launched. The *236# platform
enables digital iSave account opening and Dura Lite foreign currency account opening. After dialing the USSD code, a customer’s e-KYC is retrieved from Econet and used as the identifier to open the low-KYC account.
• Nano Loans: KaShagi KaShagi nano loans were also launched on the *236# platform. The loans model Econet
Group data and leverage on Big Data and Machine Learning to assign credit scores and determine eligibility for the mobile loan.
Over RTGS$6m has been dispersed on *236#, with an average value of $30 disbursed on the platform.
• Customer-Centric Customer-centric service remains a key focus area, even more so because of the rapid
growth in customer base and rate of product deployment at the Bank. The Bank’s HEPII values (Hunhu/Ubuntu, Excellence, Professionalism, Innovation, Integrity) reinforce the need to ingrain a service-driven culture.
Customer feedback is welcomed as we seek to provide a world class experience. Stewards that demonstrate a customer-centric attitude are being rewarded for doing so as this advances the Mission of the organization.
RewritingtheScriptLooking back, five years ago, Steward Bank focused on and sought to disrupt the traditional banking model in Zimbabwe. We have executed on this by meeting the needs and wants of the mass market.
Looking ahead, Steward Bank is rewriting the script of what it means to bank in Zimbabwe. Digital transformation will be central to delivering mass market value.
For our other business segments a blend of innovative financing mechanisms and convenient platforms are being developed as we position ourselves to provide valuable services to key stakeholders in the economy.
Head Bowed The Steward Bank team has been extraordinary in attitude and approach over the past year. Thank you to the team for being available for work and retaining high levels of energy and drive in pursuit of our common goals and objectives. I am heartened by your never say die mentality and good humoured nature in light of the most difficult situations. The culture of innovation that has permeated our organisation is our competitive advantage and the reason why we are the dominant market player.
Also, a thank you to our Board Chairman, the Board of Directors and the Executive Team for the support and commitment over the past year. Lastly, I express sincere gratitude to all of our stakeholders, in particular, our Shareholder who challenged us to change the face of banking in Zimbabwe. We shall continuously aim to redefine banking.
Krison V. ChirairoActingChiefExecutiveOfficer
30 June 2019
CORPORATE GOVERNANCE STATEMENT (CONTINUED)
BoardandDirectorEvaluationProcessThe institution carries out an annual Board and Director Evaluation process in line with the Reserve Bank of Zimbabwe’s Board and Director Evaluation Framework for Financial Institutions. This entails the Board members critically evaluating and reviewing each other as members and collectively as a Board. The key factors considered are the functions of the board, strategy, board structure and effectiveness. The results of the prior year are used to identify any gaps and these are addressed through specific action plans.
The Board and Director evaluations for the year ended 28 February 2019 were duly and timeously conducted.
BoardCompositionAs at 28 February 2019, the Bank’s Board comprised of eight (8) non-Executive directors and two (2) Executive directors. The majority of the Board members are independent non-Executive Directors. The Board considers that its membership should reflect an appropriate balance between executives possessing extensive direct experience and expertise in the core business activities of the Bank and non-executive members who bring to the Board a broad range of general commercial expertise and experience. The Board has an appropriate balance of skills, experience and expertise to enable it to discharge its responsibilities.
During the year, the Bank continued to expand its strategy with strong focus on digital technology. The Chief Technology Officer provides guidance and assists the Board on both strategy and implementation in this emerging area
Mrs. Tracy Mpofu resigned as a non-Executive Director of the Bank effective 11th of December 2018 after serving for over six (6) years. The Board acknowledges her immense contribution and extends its appreciation for the service rendered.
Dr. Lance Mambondiani resigned as Chief Executive Officer and Executive Director of the Bank effective 31 May 2019 after serving at the helm for 4 years. The Board acknowledges his service in leading the digital transformation of Steward Bank.
BoardCommitteesThe Board has established and delegated specific roles and responsibilities to standing Committees, to assist it in discharging its mandate. Members of the Executive Committee and other management attend meetings of the various committees by invitation. Each Committee acts within written terms of reference approved by the Board and reviewed at least annually. All Board Committees are chaired by Independent non-Executive Chairpersons.
The Chair of each Committee (or a person nominated by the Chair of the Committee for that purpose), reports to the Board at the Board’s next meeting on any matters relevant to the Committee’s duties and responsibilities.
To assist the Board in the discharge of its responsibilities, the following standing Committees have been established namely:i. Board Audit Committee; ii. Board Risk, Compliance and Capital Management Committee; iii. Board Asset and Liability Committee; iv. Board Credit Committee; v. Board Human Resources and Nominations Committee; and vi. Board IT Committee.
AuditCommitteeThe Audit Committee consists of three independent non-executive directors of the Bank. The Committee’s primary functions are to assist the Board in its evaluation and review of the adequacy and efficiency of the internal control systems, accounting practices, information systems and audit processes applied within the Bank. As appropriate, the Committee makes recommendations to the Board regarding the financial administration of the Bank. External Auditors are invited to attend all meetings. The Audit Committee met four times in the year under review.
Risk,ComplianceandCapitalManagementCommitteeThis Committee, which comprises 3 non-executive directors, sets policy guidelines for monitoring risks that are inherent within the Bank and reviews all risk reports generated by the Risk Department. The Committee also sets policy guidelines for ensuring and monitoring compliance with all regulatory laws and directives and internal policies and procedures. The Risk, Compliance and Capital Management Committee met four times during the year.
BoardAssetandLiabilitiesCommitteeThis Committee comprises 3 non-executive directors and is responsible for formulating policies and procedures relating to control of cash flow, control of short-term borrowing capacity, management of liquid assets portfolio, monitoring and managing structural exposures to changes in foreign exchange rates. The Committee also reviews the Bank’s balance sheet and recommends the optimal asset and liability mix for the Bank. The Committee met four times during the year.
BoardCreditCommitteeThis Committee comprises 3 non-executive directors and is mainly responsible for overseeing the Bank’s operations related to credit, market and liquidity risk. The Committee also approves all lending in line with set thresholds and ensures that approved policies are adequate and that lending activities are conducted in accordance with established procedures. The Board Credit Committee met four times during the year.
BoardITCommitteeThis Committee comprises 3 non-executive directors and meets quarterly and formulates policies and strategic issues relating to information and communication technology. It monitors and reviews implementation of the information technology projects, funding allocation and performance reporting. The Committee makes recommendations to the Board with respect to the overall scope of the digital strategy. It provides the necessary governance over the direction and ongoing progress of the digital strategy to ensure continued growth, consistent with the Bank’s vision and values.
Remuneration&NominationsCommitteeThis Committee, which comprises 3 non-executive directors meets quarterly and reviews matters relating to the formulation and approval of strategies and policies relating to conditions of service and remuneration of the Bank’s staff. The Committee also serves as a Nominations Committee. The Committee met four times during the year.
BoardCapacityDevelopmentThe Bank has in place a Board Training and Development Plan designed to enable the Directors to gain an appreciation of Steward Bank’s strategic, financial, operational and risk management structures. During the year, Board members attended IFRS 9 Training as well as Risk and IT Governance Training.
ComplianceThe Bank complied with the applicable laws and regulations governing its activities throughout the reporting period.
The Bank’s Liquidity Ratio stood at 71.83% as at 28 February 2019 against the minimum prescribed ratio of 30%.
The audited Financial Statements for the year ended 28 February 2019 were approved at a meeting held on 25 April 2019.
BoardattendanceAs at 28 February 2019, the Main Board held four (4) meetings to assess risk, review performance and provide guidance to management.
CORPORATE GOVERNANCE STATEMENT
Steward Bank is committed to ensuring that it has effective corporate governance structures in place as this is critical in safeguarding stakeholders’ interests and improving the performance of the Bank. This is in line with the Zimbabwe Corporate Governance Code, the Reserve Bank of Zimbabwe Corporate Governance Guidelines No. 01 – 2004/BSD and the banking industry regulatory framework. The Board leads the organization in ensuring the existence of sound corporate governance principles and values at all material times.
The Board of DirectorsThe role of the Board includes, inter alia, the approval and adoption of the strategic and annual business plans, setting up of objectives, review of key risk and performance areas, review of management’s performance against set criteria and objectives and determining the overall policies and processes to ensure the integrity of the institution’s risk and internal control management.
The Board regularly reviews its structures and policies to ensure continued adherence to the governing instruments and international best practice.
The Board of Directors is committed to upholding the highest standards of corporate governance by ensuring that business is conducted in a transparent, responsible and accountable manner as enshrined in the international and local corporate governance frameworks.
Directors have unrestricted access to Management and Directors are free to take independent professional advice, at the Bank’s expense, in furtherance of their duties.
Directors are required to take all reasonable steps to avoid actual, potential or perceived conflicts of interests. Directors are required to disclose any conflicts and abstain from participating in any discussion or voting on matter in which they have a material interest.
www.stewardbank.co.zwDirectors: B.T.R. Chidzero (Chairman), C. Maswi, D.T. Mandivenga, J. Gould, K. Chirairo*, K. Akosah-Bempah, N.N. Chadehumbe (Dr.), P.M. Mbizvo (Dr.), A. Chaavure*. * Executive. Registered Office: 101 Union Avenue Building, Kwame Nkrumah Avenue, Harare.

Make cashless transactions on the go with VisaSimply pre-fund your Visa card before you leave and swipe anywhere in the world. No bank account required. Visit any of our branches and we will hook you up.
#Globetrotter
AUDITED ABRIDGED FINANCIAL STATEMENTSfor the year ended 28 February 2019
AUDITOR’S STATEMENT
These abridged financial results should be read in conjunction with the full set of financial statements for the year ended 28 February 2019, which have been audited by Deloitte & Touche and a qualified opinion issued thereon. The basis for the qualified opinion pertains to non- compliance with International Accounting Standard 21 “The Effects of Changes in Foreign Exchange Rates” as well as the valuation of property, plant and equipment and intangible assets. In addition, the auditor’s report carries key audit matters (“KAMs”) outlining areas of the audit process that required significant attention of the auditor. The KAMs relate to valuation of expected credit losses on financial assets and existence and valuation of suspense accounts. The auditor’s report on these financial statements is available for inspection at the Bank’s registered office.
Deloitte&ToucheHarare, Zimbabwe
STATEMENT OF PROFIT OR LOSS AND OTHER COMPREHENSIVE INCOMEFor the year ended 28 February 2019
Notes
Audited28 February
2019RTGS$
Audited 28 February
2018RTGS$
Interest and related income 4 24,851,945 13,538,790 Interest and related expense 5 (3,391,271) (242,223)
Net interest income 21,460,674 13,296,567
Non-interest income 6 90,269,612 63,065,080
Impairment on financial assets charge:Expected credit loss allowances 7 (7,403,789) - Incurred credit loss allowances - (6,094,134)
Netoperatingincome 104,326,497 70,267,513
Operating expenditure 8 (68,134,488) (37,550,608)
Profitbeforetax 36,192,009 32,716,905
Income tax expense 9 (4,247,261) (10,262,657)
Profitfortheyear 31,944,748 22,454,248
Othercomprehensiveincome
Other comprehensive income not to be reclassified to profit or loss in subsequent periods:Gain arising on revaluation of property and equipment, and intangible assets, net of tax 22,936,568 22,049
Totalcomprehensiveincomefortheyear 54,881,316 22,476,297
STATEMENT OF CHANGES IN EQUITYFor the year ended 28 February 2019
SharecapitalRTGS$
Sharepremium
RTGS$
Otherreserves
RTGS$
Retained earnings/
(Accumulated)loss
RTGS$Total
RTGS$
Balance at 28 February 2017 4,077 106,317,629 3,899,036 (35,174,158) 75,046,584
Total comprehensive income - - 22,049 22,454,248 22,476,297 Profit for the year - - - 22,454,248 22,454,248 Other comprehensive income - - 22,049 - 22,049
Restatement of Other Reserves due to prior period Basel II excess over IAS 39 specific provision - - (510,353) - (510,353)
Balance at 28 February 2018 4,077 106,317,629 3,410,732 (12,719,910) 97,012,528 Adjustment on initial applica-tion of IFRS 9, net of tax - - (3,388,683) (2,976,831) (6,365,514)Restated balance as at 1 March 2018 under IFRS 9 4,077 106,317,629 22,049 (15,696,741) 90,647,014
Total comprehensive income - - 22,936,568 31,944,748 54,881,316 Profit for the year - - - 31,944,748 31,944,748 Other comprehensive income 22,936,568 - 22,936,568
Dividends paid - - - (10,000,000) (10,000,000)
Balance at 28 February 2019 4,077 106,317,629 22,958,617 6,248,007 135,528,330
STATEMENT OF CASH FLOWSFor the year ended 28 February 2019
Audited28 February
2019RTGS$
Audited 28 February
2018RTGS$
CASH FLOWS FROM OPERATING ACTIVITIES
Profit before tax 36,192,009 32,716,905
Adjustments for:
Change in operating assets (285,287,011) (191,017,334)Change in operating liabilities 439,780,952 209,506,298 Other non-cash items (1,095,820) 7,848,709
Netcashgeneratedfromoperations 189,590,130 59,054,578
Taxation paid (8,548,075) -
Netcashinflowfromoperatingactivities 181,042,055 59,054,578
CASH FLOWS FROM INVESTING ACTIVITIES
Purchase of property and equipment (9,306,363) (7,553,377)Purchase of intangible assets (2,305,848) (873,550)Proceeds from disposal of non-current assets held for sale 130,000 -
Netcashoutflowfrominvestingactivities (11,482,211) (8,426,927)
CASH FLOWS FROM FINANCING ACTIVITIES
Dividends paid (10,000,000) - Net increase in loans and borrowings 478,874 1,491,125
Netcash(outflow)/inflowfromfinancingactivities (9,521,126) 1,491,125
Net increase in cash and cash equivalents 160,038,718 52,118,776
Cash and cash equivalents at the beginning of the year 116,073,355 63,954,579
Cashandcashequivalentsattheendoftheyear 276,112,073 116,073,355
NOTES TO THE ABRIDGED FINANCIAL STATEMENTSFor the year ended 28 February 2019
1 GENERAL INFORMATION Steward Bank Limited (“the Bank”) was incorporated according to the laws of
Zimbabwe on 9 October 1970 and was registered as a commercial bank in March 2008. Its registered office and principal place of business is 101 Union Avenue Building, 101 Kwame Nkrumah Avenue, Harare. The Bank’s ultimate holding company is Cassava SmarTech Zimbabwe Limited.
The principal business of the Bank is to provide retail and corporate banking services in the key economic centres of Zimbabwe.
FunctionalandPresentationCurrency In previous financial reporting periods, the Bank adopted the United States dollar
(US$) as the functional currency of the primary economic environment in which the Bank operated and as the Bank’s presentation currency. On 20 February 2019, the Reserve Bank of Zimbabwe, in its Monetary Policy Statement announced the introduction of a new currency denoted as the “RTGS dollar” (RTGS$), which was indicated as comprising of existing RTGS balances, bond notes and coins in circulation. Subsequent to this, on 22 February 2019, Statutory Instrument 33 of 2019 (SI 33 of 2019) was issued and prescribed that for accounting and other purposes, all assets and liabilities that were expressed in United States dollars, immediately before the effective date of the Statutory Instrument, would be deemed to be valued in RTGS dollars, commencing from the effective date.
Following the pronouncement of the new regulations, the Bank made a significant judgement to change its functional and presentation currency from US$ to RTGS$ with effect from the effective date of SI 33 of 2019.
CORPORATE GOVERNANCE STATEMENT (CONTINUED)
DirectorsAttendanceatBoardandCommitteemeetingsasat28February2019
Name of Director Designation Main Board Credit
Risk Compliance &Capital
Management Audit IT ALCO
Remuneration&NominationsCommittee
Actual Attended Actual Attended Actual Attended Actual Attended Actual Attended Actual Attended Actual Attended
B T R Chidzero Independent Non-Executive Chairman
√√√√ √√√√ √√√√ √√√√ N/A N/A N/A N/A N/A N/A N/A N/A √√√√ √√√√
P M Mbizvo Non-Executive Director √√√√ √√√√ N/A N/A √√√√ √√√√ N/A N/A N/A N/A √√√√ √√√√ √√√√ √√√√C Maswi Non-Executive Director √√√√ √√√√ N/A N/A N/A N/A √√√√ √√√√ *√√√√ √√√ *√√√√ √√√√ N/A N/AT Mpofu Non-Executive Director √√√ √√√ N/A N/A √√√ √√√ N/A N/A N/A N/A √√√ √√√ N/A N/AK Akosah-Bempah Non-Executive Director √√√√ √√√√ N/A N/A N/A N/A √√√√ √√√√ N/A N/A √√√√ √√√√ N/A N/AJ H Gould Non-Executive Director √√√√ √√√√ √√√√ √√√√ N/A N/A N/A N/A √√√√ √√√√ N/A N/A √√√√ √√√N N. Chadehumbe Non-Executive Director √√√√ √√√√ N/A N/A √√√√ √√√√ √√√√ √√√√ √√√√ √√√√ N/A N/A N/A N/AK V Chirairo Non-Executive Director √√√√ √√√√ √√√√ √√√√ N/A N/A N/A N/A N/A N/A N/A N/A N/A N/AD T Mandivenga Non-Executive Director √√√√ **√√ N/A N/A √√√√ **√ N/A N/A √√√√ **√ N/A N/A N/A N/AL S Mambondiani Executive Director √√√√ √√√√ √√√√ √√√√ √√√√ √√√√ √√√√ √√√√ √√√√ √√√√ √√√√ √√√√ √√√√ √√√√A Chaavure Executive Director √√√√ √√√√ √√√√ √√√√ √√√√ √√√√ √√√√ √√√√ √√√√ √√√√ √√√√ √√√√ √√√√ √√√√
NB: N/A is not a member of the committeeNB: * Mr. Maswi was appointed Chairman of IT Committee effective June 2018 NB: **Mr. Mandivenga was appointed as a Director effective 3 October 2018
NB. Mrs. T Mpofu resigned effective 11 December 2018
STATEMENT OF FINANCIAL POSITIONAs at 28 February 2019
Notes
Audited28 February
2019RTGS$
Audited 28 February
2018RTGS$
ASSETS
Cash and cash equivalents 10 276,112,073 116,073,355
Financial assets at fair value through profit or loss 11 7,668,775 852,284
Loans and advances to customers 12 55,046,211 32,824,221
Debt instruments measured at amortised cost 13 465,684,061 -
Financial assets held-to-maturity 14 - 250,276,433
Other receivables 15 60,477,079 36,753,817
Inventories 16 5,931,764 -
Non-current assets held for sale - 130,000
Investment property 17 13,593,500 5,437,400
Property and equipment 18 35,885,761 11,656,981
Intangible assets 19 20,466,784 6,639,839
Deferred tax asset 27 - 65,879
Total assets 940,866,008 460,710,209
EQUITY AND LIABILITIES
EQUITY
Share capital 20 4,077 4,077
Share premium 20 106,317,629 106,317,629
Other reserves 21 22,958,617 3,410,732
Retained earnings/(accumulated loss) 6,248,007 (12,719,910)
Total equity 135,528,330 97,012,528
LIABILITIES
Deposits due to banks and customers 22 751,329,509 348,164,949
Loans and borrowings 23 2,250,000 1,771,125
Provisions 25 1,161,544 1,389,741
Other liabilities 26 46,967,986 12,371,866
Deferred tax liability 27 3,628,639 -
Totalliabilities 805,337,678 363,697,681
Totalequityandliabilities 940,866,008 460,710,209
Make cashless transactions on the go with VisaSimply pre-fund your Visa card before you leave and swipe anywhere in the world. No bank account required. Visit any of our branches and we will hook you up.
#Globetrotter
1834
/ PAG
E 3
- STE
WAR
D BA
NK
LIM
ITED
www.stewardbank.co.zwDirectors: B.T.R. Chidzero (Chairman), C. Maswi, D.T. Mandivenga, J. Gould, K. Chirairo*, K. Akosah-Bempah, N.N. Chadehumbe (Dr.), P.M. Mbizvo (Dr.), A. Chaavure*. * Executive. Registered Office: 101 Union Avenue Building, Kwame Nkrumah Avenue, Harare.
3
Rural FinanceTransforming Africa through Rural Financial inclusion.
4
KwengaOffering a mobile POS paymentsolution for every business.
AUDITED ABRIDGED FINANCIAL STATEMENTSfor the year ended 28 February 2019
NOTES TO THE ABRIDGED FINANCIAL STATEMENTSFor the year ended 28 February 2019
2 Basisofpreparation
2.1 Statement of compliance The Bank’s audited, abridged financial statements for the year ended 28 February 2019 have been prepared in accordance with the requirements of International Financial Reporting Standards (IFRS) and interpretations as issued by the International Accounting Standards Board, the Banking Act of Zimbabwe (Chapter 24:20), the Companies Act of Zimbabwe (Chapter 24:03) and the relevant Statutory Instruments (“SI”); SI 62/96 and SI 33/99.
The financial statements have been prepared on the going concern basis, which the Directors believe to be appropriate.
2.2 Changesinaccountingpoliciesanddisclosures In the the preparation of these financial statements, the Bank has for the first time
applied IFRS 9 Financial Instruments (“IFRS 9”) and the updated IFRS 7 Financial Instruments: Disclosures (“IFRS 7R”), effective for annual periods beginning on or after 1 January 2018. The Bank has not early adopted any other standard, interpretation or amendment that has been issued but is not yet effective.
2.2.1. IFRS 9 Financial Instruments IFRS 9 replaces IAS 39 for annual periods on or after 1 January 2018. The Bank elected,
as permitted by IFRS 9, not to restate comparative information for 28 February 2018 financial instruments in the scope of IFRS 9. Therefore, the comparative information is reported under IAS 39 and is not comparable to the information presented for the year ended 28 February 2019. Differences arising from the adoption of IFRS 9 have been recognised directly in retained earnings as of 1 March 2018 and a disclosed in Note 3.
Changes to Classification and Measurement To determine their classification and measurement category, IFRS 9 requires all
financial assets, except equity instruments and derivatives, to be assessed based on a combination of the entity’s business model for managing the assets and the instruments’ contractual cash flow characteristics.
The IAS 39 measurement categories of financial assets [at fair value through profit or loss (FVPL), available for sale (AFS), held-to-maturity and amortised cost] have been replaced by:
- Debt instruments at amortised cost - Debt instruments at fair value through other comprehensive income (FVOCI), with
gains or losses recycled to profit or loss on derecognition - Equity instruments at FVOCI, with no recycling of gains or losses to profit or loss on
derecognition - Financial assets at fair value through profit or loss (FVPL)
The accounting for financial liabilities remains largely the same as it was under IAS 39, except for the treatment of gains or losses arising from an entity’s own credit risk relating to liabilities designated at FVPL. Such movements are presented in OCI with no subsequent reclassification to the income statement.
Changes to the impairment calculation: The adoption of IFRS 9 has fundamentally changed the Bank’s accounting for loan
loss impairments by replacing IAS 39’s incurred loss approach with a forward-looking expected credit loss (ECL) approach. IFRS 9 requires the Bank to record an allowance for ECLs for all loans and other debt financial assets not held at FVPL, together with loan commitments and financial guarantee contracts. The allowance is based on the ECLs associated with the probability of default in the next twelve months unless there has been a significant increase in credit risk since origination.
The ECL allowance is based on the credit losses expected to arise over the life of the asset (the lifetime expected credit loss or Lifetime ECL), unless there has been no significant increase in credit risk since origination, in which case, the allowance is based on the 12 months’ expected credit loss (12-month ECL).
The 12-month ECL is the portion of Lifetime ECLs that represent the ECLs that result from default events on a financial instrument that are possible within the 12 months after the reporting date.
Both Lifetime ECLs and 12-month ECLs are calculated on either an individual basis or a collective basis, depending on the nature of the underlying portfolio of financial instruments.
The Bank has established a policy to perform an assessment, at the end of each
reporting period, of whether a financial instrument’s credit risk has increased significantly since initial recognition, by considering the change in the risk of default occurring over the remaining life of the financial instrument.
Significant increase in credit risk: The Bank continuously monitors all assets subject to ECLs. In order to determine whether an instrument or a portfolio of instruments is subject to 12-month ECLs or Lifetime ECLs, the Bank assesses whether there has been a significant increase in credit risk since initial recognition. The Bank considers an exposure to have significantly increased in credit risk through the evaluation of a combination of criteria, including days past due, the number of notch movements on the Bank’s internal credit rating scale, as well as qualitative aspects such as early warning signals and a customer/facility moving onto the Bank’s watch list.
Regardless of the change in credit grades, for the Bank’s Retail and Corporate Banking portfolios, if contractual payments are more than 30 days past due, the Bank deems the credit risk on an exposure to have increased significantly since initial recognition. For the Treasury and Interbank investment portfolios, the Bank considers credit risk to have increased significantly if contractual payments are more than 2 days past due for “investment grade” exposures and more than 5 days past due for “non-investment” grade exposures.
The quantitative impact of applying IFRS 9 as at 1 March 2018 are disclosed in Note 3.
Definition of default: The Bank considers a financial instrument defaulted and therefore Stage 3 (credit
impaired) for ECL calculations in all cases under its Retail and Corporate Banking portfolios when the borrower becomes 90 days past due on its contractual payments. The Bank considers Treasury and Interbank balances defaulted and takes immediate action when the required payments are not settled by the close of the 10th business day past the due date outlined in the individual agreements for “investment grade” exposures and by the close of the 5th business day past the due date outlined in the individual agreements for “non-investment grade” exposures.
As a part of a qualitative assessment of whether a customer is in default, the Bank also considers a variety of instances that may indicate unlikeliness to pay. When such events occur, the Bank carefully considers whether the event should result in treating the customer as defaulted and therefore assessed as Stage 3 for ECL calculations or whether Stage 2 is appropriate.
Based on the above process, the Bank groups its loans into Stage 1, Stage 2 and Stage 3, as described below: • Stage 1: When loans are first recognised, the Bank recognises an allowance
based on 12month ECLs. Stage 1 loans also include facilities where the credit risk has improved and the loan has been reclassified from Stage 2.
• Stage 2: When a loan has shown a significant increase in credit risk since origination, the Bank records an allowance for the Lifetime ECLs. Stage 2 loans also include facilities, where the credit risk has improved and the loan has been reclassified from Stage 3.
• Stage 3: Loans considered credit-impaired. The Bank records an allowance for the Lifetime ECLs.
The Bank calculates interest income by applying the EIR to the gross carrying amount of financial assets other than credit-impaired assets.
When a financial asset becomes credit-impaired and is, therefore, regarded as ‘Stage3’, the Bank calculates interest income by applying the effective interest rate to the net amortised cost of the financial asset. If the financial assets cures and is no longer credit-impaired, the Bank reverts to calculating interest income on a gross basis.
The calculation of ECLs:
The Bank calculates ECLs based on probability-weighted scenarios to measure the expected cash shortfalls, discounted at an approximation to the Effective Interest Rate (EIR). A cash shortfall is the difference between the cash flows that are due to an entity in accordance with the contract and the cash flows that the entity expects to receive.
The mechanics of the ECL calculations are outlined below and the key elements are,
as follows: • The Probability of Default (PD) is an estimate of the likelihood of default over
a given time horizon. A default may only happen at a certain time over the assessed period, if the facility has not been previously derecognised and is still in the portfolio.
NOTES TO THE ABRIDGED FINANCIAL STATEMENTS (CONTINUED)For the year ended 28 February 2019
2.2 Changesinaccountingpoliciesanddisclosures(continued)
• The Exposure at Default (EAD) is an estimate of the exposure at a future default date, taking into account expected changes in the exposure after
the reporting date, including repayments of principal and interest, whether scheduled by contract or otherwise, expected drawdowns on committed facilities, and accrued interest from missed payments.
• The Loss Given Default (LGD) is an estimate of the loss arising in the case where a default occurs at a given time. It is based on the difference between the contractual cash flows due and those that the lender would expect to receive, including from the realisation of any collateral. It is usually expressed as a percentage of the EAD.
When estimating the ECLs, the Bank considers three scenarios (a “base case”, a “best case”, and a “worst case”). Each of these is associated with different PDs, EADs and LGDs. When relevant, the assessment of multiple scenarios also incorporates how defaulted loans are expected to be recovered, including the probability that the loans will cure and the value of collateral or the amount that might be received for selling the asset.
2.2.2 IFRS 7 Financial Instruments: Disclosures
To reflect the differences between IFRS 9 and IAS 39, IFRS 7 Financial Instruments: Disclosures was updated and the Bank has adopted it, together with IFRS 9, for the year beginning 1 March 2018. Changes include transition disclosures as shown in Note 3, as well as detailed qualitative and quantitative information about the ECL calculations and the assumptions and inputs used.
2.3 Significantaccountingjudgements,estimatesandassumptions The preparation of the Bank’s financial statements requires Management and Directors to make judgements, estimates and assumptions that affect the reported amount of revenues, expenses, assets and liabilities, and the accompanying disclosures, as well as the disclosure of contingent liabilities. Uncertainty about these assumptions and estimates could result in outcomes that require a material adjustment to the carrying amount of assets or liabilities affected in future periods.
Apart from the judgements, estimates and assumptions related to the impairment losses on financial assets under IFRS 9 detailed below, the judgements applied by Management and the Directors have been consistent with those applied in the annual financial statements for the year ended 28 February 2018.”
2.3.1 Impairmentlossesonfinancialassets “The measurement of impairment losses under IFRS 9 across all categories of
financial assets requires judgement, in particular, the estimation of the amount and timing of future cash flows and collateral values when determining impairment losses and the assessment of a significant increase in credit risk. These estimates are driven by a number of factors, changes in which can result in different levels of allowances.
3 IFRS9TransitionalDisclosures The following information sets out the impact of adopting IFRS 9 on the statement of financial position, and retained earnings including the effect of replacing IAS 39’s incurred credit loss calculations with IFRS 9’s ECLs.
3.1 A reconciliation between the carrying amounts under IAS 39 to the balances reported under IFRS 9 as of 1 March 2018 is, as follows:
IAS 39 Measurement IFRS 9 Measurement
CategoryAmount (RTGS$)
Reclassifica-tion
(RTGS$)
Remea-surement
ECL(RTGS$)
Amount (RTGS$) Category
Financial assets:Cash and cash equivalents
Loans and receivables 116,073,355 - - 116,073,355
Amortised Cost
Financial assets at fair value through profit or loss FVPL 852,284 - - 852,284 FVPLLoans and advanc-es to customers
Loans and receivables 32,824,221 - - 32,824,221
Amortised Cost
Debt instruments measured at amor-tised cost - 250,276,433 - 250,276,433
Amortised Cost
Financial assets held-to-maturity
Held-to-Maturity 250,276,433
(250,276,433) - -
Amortised Cost
Other receivablesLoans and
receivables 36,753,817 36,753,817 Amortised
Cost
Financial liabilities:Deposits due to banks and customers
Amortised Cost 348,164,949 - - 348,164,949
Amortised Cost
Loans and borrowings
Amortised Cost 1,771,125 - - 1,771,125
Amortised Cost
Provisions N/A 1,389,741 - - 1,389,741 N/AOther liabilities N/A 12,371,866 - - 12,371,866 N/A
3.2 The impact of transition to IFRS 9 on Reserves and Retained Earnings is, as follows:
RTGS$
Regulatoryreserve Closing balance under IAS 39 (28 February 2018) 3,388,683 Reclassification adjustment in relation to adopting IFRS 9 (3,388,683)Opening balance under IFRS 9 (1 March 2018) -
Retained earningsClosing balance under IAS 39 (28 February 2018) (12,719,910)Recognition of IFRS 9 ECLs (8,573,083)Deferred tax in relation to the above 2,207,569 Reclassification from Regulatory Reserve 3,388,683 Opening balance under IFRS 9 (1 March 2018) (15,696,741)
TotalchangeinequityduetoadoptingIFRS9 (6,365,514)
3.3 A reconciliation of ending impairment allowances under IAS 39 and provisions for loan commitments and financial guarantee contracts according to IAS 37 Provisions, Contingent Liabilities and Contingent Assets to the ECL allowances under IFRS 9:
Loan loss provisionunder
IAS 39/ IAS 37 at 28 February 2018 (RTGS$)
Remeasurement ECL
(RTGS$)
ECLs under IFRS 9 at
1 March 2018 (RTGS$)
Loans and advances to customers 3,797,839 101,569 3,899,408 Financial assets held-to-maturity/Debt instruments measured at amortised cost - 7,483,468 7,483,468 Other receivables - 825,987 825,987
3,797,839 8,411,025 12,208,864
Commitments to lend - 160,736 160,736 Financial guarantees - 1,322 1,322
- 162,058 162,058
3,797,839 8,573,083 12,370,922
Audited28 February
2019RTGS$
Audited28 February
2018RTGS$
4 INTEREST AND RELATED INCOME
Loans and advances to customers 3,528,921 6,274,240 Financial assets held-to-maturity 21,323,024 7,264,550
24,851,945 13,538,790
1834
/ PAG
E 4
- STE
WAR
D BA
NK
LIM
ITED
www.stewardbank.co.zwDirectors: B.T.R. Chidzero (Chairman), C. Maswi, D.T. Mandivenga, J. Gould, K. Chirairo*, K. Akosah-Bempah, N.N. Chadehumbe (Dr.), P.M. Mbizvo (Dr.), A. Chaavure*. * Executive. Registered Office: 101 Union Avenue Building, Kwame Nkrumah Avenue, Harare.

Crisis FundCyclone IDAI
Crisis FundCyclone IDAI
AUDITED ABRIDGED FINANCIAL STATEMENTSfor the year ended 28 February 2019
NOTES TO THE ABRIDGED FINANCIAL STATEMENTS (CONTINUED)For the year ended 28 February 2019
Audited28 February
2019RTGS$
Audited 28 February
2018RTGS$
5 INTEREST AND RELATED EXPENSE
Trading activities 3,391,271 242,223
6 NON-INTEREST INCOME
6.1 Fees and commission income
Net dealing gains 3,308,080 1,692,641 Net commissions 71,195,421 59,183,004
74,503,501 60,875,645 6.2 Other
Fair value adjustment on financial instruments 4,790,996 678,677 Gain on investment property arising out of change in functional and presentation currency 8,156,100 - Gain on property and equipment and intangible assets out of change in functional and presentation currency 17,553 - Sundry income - 96,683 Bad debts recovered 2,801,462 1,414,075
15,766,111 2,189,435
90,269,612 63,065,080
7 IMPAIRMENT ON FINANCIAL ASSETS CHARGE
7.1 Breakdown of ECL charges/(reversals) on financial instruments for the year recognised in Profit or Loss:
Loan and advancesto
customers (RTGS$)
Debt instruments measured at amortised
cost(RTGS$)
Other receivables
(RTGS$)
Commitments to lend and guarantees
(RTGS$)Total
(RTGS$)
Net remeasurements of loss allowance 3,403,166 4,243,628 (97,541) (145,464) 7,403,789
Audited28 February
2019RTGS$
Audited28 February
2018RTGS$
8 OPERATING EXPENDITURE
Administration expenses 33,691,736 18,454,677 Amortisation of intangible assets 767,903 476,526 Audit fees 364,010 120,752 Audit fees: Current year 304,010 120,752 Audit fees : prior year overruns 60,000 - Depreciation of property and equipment 3,697,137 2,094,372 Impairment of intangible assets - - Loss on disposal of property and equipment - - Impairment of property and equipment - - Directors' remuneration 196,881 141,748
- short-term benefits 196,881 141,748 - other emoluments - -
Loss on revaluation of property - - Occupancy expenses 1,866,291 1,543,386 Professional expenses 5,561,619 2,892,361 Staff costs 21,988,911 11,826,786
- short term benefits 21,578,850 11,178,687 - post - employment benefits 410,061 648,099
68,134,488 37,550,608
9 INCOME TAX
The components of income tax expense are as follows:Current tax expense 6,299,606 1,687,953 Deferred tax (reversal)/expense (2,052,345) 8,574,704Totalincometaxexpense 4,247,261 10,262,657
9.1 Incometaxreconciliation
Accounting profit before income tax 36,192,009 32,716,905
Taxation at normal rate of 25.75% 9,319,442 8,424,603
Origination and reversal of temporary differences (6,006,765) 1,008,469
Effect of non-deductible expenses: - Donations expenses 638,714 53,510 - Other non-deductible expenses 295,870 776,075
4,247,261 10,262,657
NOTES TO THE ABRIDGED FINANCIAL STATEMENTS (CONTINUED)For the year ended 28 February 2019
Audited 28 February
2019RTGS$
Audited28 February
2018RTGS$
10 CASH AND CASH EQUIVALENTS
10.1 Cash and balances with central banks
Balances with the Reserve Bank of Zimbabwe 276,642,661 110,191,323 Balances with other banks (2,844,283) 4,038,231 Cash balances 2,313,695 1,843,801
276,112,073 116,073,355
11 FINANCIAL ASSETS AT FAIR VALUE THROUGH PROFIT OR LOSS
Listed equities:
Opening balance 852,284 173,607 Additions 2,025,495 - Net fair value gain 4,790,996 678,677 Closing balance 7,668,775 852,284
12 LOANS AND ADVANCES TO CUSTOMERS
12.1 TotalloansandadvancesCorporate loans 3,373,027 9,756,752 Small-to-medium enterprise loans 7,137,921 1,022,151 Consumer loans 48,315,840 27,605,264
58,826,788 38,384,167 Less: Allowance for expected credit losses (3,780,577) - Less: Allowance for impairment losses - (3,797,839)Less: Suspended interest - (1,762,107)
55,046,211 32,824,221
12.2 Maturity analysisLess than one month 15,158,632 8,085,904 1 to 3 months 209,651 549,990 3 to 6 months 672,505 258,074 6 months to 1 year 2,099,552 132,531 1 to 5 years 13,979,431 11,234,605 Over 5 years 26,707,017 18,123,063
Grossloansandadvances 58,826,788 38,384,167
12.3Sectorialanalysisofutilisations
28 February 2019 28 February 2018RTGS$ % RTGS$ %
Mining 2,954 0.0% 25 0.0%Manufacturing 3,150,246 5.4% 3,874,785 10.1%Agriculture 514,938 0.9% 804,018 2.1%Distribution 1,039,845 1.8% 1,697,065 4.4%Services and communication 5,923,239 10.1% 7,058,800 18.4%Individuals 48,195,566 81.9% 24,949,474 65.0%
58,826,788 100.0% 38,384,167 100.0%
12.4ECLAllowanceforimpairmentofloansandadvances An analysis of changes in the gross carrying amount and the corresponding ECL
allowances in relation to Loans and Advances is, as follows:
Stage 1RTGS$
Stage 2RTGS$
Stage 3RTGS$
TotalRTGS$
Gross carrying amountsGross carrying amount as at 1 March 2018 26,779,791 7,998,637 6,303,768 41,082,196 New loans and advances originated 35,341,463 338,324 1,838,510 37,518,297 Loans and advances derecognised or repaid (excluding write offs) (8,932,561) (413,017) (3,375,732)
(12,721,310)
Transfers to Stage 1 5,629,068 (4,426,120) (1,202,948) - Transfers to Stage 2 (21,117) 405,057 (383,940) - Transfers to Stage 3 (401,368) (14,798) 416,166 - Amounts written off - - (2,749,008) (2,749,008)
Gross carrying amount as at 28 February 2019 58,395,276 3,888,083 846,816 63,130,175
ECL allowanceECL allowance as at 1 March 2018 753,511 487,741 2,820,215 4,061,467 New loans and advances originated 1,518,663 152,879 827,329 2,498,871 Loans and advances derecognised or repaid (excluding write offs) (478,900) (310,502) 200,510 (588,892)Transfers to Stage 1 267,017 (82,046) (184,971) - Transfers to Stage 2 (6,988) 114,022 (107,034) - Transfers to Stage 3 (180,690) (6,659) 187,349 - Amounts writted off - - (2,190,869) (2,190,869)
ECL allowance as at 28 February 2019 1,872,613 355,435 1,552,529 3,780,577
NOTES TO THE ABRIDGED FINANCIAL STATEMENTS (CONTINUED)For the year ended 28 February 2019
Audited28 February
2018RTGS$
12 LOANS AND ADVANCES TO CUSTOMERS (CONTINUED)
12.5 AllowanceforimpairmentonloansandadvancesAn analysis of the allowance for impairment losses under IAS 39 for loans and advances for the year to 28 February 2018 is, as follows:
Opening balance 3,060,309
Net charge for the year 6,027,568 Loans and advances written off (5,290,038)
Closing balance 3,797,839
Audited 28 February
2019RTGS$
Audited28 February
2018RTGS$
13 DEBT INSTRUMENTS MEASURED AT AMORTISED COST
Opening Balance - - Reclassification from Financial Assets Held-to-Maturity at 1 March 2018 250,276,433 - Additions 222,166,667 - Repayments received on maturity (1,950,457) - Accrued interest 6,918,515 -
477,411,158 -
Less: Allowance for ECL (11,727,097) -
Closing balance 465,684,061 -
13.1ECLAllowancefordebtinstrumentsmeasuredatamortisedcost An analysis of changes in the gross carrying amount and the corresponding ECL
allowances in relation to Debt Instruments measured at Amortised Cost is, as follows:
Stage 1RTGS$
Stage 2RTGS$
Stage 3RTGS$
TotalRTGS$
Gross carrying amountsGross carrying amount as at 1 March 2018 234,918,899 15,357,534 - 250,276,433 New assets purchased 405,513,087 - - 405,513,098 Assets derecognised or repaid (excluding write offs)
(165,539,161)
(12,839,201) - (178,378,362)
Transfers to Stage 1 - - - - Transfers to Stage 2 - - - - Transfers to Stage 3 - - - - Amounts written off - - - - Gross carrying amount as at 28 February 2019 474,892,825 2,518,333 - 477,411,158
ECL allowanceECL allowance as at 1 March 2018 4,379,208 3,104,260 - 7,483,468 New assets purchased 11,218,059 - - 11,218,059 Assets derecognised or repaid (excluding write offs) (4,379,208) (2,595,222) - (6,974,430)Transfers to Stage 1 - - - - Transfers to Stage 2 - - - - Transfers to Stage 3 - - - - Amounts written off - - - - ECL allowance as at 28 February 2019 11,218,059 509,038 - 11,727,097
Audited 28 February
2019RTGS$
Audited28 February
2018RTGS$
14 FINANCIAL ASSETS HELD-TO-MATURITY
The table below shows Financial Assets Held-to-Maturity as at 28 February 2019
Opening Balance 250,276,433 54,505,121 Re-classification to Debt Instruments measured at Amortised Cost (250,276,433) - Additions - 242,271,870 Repayments received on maturity - (49,793,963)Accrued interest - 3,293,405
Closing balance - 250,276,433
15 OTHER RECEIVABLES
Sundry receivables 47,249,332 22,911,426 Amounts due from related parties 14,050,197 13,842,391
Less: Allowance for ECL (822,450) -
60,477,079 36,753,817
1834
/ PAG
E 5
- STE
WAR
D BA
NK
LIM
ITED
www.stewardbank.co.zwDirectors: B.T.R. Chidzero (Chairman), C. Maswi, D.T. Mandivenga, J. Gould, K. Chirairo*, K. Akosah-Bempah, N.N. Chadehumbe (Dr.), P.M. Mbizvo (Dr.), A. Chaavure*. * Executive. Registered Office: 101 Union Avenue Building, Kwame Nkrumah Avenue, Harare.

AUDITED ABRIDGED FINANCIAL STATEMENTSfor the year ended 28 February 2019
NOTES TO THE ABRIDGED FINANCIAL STATEMENTS (CONTINUED)For the year ended 28 February 2019
Audited28 February
2019RTGS$
Audited28 February
2018RTGS$
16 INVENTORIES
Opening balance - - Additions 5,931,764 -
Closing balance 5,931,764 -
Inventories consists of housing units developed by the Bank for re-sale.
17 INVESTMENT PROPERTY
Opening balance 5,437,400 5,437,400 Fair value adjustments 8,156,100 -
Closing balance 13,593,500 5,437,400
Investment property comprises buildings and undeveloped residential land.
Investment property is stated at fair value, which has been determined based on valuations performed by an accredited independent valuer, as at 28 February 2019. The professional independent valuer considered comparable market evidence based on lease and purchase transactions of similar buildings and residential stands. There was no rental income received on Investment Property during the year.
Reconciliationoffairvalue
InvestmentpropertiesOffice
propertiesRTGS$
ResidentialstandsRTGS$
TotalRTGS$
Opening Balance 800,000 4,637,400 5,437,400 Additions - - - Exchange gain arising from change in functional and presentation currency 1,200,000 6,956,100 8,156,100 Remeasurement recognised in profit or loss - - - Closing Balance 2,000,000 11,593,500 13,593,500
Descriptionofvaluationtechniquesusedandkeyinputstovaluationoninvestmentproperties:
Valuationtechnique
Significantobservableinputs
Range (weighted average)
Office properties
Implicit investment approach(Refer below)
Comparable rentals per month persqm US$5 - US$9
Residential stands
Market value of similar properties(Refer below)
Comparable rate per sqm 321,011 sq.m
In arriving at the market value for property, the implicit investement approach was applied based on the capitalisation of income. This method is based on the principle that rentals and capital values are inter-related, hence, given the income produced by a property, its capital value can be estimated. Comparable rentals inferred from properties within the locality of the property based on use, location, size and quality of finishes were used. The rentals were then adjusted per square meter to the lettable areas, being rentals achieved for comparable properties as at 28 February 2019. The rentals are then annualised and a capitalisation factor is applied to arrive at market value of the property, also inferring on comparable premises which are in the same category as regards the building elements.
In assessing the market value of the residential stands, values of various properties that had been recently sold or which are currently on sale and situated in comparable residential areas was used. Market evidence from other Estate Agents and local press was also taken into consideration.
18 PROPERTY AND EQUIPMENT
Land and Leasehold Furniture Office Computer Motor Work in TotalBuildings Improvements andFittings Equipment Equipment Vehicles Progress
RTGS$ RTGS$ RTGS$ RTGS$ RTGS$ RTGS$ RTGS$ RTGS$
At Cost or Valuation:28 February 2017 1,200,000 1,975,600 3,217,587 1,965,741 6,196,243 590,360 507,857 15,653,388 Additions - - 737,525 - 6,302,716 55,892 457,244 7,553,377 Transfer from Work-in-Progress - - 114,521 - - 102,787 (395,971) (178,663)28 February 2018 1,200,000 1,975,600 4,069,633 1,965,741 12,498,959 749,039 569,130 23,028,102
Additions - 65,994 161,812 150,881 382,075 - 8,545,601 9,306,363 Exchange gain arising out of change in functional and presentation currency - - - - 17,553 - - 17,553 Transfers from Work-in-Progress - 266,607 92,950 56,869 252,341 - (668,767) -
Revaluation 1,764,781 (981,182) (799,278) (940,087) 2,649,959 (174,929) 3,934,000 5,453,264 28 February 2019 2,964,781 1,327,019 3,525,117 1,233,404 15,800,887 574,110 12,379,964 37,805,282
Accumulated depreciationandimpairment:
28 February 2017 - 904,477 2,544,591 1,594,277 3,815,602 447,498 - 9,306,445 Depreciation charge for the year 29,696 427,503 151,557 149,532 1,296,681 39,403 - 2,094,372 Eliminated on revaluation (29,696) - - - - - - (29,696)
28 February 2018 - 1,331,980 2,696,148 1,743,809 5,112,283 486,901 - 11,371,121 Depreci-ation charge for the year 36,780 228,110 252,399 194,496 2,921,655 63,697 - 3,697,137 Eliminated on revaluation (15,219) (1,476,182) (2,770,278) (1,849,087) (6,520,041) (517,929) - (13,148,736)
28 February 2019 21,561 83,908 178,269 89,218 1,513,897 32,669 - 1,919,522
Net carrying amount: At 28 February 2019 2,943,220 1,243,111 3,346,848 1,144,186 14,286,990 541,441 12,379,964 35,885,761 At 28 February 2018
1,200,000 643,620 1,373,485 221,932 7,386,676 262,138 569,130 11,656,981
NOTES TO THE ABRIDGED FINANCIAL STATEMENTS (CONTINUED)For the year ended 28 February 2019
19 INTANGIBLE ASSETS
Computer software
RTGS$
Current work in progress
RTGS$ Total
RTGS$
Cost:
28 February 2017 8,709,091 1,212,169 9,921,260 Additions 647,437 226,113 873,550 Transfer from Work in Progress 187,532 (8,869) 178,663 28 February 2018 9,544,060 1,429,413 10,973,473 Additions 250,253 2,055,595 2,305,848 Transfer from Work in Progress 261,576 (261,576) - Revaluation 2,979,850 4,498,990 7,478,840 28 February 2019 13,035,739 7,722,422 20,758,162
Accumulatedamortisationandimpairment:
28 February 2017 3,841,098 16,010 3,857,108 Amortisation charge for the year 476,526 - 476,526 28 February 2018 4,317,624 16,010 4,333,634 Amortisation charge for the year 767,903 - 767,903 Elimination on revaluation (4,794,150) (16,010) (4,810,160) 28 February 2019 291,377 - 291,377
Net carrying amount:At 28 February 2019 12,744,362 7,722,422 20,466,784 At 28 February 2018 5,226,436 1,413,403 6,639,839
Intangible assets pertain to computer software. The Bank uses the expected usage of the asset to determine the useful life of intangible assets.
20 SHARE CAPITAL AND SHARE PREMIUM
Share capital:28 February
2019No. of Shares
28 February 2018
No. of Shares2019
RTGS$2018
RTGS$
AuthorisedOrdinary shares of $0.0000001 each 70,000,000,000 70,000,000,000 7,000 7,000 10% Irredeemable non-cumulative preference shares of RTGS$1 each 10,000 10,000 10,000 10,000
17,000 17,000
IssuedOrdinary shares of $0.0000001 each 471,707,887 471,707,887 47 47 10% Irredeemable non-cumulative preference shares of RTGS$1 each 4,030 4,030 4,030 4,030
4,077 4,077
Subject to the provisions of section 183 of the Companies Act (Chapter 24:03), the unissued shares are under the control of the directors.
Movementsinsharecapitalandsharepremium:
No. ofordinary
shares
No. of prefer-
ence shares
Share CapitalRTGS$
Share premium
RTGS$Total
RTGS$28 February 2017
471,707,887 4,030 4,077 106,317,629 106,321,706
28 February 2018
471,707,887 4,030 4,077 106,317,629 106,321,706
28 February 2019
471,707,887 4,030 4,077 106,317,629 106,321,706
21 OTHER RESERVES
RevaluationsurplusRTGS$
RegulatoryreserveRTGS$
TotalRTGS$
28 February 2017 - 3,899,036 3,899,036 Gain on revaluation, net of tax 22,049 - 22,049 Impairment allowance for loans and advances - (510,353) (510,353)
28 February 2018 22,049 3,388,683 3,410,732 Reclassification adjustment in relation to adopting IFRS 9 - (3,388,683) (3,388,683)Gain on revaluation, net of tax 22,936,568 - 22,936,568
28 February 2019 22,958,617 - 22,958,617
RevaluationsurplusThis reserve represents the surplus arising from the revaluation of owner occupied property.
RegulatoryreserveThis reserve caters for any excess credit loss provisions that may result from calculation of impairments on loans and receivables per the Reserve Bank of Zimbabwe regulatory approach.
22 DEPOSITS DUE TO BANKS AND CUSTOMERS
Audited28 February
2019RTGS$
Audited28 February
2018RTGS$
Due to customersCurrent accounts 746,635,400 342,086,309 Term deposits 4,694,109 6,078,640
751,329,509 348,164,949
At 28 February 2019, approximately $289.3 million or 42.7% of the Bank’s deposits due to customers (At 28 February 2017: $190.5 million or 54.5%) represents balances owed to a related party entity in the telecommunications sector.
A concentration of risk therefore exists in the event that the business of the counterparty is adversely affected by changes in economic or other conditions. However, at 28 February 2019 the Bank’s management was not aware of any economic or other conditions that may adversely affect the business of the counterparty.
22.1 Maturity analysis of deposits
Audited28 February
2019RTGS$
Audited28 February
2018RTGS$
Less than one month 746,978,210 347,380,178 1 to 3 months 4,351,299 784,771
751,329,509 348,164,949
22.2 Sectorial analysis of deposits
28 February 2019 28 February 2018 RTGS$ % RTGS$ %
Financial 5,039,078 0.7% 15,165,861 4.4%Transport and telecommunications 630,552,816 83.9% 236,321,183 67.9%Mining 479,682 0.1% 542,269 0.2%Manufacturing 9,058,744 1.2% 8,407,777 2.4%Agriculture 1,759,532 0.2% 820,820 0.2%Distribution 4,465,704 0.6% 3,338,266 1.0%Services 29,390,957 3.9% 13,588,773 3.9%Government and parastatals 423,022 0.1% 2,085,295 0.6%Individuals 61,912,976 8.2% 63,272,696 18.2%Other 8,246,998 1.1% 4,622,009 1.3%
751,329,509 100.0% 348,164,949 100.0%
1834
/ PAG
E 6
- STE
WAR
D BA
NK
LIM
ITED
www.stewardbank.co.zwDirectors: B.T.R. Chidzero (Chairman), C. Maswi, D.T. Mandivenga, J. Gould, K. Chirairo*, K. Akosah-Bempah, N.N. Chadehumbe (Dr.), P.M. Mbizvo (Dr.), A. Chaavure*. * Executive. Registered Office: 101 Union Avenue Building, Kwame Nkrumah Avenue, Harare.

AUDITED ABRIDGED FINANCIAL STATEMENTSfor the year ended 28 February 2019
NOTES TO THE ABRIDGED FINANCIAL STATEMENTS (CONTINUED)For the year ended 28 February 2019
24 FAIR VALUE MEASUREMENT (CONTINUED)
Audited 28 February 2019
Audited 28 February 2018
Carrying Fair Carrying Fairamount value amount value
RTGS$ RTGS$ RTGS$ RTGS$Financial assets
Cash and cash equivalents 276,112,073 276,112,073 116,073,355 116,073,355 Financial assets at fair value through profit or loss 7,668,775 7,668,775 852,284 852,284 Loans and advances to customers 55,046,211 55,046,211 43,921,363 38,384,167 Debt instruments measured at amortised cost 465,684,061 465,684,061 - - Financial assets held to maturity - - 250,276,433 250,276,433 Other receivables 60,477,079 60,477,079 36,753,817 36,753,817
864,988,199 864,988,199 447,877,252 442,340,056
FinancialliabilitiesDeposits due to banks and customers
751,329,509
751,329,509
348,164,949
348,164,949
Loans and borrowings 2,250,000 2,250,000 1,771,125 1,771,125 753,579,509 753,579,509 349,936,074 349,936,074
25 PROVISIONS
Audited28 February
2019RTGS$
Audited28 February
2018RTGS$
Provisions 1,161,544 1,389,741
LeavePayandProvisionfor
DemolitioncostsRTGS$
TotalRTGS$
Balance at 28 February 2018 1,389,741 1,389,741 Current provision 4,049,512 4,049,512 Amount utilised (4,277,709) (4,277,709) Balance at 28 February 2019 1,161,544 1,161,544
26 OTHER LIABILITIES
Audited28 February
2019RTGS$
Audited28 February
2018RTGS$
Sundry creditors and accruals 46,967,986 12,371,866
27 DEFERRED TAX (ASSET)/LIABILITY
Acceleratedwear and
tearRTGS$
Fairvalue adjust-
mentsRTGS$
Assessed losses RTGS$
OtherRTGS$
TotalRTGS$
At 28 February 2018 1,456,371 682,587 - (2,204,837) (65,879)Deferred tax in relation to transition to IFRS 9 - - - (2,207,569) (2,207,569)Charge/(credit) to profit for the year 4,953,407 (6,341,797) - (663,955) (2,052,345)Charge to other comprehensive income - 7,954,432 - - 7,954,432At 28 February 2019
6,409,778 2,295,222 -
(5,076,361) 3,628,639
28 RELATED PARTY DISCLOSURES
Audited28 February
2019RTGS$
Audited28 February
2018RTGS$
Compensation of key management personnel of the Bank: Short-term benefits 1,728,789 1,571,626 Post-employment benefits 108,838 98,943
1,837,627 1,670,569
29 RISK MANAGEMENT
Risk is inherent in the Bank’s activities, but is managed through a process of ongoing identification, measurement and monitoring, subject to risk limits and other controls. This process of risk management is critical to the Bank’s continuing profitability and each individual within the Bank is accountable for the risk exposures relating to his or her responsibilities. The Bank is exposed to credit risk, liquidity risk, strategic risk, reputational risk and market risk. It is also subject to country risk and various operating risks.
29.1 Credit Risk Credit risk is the risk that the Bank will incur a loss because its customers or counterparties fail to discharge their contractual obligations. The Bank manages and controls credit risk by setting limits on the amount of risk it is willing to accept for individual counterparties and for geographical and industry concentrations, and by monitoring exposures in relation to such limits.
The table below shows the credit quality of the Bank’s financial instruments and the maximum exposure to credit risk based on the Bank’s internal credit rating system and year end stage classification.
NOTES TO THE ABRIDGED FINANCIAL STATEMENTS (CONTINUED)For the year ended 28 February 2019
29 RISK MANAGEMENT (CONTINUED)
High grade Standard gradeSub-
standard
Past due but not
impaired
Individu-ally
impairedStage 1 Stage 1 Stage 2 Stage 2 Stage 3 Stage 3 TotalRTGS$ RTGS$ RTGS$ RTGS$ RTGS$ RTGS$ RTGS$
At 28 February 2019:Loans and advancestocustomers:Retail portfolio - consumer and mortgage loans
38,094,678 - 3,674,279 - 1,175,686 161,563
43,106,206 Retail portfolio - Credit cards 67,749 -
30,568
-
99,530 356,649 554,496
Corporate and SME portfolio 10,005,941 -
3,451,731 45,676 1,337,956 324,781
15,166,085
48,168,368 - 7,156,578 45,676 2,613,172 842,994 58,826,788
Debt instruments measured at amortisedcost:Exposure to banks 50,253,558 40,469,181 10,518,444 - - - 101,241,183 Government debt securities 376,169,972 - - - - - 376,169,974
426,423,533 40,469,181 10,518,444 - - - 477,411,158
Other receivables - -
4,455,657 - - - 4,455,657
Contingentliabilites, commitmentsFinancial guarantees 319,250 - - - - - 319,250 Commitments to lend 7,543,062 - - - - - 7,543,062
7,862,312 - - - - - 7,862,312
482,454,214 40,469,181 22,130,679 45,676 2,613,172 842,993 548,555,915
The table below shows the credit quality of loan exposures by industrial sector as at 28 February 2018. The amounts presented are gross of impairment allowances.
Neither past due nor impaired
Grade AHigh Grade
RTGS$
Grade BStandard
GradeRTGS$
Grade CSub-stan-
dardRTGS$
Past due but not
impairedRTGS$
Individuallyimpaired
RTGS$Total
RTGS$
At 28 February 2018:Individuals 15,231,101 1,594,344 5,699,466 492,228 1,932,335 24,949,474 Mining - - - - 25 25 Manufacturing 2,179,026 - 313,133 - 1,382,626 3,874,785 Agriculture 17,948 - 541,295 - 244,774 804,017 Distribution 120,887 - 911,109 481,047 184,023 1,697,066 Services 2,982,780 1,974,549 1,162,192 17,856 921,423 7,058,800
20,531,742 3,568,893 8,627,195 991,131 4,665,206 38,384,167
29.2 Interest rate riskInterest rate risk arises from the possibility that changes in interest rates will affect future cash flows or the fair values of financial instruments. The Board has established limits on the non–trading interest rate gaps for stipulated periods. The Bank’s policy is to monitor positions on a daily basis and hedging strategies are used to ensure positions are maintained within the established limits.
The table below summaries the Bank’s interest rate risk exposure:
TOTAL POSITION
Up to 1month
1 month to3 months
3 months to1 year 1 to 5 years
Non-interestbearing Total
At 28 February 2019 RTGS$ RTGS$ RTGS$ RTGS$ RTGS$ RTGS$AssetsCash and cash equivalents - - - - 276,112,073 276,112,073 Financial assets at fair value through profit or loss - - - - 7,668,775 7,668,775 Loans and advances to customers
15,158,632
209,651
2,772,058
36,905,870 -
55,046,211 Debt instruments measured at amortised cost 4,010,592 202,039,857 71,074,318 188,559,294 - 465,684,061 Other receivables - - - - 60,477,079 60,477,079 Inventories - - - - 5,931,764 5,931,764 Investment property - - - - 13,593,500 13,593,500 Property and equipment - - - - 35,885,761 35,885,761
Intangible assets - - - - 20,466,784 20,466,784 19,169,224 202,249,508 73,846,376 225,465,164 420,135,736 940,866,008
LiabilitiesandequityDeposits due to banks and customers 746,978,210 4,351,299 - - - 751,329,509 Loans and borrowings - - 2,250,000 - - 2,250,000 Provisions - - - - 1,161,544 1,161,544 Other liabilities - - - - 46,967,986 46,967,986 Deferred tax liability - - - - 3,628,639 3,628,639 Equity - - - - 135,528,330 135,528,330
746,978,210 4,351,299 2,250,000 - 187,286,499 940,866,008
Interest rate repricing gap (727,808,986) 197,898,209 71,596,376 225,465,164 232,849,237 -
Cumulativegap
(727,808,986)
(529,910,777)
(458,314,401) (232,849,237) - -
NOTES TO THE ABRIDGED FINANCIAL STATEMENTS (CONTINUED)For the year ended 28 February 2019
23 LOANS AND BORROWINGS
Audited28 February 2019
RTGS$
Audited28 February 2018
RTGS$
Offshore borrowings - - Lines of credit 2,250,000 1,771,125
2,250,000 1,771,125
23.1 Maturityprofileofloansandborrowings
Audited28 February
2019RTGS$
Audited28 February
2018RTGS$
Less than one month - - 1 to 6 months - - 6 months to 1 year 2,250,000 1,771,125 1 to 5 years - -
2,250,000 1,771,125
The line of credit consists of funds advanced to the Bank for disbursement to entities in the agriculture value chain. The line is priced at 5% per annum, is unsecured, and payable over a tenure of 12-36 months.
24 FAIR VALUE MEASUREMENT
The following table provides the fair value measurement hierarchy of the Bank’s assets and liabilities.
Quantitativedisclosuresfairvaluemeasurementhierarchyforassetsandliabilitiesasat 28 February 2019:
Fairvaluemeasurementusing:
Assets measured at fair value: DateofValuation
TotalRTGS$
Quoted prices in
activemarkets (Level1)
RTGS$
Significantobservable
inputs (Level2)
RTGS$
Significantunobservable
inputs(Level3)
RTGS$
Investmentproperties(Note 16)
Office buildings28 February
2019 11,593,500 - 11,593,500 -
Residential stands28 February
2019 2,000,000 - 2,000,000 - TotalInvestmentproperty 13,593,500 - 13,593,500 -
Quoted equity shares (Note 11)Telecommunications sector
28 February 2019 7,668,775 7,668,775 - -
Property and equipment (Note 18) Property and equipment 1 October 2018 35,885,761 - 35,885,761 -
Intanglible assets (Note 19) Computer software 1 October 2018 20,466,784 - 20,466,784 -
There have been no transfers between Level 1 and Level 2 during the year.
Fairvaluehierarchyforfinancialinstrumentsmeasuredatfairvalueasat28February 2018
Fairvaluemeasurementusing:
Assets measured at fair value: DateofValuation
TotalRTGS$
Quoted prices in
activemarkets (Level1)
RTGS$
Significantobservable
inputs (Level2)
RTGS$
Significantunobservable
inputs(Level3)
RTGS$
Investmentproperty:
Residential stands28 February
2018 4,637,400 - 4,637,400 -
Office buildings28 February
2018 800,000 - 800,000 - TotalInvestmentproperty 5,437,400 5,437,400
Quoted equity shares Telecommunications sector
28 February 2018 852,284 852,284 - -
FairvaluehierarchyThe Bank uses the following hierarchy for determining and disclosing the fair value of financial instruments by valuation technique;Level 1: Quoted (unadjusted) prices in active markets for identical assets or liabilitiesLevel 2: Other techniques for which all inputs which have a significant effect on the recorded fair value are observable, either directly or indirectlyLevel 3: Techniques which use inputs which have a significant effect on the recorded fair value that are not based on observable market data.
FAIR VALUES OF FINANCIAL INSTRUMENTS The fair value of the financial assets and liabilities are included at the amount at which the instrument could be exchanged in a current transaction between willing parties, other than in a forced or liquidation sale. The following methods and assumptions were used to estimate transaction between willing parties, other than in a forced or liquidation sale. The following methods and assumptions were used to estimate the fair values:- Cash and cash equivalents, loans and advances, deposits and other liabilities
approximate their carrying amounts largely due to the short-term maturities of these instruments.
- Loans and advances excluding mortgages to staff approximate their carrying amounts largely due to the short-term maturities of these instruments. The fair value of mortgage facilities to employees is estimated considering (i) current or quoted prices for identical instruments in the financial services sector and (ii) a net present value calculated from the average market yield rates with similar maturies and credit risk factors.
- Long-term fixed-rate and variable-rate receivables / borrowings are evaluated by the Bank based on parameters such as interest rates, specific country risk fac-tors, individual creditworthiness of the customer and the risk characteristics of the financed project. Based on this evaluation, allowances are taken to account for the expected losses of these receivables. As at 28 February 2018, the carrying amounts of such receivables, net of allowances, are not materially different from their calculated fair values.
- The fair value of unquoted instruments, loans from banks and other financial lia-bilities and obligations under finance leases are estimated by discounting future cash flows using rates currently available for debt on similar terms, credit risk and remaining maturities.
- Fair value of financial assets at fair value through profit or loss are derived from quoted market prices in active markets.
1834
/ PAG
E 7
- STE
WAR
D BA
NK
LIM
ITED
www.stewardbank.co.zwDirectors: B.T.R. Chidzero (Chairman), C. Maswi, D.T. Mandivenga, J. Gould, K. Chirairo*, K. Akosah-Bempah, N.N. Chadehumbe (Dr.), P.M. Mbizvo (Dr.), A. Chaavure*. * Executive. Registered Office: 101 Union Avenue Building, Kwame Nkrumah Avenue, Harare.

NOTES TO THE ABRIDGED FINANCIAL STATEMENTS (CONTINUED)For the year ended 28 February 2019
29 RISK MANAGEMENT (CONTINUED)
29.5.2Summaryriskmatrix–30November2014onsiteexamination(continued)Adequacy of Risk Management Systems:
Moderate–could reasonably be expected to result in a loss which could be absorbed by a banking institution in the normal course of business.
High– reflects a higher than average probability of potential loss. High inherent risk
could reasonably be expected to result in significant and harmful loss to the banking institution.
Weak– risk management systems are inadequate or inappropriate given the size,
complexity and risk profile of the banking institution. Institution’s risk management systems are lacking in important ways and therefore a cause of more than normal supervisory attention.
The internal control systems will be lacking in important aspects particularly as indicated by continued control exceptions or by the failure to adhere to written policies or procedures.
Acceptable–management of risk is largely effective but lacking to some modest degree. While the institution might be having some minor risk management weaknesses, these have been recognized and are being addressed. Management information systems are generally adequate.
Strong–management effectively identifies and controls all types of risk posed by the relevant functional areas or per inherent risk. The Board and senior management are active participants in managing risk and ensure appropriate policies and limits are put in place. The policies comprehensively define the bank’s risk tolerance, responsibilities and accountabilities are effectively communicated.
OverallCompositeRisk:
Low– would be assigned to low inherent risk areas. Moderate risk areas may be assigned a low composite risk where internal controls and risk management systems are strong and effectively mitigate much of the risk.
Moderate–risk management systems appropriately mitigates inherent risk. For a given low risk area, significant weaknesses in the risk management systems may result in moderate composite risk assessment. On the other hand, a strong risk management system may reduce the risk so that any potential financial loss from the activity would have only a moderate negative impact on the financial condition of the organization.
High – risk management systems do not significantly mitigate the high inherent risk. Thus, the activity could potentially result in a financial loss that would have a significant impact on the bank’s overall condition.
DirectionofOverallCompositeRisk:
Increasing–based on the current information, risk is expected to increase in the next 12 months.
Decreasing–based on the current information, risk is expected to decrease in the
next 12 months.
Stable–based on the current information, risk is expected to be stable in the next 12 months.
30 CAPITAL MANAGEMENT
The objective of the Bank’s capital management is to ensure that it complies with the Reserve Bank of Zimbabwe (RBZ) requirements. In implementing the current capital requirements, the RBZ requires the Bank to maintain a prescribed ratio of total capital to total risk weighted assets. Risk weighted assets are arrived at by applying the appropriate risk factor as determined by the RBZ to the monetary value of the various assets as they appear on the Bank’s statement of financial position.
Regulatory capital consists of:
- Tier 1 Capital (“the core capital”), which comprises share capital, share premium, retained earnings (including the current year profit or loss), the statutory reserve and other equity reserves.
The core capital shall comprise not less than 50% of the capital base and portfolio provisions are limited to 1.25% of total risk weighted assets.
- Tier 2 Capital (“supplementary capital”), which includes subordinated term debt, revaluation reserves and portfolio provisions.
- Tier 3 Capital (“tertiary capital”) relates to an allocation of capital to meet market and operational risks.
The Bank’s regulatory capital position was as follows:
Audited28 February
2019RTGS$
Audited28 February
2018RTGS$
Share capital 4,077 4,077 Share premium 106,317,629 106,317,629 Accumulated profit/(loss) 6,248,007 (12,719,910)Deferred tax asset - (65,879)
112,569,713 93,535,917 Less: Capital allocated for market and operational risk (5,884,958) (4,531,362) Advances to insiders (14,050,197) (13,842,391) Guarantees to insiders - (30,000)Tier 1 capital 92,634,558 75,132,164
Tier 2 capital 22,958,617 3,410,732 Other reserves 22,958,617 22,049 General provisions - 3,388,683
Total Tier 1 and 2 capital 115,593,175 78,542,896
Tier 3 capital (sum of market and operational risk capital) 5,884,958 4,531,362
Total Capital Base 121,478,133 83,074,258
Total risk weighted assets 177,740,059 123,473,687
Tier 1 ratio 52% 61%Tier 2 ratio 13% 3%Tier 3 ratio 3% 4%Totalcapitaladequacyratio 68% 68%RBZ minimum requirement 12% 12%
31 EXTERNAL CREDIT RATINGS
Most recent rating:
Previousrating:
Previousrating:
October 2018
October 2017
September 2016
Rating agent: Global Credit Rating Co (GCR) BBB BBB BBB-
NOTES TO THE ABRIDGED FINANCIAL STATEMENTS (CONTINUED)For the year ended 28 February 2019
29 RISK MANAGEMENT (CONTINUED)
29.3.3 Commitments and guarantees To meet the financial needs of customers, the Bank enters into various irrevocable
commitments and contingent liabilities. Even though these obligations may not be recognised on the statement of financial position, they do contain credit risk and are therefore part of the overall risk of the Bank.
The table below shows the Bank’s maximum credit risk exposure for commitments and guarantees.
The maximum exposure to credit risk relating to a financial guarantee is the maximum amount the Bank could have to pay if the guarantee is called upon. The maximum exposure to credit risk relating to a loan commitment is the full amount of the commitment. In both cases, the maximum risk exposure is significantly greater than the amount recognised as a liability in the statement of financial position.
Audited28 February
2019RTGS$
Audited28 February
2018RTGS$
Financial guarantees 319,250 30,000 Commitments to lend 7,543,062 6,115,684
7,862,312 6,145,684
ECL Allowances on commitments and guarantees
An analysis of changes in the gross carrying amount and the corresponding ECL allowances in relation to Commitments and Guarantees is, as follows:
Stage 1 Stage 2 Stage 3 Total RTGS$ RTGS$ RTGS$ RTGS$
Gross carrying amountsOutstanding exposures as at 1 March 2018 6,145,684 - - 6,145,684 New exposures 1,716,628 - - 1,716,628
Exposures derecognised or matured/lapsed (excluding write offs) - - - -Transfers to Stage 1 - - - - Transfers to Stage 2 - - - - Transfers to Stage 3 - - - - Amounts writted off - - - -
Gross carrying amount as at 28 February 2019 7,862,312 - - 7,862,312
ECL allowanceECL allowance as at 1 March 2018 162,058 - - 162,058 New exposures 3,777 - - 3,777 Exposures derecognised or matured (excluding write offs) (149,240) - - (149,240)Transfers to Stage 1 - - - - Transfers to Stage 2 - - - - Transfers to Stage 3 - - - - Amounts writted off - - - -
ECL allowance as at 28 February 2019 16,595 - - 16,595
29.4 OTHER RISKS
29.4.1OperationalriskOperational risk is the risk of loss arising from systems failure, human error, fraud or external events. When controls fail to operate effectively, operational risks can cause damage to reputation, have legal or regulatory implications, or lead to financial loss. The Bank cannot expect to eliminate all operational risks, but it endeavours to manage these risks through a control framework and by monitoring and responding to potential risks. Controls include effective segregation of duties, access, authorisation and reconciliation procedures, staff education and assessment processes, such as the use of internal audit.
29.4.2 Compliance risk Compliance risk is the current and prospective risk to earnings or capital arising from
violations of, or non-conformance with, law, rules, regulations, prescribed practices, internal policies, and procedures, or ethical standards. This risk exposes the institution to fines and payment of damages. Compliance risk can lead to diminished reputation, limited business opportunities, reduced expansion potential, and an inability to enforce contracts. The Internal Audit and the Risk Department ensure that the Bank fully complies with all relevant laws and regulations.
29.4.3ReputationalriskReputational risk is the current and prospective impact on earnings and capital arising from negative public opinion. This affects the institution’s ability to establish new relationships or services or continue servicing existing relationships. This risk may expose the institution to litigation, financial loss, or a decline in its customer base. The Bank has a Business Development department whose mandate is to manage this risk.
29.5 ReserveBankRatingsThe Reserve Bank of Zimbabwe conducted an onsite inspection of the Bank in November 2014 and the final ratings that were determined on the Bank are detailed below:
29.5.1CAMELS*Ratings
CAMELSComponent RBS**Ratings30/11/2014Capital Adequacy 1 - StrongAsset Quality 4 - WeakManagement 2 - SatisfactoryEarnings 4 - WeakLiquidity 2 - SatisfactorySensitivity to Market Risk 2 - SatisfactoryComposite Rating 3 - Fair
*CAMELS is an acronym for Capital Adequacy, Asset Quality, Management, Earnings, Liquidity and Sensitivity to Market Risk. The CAMELS rating system uses a scale of 1-5, where “1” is “Strong”, “2” is “Satisfactory”, “3” is “Fair”, “4” is “Weak” and “5” is “Critical”. ** RBS stands for Risk-Based Supervision
29.5.2Summaryriskmatrix–30November2014onsiteexamination
KEY LevelofInherentRisk:
Low– reflects a lower than average probability of an adverse impact on a banking institution’s capital and earnings. Losses in a functional area with low inherent risk would have little negative impact on the banking institution’s overall financial condition.
Credit Acceptable Stable
Acceptable Stable
Low Acceptable Low Stable
ForeignExchange Low Acceptable Low Stable
Acceptable Stable
Acceptable Stable
Legal and
Acceptable Stable
Acceptable Stable
NOTES TO THE ABRIDGED FINANCIAL STATEMENTS (CONTINUED)For the year ended 28 February 2019
29 RISK MANAGEMENT (CONTINUED)
29.2Interestraterisk(continued)
Up to 1month
1 month to3 months
3 months to1 year1 to 5 years
Over5years
Non-inter-est
bearing TotalAt 28 Febru-ary 2018 RTGS$ RTGS$ RTGS$ RTGS$ RTGS$ RTGS$ RTGS$
AssetsCash and cash equivalents - - - - - 116,073,355 116,073,355 Financial assets at fair value through profit or loss - - - - - 852,284 852,284 Loans and advances to customers
8,085,904 549,991 390,605 23,797,721 - -
32,824,221 Financial assets held to maturity 18,985,880 62,761,627 94,206,800 74,322,126 - - 250,276,433 Other receivables - - - - - 36,753,817 36,753,817 Non-current assets held for sale - - - - - 130,000 130,000 Investment property - - - - - 5,437,400 5,437,400 Property and equipment - - - - - 11,656,981 11,656,981 Intangible assets - - - - - 6,639,839 6,639,839 Deferred tax asset - - - - - 65,879 65,879
27,071,784 63,311,618 94,597,405 98,119,847 - 177,609,555 460,710,209
LiabilitiesandequityDeposits due to banks and customers 347,380,178 784,771 - - - - 348,164,949
Loans and borrowings - - 1,771,125 - - - 1,771,125 Provisions - - - - - 1,389,741 1,389,741 Other liabilities - - - - - 12,371,866 12,371,866
Equity - - - - - 97,012,528 97,012,528 347,380,178 784,771 1,771,125 - - 110,774,135 460,710,209
Interest rate repricing gap
(320,308,394) 62,526,847 92,826,280 98,119,847 - 66,835,420 -
Cumulativegap
(320,308,394)
(257,781,547)
(164,955,267)
(66,835,420)
(66,835,420) - -
29.3 Liquidity risk Liquidity risk is defined as the risk that the Bank will encounter difficulty in meeting
obligations associated with financial liabilities that are settled by delivering cash or another financial asset. Liquidity risk arises because of the possibility that the Bank might be unable to meet its payment obligations when they fall due under both normal and stress circumstances. To limit this risk, management has arranged diversified funding sources in addition to its core deposit base, and adopted a policy of managing assets with liquidity in mind and monitoring future cash flows and liquidity on a daily basis. The Bank has developed internal control processes and contingency plans for managing liquidity risk. This incorporates an assessment of expected cash flows and the availability of high grade collateral which could be used to secure additional funding if required.
29.3.1Liquidityratios
Audited28 February
2019
Audited28 February
2018
Loans to deposits ratio 7% 11%Net liquid assets to customer liabilities ratio 75% 70%
29.3.2Contractualmaturitiesofundiscountedcashflowsoffinancialassetsandliabilities The table below summarises the maturity profile of the undiscounted cash flows of
the Bank’s financial assets and liabilities. Repayments which are subject to notice are treated as if notice were to be given immediately. However, the Bank expects that many customers will not request repayment on the earliest date the Bank could be required to pay and the table does not reflect the expected cash flows indicated by the Bank’s deposit retention history.
On demand
RTGS$
Less than3 months
RTGS$
3 months to1 yearRTGS$
1 to 5 years
RTGS$
Over5years
RTGS$Total
RTGS$
At 28 February 2019
Financial assets:Cash and cash equivalents 276,112,073 - - - - 276,112,073 Financial assets at fair value through profit or loss 7,668,775 - - - - 7,668,775 Loans and advances to customers 15,158,632 209,651 2,772,058 13,979,431
26,707,017 58,826,789
Debt instruments measured at amortised cost 4,010,592 202,039,857 71,074,318 200,286,391 - 477,411,158
Other receivables 60,477,079 - - - - 60,477,079 Totalundiscountedfinancialassets 363,427,152 202,249,508 73,846,376 214,265,821 26,707,017 880,495,874
Financial liabilities:Deposits due to banks and customers 746,978,210 4,351,299 - - - 751,329,509
Loans and borrowings - - 2,250,000 - - 2,250,000 Totalundiscountedfinancialliabilities 746,978,210 4,351,299 2,250,000 - - 753,579,509 Netundiscountedfinancialassets/(liabilities) (383,551,059) 197,898,209 71,596,376 214,265,822
26,707,017 126,916,365
At 28 February 2018
Financial assets:Cash and cash equivalents 116,073,355 - - - - 116,073,355 Financial assets at fair value through profit or loss 852,284 852,284 Loans and advances to customers 8,085,904 549,990 5,990,747 11,234,605 12,563,117 38,424,363 Financial assets held-to-ma-turity 18,985,880 62,761,627 94,206,800 74,322,126 - 250,276,433 Other receivables 36,753,817 - - - - 36,753,817 Totalundiscountedfinancialassets 180,751,240 63,311,617 100,197,547 85,556,731 12,563,117 442,380,252
Financial liabilities:Deposits due to banks and customers 347,380,178 784,771 - - - 348,164,949
Loans and borrowings - - 1,771,125 - - 1,771,125 Totalundiscountedfinancialliabilities 347,380,178 784,771 1,771,125 - - 349,936,074 Netundiscountedfinancialassets/(liabilities) (166,628,938) 62,526,846 98,426,422 85,556,731 12,563,117 92,444,178
AUDITED ABRIDGED FINANCIAL STATEMENTSfor the year ended 28 February 2019
1834
/ PAG
E 8
- STE
WAR
D BA
NK
LIM
ITED
www.stewardbank.co.zwDirectors: B.T.R. Chidzero (Chairman), C. Maswi, D.T. Mandivenga, J. Gould, K. Chirairo*, K. Akosah-Bempah, N.N. Chadehumbe (Dr.), P.M. Mbizvo (Dr.), A. Chaavure*. * Executive. Registered Office: 101 Union Avenue Building, Kwame Nkrumah Avenue, Harare.