
Bangchak Corporation Plc.setlive.thailivestream.com/data-file/events/pdf/...EBITDA Performance - BCP...
47
Bangchak Corporation Plc. Opportunity Day FY2017 March 15, 2018
-
Upload
vuongkhanh -
Category
Documents
-
view
217 -
download
1
Transcript of Bangchak Corporation Plc.setlive.thailivestream.com/data-file/events/pdf/...EBITDA Performance - BCP...

Bangchak Corporation Plc.
Opportunity Day FY2017
March 15, 2018
FY2017 Performance Summary

BCP Group Portfolios – FY2017 Key Takeaways
Bangchak Corporation Plc. 3
Refinery & Trading
• Crude Run Throughout 2017 meet the target (111 KBD)
• Higher Market GRM
• 834 MB Inventory gain
• Completion of COGEN power plant
Bio-Based ProductGreen Power Plant
• Completed Amalgamation with KSL Green Innovation in Oct’17
• EBITDA +62% YoY despite high inventory loss
Capacity & Regional Expansion
• Additional 17.5 MWCOD of Solar Power Plant
• Invested in Wind power plant (14.4 MW) & Geothermal power plant (158 MW) net to BCPG
Marketing
• Gained Market Share to be at 15.4% for 2017
• Thruput per station significantly surpass AVG major oil
• Higher NPS, paving way to be the most admire brand

EBITDA Performance - BCP Group
Bangchak Corporation Plc. 4
Unit: THB Million
EBITDA FY Comparison
5,7567,596
2,527
2,3012,559
3,088326
529
323
286
20172016
Refinery
Marketing
Green Power Plant
Bio-Based Product
Natural Resource
Refinery
Marketing
Green Power Plant
Bio-Based Product
Natural Resource11,363 MB
13,663 MB
4,7735,778
01002003004005006007008009001,0001,1001,2001,3001,4001,5001,6001,7001,8001,9002,0002,1002,2002,3002,4002,5002,6002,7002,8002,9003,0003,1003,2003,3003,4003,5003,6003,7003,8003,9004,0004,1004,2004,3004,4004,5004,6004,7004,8004,9005,0005,1005,2005,3005,4005,5005,6005,7005,8005,9006,0006,100
FY/16 FY/17
Unit: THB Million
Net Profitattributable to owners of the Company
3.47 4.20
Unit: THB/Share
EPS
*Operating EBITDA = EBITDA exclude inventory gain/loss
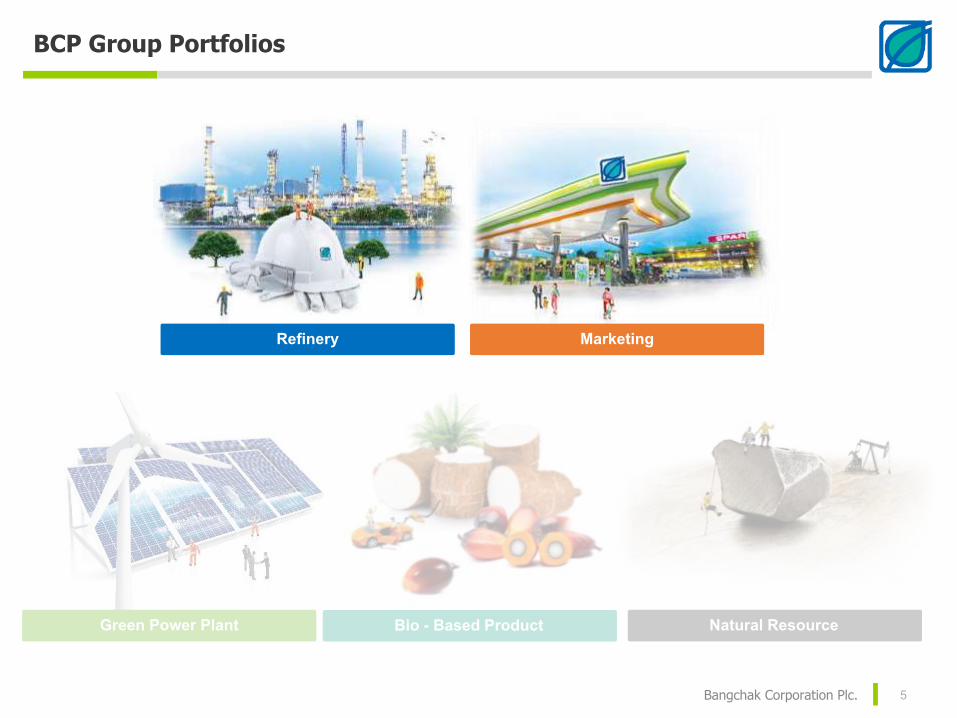
BCP Group Portfolios
Bangchak Corporation Plc. 5
Bio - Based Product Natural ResourceGreen Power Plant
Refinery Marketing

Refinery Business – Going beyond limit
Bangchak Corporation Plc. 6
37%29% 22% 26%
40%29%
63%71% 78% 74%
60%71%
Q1/17 Q2/17 Q3/17 Q4/17 . 2016 2017
10% 15% 10% 15% 14% 13%
2%2%
3%2% 1% 2%
51%50% 52%
51% 52% 51%
13% 12% 13% 9% 11% 12%
20% 17% 20% 19% 19% 19%
3% 2% 3% 3% 3% 3%
Q1/17 Q2/17 Q3/17 Q4/17 . 2016 2017
Production Profile
Actual Crude Run Unit: KBD
TAM
Product Yield
LPG
Gasoline
Jet
Diesel
Fuel Oil
UCO
Maximize high value product
Crude Sourcing
Diversify Crude Sourcing: Satisfactory GRM regardless of the changing crude sources
Domestic
Import
Maintaining High Crude Run Throughout the year
(TAM)
101.39
111.37
2016 2017
2017 Target111 KBD
Avg Mar’ 17 121.6 KBD
Record High Crude Run
Refinery Production slightly beat the target
And hit daily record high of 126 KBD in Mar’ 17
Q4/17 = 111.68 KBD
TAM
-10
-5
0
5
10
15
20
Q1/16 Q2/16 Q3/16 Q4/16 Q1/17 Q2/17 Q3/17 Q4/17
Refinery Business – Going strong
Bangchak Corporation Plc. 7
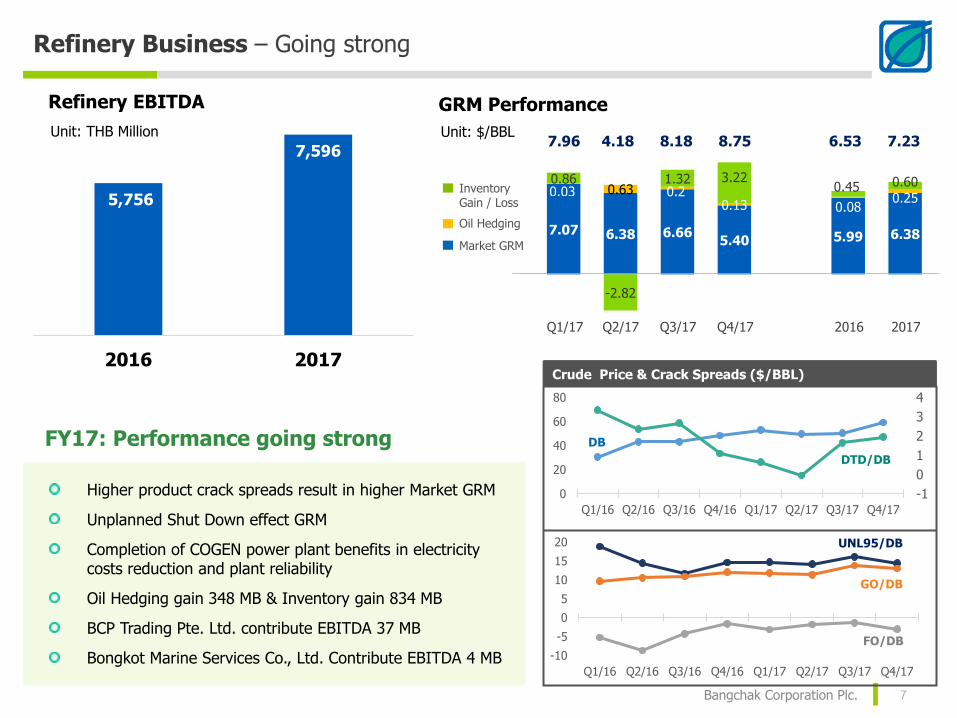
Refinery EBITDA
Unit: THB MillionUnit: THB Million
GRM Performance
Unit: $/BBL
Higher product crack spreads result in higher Market GRM
Unplanned Shut Down effect GRM
Completion of COGEN power plant benefits in electricity costs reduction and plant reliability
Oil Hedging gain 348 MB & Inventory gain 834 MB
BCP Trading Pte. Ltd. contribute EBITDA 37 MB
Bongkot Marine Services Co., Ltd. Contribute EBITDA 4 MB
FY17: Performance going strong
Crude Price & Crack Spreads ($/BBL)
5,756
7,596
2016 2017
DB
DTD/DB
GO/DB
UNL95/DB
FO/DB
-1
0
1
2
3
4
0
20
40
60
80
Q1/16 Q2/16 Q3/16 Q4/16 Q1/17 Q2/17 Q3/17 Q4/17
7.07 6.38 6.665.40 5.99 6.38
0.03 0.63 0.20.13 0.08
0.25
0.86
-2.82
1.32 3.220.45 0.60
7.96 4.18 8.18 8.75 6.53 7.23
Q1/17 Q2/17 Q3/17 Q4/17 2016 2017
Inventory Gain / Loss
Oil Hedging
Market GRM

Distribution channel – Retail market is our main priority
Bangchak Corporation Plc. 8
Total Sales Volume
235251
259
284
307
334
163
181 186 179190 184
4564 47 51
86
585569
92 93
82
112
0
50
100
150
200
250
300
350 Unit: Million Litre / Month (monthly AVG in the quarter)
Total Sales Volume Retail Market
Industrial Market
Wholesales
Exports
Unit: % Portion of total sales volume in FY2017
9%
28%
49%
14%
RetailMarket
IndustrialMarket
Wholesales
Export
Marketing Business
3,820 ML
2,196 ML
707 ML
1,121 ML3,609
2,180
807 934
3,820
2,196
7071,121
0
1,000
2,000
3,000
4,000
Retail Industrial Wholesales Export
2016
2017
Unit: Million Litre
(+6%)
2,527 2,301
2016 2017
Marketing Performance – Retail market is our main priority
Bangchak Corporation Plc. 9
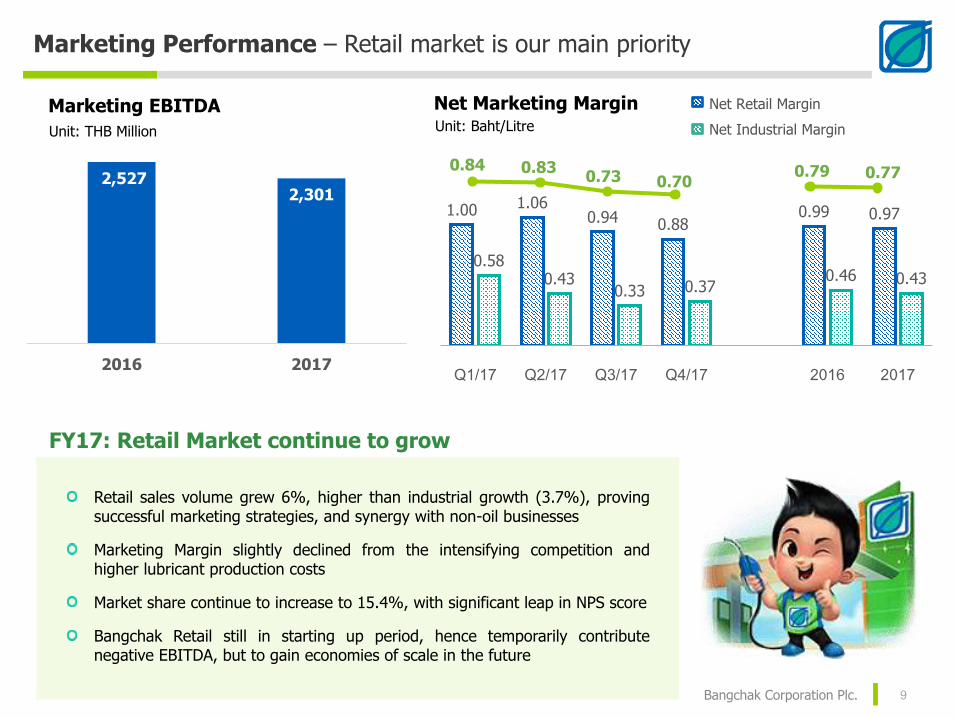
Marketing EBITDA
Unit: THB Million
Retail sales volume grew 6%, higher than industrial growth (3.7%), proving successful marketing strategies, and synergy with non-oil businesses
Marketing Margin slightly declined from the intensifying competition and higher lubricant production costs
Market share continue to increase to 15.4%, with significant leap in NPS score
Bangchak Retail still in starting up period, hence temporarily contribute negative EBITDA, but to gain economies of scale in the future
FY17: Retail Market continue to grow
Net Marketing MarginUnit: Baht/Litre
1.00 1.060.94 0.88
0.99 0.97
0.580.43
0.33 0.370.46 0.43
Q1/17 Q2/17 Q3/17 Q4/17 2016 2017
0.84 0.830.73 0.70
0.79 0.77
Net Retail Margin
Net Industrial Margin

Marketing Network – Increasing Market Share & Thruput per station
10
Market Share (Retail Channel)
Jan-Dec’16 Jan-Dec’17 ∆
37.0% 36.4%
15.1% 15.4%
12.9% 12.4%
12.8% 13.0%
8.2% 9.5%
1.5% 1.6%
5.6% 5.1%
4.9% 4.6%
1.8% 1.8%
Bangchak Corporation Plc.
15.2%
15.6%
14.9%
15.5% 15.6%
15.4%
15.4%
16.2%
15.8%15.7%
Jan Feb Mar Apr May Jun Jul Aug Sep Oct Nov Dec
2017 2016
Monthly Market Share (Retail Channel)
15.4%

Bangchak Service Station - Greenovative Experience
Bangchak Corporation Plc. 11
Standard Type 499 sites
COOP Type 615 sites
+62 New Service Stations
FY2017
service stations as of December 20171,114
+53 sites
+9 sites

Bangchak Non-Oil Business – Progression
Bangchak Corporation Plc. 12
446
FY2017
+62 branches
branches
branches
FY2017
+27 branches
33 stores
stores

BCP Group Portfolios
Bangchak Corporation Plc. 13
Bio - Based Products Natural ResourceGreen Power Plant
Refinery Marketing

Green Power Plant – Growing Capacity
Bangchak Corporation Plc. 14
125 130
20 30
158
14
2016 2017
Operating Capacity (MWac)
Solar
Solar
Geothermal
Wind
145
332
40% PetroWind Energy, Philippines
Investment: 26.49 MMUSD (918 MB)
Capacity net to BCPG: 20 MWac (14.4 MW operating)
33.33% Star Energy Group Holding, Indonesia
Investment: 355.69 MMUSD (11,956 MB)
Capacity net to BCPG: 182 MWac (158 MW operating)
2017 Highlight
Additional COD of Solar Power Plant both in Thailand & Japan (capacity +17.5 MWac)
2,559
3,088
2016 2017
Green Power Plant EBITDAUnit: THB Million

Bio-Based Product Business – to become a new growth engine
Bangchak Corporation Plc. 15
Bio-Based Products EBITDA
FY17: Turnaround and ready to grow
Biodiesel Business
810 kl/day, Palm
Operates under BBF BBGI holds 70%
Ethanol Business
200 kl/day, Sugar cane
Operates underKGI-BP
BBGI holds 100%
Kanchanaburi
Khonkaen
Ubonratchatani
Ayudhaya
ChachoengsaoBangkok
Operates under BBE BBGI holds 85%
Ethanol Business
150 kl/day, Casava
Ethanol Business
400 kl/day, Casava
Operates under UBE BBGI holds 21%
Operates under KGI-NP BBGI holds 100%
Ethanol Business
150 kl/day, Sugar cane
Accounting EBITDA +62% YoY despite inventory loss
Amalgamation between BBH & KSL GI completed on 31 Oct’17 and result from KSL Green Innovation start to contribute from Nov - Dec’17 at 21 MB
Together as a group, ethanol production capacity now the 2nd largest in Thailand
Profit Sharing from UBE 62 MB
Leading bio-based product player in Thailand after amalgamation
326
529
2016 2017
Unit: THB MillionUnit: THB Million

Bio-Based Product Business – Biodiesel business back on good track
Bangchak Corporation Plc. 16
Better performance from higher sales volume and
higher production volume
Utilization Rate 83% of 810,000 Lt./day capacity
B100 business continue to book inventory loss of
224 MB but operating EBITDA was growing +19%
Bangchak Biofuel
51 61
63 69
14
9
24
5
53 61
63 72
21
5
24
9
Q1/17 Q2/17 Q3/17 Q4/17 2016 2017
Production
Sales Volume
Biodiesel Plant: Production and Sales Volume
B5-B7
B3-B7
262 260
2016 2017
BBF EBITDAUnit: THB Million
Unit: Million Litre
15
20
25
30
35
40
45
CPO B100
CPO vs B100 Price
THB/Kg. THB/Lt.

Bio-Based Products – Ethanol business performance growth as planned
17
11.4
8.3 1
1.9
12.1
11
.5
43
.6
10.7
8.6 11.1
12.3
11
.1
42
.7
Q1/17 Q2/17 Q3/17 Q4/17 2016 2017
Production
Sales Volume
Production and Sales Volume
Unit: Million Litre
Bangchak Bioethanol
BBE full year performance contribution
Utilization 80% of capacity 150,000 Lt./Day
Ethanol from Cassava still benefit from the lower
raw material cost
42
228
2016 2017
BBE EBITDA
Unit: THB Million+443%
KSI Green Innovation
39 44
3742
KGI-Nampong KGI-Boploy
Production
Sales Vol
Unit: Million Litre
Production and Sales Volume
KGI Nampong & KGI Boploy are both molasses based ethanol plant
KGI Nampong - Utilization 71% of capacity 150,000 Lt./Day
KGI Boploy - Utilization 60% of capacity 200,000 Lt./Day

53.0349.68 50.43
59.31
41.43
53.14
Natural Resource Business - Nido Petroleum
Bangchak Corporation Plc. 18
Selling price higher from DB price recovery
Nido Sales Volume was lower corresponding to the Natural-Decline Production Curve
Cost reduction program still implemented
Impairment loss totaling of 1,528 MB mainly from impairment of Gurita area and impairment from cease development of Mid-Galoc area
FY17: Managing existing assets
Nido Petroleum EBITDA
Unit: THB Million
203
207
204
207
996
821
229
214
208
196
1,0
79
847
Q1/17 Q2/17 Q3/17 Q4/17 2016 2017
sales volume
production
Dubai Price ($/BBL)
*Production of Galoc & Nido / Matinloc
Production* (Unit: K.BBL – Net to Nido)
323 295
2016 2017

FY2017 Financial Performance

BCP Financial Highlight
Bangchak Corporation Plc. 20
Unit: THB Million 2016 2017
Assets 101,783 114,110 +12%
Liabilities 57,874 61,979 +7%
Shareholder’s Equity 43,909 52,132 +15%
Net Profit* 4,773 5,778 +21%
EPS (THB/Share) 3.47 4.20
2016 2017
78,349 77,922 -1%
41,137 37,439 -9%
37,212 40,483 9%
4,502 6,152 +37%
3.27 4.47
Consolidated Company Only
* Attributable to owners of the company
Important Events in 2017
Bangchak Corporation Plc. 21
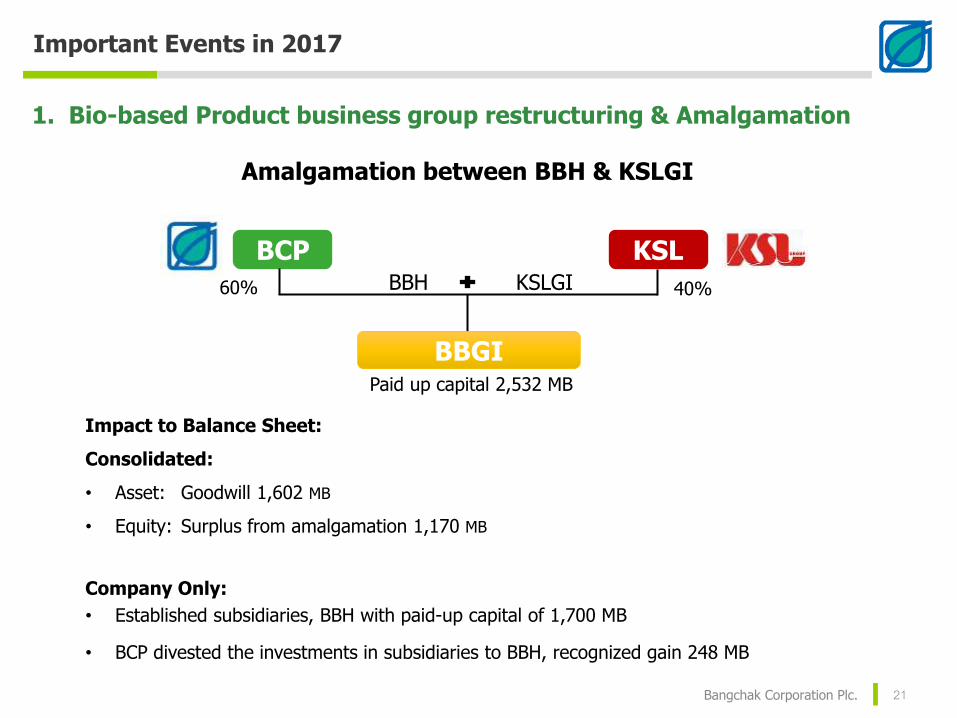
1. Bio-based Product business group restructuring & Amalgamation
Paid up capital 2,532 MB
BBH KSLGI
BCP KSL
60% 40%
BBGI
Amalgamation between BBH & KSLGI
Impact to Balance Sheet:
Consolidated:
• Asset: Goodwill 1,602 MB
• Equity: Surplus from amalgamation 1,170 MB
Company Only:
• Established subsidiaries, BBH with paid-up capital of 1,700 MB
• BCP divested the investments in subsidiaries to BBH, recognized gain 248 MB

Important Events in 2017
Bangchak Corporation Plc. 22
2. E&P Business Impairment Loss
• Future oil prices is still continuing to fluctuate
• Group concluded to cease the development plan in Mid-Galoc because the development is not commercially viable
Consolidated:
• Nido Assets Impairment 1,528 MB
Company Only:
• BCPE Investment Impairment 1,239 MB
3. Increase shareholding in Lithium America Corp. (LAC)
• Additional share purchase value 42.50 M CAD
No. of shares increased to currently 14.03 M shares, 16.1%
• FY2017 LAC share price increased result in Unrealized Gain (OCI) 2,722 MB

Important Events in 2017
Bangchak Corporation Plc. 23
4. BCPG Investment in Associated Companies (Wind & Geothermal Power Plant)
5. Corporate Income Tax Return
6. Loan Restructuring
• 40% PetroWind Energy, Philippines Investment: 918 MB
• 33.33% Star Energy Group Holding, Indonesia Investment: 11,956 MB
• Tax returns 897 MB from the corporate income tax in 2007, 2009 and 2010
• Interest income from the tax return 401 MB (booked as Other Income)
• Mainly reduced from BCP loan restructuring
• Debenture Repayment of 2,000 MB
• USD loan Repayment of 100 MUSD
• Mainly increased from BCPG loan drawdown of 150 MUSD
Statement of Income - Consolidated
Bangchak Corporation Plc. 24
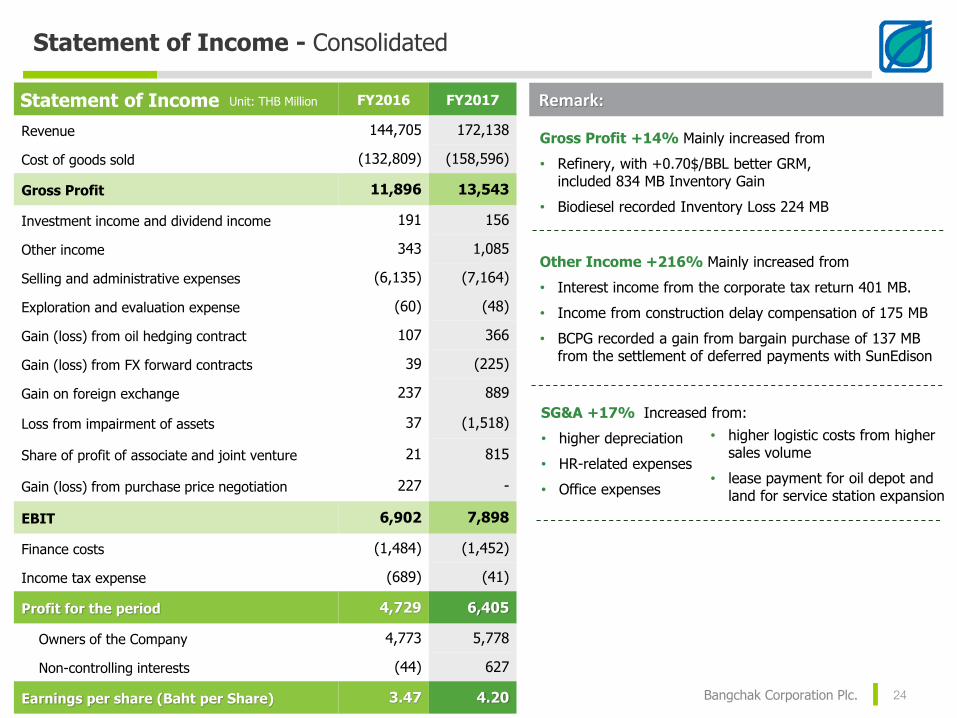
Gross Profit +14% Mainly increased from
• Refinery, with +0.70$/BBL better GRM, included 834 MB Inventory Gain
• Biodiesel recorded Inventory Loss 224 MB
Remark:
Other Income +216% Mainly increased from
• Interest income from the corporate tax return 401 MB.
• Income from construction delay compensation of 175 MB
• BCPG recorded a gain from bargain purchase of 137 MB from the settlement of deferred payments with SunEdison
SG&A +17% Increased from:
• higher depreciation
• HR-related expenses
• Office expenses
Statement of Income FY2016 FY2017
Revenue 144,705 172,138
Cost of goods sold (132,809) (158,596)
Gross Profit 11,896 13,543
Investment income and dividend income 191 156
Other income 343 1,085
Selling and administrative expenses (6,135) (7,164)
Exploration and evaluation expense (60) (48)
Gain (loss) from oil hedging contract 107 366
Gain (loss) from FX forward contracts 39 (225)
Gain on foreign exchange 237 889
Loss from impairment of assets 37 (1,518)
Share of profit of associate and joint venture 21 815
Gain (loss) from purchase price negotiation 227 -
EBIT 6,902 7,898
Finance costs (1,484) (1,452)
Income tax expense (689) (41)
Profit for the period 4,729 6,405
Owners of the Company 4,773 5,778
Non-controlling interests (44) 627
Earnings per share (Baht per Share) 3.47 4.20
Unit: THB Million
• higher logistic costs from higher sales volume
• lease payment for oil depot and land for service station expansion

Statement of Income - Consolidated
Bangchak Corporation Plc. 25
Remark:
Loss on FX forward contracts Mainly increased from
BCPG forward contracts loss of 304 MB from THB appreciation
Gain on Foreign Exchange Mainly increased from
• BCP Net FX gain from operations (oil buying-selling) 416 MB
• BCP Net FX gain from foreign currency liabilities 392 MB
• BCPG FX gain from foreign currency liabilities 72 MB
Statement of Income FY2016 FY2017
Revenue 144,705 172,138
Cost of goods sold (132,809) (158,596)
Gross Profit 11,896 13,543
Investment income and dividend income 191 156
Other income 343 1,085
Selling and administrative expenses (6,135) (7,164)
Exploration and evaluation expense (60) (48)
Gain (loss) from oil hedging contract 107 366
Gain (loss) from FX forward contracts 39 (225)
Gain on foreign exchange 237 889
Loss from impairment of assets 37 (1,518)
Share of profit of associate and joint venture 21 815
Gain (loss) from purchase price negotiation 227 -
EBIT 6,902 7,898
Finance costs (1,484) (1,452)
Income tax expense (689) (41)
Profit for the period 4,729 6,405
Owners of the Company 4,773 5,778
Non-controlling interests (44) 627
Earnings per share (Baht per Share) 3.47 4.20
Unit: THB Million
Share of profit from Associate & JV Mainly increased from
• BCPG investment acquisition in Wind & Geothermal Power Plant (profit sharing totaling of 749 MB in 2017)

Financial Position - Consolidated
26Bangchak Corporation Plc
Unit: THB Million
Current Liabilities
Long Term Debt
Total Equity
Other Non Current Liabilities
(Including current portion of L/T debt)
43,90952,132
3,353
3,470
32,143
36,857
6,168
7,5898,766
10,016
7,444
4,046
31 DEC 16 31 DEC 17
Liabilities & Equity
31 Dec 16 31 Dec 17
11,170
29,770
46,462
48,0492,562
2,734
14,560
15,720
6,022
7,511
21,006
10,325
31 DEC 16 31 DEC 17
Cash and Equivalents & Short term Investment
Other Current Assets
Inventory
PP&E
Other Non Current Assets
101,783
Assets
31 Dec 16 31 Dec 17
Account Receivable
114,110
101,783
114,110
Account Payable
Short term loan

Financial Position - Consolidated
27Bangchak Corporation Plc
Cash and Equivalents & ST Investment
- 10,681 MB
mainly from cash paid for asset / acquisitions,
debt repayment and dividend payment
Unit: THB Million
2,562 2,734
14,560 15,720
6,0227,511
21,00610,325
31 DEC 16 31 DEC 17
Cash and Equivalents & Short term Investment
Other Current Assets
Inventory
44,150
Current Assets
31 Dec 16 31 Dec 17
Inventory
+1,160 MB
mainly due to petroleum products inventories,
of which its average cost rose
Trade Account Receivable
+ 1,489 MB
from higher finished product sales volume &
price, BCPT’s higher transation volume, and
from amalgamation with KSLAccount Receivable
36,291

Financial Position - Consolidated
28Bangchak Corporation Plc
Unit: THB Million
PP&E
+1,587 MB mainly from
Refinery machinery, marketing, office equipment increased by 4,309 MB
Work in progress of BCPG Plc. of 654 MB
PPE increase from amalgamation (BBGI) of 1,491 MB
Depreciation for FY2017 of 4,780 MB
11,170
29,770
46,462
48,049
31 DEC 16 31 DEC 17
PP&E
Other NonCurrent Assets
57,632
Non-Current Assets
31 Dec 16 31 Dec 17
77,820
Other Non Current Assets
+18,738 MB mainly from
Investment in Associates and JV increased 13,698 MB (BCPG acquisition in Wind and Geothermal Power Plant)
Additional share acquisition in LAC of 1,089 MB, and net fair value increase in LAC investment of 2,722 MB
Intangible Assets decreased 1,281 MB mainly from Gurita and Mid-Galoc oil field impairment

Financial Position - Consolidated
29Bangchak Corporation Plc
Short term loan -3,398 MB mainly from repayment of foreign currency loan
Account Payable
+1,250 MB mainly from BCPT’s higher transaction volume
Other Current Liabilities
+1,421 MB mainly from
Excise tax and Oil Fund expense payable which increased
1,968 MB as payment term changed from daily to monthly6,1687,589
8,766
10,016
7,4444,046
31 DEC 16 31 DEC 17
Current Liabilities
31 Dec 16 31 Dec 17
Unit: THB Million
22,37821,651
Current Liabilities
Account Payable
Short term loan

Financial Position - Consolidated
30Bangchak Corporation Plc
3,353 3,470
32,14336,857
31 DEC 16 31 DEC 17
Non- Current Liabilities
31 Dec 16 31 Dec 17
Unit: THB Million
35,496
40,327
Long Term Debt
Other Non CurrentLiabilities
(Including current portion of L/T debt)
Long-term debt
+4,714 MB
Loan & Debt repayment 4,161 MB
Loan drawdown 8,868 MB (mainly from BCPG)
Increased from amalgamation (BBGI) 400 MB
Decreased from effect of THB appreciation 393 MB

Financial Position - Consolidated
31Bangchak Corporation Plc
Equities increased mainly from
Retained Earnings +5,778 MB from FY2017 Net Profit
Dividend Payment 2,822 MB (BCP only)
Capital Surplus increased from the effect of amalgamation (BBGI) of 1,170 MB
Other component of equity increased by 2,290 MB from change of FX translation differences for foreign operations and fair value increase in available-for-sale investment
4,366 6,482
25,08527,985
14,337
15,254121
2,411
31 DEC 16 31 DEC 17
Equity
31 Dec 16 31 Dec 17
Unit: THB Million
43,909
52,132
Other Components
Non-controlling Interests
Retained Earnings
Paid up capital, Share premium
and capital surplus

Cash Flow - Consolidated
Bangchak Corporation Plc. 32
Beginning Cash19,287 MB
Change in Cash(8,870 MB)
Ending Cash10,106 MB
FX adjustment(310) MB
FY17 Sources and Uses of Cash
Unit: THB Million
14,150 13,388
8,896 5,522
1,999
2,380
296 9,312
3,311 299
Cash From Operation
(CFO)
Selling of ST investment & PPE
Funding
25,341
Sources of Cash Uses of Cash
34,211
Investment in intangible & other assets
Investment in subsidiaries, associates and JV
Dividend, Interest Received, and others
Debt Service & Repayment
Investment in PPE
Dividend Paid
Income Tax Paid

2018 Going Forward
34
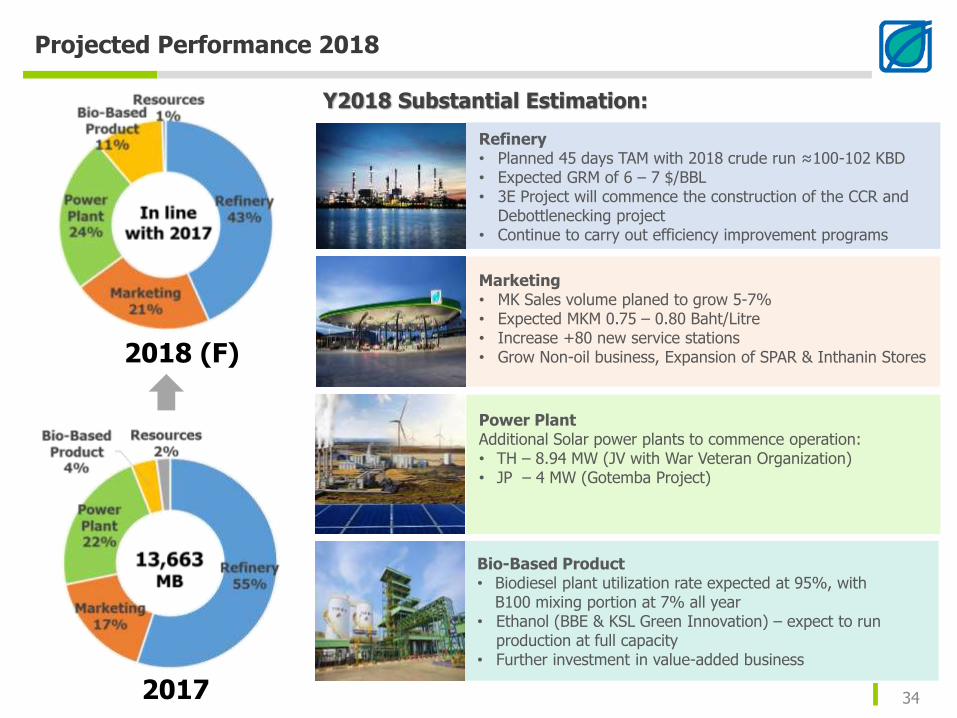
Projected Performance 2018
2017
2018 (F)
Power PlantAdditional Solar power plants to commence operation:• TH – 8.94 MW (JV with War Veteran Organization)• JP – 4 MW (Gotemba Project)
Marketing• MK Sales volume planed to grow 5-7% • Expected MKM 0.75 – 0.80 Baht/Litre• Increase +80 new service stations• Grow Non-oil business, Expansion of SPAR & Inthanin Stores
Refinery• Planned 45 days TAM with 2018 crude run ≈100-102 KBD• Expected GRM of 6 – 7 $/BBL• 3E Project will commence the construction of the CCR and
Debottlenecking project• Continue to carry out efficiency improvement programs
Y2018 Substantial Estimation:
Bio-Based Product • Biodiesel plant utilization rate expected at 95%, with
B100 mixing portion at 7% all year • Ethanol (BBE & KSL Green Innovation) – expect to run
production at full capacity• Further investment in value-added business
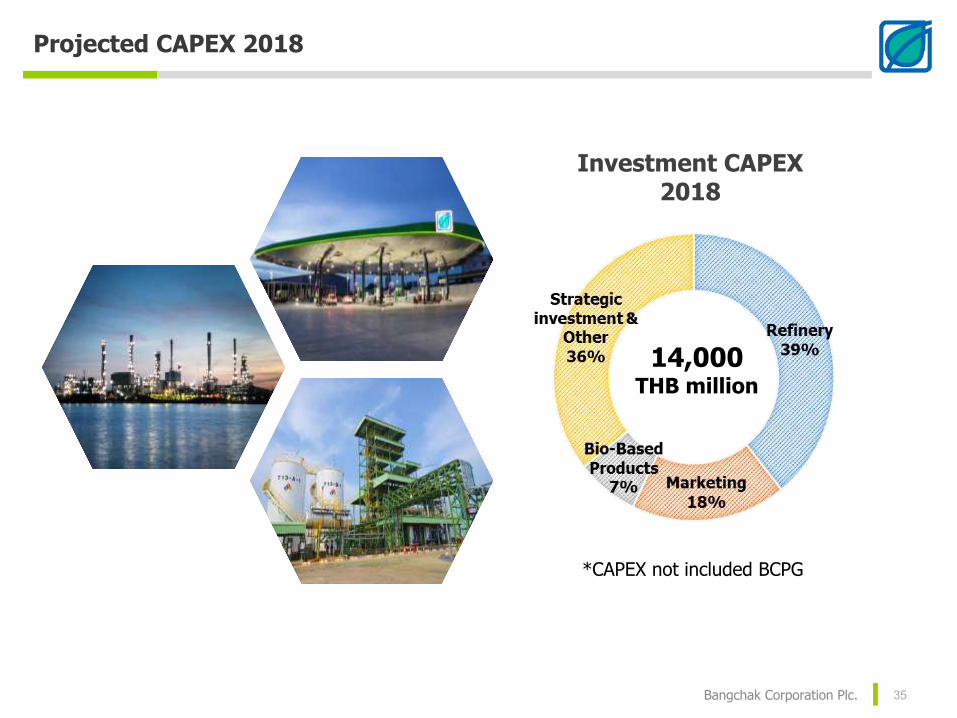
Projected CAPEX 2018
Bangchak Corporation Plc. 35
Investment CAPEX 2018
14,000THB million
*CAPEX not included BCPG

Refinery – 2018 Turnaround Maintenance Plan
Bangchak Refinery TAM 2018 Plan Period: 45 days in Q2/2018
Project Tie-in:
• Continuous Catalyst Regeneration Unit (CCR)• Hydrocracker Unit (HCU)• Crude Distillation Unit (CDU) 3

Refinery - On-going value enhancement projects
Bangchak Corporation Plc. 37
YES-RProject
3E Project
Y2016 Y2018 Y2019 Y2020
EPC Award
(Q1/18)Completion
EPC Award
(Q1/18)Completion
EPC Award
Completion
Co Generation Power Plant #3 (≈12 MW)
Continuous Catalyst Regeneration Unit (CCR)
(CCR: Higher Capacity & maintenance cycle extension)
Prepare for Bid Evaluation
Debottlenecking
#1: Hydrocracker Unit (HCU) Revamping
(Higher Optimal Crude Run: Distillate)
Prepare for Bid Evaluation
#2: Debottlenecking CDU & NPU & ISOU & KTU
(Higher Optimal Crude Run: Light & Middle Distillate)
Front end engineering design & invitation to bid
YES-R Project:
Continuous Improvements that focused on reliability, enhanced efficiency, safety, and yield improvement
Automation & Digitalization
Project Timeline
Completed in 2017

BCP service station & non-oil roll out plan
Bangchak Corporation Plc. 38
+340 +30
+200 Stores
Service StationsIn 2018+80
In 2018
StoresIn 2018
Network ExpansionFocus on center of demand
Current Network Optimization• Loyalty program improvement
• High quality & Environmental friendly products
• Standardized & Fast serviceCompetency improvement By the help of non-oil businesses

BCPG – Current Projects on hand
Bangchak Corporation Plc. 39
Implementation of blockchaintechnology to trade electricity
• Smart Green Community project together with SanSiri Plc. to launch pilot project in Mid-2018
• Peer to peer energy trading within Smart Green Community to launch in late 2018
Existing projects to be COD in 2018
8.94 MW
Solar4 MW
Solar

BBGI – IPO on process
Bangchak Corporation Plc. 40
IPO expected around Q4/2018
Current Business
Biodiesel business
Capacity 810,000 L/D
PCM commercial plant
Refined Glycerin
Ethanol business
Capacity 500,000 L/D
BBE Productivity improvement(operating day 313->330)
KGI-BP (200->300 kL/D)
KGI-NP (150->350 kL/D)
New Business
New Potential ProjectsBiodiesel Plant of BBF
THANK [email protected] Tel. +662 335 4390, 335 8518
www.bangchak.co.th
click Investor Relations
Disclaimer : The information contained herein is being furnished on a confidential basis for discussion purposes only and only for the use
of the recipient, and may be subject to completion or amendment through the delivery of additional documentation. Except as otherwise
provided herein, this document does not constitute an offer to sell or purchase any security or engage in any transaction. The information
contained herein has been obtained from sources that Bangchak Corporation Public Company Limited (“BCP”) considers to be reliable;
however, BCP makes no representation as to, and accepts no responsibility or liability for, the accuracy or completeness of the information
contained herein. Any projections, valuations and statistical analyses contained herein have been provided to assist the recipient in the
evaluation of the matters described herein; such projections, valuations and analyses may be based on subjective assessments and
assumptions and may utilize one among alternative methodologies that produce differing results; accordingly, such projections, valuations
and statistical analyses are not to be viewed as facts and should not be relied upon as an accurate representation of future events. The
recipient should make an independent evaluation and judgment with respect to the matters contained herein.

Appendix
Financial Figures

Profit and Loss (Consolidated)
43
Unit: THB Million Q4/16 Q3/17 Q4/17 YoY QoQ
Sales revenue 40,481 39,009 46,306 14% 19%
Cost of goods sold (36,704) (35,450) (42,711) 16% 20%
Gross profit 3,776 3,559 3,594 -5% 1%
Investment income and other income 177 283 479 170% 69%
Selling and administrative expenses (2,064) (1,770) (2,332) 13% 32%
Exploration and evaluation expenses (12) (12) (11) -10% -6%
Gain (loss) from selling asset 6 (4) (21) -442% -405%
Gain (loss) from crude and product oil price hedging contract
(66) 86 46 169% -47%
Gain (loss) from foreign currencies forward contract (32) (259) 17 152% 106%
Share of profit of associate and joint ventures 16 420 324 N/A -23%
Gain on bargain purchase 0 0 0 N/A N/A
EBIT 1,800 2,303 2,095 16% -9%
Add back: Depreciation and amortization 1,261 1,277 1,398 11% 10%
EBITDA 3,061 3,580 3,494 14% -2%
Gain on foreign exchange (253) 299 227 190% -24%
Reversal of allowance for gain/(loss) from impairment of assets
31 (1,358) (78) -349% 94%
Finance costs (415) (379) (380) -9% 0.1%
Income tax expense (167) 630 (298) 78% -53%
Non-controlling interests 77 179 181 134% 1%
Profit attribute to owners of the Company 918 1,316 1,386 51% 5%
EPS (Baht/Share) 0.67 0.96 1.01

Profit and Loss (Consolidated)
44
Unit: THB Million 2015 2016 2017 YoY
Sales revenue 151,140 144,705 172,138 19%
Cost of goods sold (139,686) (132,809) (158,596) 19%
Gross profit 11,454 11,896 13,543 14%
Investment income and other income 543 527 1,205 129%
Selling and administrative expenses (5,100) (6,135) (7,164) 17%
Exploration and evaluation expenses 0 (60) (48) -20%
Gain (loss) from selling asset 25 7 35 429%
Gain (loss) from crude and product oil price hedging contract
(407) 107 366 240%
Gain (loss) from foreign currencies forward contract (155) 39 (225) -672%
Share of profit of associate and joint ventures 12 21 815 N/A
Gain on bargain purchase 0 227 0 N/A
EBIT 6,373 6,629 8,527 29%
Add back: Depreciation and amortization 4,708 4,734 5,135 8%
EBITDA 11,081 11,363 13,663 20%
Gain on foreign exchange 178 237 889 276%
Reversal of allowance for gain/(loss) from impairment of assets
(65) 37 (1,518) N/A
Finance costs (1,615) (1,484) (1,452) -2%
Income tax expense (673) (689) (41) -94%
Non-controlling interests (53) (44) 627 N/A
Profit attribute to owners of the Company 4,151 4,773 5,778 21%
EPS (Baht/Share) 3.01 3.47 4.20

EBITDA Structure - Consolidated
45
1/ EBITDA from Refinery Business of the Company, BCP Trading Pte. Ltd. and Bongkot Marine Services Co., Ltd.2/ EBITDA from Marketing Business of the Company, Bangchak Greenet Co.,Ltd., Bangchak Retail Co., Ltd., and share of profit from Oam Suk
Social Enterprise Co., Ltd.3/ EBITDA from Power Plant Business of BCPG Plc. and its subsidiaries 4/ EBITDA from BBGI Co., Ltd. (Bangchak Biofuel Co., Ltd., Bangchak Bioethanol (Chachoengsao) Co., Ltd., KSL Green Innovation Plc.) and share of
profit from Ubon Bioethanol Co., Ltd.5/ EBITDA from Natural Resources business of Nido Petroleum Limited, BCP Energy International Pte. Ltd. and BCP Innovation Pte. Ltd.
EBITDA Structure of the Company and its subsidiaries Q4/2016 Q3/2017 Q4/2017 YoY QoQ
Total Revenue 40,481 39,009 46,306 14% 19%
Accounting EBITDA 3,061 3,580 3,494 14% -2%
Refinery Business 1/ 2,367 2,198 2,256 -5% 3%
Marketing Business 2/ (3) 474 302 N/A -36%
Power Plant Business3/ 568 781 812 43% 4%
Bio-Based Product Business4/ 131 159 132 1% -17%
Resource Business5/ 71 44 16 -77% -62%
EBITDA Others 6/ (0) (35) (30) N/A 13%
Elimination (73) (41) 6 108% 115%
Profit attributable to owners of the Company 918 1,316 1,386 51% 5%
Basic earnings per share (Baht) 0.67 0.96 1.01

EBITDA Structure - Consolidated
46
1/ EBITDA from Refinery Business of the Company, BCP Trading Pte. Ltd. and Bongkot Marine Services Co., Ltd.2/ EBITDA from Marketing Business of the Company, Bangchak Greenet Co.,Ltd., Bangchak Retail Co., Ltd., and share of profit from Oam Suk
Social Enterprise Co., Ltd.3/ EBITDA from Power Plant Business of BCPG Plc. and its subsidiaries 4/ EBITDA from BBGI Co., Ltd. (Bangchak Biofuel Co., Ltd., Bangchak Bioethanol (Chachoengsao) Co., Ltd., KSL Green Innovation Plc.) and share of
profit from Ubon Bioethanol Co., Ltd.5/ EBITDA from Natural Resources business of Nido Petroleum Limited, BCP Energy International Pte. Ltd. and BCP Innovation Pte. Ltd.
EBITDA Structure of the Company and its subsidiaries 2015 2016 2017 YoY
Total Revenue 151,140 144,705 172,138 19%
Accounting EBITDA 11,081 11,363 13,663 20%
Refinery Business 1/ 5,097 5,756 7,596 32%
Marketing Business 2/ 2,497 2,527 2,301 -9%
Power Plant Business3/ 3,005 2,559 3,088 21%
Bio-Based Product Business4/ 355 326 529 62%
Resource Business5/ 472 323 286 -11%
EBITDA Others 6/ (171) 99 (3) -103%
Elimination (173) (228) (134) 41%
Profit attributable to owners of the Company 4,151 4,773 5,778 21%
Basic earnings per share (Baht) 3.01 3.47 4.20

Financial Ratio (Consolidated)
47
1/ Profit and Total equity attributable to owners of the Company
Note: ROE, ROA are annualized figures.
Q4/16 Q3/17 Q4/17 2016 2017
Profitability Ratios (%)
Gross Margin 9.30% 9.12% 7.76% 8.22% 7.87%
EBITDA Margin 7.56% 9.18% 7.84% 7.85% 7.94%
Net Profit Margin 2.44% 3.83% 3.38% 3.27% 3.72%
Return on Equity (ROE) 1/ 12.70% 13.09% 13.57%
Return on Assets (ROA) 7.50% 7.09% 7.31%
Dec 31,2016
Sep 30,2017
Dec 31,2017
Liquidity Ratios (times)
Current Ratio 1.69 1.61 1.52
Quick Ratio 1.10 0.85 0.80
Financial Policy Ratios (times)
Interest bearing debt to Equity (IBD to Equity) 0.86 0.94 0.78
Net Interest bearing debt to Equity (Net IBD to Equity) 0.38 0.70 0.59
Dec 31,2016
Sep 30,2017
Dec 31,2017
DSCR 1.80 2.43 2.50


