
BANCID - jrcb.gov.bdjrcb.gov.bd/bangla/images/pdf/BANCID_Newsletter_2016.pdf · Humayun Kabir,...
30
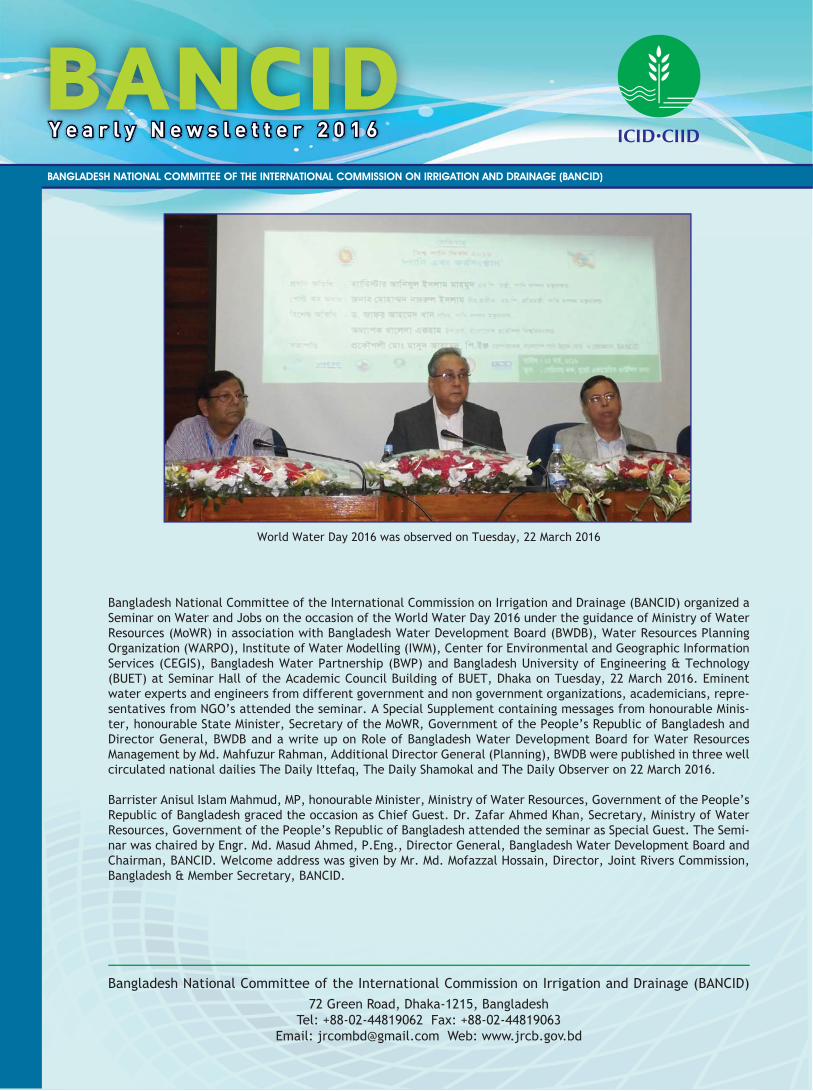
Yearly Newsletter 2016 Ye a r l y N ew s l e t te r 2 0 1 6 BANCID Yearly Newsletter 2016 BANGLADESH NATIONAL COMMITTEE OF THE INTERNATIONAL COMMISSION ON IRRIGATION AND DRAINAGE (BANCID) Bangladesh National Committee of the International Commission on Irrigation and Drainage (BANCID) organized a Seminar on Water and Jobs on the occasion of the World Water Day 2016 under the guidance of Ministry of Water Resources (MoWR) in association with Bangladesh Water Development Board (BWDB), Water Resources Planning Organization (WARPO), Institute of Water Modelling (IWM), Center for Environmental and Geographic Information Services (CEGIS), Bangladesh Water Partnership (BWP) and Bangladesh University of Engineering & Technology (BUET) at Seminar Hall of the Academic Council Building of BUET, Dhaka on Tuesday, 22 March 2016. Eminent water experts and engineers from different government and non government organizations, academicians, repre- sentatives from NGO’s attended the seminar. A Special Supplement containing messages from honourable Minis- ter, honourable State Minister, Secretary of the MoWR, Government of the People’s Republic of Bangladesh and Director General, BWDB and a write up on Role of Bangladesh Water Development Board for Water Resources Management by Md. Mahfuzur Rahman, Additional Director General (Planning), BWDB were published in three well circulated national dailies The Daily Ittefaq, The Daily Shamokal and The Daily Observer on 22 March 2016. Barrister Anisul Islam Mahmud, MP, honourable Minister, Ministry of Water Resources, Government of the People’s Republic of Bangladesh graced the occasion as Chief Guest. Dr. Zafar Ahmed Khan, Secretary, Ministry of Water Resources, Government of the People’s Republic of Bangladesh attended the seminar as Special Guest. The Semi- nar was chaired by Engr. Md. Masud Ahmed, P.Eng., Director General, Bangladesh Water Development Board and Chairman, BANCID. Welcome address was given by Mr. Md. Mofazzal Hossain, Director, Joint Rivers Commission, Bangladesh & Member Secretary, BANCID. Bangladesh National Committee of the International Commission on Irrigation and Drainage (BANCID) 72 Green Road, Dhaka-1215, Bangladesh Tel: +88-02-44819062 Fax: +88-02-44819063 Email: [email protected] Web: www.jrcb.gov.bd World Water Day 2016 was observed on Tuesday, 22 March 2016 ICID • CIID
Transcript of BANCID - jrcb.gov.bdjrcb.gov.bd/bangla/images/pdf/BANCID_Newsletter_2016.pdf · Humayun Kabir,...
Y e a r l y N e w s l e t t e r 2 0 1 6Y e a r l y N e w s l e t t e r 2 0 1 6BANCIDY e a r l y N e w s l e t t e r 2 0 1 6
BANGLADESH NATIONAL COMMITTEE OF THE INTERNATIONAL COMMISSION ON IRRIGATION AND DRAINAGE (BANCID)
Bangladesh National Committee of the International Commission on Irrigation and Drainage (BANCID) organized a Seminar on Water and Jobs on the occasion of the World Water Day 2016 under the guidance of Ministry of Water Resources (MoWR) in association with Bangladesh Water Development Board (BWDB), Water Resources Planning Organization (WARPO), Institute of Water Modelling (IWM), Center for Environmental and Geographic Information Services (CEGIS), Bangladesh Water Partnership (BWP) and Bangladesh University of Engineering & Technology (BUET) at Seminar Hall of the Academic Council Building of BUET, Dhaka on Tuesday, 22 March 2016. Eminent water experts and engineers from different government and non government organizations, academicians, repre-sentatives from NGO’s attended the seminar. A Special Supplement containing messages from honourable Minis-ter, honourable State Minister, Secretary of the MoWR, Government of the People’s Republic of Bangladesh and Director General, BWDB and a write up on Role of Bangladesh Water Development Board for Water Resources Management by Md. Mahfuzur Rahman, Additional Director General (Planning), BWDB were published in three well circulated national dailies The Daily Ittefaq, The Daily Shamokal and The Daily Observer on 22 March 2016.
Barrister Anisul Islam Mahmud, MP, honourable Minister, Ministry of Water Resources, Government of the People’s Republic of Bangladesh graced the occasion as Chief Guest. Dr. Zafar Ahmed Khan, Secretary, Ministry of Water Resources, Government of the People’s Republic of Bangladesh attended the seminar as Special Guest. The Semi-nar was chaired by Engr. Md. Masud Ahmed, P.Eng., Director General, Bangladesh Water Development Board and Chairman, BANCID. Welcome address was given by Mr. Md. Mofazzal Hossain, Director, Joint Rivers Commission, Bangladesh & Member Secretary, BANCID.
Bangladesh National Committee of the International Commission on Irrigation and Drainage (BANCID)72 Green Road, Dhaka-1215, Bangladesh
Tel: +88-02-44819062 Fax: +88-02-44819063Email: [email protected] Web: www.jrcb.gov.bd
World Water Day 2016 was observed on Tuesday, 22 March 2016
ICID•CIID
02 | BANCID
Yearly Newsletter 2016BANCID
BANGLADESH NATIONAL COMMITTEE OF THE INTERNATIONAL COMMISSION ON IRRIGATION AND DRAINAGE
Editorial
The Publication of Annual Newsletter of Bangladesh National Committee of the International Commission on Irrigation and Drainage (BANCID) is a tremendous initiative taken by the Study and Publication Sub-Committee of BANCID. The aim of this publication is to disseminate information on the activities of BANCID and to receive feedback from the concerned communities.
In this fifth issue of the newsletter, write ups/articles on water related issues have been included. We are thankful to the contributors/organizations for submitting the write ups/articles. We will be very much grateful to receive comments and suggestions from the concerned organizations on our initiative of publishing this newsletter.
Study and Publication Sub-Committee, BANCID
BANCID Study and Publication Sub-Committee1. Dr. M. Shahjahan Mondal, Professor, IWFM, BUET Convener
2. Dr. K. Azharul Haq, President, BWP Member
3. Mr. Md. Sarafat Hossain Khan, Director General, WARPO Member
4. Mr. Md. Mahfuzur Rahman Additional Director General (Western Region), BWDB Member
5. Mr. Md. Mofazzal Hossain, Member, JRC Member
6. Mr. Md. Hafizullah Chowdhury, Chief Engineer, BADC Member
7. Mr. Motaher Hossain, Additional Chief Engineer Ganges Barrage Study Project, BWDB Member
8. Mr. K. M. Humayun Kabir, Proiect Director, Capital (Pilot) Dredging of Member River System in Bangladesh, BWDB
9. Dr. Nazmun Nahar Karim, Principal Scientific Officer, BARC Member
10. Mr. Fazlur Rashid, Director, Planning-I, BWDB Member
11. Mr. Abu Saleh Khan, Deputy Executive Director (Operation), IWM Member
12. Mr. Malik Fida A. Khan, Deputy Executive Director (Operation), CEGIS Member
13. Dr. Atikur Rahman, Associate Professor, Department of Irrigation & Water Management, BAU Member
14. Dr. Md. Ruhul Amin, Director (Wetland), DBHWD Member
15. Mr. Kazi Rezaul Karim, Chief Scientific Officer, RRI Member
16. Mr. Mohammad Alamgir, Principal Scientific Officer (EF&F), WARPO Member
17. Mr. Md. Mahmudur Rahman, Director, JRC and Member Secretary, BANCID Member Secretary
ICID•CIID
BANCID | 03
From Member Secretary’s Desk
ACTIVITIES OF THE BANGLADESH NATIONAL COMMITTEE OF THE INTERNATIONAL COMMISSION ON IRRIGATION AND DRAINAGE (BANCID) The International Commission on Irrigation and Drainage (ICID) was established in 1950 with the objective of promoting technical, economic and social cooperation with regards to irrigation and drainage. In 1957, the ICID’s mandate was extended to cover flood control and river training. Bangladesh became member of ICID in 1973. BANCID was constituted under the Ministry of Water Resources since its establishment. The members of BANCID are appointed from different organizations actively engaged in the field of irrigation, drainage, flood control, river training works and other water related activities including one representative from Ministry of Water Resources. BANCID holds national and international seminars in Bangladesh. BANCID also observes World Water Day on 22 March every year since 1993.
On the occasion of the World Water Day 2016, BANCID organized a seminar on 22 March 2016. Two key note papers related to the theme of the Seminar Water and Jobs were presented in the seminar, one by Dr. Md. Abdul Matin, Professor, Department of Water Resources Engineering, Bangladesh University of Engineering & Technology (BUET) and the other by Dr. K. Azharul Haq, President, Bangladesh Water Partnership (BWP).
Four distinguished discussants discussed on the papers presented as well as the theme of the occasion. The designated discussants were (i) Mr. Md. Mahfuzur Rahman, Additional Director General (Planning), BWDB, (ii) Mr. Md. Akramul Haque, Chief Executive Officer, DASCOH, (iii) Mr. Md. Sarafat Hossain Khan, Director General, WARPO and (iv) Dr. Md. Monowar Hossain, Executive Director, IWM. Besides, many participants took part in the open discussions and expressed their valuable comments and observations.
The following observations and recommendations emerged from the Seminar:
1. The seminar observed that life and livelihood of the millions of people of Bangladesh have been revolving around waters of the rivers in Bangladesh over the years. Bangladesh is the lowest riparian country of the three mighty rivers viz the Ganges, the Brahmaputra, and the Meghna due to its geographical location. The distributation of available water in Bangladesh is extremely skewed i.e abundance of water during monsoon and very less water during dry season which causes severe flooding during monsoon and serious water scarcity during dry season. Being lowest riparian country of the Ganges, Brahmaputra and Meghna river basins, Bangladesh has no control over its water resources and it alone cannot manage its water resources. Therefore, sustainable development of water resources of Bangladesh depends on equitable sharing and integrated water resources management of the transboundary waters.
2. The seminar noted that potentials of surface water resources in this region should be explored to increase food production instead of over exploitation of ground water. It was also suggested for optimum use of available surface water, especially during the dry season.
3. The seminar expressed its view to give priority for constructive and meaningful dialogue with the neighbouring countries in order to receive Bangladesh's equitable shares of water of the common rivers. It also recommends that necessary means and measures should be undertaken for basinwise river management of the transboundary rivers in a comprehensive, integrated and equitable manner.
4. It was opined in the seminar that the Ganges Barrage Project should be implemented on an urgent basis in order to meaningfully utilize the water of the Ganges received by Bangladesh under the provision of the Ganges Water Treaty of 1996 which would support various sectors like agriculture, forestry, fisheries, navigation, salinity control, ground water recharge and overall ecosystem of the Ganges dependant areas (GDA) in Bangladesh and will also create scope of ample opportunity in water related job.
5. The Brahmaputra Barrage would be constructed in order to provide irrigation water to the northeast and northwest regions of Bangladesh for sustainable water management along the vast area of both banks of the river. This will also create huge water related job opportunity in Bangladesh.
6. The seminar opined that coordinated, coherent policies and integrated management plans among the water related organizations should be undertaken for sustainable water resources development in Bangladesh. Participatory water management approach should be introduced in the water resources project as far as practicable.
7. The seminar emphasised on immediate implementation of Bangladesh Water Act.(2013) for better water management in Bangladesh.
8. The seminar noted that necessary steps would be taken to save the Barind area of Northwest region of Bangladesh from desertification and overall environmental degradation which would help to improve life and livelihood of the people in that area.
ICID•CIID
04 | BANCID
9. Necessary steps should be taken for sustainable water resources management in the coastal region of Bangladesh.
10. The seminar strongly recommended strengthening of the existing water related organizations through timely and need-based engagement of man-power as appropriate.
11. It was also suggested in the seminar to increase storage capacity of surface water by excavating existing ponds, haor/baors, beels etc.
12. Proper technology needs to be developed and applied to save water losses in the agriculture sectors.
13. Considering the climate change effect, the seminar opined that proper adaptation plan and management needs to be addreessed to overcome challanges of climate change induced impacts such as extreme high flow during monsoon, extreme low flow during dry season, increase of salinity intrusion in the coastal region etc.
BANCID would like to express its sincere thanks to Joint Rivers Commission, Bangladesh for providing necessary fund towards publication of BANCID Newsletter 2016.
ICID•CIID

BANCID National Committee
From its establishment in 1973, BANCID is actively involved in dissemination of research outcome and news related to irriga-tion, drainage, climate change and other water related issues both home and abroad. The present 18 member approved Committee (2014-2017) headed by Director General, BWDB is as follows:
1. Director General Chairman Bangladesh Water Development Board (BWDB), Dhaka
2. Head Vice Chairman Department of Water Resources Engineering Bangladesh University of Engineering and Technology (BUET), Dhaka
3. Dr. M. A. Quassem Member Water Expert and Former Director General Water Resources Planning Organization (WARPO), Dhaka
4. Member Member Joint Rivers Commission, Bangladesh (JRC), Dhaka
5. Director General Member Water Resources Planning Organization (WARPO), Dhaka
6. Director General Member River Research Institute (RRI), Faridpur
7. Director General Member Department of Bangladesh Haor and Wetland Development (DBHWD), Dhaka
8. Executive Chairman Member Bangladesh Agricultural Research Council (BARC), Dhaka
9. Head Member Department of Irrigation and Water Management Bangladesh Agricultural University (BAU), Mymensingh
10. Chief Engineer Member Local Government Engineering Department (LGED), Dhaka
11. Chief Engineer Member Department of Public Health Engineering (DPHE), Dhaka
12. Managing Director Member Dhaka Water Supply Authority (DWASA), Dhaka
13. Chairman Member Bangladesh Agricultural Development Corporation (BADC), Dhaka
14. Executive Director Member Centre for Environmental and Geographic Information Services (CEGIS), Dhaka
15. Executive Director Member Institute of Water Modelling (IWM), Dhaka
16. President Member Bangladesh Water Partnership (BWP), Dhaka
17. Deputy Secretary (Administration) Member Ministry of Water Resources Government of the People's Republic of Bangladesh, Dhaka
18. Director Member Secretary Joint Rivers Commission, Bangladesh (JRC), Dhaka
BANCID | 05
ICID•CIID
06 | BANCID
Groundwater Management and Crop Diversification in High Barind TractDr. A. A. Hassan, Irrigation and Water Management Specialist, Former Director General
BINA and Member Director (Natural Resources Management Division), BARC
The Physical Context
Among thirty agro-ecological zones of Bangladesh, Barind zone has got special features compared to the other zones. Geographically, this zone lies roughly between latitudes 24020/N and 25035/N and longitudes 88020/E and 89030/E. Barind tract is the largest Pleistocene physiographic unit of the Bengal Basin covering an area about 7,770 square kilometer. This physiographic unit is bounded by the Karotoya to the East, the Mahananda to the West, and the northern bank of the Ganges to the South. In Bangla, Barind tract is spelled and pronounced as Barendra Bhumi. Barendra Bhumi covers most parts of the geater Dinajpur, Rangpur, Pabna, Rajshahi, Bogra, Joypurhat and Naogaon districts of Rajshahi division. The Barind tract lies in the monsoon region of the summer dominant hemisphere. Dry weather exists almost throughout the year in the area except the monsoon months (mid June to October). Rainfall is comparatively low in the region, the annual average being around 1,200-1,400 mm. It mainly occurs during the monsoon months. Rainfall varies from place to place as well as year to year. Because of scarcity of water, the tract has already been designated as Drought Prone area. Its average temperature ranges from 250C to 350C in the hottest season and 90C to 150C in the coolest season. Generally this tract is rather hot and is considered as semi-arid. In summer, some of the hottest days experience a temperature of about 450C or even more in Rajshahi area. In winter it falls to about 50C in some places of Dinajpur and Rangpur districts. The total cultivable area is being about 1.44 million acres, out of which 34% loamy, 10% sandy, 49% clayey and 7% others. Out of the total cultivable land, 84% are single cropped, 13% are double cropped and the rest are triple cropped. Cropping intensity in the Barind tract is 117% which is 74% less compared to the national average (191%).
Groundwater development and consequences
Agricultural land in Bangladesh was irrigated by traditional means up to 1950s without any institutional base. Agriculture in Bangladesh was entirely dependent on surface water and monsoon rainfall prior to 1970s. Irrigation activities were institutionalized with the formation of Bangladesh Water Development Board (the then East Pakistan Water and Power Development Authority) in 1959. Bangladesh Agricultural Development Corporation (the then East Pakistan Agricultural Development Corporation) was created in 1961 and acted as the main organization for the expansion of both groundwater and surface water irrigation. Barind tract was excluded during 3,000 deep tube well (DTW) installation program of BADC in the North-West Irrigation Project considering as a low potential area for groundwater development. Groundwater development started in Barind with the formation of Barind Integrated Area Development Project (BIADP) in 1985 under BADC and later with the formation of Barind Multipurpose Development Authority (BMDA) in 1992. With the expansion of groundwater irrigation in the area, a revolutionary change has occurred in its agricultural sector with the introduction of high yielding Boro rice varieties. To meet up the food demand and food security for huge population of the country, massive initiatives were taken to grow Boro rice lifting groundwater throughout the country including the Barind tract. As a result, the country has nearly achieved food grain self sufficiency. But besides the groundwater development, the information relating groundwater recharge like amount of rainfall, pattern of groundwater recharge and withdrawal are not properly recorded for Barind tract. Enough information on surface water availability (river, bill, pond, haor etc.) that contributed to groundwater recharge is not properly recorded or unknown. For some cases, although information is available but amount of uplift from groundwater and recharge to groundwater is not checked. If uplift from groundwater exceeds recharge to groundwater, groundwater mining or in other word lowering of groundwater level will occur. In Barind tract, uplift from groundwater exceeded the yearly recharge to groundwater which caused groundwater unavailability in different areas of the tract. Scenarios of groundwater mining in the tract have been focused in many national newspapers. For example, the Daily Financial Express of 12th June, 2012 published a news entitled “Protecting groundwater resources in the high Barind tract stressed”. It is felt by the water scientists that Barind tract needs crop diversification program through low water demanding crop instead of growing boro rice using only groundwater as source of irrigation. Crop diversification program will reduce the groundwater lifting rate compared to Boro rice production in the dry season. On the other hand, huge uplift of groundwater created the lowering of groundwater level i.e. groundwater level has gone deeper. This caused unavailability of groundwater during the dry season. It has been published in the daily newspaper The Daily Star of 27th May, 2012 entitled “Barind groundwater fall triggers drinking water crisis” which caused thousands of tubewell non-functional under Naogaon district. Lowering of groundwater level caused unavailability of drinking water in Upazillas like Sapahar, Potnitola, Mohadebpur and Manda. If the groundwater level within the suction limit of tubewell is not recharged fully from the rainfall or other sources annually, then the tubewells become inoperative or non-functional. Water in the underground is usually filled up from the annual
ICID•CIID
BANCID | 07
monsoon rainfall and inundated flood water. The process usually happens in the monsoon months (July to October). The scientist’s findings revealed that refilling rate from rainfall in Barind tract is very less compared to the other region of the country. The reason for less refilling is caused by thick deep sticky layer on the top of the soil horizon which causes large surface runoff.
This would be transparent if it is explained with data sources of different aspects like increment in number of deep tubewell installation and changes in long term water table hydrograph. Groundwater level is continuously going down every year. With the increasing number of deep tubewells, the rate of depletion of groundwater level is accelerating in the dry season every year. From 1966-1975, water table hydrograph showed almost no changes in groundwater level. During the period, minimum water level during the dry months was found to fluctuate between 6.0 to 7.0 m. During the same period (1966-1975), minimum water level at the end of the wet season was found to fluctuate between 1.30 to 1.80 m. From 1975 onward, installation of deep tubewells (without maintaining recommended spacing for deep tubewells) increased at an alarming rate which caused groundwater level also to deplete at a high rate. In 2010, minimum water level at the end of the wet season was found to fluctuate between 12.90 to 13.70 m. Whereas in the same year, minimum water level at the end of dry season reached from 13.50 to 14.50 m from the previous 6.0 to 7.0 m (during 1966-1975). From the data as explained, it is clear that groundwater withdrawal was higher than refilled from the annual rainfall during the wet months. The picture would be clearer if it is explained by the enhancement of number of deep tubewell installations with the changes of time. For example, there were only 5 DTWs in Tanore Upazilla in 1975. In 1984, DTW number arose to 77. In 1986, it has reached to 122. Lastly, in 2010 DTW installed in that Upazilla reached to 500 along with huge mini-deep installed by different NGO sources. From 1975 to 2010, depletion rates were found to be 21.43 and 33.57 m during the dry season and wet season, respectively. From the nature of depletion, it can be stated that groundwater level in the Barind tract is depleting at an alarming rate from year to year.
Crop diversification and Groundwater Management
Assured irrigation (from DTWs) for Boro rice and high yield from HYVs attracted Barind farmers to grow solely Boro rice. To protect and safe groundwater resources for future generation and protect the environment, the attitude of growing sole Boro rice need to be changed by introducing crop diversification throughout the year. The return from sole boro rice can be obtained through year round cropping system like aman rice (short duration)-rabi crop (winter pulse/oil seed/wheat etc.)-khrif I crop (summer pulse/oil seed crop). Short duration aman rice should be transplanted in July and to be harvested at the end of October. The aman rice may need supplemental irrigation in addition to seasonal rainfall. The early harvest of aman rice will leave sufficient soil moisture in the soil horizon. That conserved soil moisture is found to be sufficient to grow rabi crops of low water demand but of high value. This has been observed by the scientists and in rare occasion, rabi crops need small amount of supplemental irrigation. After harvest of rabi crops, the soils of Barind tract, specially surface soil becomes very dry, hard and unsuitable for cropping. Scientist found that providing pre-sowing irrigation made possible to grow kharif I crops (summer pulse/oil seed crop). Once germination of the crops are ensured/successful, then the crops do not need further irrigation in most cases or in worst case may need small amount of irrigation. The crops fulfill their water demand through root proliferation from deeper layer of 8-10 cm depth. This year round cropping system will save huge amount groundwater withdrawal compared to sole Boro rice. Because Boro rice in the Barind tract needs 120-160 cm (minimum) water for the growing period. On the contrary, rainfed aman rice needs 50% supplemental irrigation. That means in rainfed aman rice, about 60-80 cm groundwater from the underground does not need to be withdrawn. As explained earlier, if rabi and kharif I crops need supplemental irrigation that could be 6-9 and 8-10 cm, respectively. That means, the proposed year round cropping pattern will need total supplemental irrigation of amounting 74-99 cm and the cropping system would save 45-60 cm groundwater compared to sole Boro rice cropping. Sole Boro rice needs 45-60 cm more water compared to year round cropping pattern. The additional irrigation water for Boro rice is met from groundwater which is creating lowering of groundwater to deeper depth every year. Economic analysis revealed same economic return in both the cases with the expense of 45-60 cm more groundwater for sole Boro rice cultivation compared to year round cropping pattern. If growing of irrigated Boro rice continues, then exploitation of groundwater will continue creating a threat to the groundwater reserve in future.
Conclusion
Under the circumstances, rainfed aman rice-rabi crop-kharif I cropping system intensification in the Barind tract will assist in reducing high depletion rate of groundwater (not recharged every year from annual rainfall) to deeper depth. The crops (other than rice) in the cropping system like pulses will enrich the soil with organic matter and biological nitrogen fixation. This will reduce application of nitrogenous chemical fertilizer (Urea) which will reduce the cost of production to some extent. To prevent further downward groundwater depletion, different activities as crop diversification, artificial groundwater recharge during wet months, intensive surface water irrigation in dry months through water conservation measures during wet months, rain water harvesting and improvement of irrigation efficiency planning and measures should be taken by the respective organizations.
ICID•CIID
08 | BANCID
Integrated water resources management in the Southern Zone of BangladeshMd. Amirul Hossain, Director, Planning-III, BWDB
Dr. Md. Rahmat Ali, Deputy Chief (Fisheries), BWDB
Abstract
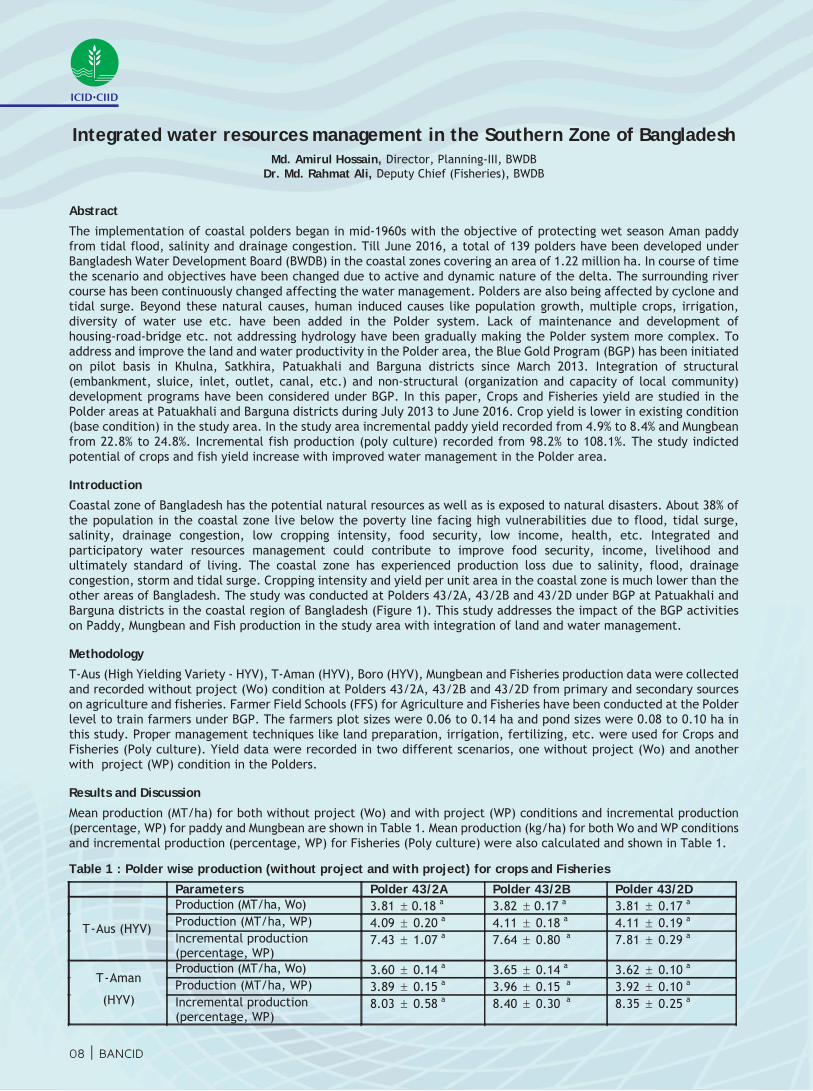
The implementation of coastal polders began in mid-1960s with the objective of protecting wet season Aman paddy from tidal flood, salinity and drainage congestion. Till June 2016, a total of 139 polders have been developed under Bangladesh Water Development Board (BWDB) in the coastal zones covering an area of 1.22 million ha. In course of time the scenario and objectives have been changed due to active and dynamic nature of the delta. The surrounding river course has been continuously changed affecting the water management. Polders are also being affected by cyclone and tidal surge. Beyond these natural causes, human induced causes like population growth, multiple crops, irrigation, diversity of water use etc. have been added in the Polder system. Lack of maintenance and development of housing-road-bridge etc. not addressing hydrology have been gradually making the Polder system more complex. To address and improve the land and water productivity in the Polder area, the Blue Gold Program (BGP) has been initiated on pilot basis in Khulna, Satkhira, Patuakhali and Barguna districts since March 2013. Integration of structural (embankment, sluice, inlet, outlet, canal, etc.) and non-structural (organization and capacity of local community) development programs have been considered under BGP. In this paper, Crops and Fisheries yield are studied in the Polder areas at Patuakhali and Barguna districts during July 2013 to June 2016. Crop yield is lower in existing condition (base condition) in the study area. In the study area incremental paddy yield recorded from 4.9% to 8.4% and Mungbean from 22.8% to 24.8%. Incremental fish production (poly culture) recorded from 98.2% to 108.1%. The study indicted potential of crops and fish yield increase with improved water management in the Polder area.
Introduction
Coastal zone of Bangladesh has the potential natural resources as well as is exposed to natural disasters. About 38% of the population in the coastal zone live below the poverty line facing high vulnerabilities due to flood, tidal surge, salinity, drainage congestion, low cropping intensity, food security, low income, health, etc. Integrated and participatory water resources management could contribute to improve food security, income, livelihood and ultimately standard of living. The coastal zone has experienced production loss due to salinity, flood, drainage congestion, storm and tidal surge. Cropping intensity and yield per unit area in the coastal zone is much lower than the other areas of Bangladesh. The study was conducted at Polders 43/2A, 43/2B and 43/2D under BGP at Patuakhali and Barguna districts in the coastal region of Bangladesh (Figure 1). This study addresses the impact of the BGP activities on Paddy, Mungbean and Fish production in the study area with integration of land and water management.
Methodology
T-Aus (High Yielding Variety - HYV), T-Aman (HYV), Boro (HYV), Mungbean and Fisheries production data were collected and recorded without project (Wo) condition at Polders 43/2A, 43/2B and 43/2D from primary and secondary sources on agriculture and fisheries. Farmer Field Schools (FFS) for Agriculture and Fisheries have been conducted at the Polder level to train farmers under BGP. The farmers plot sizes were 0.06 to 0.14 ha and pond sizes were 0.08 to 0.10 ha in this study. Proper management techniques like land preparation, irrigation, fertilizing, etc. were used for Crops and Fisheries (Poly culture). Yield data were recorded in two different scenarios, one without project (Wo) and another with project (WP) condition in the Polders.
Results and Discussion
Mean production (MT/ha) for both without project (Wo) and with project (WP) conditions and incremental production (percentage, WP) for paddy and Mungbean are shown in Table 1. Mean production (kg/ha) for both Wo and WP conditions and incremental production (percentage, WP) for Fisheries (Poly culture) were also calculated and shown in Table 1.
Table 1 : Polder wise production (without project and with project) for crops and Fisheries
Parameters Polder 43/2A Polder 43/2B Polder 43/2D
T-Aus (HYV)
Production (MT/ha, Wo) 3.81 0.18 a 3.82 0.17 a 3.81 0.17 a Production (MT/ha, WP) 4.09 0.20 a 4.11 0.18 a 4.11 0.19 a Incremental production (percentage, WP)
7.43 1.07 a 7.64 0.80 a 7.81 0.29 a
T-Aman
(HYV)
Production (MT/ha, Wo) 3.60 0.14 a 3.65 0.14 a 3.62 0.10 a Production (MT/ha, WP) 3.89 0.15 a 3.96 0.15 a 3.92 0.10 a Incremental production (percentage, WP)
8.03 0.58 a 8.40 0.30 a 8.35 0.25 a
ICID•CIID
BANCID | 09
Values are presented as mean SD. Wo – Without Project condition, WP-With Project condition, MT – Metric Ton
T-Aus (HYV) pre-monsoon paddy
The yield in WP condition was recorded as 4.09 0.20, 4.11 0.18 and 4.11 0.19 MT/ha in Polders 43/2A, 43/2B and 43/2D respectively for T-Aus (HYV), shown in Table 1 and Figure 2. The incremental productions were recorded as 7.43 1.07, 7.64 0.80 and 7.81 0.29% in Polders 43/2A, 43/2B and 43/2D respectively for T-Aus (HYV).
T-Aman (HYV) wet season paddy
Yield in WP condition was recorded as 3.89 0.15, 3.96 0.15 and 3.92 0.10 MT/ha in Polders 43/2A, 43/2B and 43/2D respectively for T-Aman (HYV), shown in Table 1 and Figure 3. The incremental productions were 8.03 0.58, 8.40 0.30 and 8.35 0.25% in Polders 43/2A, 43/2B and 43/2D respectively for T-Aman (HYV) in WP condition in the Polders under study (Table 1).
Boro (HYV) dry season paddy
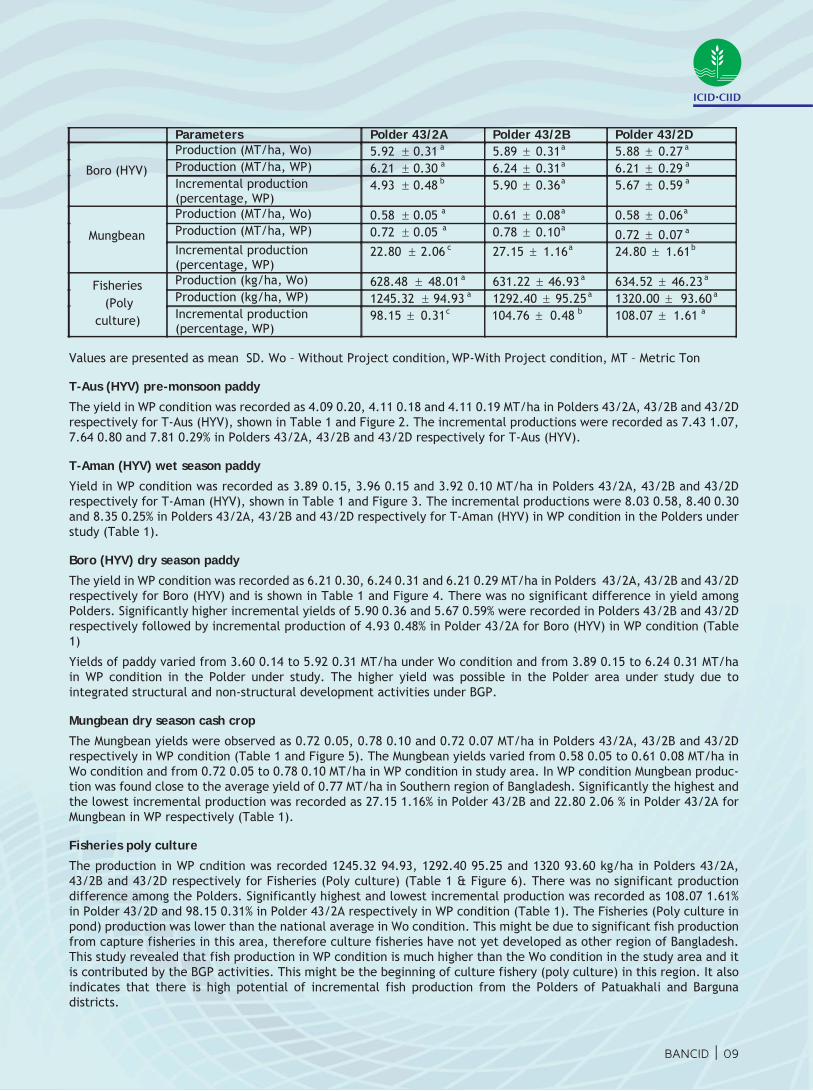
The yield in WP condition was recorded as 6.21 0.30, 6.24 0.31 and 6.21 0.29 MT/ha in Polders 43/2A, 43/2B and 43/2D respectively for Boro (HYV) and is shown in Table 1 and Figure 4. There was no significant difference in yield among Polders. Significantly higher incremental yields of 5.90 0.36 and 5.67 0.59% were recorded in Polders 43/2B and 43/2D respectively followed by incremental production of 4.93 0.48% in Polder 43/2A for Boro (HYV) in WP condition (Table 1)
Yields of paddy varied from 3.60 0.14 to 5.92 0.31 MT/ha under Wo condition and from 3.89 0.15 to 6.24 0.31 MT/ha in WP condition in the Polder under study. The higher yield was possible in the Polder area under study due to integrated structural and non-structural development activities under BGP.
Mungbean dry season cash crop
The Mungbean yields were observed as 0.72 0.05, 0.78 0.10 and 0.72 0.07 MT/ha in Polders 43/2A, 43/2B and 43/2D respectively in WP condition (Table 1 and Figure 5). The Mungbean yields varied from 0.58 0.05 to 0.61 0.08 MT/ha in Wo condition and from 0.72 0.05 to 0.78 0.10 MT/ha in WP condition in study area. In WP condition Mungbean produc-tion was found close to the average yield of 0.77 MT/ha in Southern region of Bangladesh. Significantly the highest and the lowest incremental production was recorded as 27.15 1.16% in Polder 43/2B and 22.80 2.06 % in Polder 43/2A for Mungbean in WP respectively (Table 1).
Fisheries poly culture
The production in WP cndition was recorded 1245.32 94.93, 1292.40 95.25 and 1320 93.60 kg/ha in Polders 43/2A, 43/2B and 43/2D respectively for Fisheries (Poly culture) (Table 1 & Figure 6). There was no significant production difference among the Polders. Significantly highest and lowest incremental production was recorded as 108.07 1.61% in Polder 43/2D and 98.15 0.31% in Polder 43/2A respectively in WP condition (Table 1). The Fisheries (Poly culture in pond) production was lower than the national average in Wo condition. This might be due to significant fish production from capture fisheries in this area, therefore culture fisheries have not yet developed as other region of Bangladesh. This study revealed that fish production in WP condition is much higher than the Wo condition in the study area and it is contributed by the BGP activities. This might be the beginning of culture fishery (poly culture) in this region. It also indicates that there is high potential of incremental fish production from the Polders of Patuakhali and Barguna districts.
Parameters Polder 43/2A Polder 43/2B Polder 43/2D
Boro (HYV)
Production (MT/ha, Wo) 5.92 0.31 a 5.89 0.31 a 5.88 0.27 a Production (MT/ha, WP) 6.21 0.30 a 6.24 0.31 a 6.21 0.29 a Incremental production (percentage, WP)
4.93 0.48 b 5.90 0.36 a 5.67 0.59 a
Mungbean
Production (MT/ha, Wo) 0.58 0.05 a 0.61 0.08 a 0.58 0.06 a Production (MT/ha, WP) 0.72 0.05 a 0.78 0.10 a 0.72 0.07 a Incremental production (percentage, WP)
22.80 2.06 c 27.15 1.16 a 24.80 1.61b
Fisheries (Poly
culture)
Production (kg/ha, Wo) 628.48 48.01 a 631.22 46.93 a 634.52 46.23 a Production (kg/ha, WP) 1245.32 94.93 a 1292.40 95.25 a 1320.00 93.60 a Incremental production (percentage, WP)
98.15 0.31c 104.76 0.48 b 108.07 1.61 a
ICID•CIID
10 | BANCID
Conclusion
Crop yields, cropping intensity, and production levels are much lower than the national average in the without project (Wo) condition in this region. Incremental yield of paddy was recorded from 4.93 0.48% to 8.40 0.30% in the with project (WP) condition. Incremental yield of Mungbean was recorded from 22.80 2.06% to 24.80 1.61%. Incremental fish production was recorded from 98.15 0.31% to 108.07 1.61%. The higher crop and fish production was attained due to integrated structural and non-structural interventions under BGP. There are potentials to enhance crop and fish production through improved land and water resources management with organized community, and to contribute to improve food security, alleviate poverty and create a sustainable environment and thus to improve standard of living and quality of life of the coastal population.
Acknowledgement
The authors gratefully acknowledge the Technical Assistance Team, Blue Gold Program, the program is being implemented with the assistance of the Government of the Kingdom of the Netherlands, for providing support to conduct this study.
Irrigation command area recovered by using the Bamboo Bandalling structures for river bank protection
Dr. Engr. Md. Lutfor Rahman, Director General, RRI
Introduction
River bank erosion and channel shifting are recurrent problems as well as one of the natural disasters in Bangladesh that usually occur during the monsoon (more specifically, during rising stage and recession stage) when huge sediment load is generated by means of bank erosion and bed changes. These river bank erosions can be reduced by constructing low cost bamboo bandals with the added advantages of agricultural land reclamation as well as navigational channel development for both the major & minor rivers in Bangladesh.
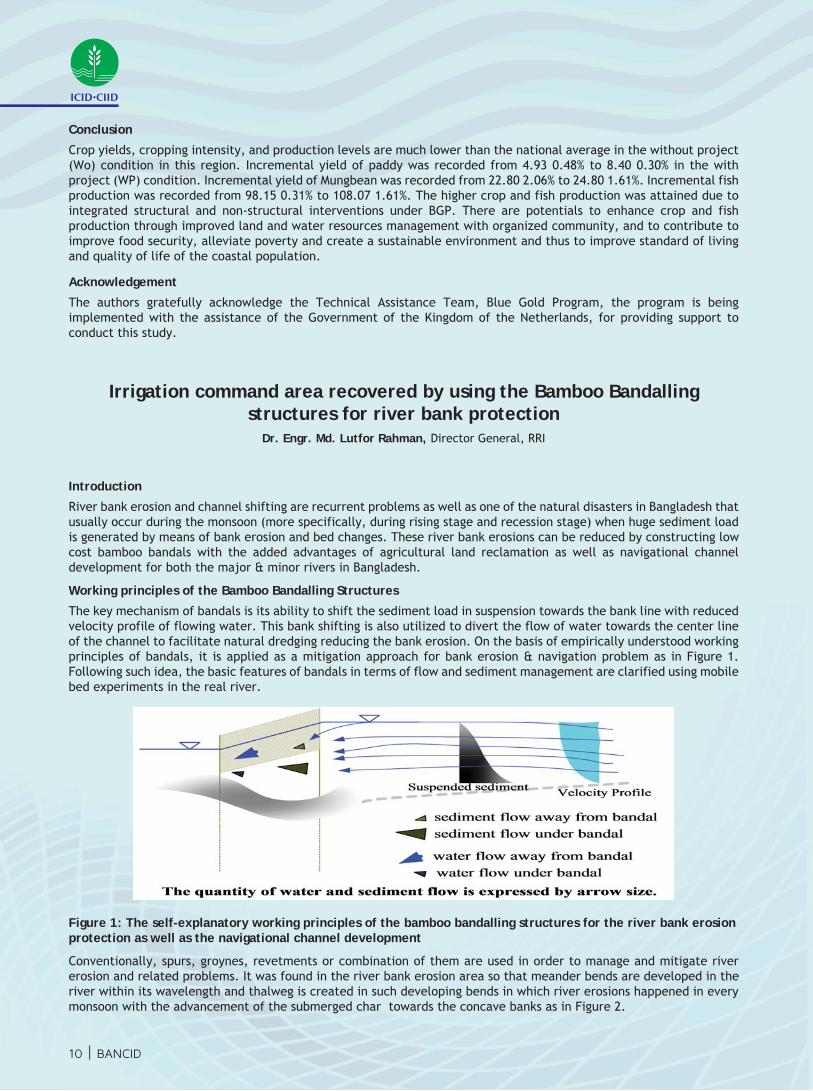
Working principles of the Bamboo Bandalling Structures
The key mechanism of bandals is its ability to shift the sediment load in suspension towards the bank line with reduced velocity profile of flowing water. This bank shifting is also utilized to divert the flow of water towards the center line of the channel to facilitate natural dredging reducing the bank erosion. On the basis of empirically understood working principles of bandals, it is applied as a mitigation approach for bank erosion & navigation problem as in Figure 1. Following such idea, the basic features of bandals in terms of flow and sediment management are clarified using mobile bed experiments in the real river.
Figure 1: The self-explanatory working principles of the bamboo bandalling structures for the river bank erosion protection as well as the navigational channel development
Conventionally, spurs, groynes, revetments or combination of them are used in order to manage and mitigate river erosion and related problems. It was found in the river bank erosion area so that meander bends are developed in the river within its wavelength and thalweg is created in such developing bends in which river erosions happened in every monsoon with the advancement of the submerged char towards the concave banks as in Figure 2.
ICID•CIID
BANCID | 11
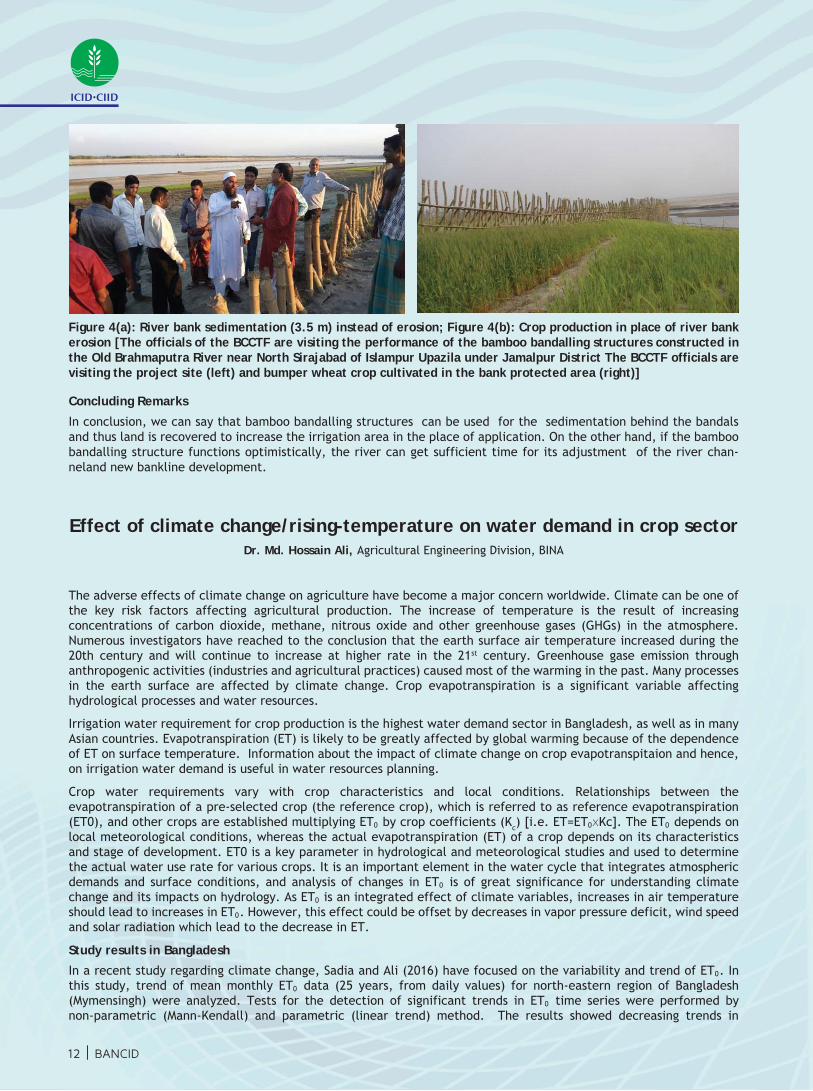
Figure 3(a): River bed scour option Figure 3(b): River bank
sedimentation optionFigure 3(c): River bank protection
ICID•CIID
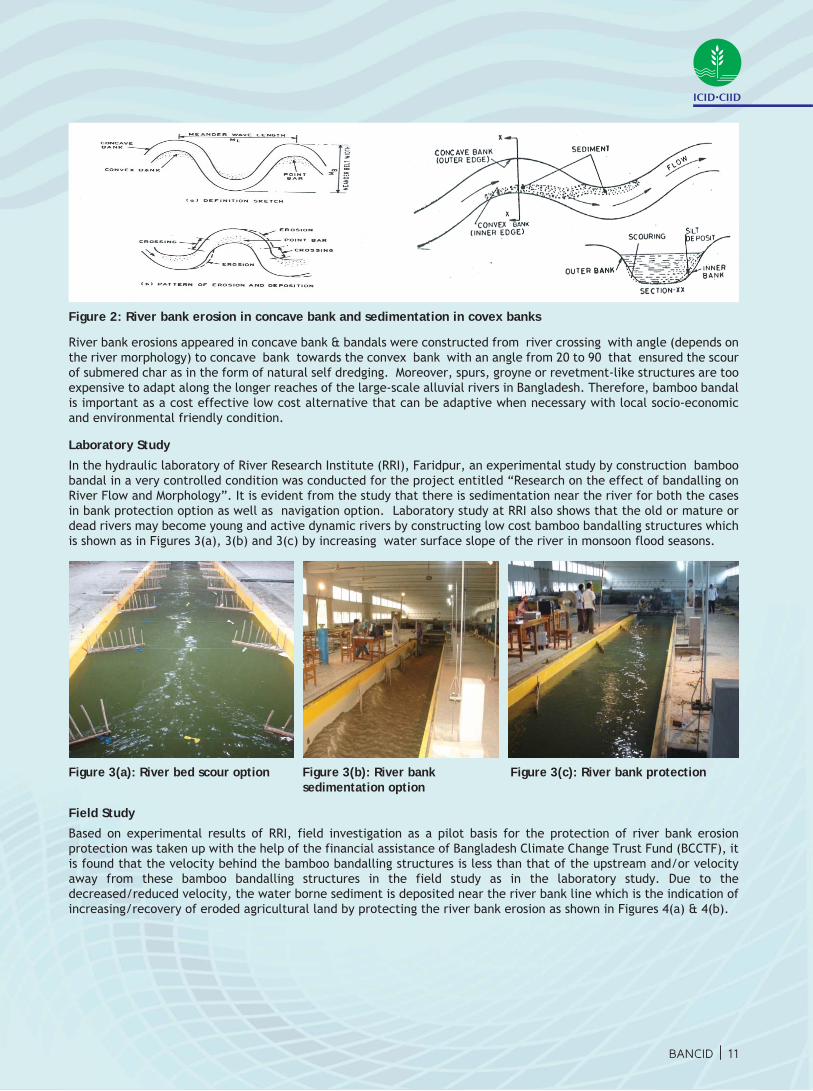
Figure 2: River bank erosion in concave bank and sedimentation in covex banks
River bank erosions appeared in concave bank & bandals were constructed from river crossing with angle (depends on the river morphology) to concave bank towards the convex bank with an angle from 20 to 90 that ensured the scour of submered char as in the form of natural self dredging. Moreover, spurs, groyne or revetment-like structures are too expensive to adapt along the longer reaches of the large-scale alluvial rivers in Bangladesh. Therefore, bamboo bandal is important as a cost effective low cost alternative that can be adaptive when necessary with local socio-economic and environmental friendly condition.
Laboratory Study
In the hydraulic laboratory of River Research Institute (RRI), Faridpur, an experimental study by construction bamboo bandal in a very controlled condition was conducted for the project entitled “Research on the effect of bandalling on River Flow and Morphology”. It is evident from the study that there is sedimentation near the river for both the cases in bank protection option as well as navigation option. Laboratory study at RRI also shows that the old or mature or dead rivers may become young and active dynamic rivers by constructing low cost bamboo bandalling structures which is shown as in Figures 3(a), 3(b) and 3(c) by increasing water surface slope of the river in monsoon flood seasons.
Field Study
Based on experimental results of RRI, field investigation as a pilot basis for the protection of river bank erosion protection was taken up with the help of the financial assistance of Bangladesh Climate Change Trust Fund (BCCTF), it is found that the velocity behind the bamboo bandalling structures is less than that of the upstream and/or velocity away from these bamboo bandalling structures in the field study as in the laboratory study. Due to the decreased/reduced velocity, the water borne sediment is deposited near the river bank line which is the indication of increasing/recovery of eroded agricultural land by protecting the river bank erosion as shown in Figures 4(a) & 4(b).
12 | BANCID
Figure 4(a): River bank sedimentation (3.5 m) instead of erosion; Figure 4(b): Crop production in place of river bank erosion [The officials of the BCCTF are visiting the performance of the bamboo bandalling structures constructed in the Old Brahmaputra River near North Sirajabad of Islampur Upazila under Jamalpur District The BCCTF officials are visiting the project site (left) and bumper wheat crop cultivated in the bank protected area (right)]
Concluding Remarks
In conclusion, we can say that bamboo bandalling structures can be used for the sedimentation behind the bandals and thus land is recovered to increase the irrigation area in the place of application. On the other hand, if the bamboo bandalling structure functions optimistically, the river can get sufficient time for its adjustment of the river chan-neland new bankline development.
Effect of climate change/rising-temperature on water demand in crop sectorDr. Md. Hossain Ali, Agricultural Engineering Division, BINA
The adverse effects of climate change on agriculture have become a major concern worldwide. Climate can be one of the key risk factors affecting agricultural production. The increase of temperature is the result of increasing concentrations of carbon dioxide, methane, nitrous oxide and other greenhouse gases (GHGs) in the atmosphere. Numerous investigators have reached to the conclusion that the earth surface air temperature increased during the 20th century and will continue to increase at higher rate in the 21st century. Greenhouse gase emission through anthropogenic activities (industries and agricultural practices) caused most of the warming in the past. Many processes in the earth surface are affected by climate change. Crop evapotranspiration is a significant variable affecting hydrological processes and water resources.
Irrigation water requirement for crop production is the highest water demand sector in Bangladesh, as well as in many Asian countries. Evapotranspiration (ET) is likely to be greatly affected by global warming because of the dependence of ET on surface temperature. Information about the impact of climate change on crop evapotranspitaion and hence, on irrigation water demand is useful in water resources planning.
Crop water requirements vary with crop characteristics and local conditions. Relationships between the evapotranspiration of a pre-selected crop (the reference crop), which is referred to as reference evapotranspiration (ET0), and other crops are established multiplying ET0 by crop coefficients (Kc) [i.e. ET=ET0xKc]. The ET0 depends on local meteorological conditions, whereas the actual evapotranspiration (ET) of a crop depends on its characteristics and stage of development. ET0 is a key parameter in hydrological and meteorological studies and used to determine the actual water use rate for various crops. It is an important element in the water cycle that integrates atmospheric demands and surface conditions, and analysis of changes in ET0 is of great significance for understanding climate change and its impacts on hydrology. As ET0 is an integrated effect of climate variables, increases in air temperature should lead to increases in ET0. However, this effect could be offset by decreases in vapor pressure deficit, wind speed and solar radiation which lead to the decrease in ET.
Study results in Bangladesh
In a recent study regarding climate change, Sadia and Ali (2016) have focused on the variability and trend of ET0. In this study, trend of mean monthly ET0 data (25 years, from daily values) for north-eastern region of Bangladesh (Mymensingh) were analyzed. Tests for the detection of significant trends in ET0 time series were performed by non-parametric (Mann-Kendall) and parametric (linear trend) method. The results showed decreasing trends in
ICID•CIID

BANCID | 13
monthly ET0 except July. The decreasing trends were mainly due to sharp decreasing trend of wind speed. The results of Mann-Kendall and linear trend tests showed similar capability of the two tests in detecting the trend, having a small difference in detection of the significant ET0 trend.
Mojid et al. (2015) studied ET0 trend for Bogra and Dinajpur districts. They reported decreasing ET0 trend in most of the months of the year, which was mainly due to decreasing net radiation (calculated from sunshine duration) and wind speed.
Trend of ET0 in other parts of the world
Shadmani et al. (2012) investigated ET0 in Iran using non-parametric tests. They found increasing ET0 in some cities, while decreasing trend for others. Bandyopadhyay et al. (2009) examined the temporal trend of ET0 in India. They observed a significant decreasing trend, which was related to significant increase in the relative humidity and decrease in the wind speed.
Concluding Remarks
The adverse effects of climate change on agriculture, specially increasing trend of temperature on irrigation water demand, have become a major concern. After all, the study results of Bangladesh and other countries signify the outcome that, effects of climate change may not always increase ET0, and hence crop water demand.
References
Sadia, M. and M. H. Ali (2016). Recent trend of reference evapotranspiration in the north-eastern region of Bangladesh. J. Basic and Applied Res. Int., 19(1): 10-19.
Bandyopadhyay, A., A. Bhadra, N. S. Raghuwanshi, R. Singh (2009). Temporal trends in estimates of reference evapotranspiration over India. J Hydrol Eng., 14(5): 508–515.
Mojid, M. A., R. P. Rannu, N. N. Karim (2015). Climate change impacts on reference crop evapotranspiration in North-West hydrological region of Bangladesh. Int. J. Clim., 35: 4041-46.
Shadmani, M., S. Marofi, M. Roknian (2012). Trend Analysis in reference evapotranspiration using Mann-Kendall and Spearman’s Rho Tests in Arid Regions of Iran. Water Resources Management. 26: 211–224.
Innovative irrigation water management for sustainable food securityFazlur Rashid, Superintending Engineer/Director, Planning-I, BWDB
Agriculture and water
Agriculture is central to food security and economic growth in developing countries and provides the main source of livelihood. But food production requires substantial amounts of water. Globally, agriculture accounts for 70 percent of all water withdrawn from rivers and aquifers. Water scarcity is one of the most pressing issues facing humanity today. More than 1.4 billion people live in water stressed river basins, and by 2025, this number is expected to reach 3.5 billion. The demand for water will substantially increase in order to meet the additional requirements for food and energy crops. Climate change is yet another factor that will impact water resources which in turn will impact agriculture and hence food production.
Food security
Challenges to ensuring food security in the 21st century, issues like climate change and population growth, and the need to manage the world’s rapidly growing demand for water in a sustainable way are entangled. World food demand is projected to nearly double by 2050. Most Asian countries, however, have limited land and water resources for agricultural and irrigation expansion. Irrigated agriculture in Asia, which contains 70% of the world’s irrigated land, has tremendous potential to contribute to achieving food security by raising the productivity of existing irrigated farmland. As water resources shrink, and competition from other sectors grows, irrigated agriculture must produce more food with existing or even less water, prevent the deterioration of water quality through contamination, and use poor-quality water for safe food production. Climate change could add further uncertainty to the water supply. To explore innovative ways to increase irrigation water-use efficiency, minimize externalities associated with traditional irrigation systems, reuse agricultural water, and harness nontraditional sources like waste and low-quality water. There is no doubt that modernization of irrigation system like concrete lining to the inner surface of the open channel, canal automation, etc. will save water significantly. On this background it is appropriate to know the innovative, simple, low cost, easy to adopt water technologies.
ICID•CIID
14 | BANCID
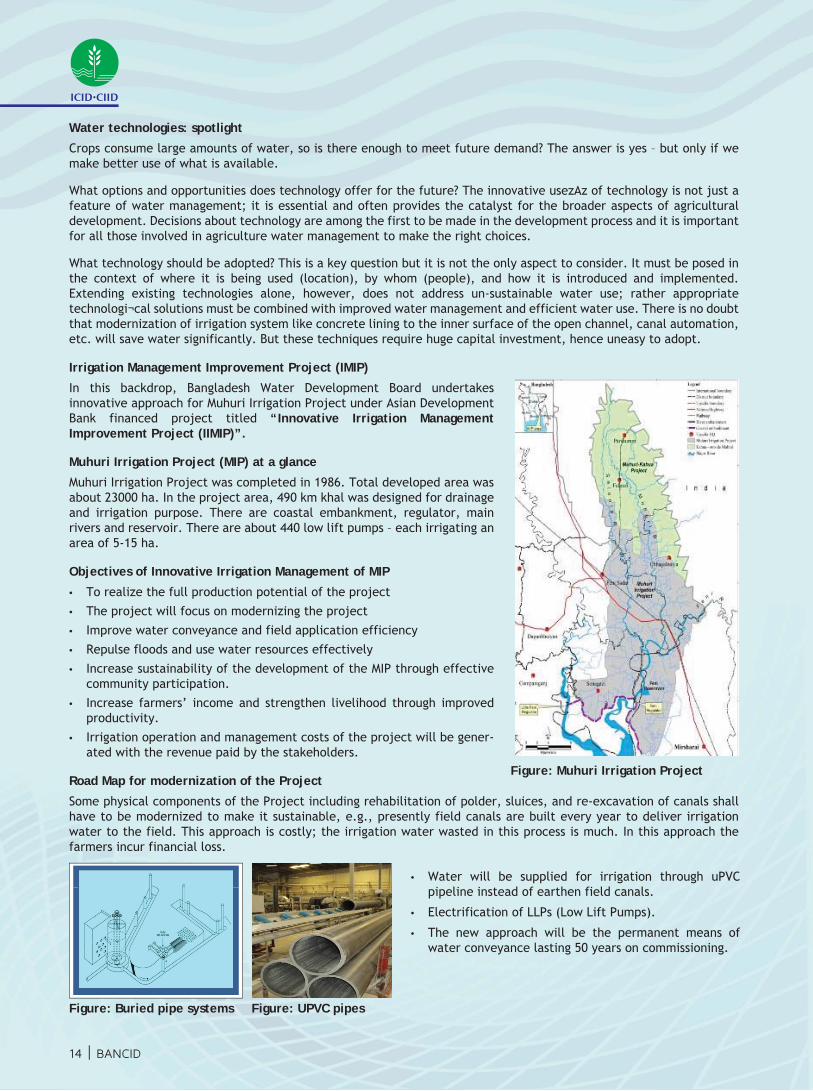
Figure: Buried pipe systems Figure: UPVC pipes
Figure: Muhuri Irrigation Project
• Water will be supplied for irrigation through uPVC pipeline instead of earthen field canals.
• Electrification of LLPs (Low Lift Pumps).
• The new approach will be the permanent means of water conveyance lasting 50 years on commissioning.
Water technologies: spotlight
Crops consume large amounts of water, so is there enough to meet future demand? The answer is yes – but only if we make better use of what is available.
What options and opportunities does technology offer for the future? The innovative usezAz of technology is not just a feature of water management; it is essential and often provides the catalyst for the broader aspects of agricultural development. Decisions about technology are among the first to be made in the development process and it is important for all those involved in agriculture water management to make the right choices.
What technology should be adopted? This is a key question but it is not the only aspect to consider. It must be posed in the context of where it is being used (location), by whom (people), and how it is introduced and implemented. Extending existing technologies alone, however, does not address un-sustainable water use; rather appropriate technologi¬cal solutions must be combined with improved water management and efficient water use. There is no doubt that modernization of irrigation system like concrete lining to the inner surface of the open channel, canal automation, etc. will save water significantly. But these techniques require huge capital investment, hence uneasy to adopt.
Irrigation Management Improvement Project (IMIP)
In this backdrop, Bangladesh Water Development Board undertakes innovative approach for Muhuri Irrigation Project under Asian Development Bank financed project titled “Innovative Irrigation Management Improvement Project (IIMIP)”.
Muhuri Irrigation Project (MIP) at a glance
Muhuri Irrigation Project was completed in 1986. Total developed area was about 23000 ha. In the project area, 490 km khal was designed for drainage and irrigation purpose. There are coastal embankment, regulator, main rivers and reservoir. There are about 440 low lift pumps – each irrigating an area of 5-15 ha.
Objectives of Innovative Irrigation Management of MIP
• To realize the full production potential of the project
• The project will focus on modernizing the project
• Improve water conveyance and field application efficiency
• Repulse floods and use water resources effectively
• Increase sustainability of the development of the MIP through effective community participation.
• Increase farmers’ income and strengthen livelihood through improved productivity.
• Irrigation operation and management costs of the project will be gener-ated with the revenue paid by the stakeholders.
Road Map for modernization of the Project
Some physical components of the Project including rehabilitation of polder, sluices, and re-excavation of canals shall have to be modernized to make it sustainable, e.g., presently field canals are built every year to deliver irrigation water to the field. This approach is costly; the irrigation water wasted in this process is much. In this approach the farmers incur financial loss.
ICID•CIID

BANCID | 15
Formation of Sub-project Implementation Plan and assessingits drainage performance
Md. Nazibur Rahman, Executive Engineer, JRC
Background
The whole area of Narail Sub-Project has been divided into a number of smaller hydrological units of a manageable size so as to ensure local people’s participation in the implementation process and O&M of the small schemes with the mobility of local resources. The smaller hydrological units (sub-catchments) are formed considering formation of Water Management Organizations (WMO) and existing drainage patterns. These smaller hydrological units are named as Subproject Implementation Plan (SIP) under Southwest Area Integrated Water Resources Planning & Management Project (SWAIWRPMP). In order to prevent the salinity intrusion and tidal flooding, the study area is enclosed by constructing coastal embankment (commonly known as polder) with water control structures for drainage of the enclosed areas. But at present most of the controlling structures are not functioning fully and some of the internal drainage khals within polders have been severely silted up, which prevents the people to get full benefit out of the existing project. Monsoon and post-monsoon drainage is the major concern of the study area.
In view of the above fact, small hydrological units (SIP) are formed and hydrological analysis has been carried out for small catchment of each SIP to provide a rational justification for quick decision making in planning, design and improved O&M of the controlling structures of the newly formed SIPs to ensure sustainable drainage management.
Data Collection and Analysis
The study has been carried out mainly based on the secondary data collected from BWDB and previous study reports. These data include daily water level, rainfall, evaporation, topography (land level), percolation, initial soil moisture loss, etc. The daily water level data of the peripheral river Chitra for the station at Narail has been collected from the Hydrology Directorate, BWDB. The rainfall data is very important for assessing the drainage performance of the existing structures and drainage systems. The rainfall data is collected from the nearest rainfall station to the study area located at Narail (R-461) maintained by BWDB. Average of the monthly total value of Narail gauge station from June to October has been taken from Project Preparatory Technical Assistance (PPTA) study report. Evaporation data for this study is also taken from the same report. Potential evapo-transpiration data of Jessore district is considered for non-paddy area and crop coefficients are applied to find out the potential evapo-transpiration data for this study. The topographic data used in this study are collected from the secondary sources. The Project Map of the Narail Sub-project available from PPTA has been updated by incorporating contour lines taken from the topographical maps prepared by SOB with the help of CEGIS. Area-elevation and storage-elevation data have been prepared using the updated contour map by AutoCAD for the use in hydrological analysis. The area-elevation and storage-elevation data as calculated from the contour map is given in Table 1.
MIP Modernization Plan under IMIP
Buried pipe system and prepaid meter for pump operation: Reforms old water transport networks, eliminate water losses from seepage, install localized irrigation systems in farms and ensure irrigation water charge.
Figure: Volumetric Pump Figure: Prepaid smartcard operated machine
ICID•CIID
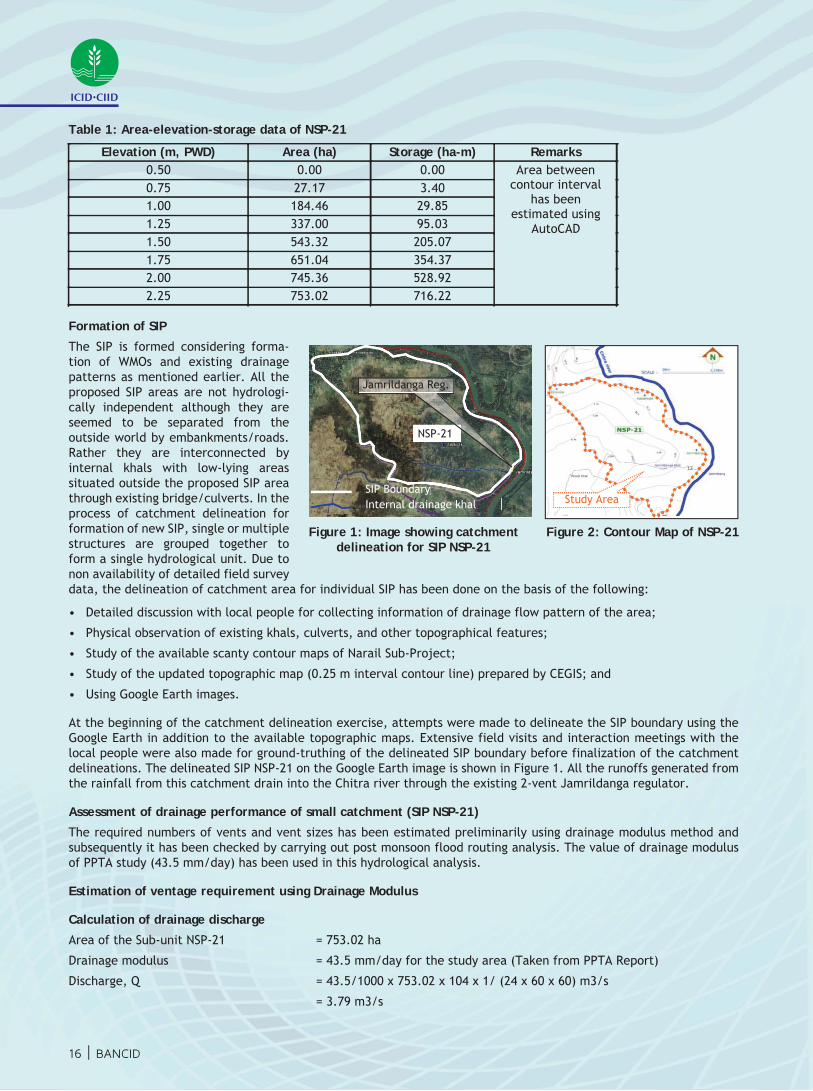
Table 1: Area-elevation-storage data of NSP-21
Formation of SIP
The SIP is formed considering forma-tion of WMOs and existing drainage patterns as mentioned earlier. All the proposed SIP areas are not hydrologi-cally independent although they are seemed to be separated from the outside world by embankments/roads. Rather they are interconnected by internal khals with low-lying areas situated outside the proposed SIP area through existing bridge/culverts. In the process of catchment delineation for formation of new SIP, single or multiple structures are grouped together to form a single hydrological unit. Due to non availability of detailed field survey data, the delineation of catchment area for individual SIP has been done on the basis of the following:
• Detailed discussion with local people for collecting information of drainage flow pattern of the area;
• Physical observation of existing khals, culverts, and other topographical features;
• Study of the available scanty contour maps of Narail Sub-Project;
• Study of the updated topographic map (0.25 m interval contour line) prepared by CEGIS; and
• Using Google Earth images.
At the beginning of the catchment delineation exercise, attempts were made to delineate the SIP boundary using the Google Earth in addition to the available topographic maps. Extensive field visits and interaction meetings with the local people were also made for ground-truthing of the delineated SIP boundary before finalization of the catchment delineations. The delineated SIP NSP-21 on the Google Earth image is shown in Figure 1. All the runoffs generated from the rainfall from this catchment drain into the Chitra river through the existing 2-vent Jamrildanga regulator.
Assessment of drainage performance of small catchment (SIP NSP-21)
The required numbers of vents and vent sizes has been estimated preliminarily using drainage modulus method and subsequently it has been checked by carrying out post monsoon flood routing analysis. The value of drainage modulus of PPTA study (43.5 mm/day) has been used in this hydrological analysis.
Estimation of ventage requirement using Drainage Modulus
Calculation of drainage discharge
Area of the Sub-unit NSP-21 = 753.02 ha
Drainage modulus = 43.5 mm/day for the study area (Taken from PPTA Report)
Discharge, Q = 43.5/1000 x 753.02 x 104 x 1/ (24 x 60 x 60) m3/s
= 3.79 m3/s
16 | BANCID
Elevation (m, PWD) Area (ha) Storage (ha-m) Remarks 0.50 0.00 0.00 Area between
contour interval has been
estimated using AutoCAD
0.75 27.17 3.40 1.00 184.46 29.85 1.25 337.00 95.03 1.50 543.32 205.07 1.75 651.04 354.37 2.00 745.36 528.92 2.25 753.02 716.22
SIP Boundary Internal drainage khal Study Area
Jamrildanga Reg.
Figure 1: Image showing catchment delineation for SIP NSP-21
Figure 2: Contour Map of NSP-21
ICID•CIID
NSP-21

BANCID | 17
Estimation of ventage
Average velocity of flow through structure = 2.15 m/s
Design discharge, Qd = 3.79 x 12/9 (considering 6 hours tidal blockage per day)
= 5.05 m3/s
Area of flow = Qd/2.15 = 2.35 m2
No. of vents required = 2.35/(1.52 x 1.83)
≈ 0.9 no.
This ventage has been checked by conducting post-monsoon flood routing as described below.
Post-monsoon Flood Routing
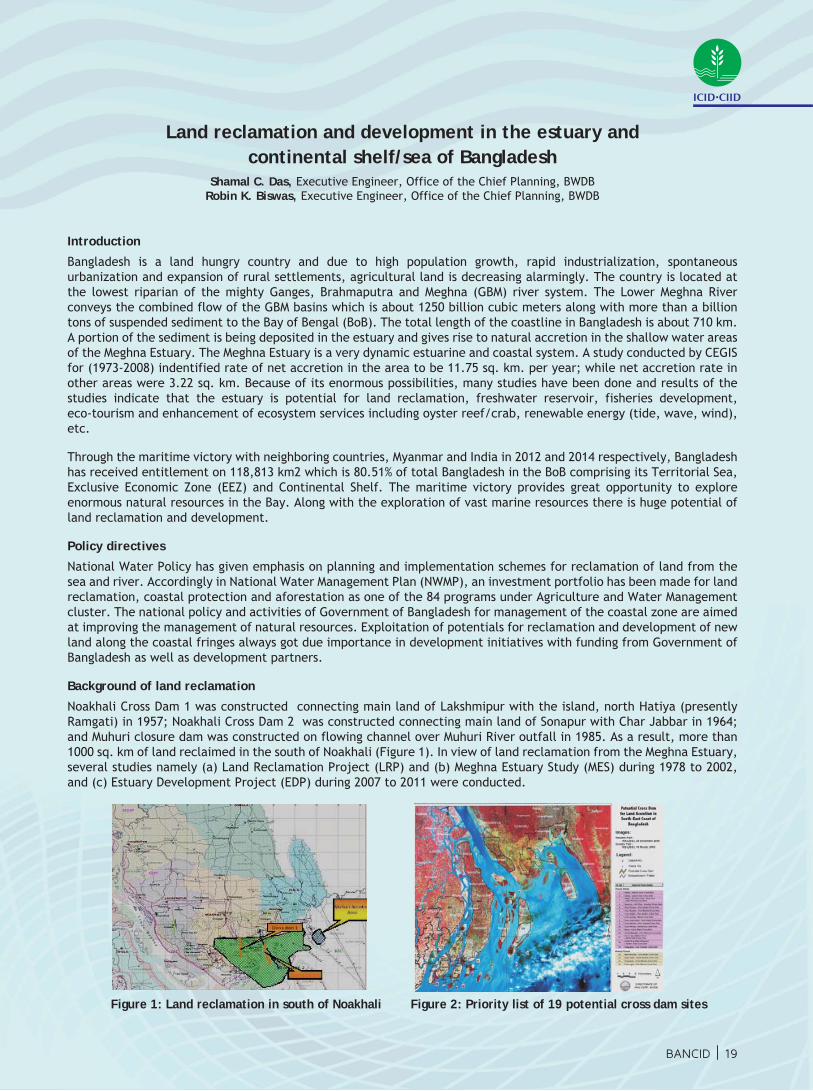
In order to determine the operation rule of the water control structure and obviously to determine and check the ventage of structure, post-monsoon flood routing has been carried out. Flood routing analysis has been carried out considering the average year (1 in 2.33 return period) flood event of the peripheral river. The average year hydrological event has been determined by frequency analysis. The routing has been carried out in accordance with the theory and methodology mentioned in CIDA and BWDB Design Manuals. Tolerable basin water level was determined for a 30 cm water depth over an elevation corresponding to 5% area of the basin. The average outflow was determined by general orifice formula depending on the flow type defined by Design Manual of BWDB against minimum available head difference between basin and the river. The calculation of runoff volume and computation of flood routing operation are given in Tables 2 to 6. The variation of water level in the outfall river and inside the basin as calculated from the routing model is shown in Figure 3.
Data used in the routing model
Percent of paddy land : 50 %
Total catchment area : 753.02 ha
No. of vents of structure : 1
Width of the vent : 1.52 m
Height of vent : 1.83 m
Table 2: Calculation of rainfall-runoff volume for non-paddy land
Table 3: Calculation of rainfall-runoff volume for paddy land
Month Monthly rainfall (mm)
Losses Runoff (mm)
Runoff volume (ha-m) Et (mm)
Initial soil moisture (mm)
Depression storage (mm)
Percolation (mm)
June 308.1 143 13 25 52 75.1 56.55
July 339.3 133 52 154.3 116.19
Aug 336.8 140 52 144.8 109.04
Sep 241.6 127 52 62.6 47.14
Oct 130.2 128 52 0 0.00
Month Monthly rainfall (mm)
Losses Runoff (mm)
Runoff volume (ha-m) Et (mm)
Initial soil moisture (mm)
Depression storage (mm)
June 308.1 168.03 100 40.07 30.17
July 339.3 156.28 183.02 137.82
Aug 336.8 164.50 172.30 129.75
Sep 241.6 149.23 92.37 69.56
Oct 130.2 150.40 0.00 0.00
ICID•CIID
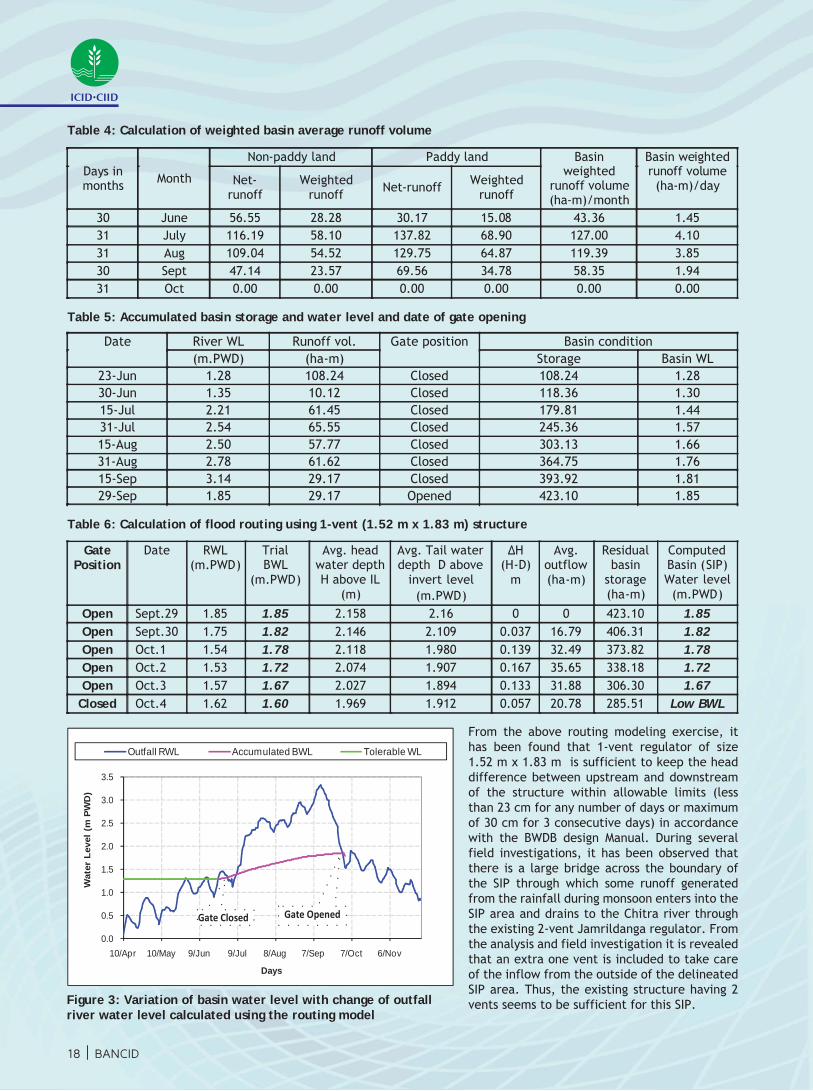
Table 4: Calculation of weighted basin average runoff volume
Table 5: Accumulated basin storage and water level and date of gate opening
Table 6: Calculation of flood routing using 1-vent (1.52 m x 1.83 m) structure
18 | BANCID
Gate Position
Date RWL (m.PWD)
Trial BWL
(m.PWD)
Avg. head water depth H above IL
(m)
Avg. Tail water depth D above
invert level (m.PWD)
ΔH (H-D)
m
Avg. outflow (ha-m)
Residual basin
storage (ha-m)
Computed Basin (SIP) Water level
(m.PWD)
Open Sept.29 1.85 1.85 2.158 2.16 0 0 423.10 1.85 Open Sept.30 1.75 1.82 2.146 2.109 0.037 16.79 406.31 1.82 Open Oct.1 1.54 1.78 2.118 1.980 0.139 32.49 373.82 1.78 Open Oct.2 1.53 1.72 2.074 1.907 0.167 35.65 338.18 1.72 Open Oct.3 1.57 1.67 2.027 1.894 0.133 31.88 306.30 1.67
Closed Oct.4 1.62 1.60 1.969 1.912 0.057 20.78 285.51 Low BWL
Days in months Month
Non-paddy land Paddy land Basin weighted
runoff volume (ha-m)/month
Basin weighted runoff volume (ha-m)/day Net-
runoff Weighted
runoff Net-runoff Weighted runoff
30 June 56.55 28.28 30.17 15.08 43.36 1.45 31 July 116.19 58.10 137.82 68.90 127.00 4.10 31 Aug 109.04 54.52 129.75 64.87 119.39 3.85 30 Sept 47.14 23.57 69.56 34.78 58.35 1.94 31 Oct 0.00 0.00 0.00 0.00 0.00 0.00
Date River WL Runoff vol. Gate position Basin condition (m.PWD) (ha-m) Storage Basin WL
23-Jun 1.28 108.24 Closed 108.24 1.28 30-Jun 1.35 10.12 Closed 118.36 1.30 15-Jul 2.21 61.45 Closed 179.81 1.44 31-Jul 2.54 65.55 Closed 245.36 1.57 15-Aug 2.50 57.77 Closed 303.13 1.66 31-Aug 2.78 61.62 Closed 364.75 1.76 15-Sep 3.14 29.17 Closed 393.92 1.81 29-Sep 1.85 29.17 Opened 423.10 1.85
From the above routing modeling exercise, it has been found that 1-vent regulator of size 1.52 m x 1.83 m is sufficient to keep the head difference between upstream and downstream of the structure within allowable limits (less than 23 cm for any number of days or maximum of 30 cm for 3 consecutive days) in accordance with the BWDB design Manual. During several field investigations, it has been observed that there is a large bridge across the boundary of the SIP through which some runoff generated from the rainfall during monsoon enters into the SIP area and drains to the Chitra river through the existing 2-vent Jamrildanga regulator. From the analysis and field investigation it is revealed that an extra one vent is included to take care of the inflow from the outside of the delineated SIP area. Thus, the existing structure having 2 vents seems to be sufficient for this SIP.
0.0
0.5
1.0
1.5
2.0
2.5
3.0
3.5
10/Apr 10/May 9/Jun 9/Jul 8/Aug 7/Sep 7/Oct 6/Nov
Wat
er L
evel
(m
PW
D)
Days
Outfall RWL Accumulated BWL Tolerable WL
Gate Closed Gate Opened
Figure 3: Variation of basin water level with change of outfall river water level calculated using the routing model
ICID•CIID
BANCID | 19
Land reclamation and development in the estuary andcontinental shelf/sea of Bangladesh
Shamal C. Das, Executive Engineer, Office of the Chief Planning, BWDBRobin K. Biswas, Executive Engineer, Office of the Chief Planning, BWDB
Introduction
Bangladesh is a land hungry country and due to high population growth, rapid industrialization, spontaneous urbanization and expansion of rural settlements, agricultural land is decreasing alarmingly. The country is located at the lowest riparian of the mighty Ganges, Brahmaputra and Meghna (GBM) river system. The Lower Meghna River conveys the combined flow of the GBM basins which is about 1250 billion cubic meters along with more than a billion tons of suspended sediment to the Bay of Bengal (BoB). The total length of the coastline in Bangladesh is about 710 km. A portion of the sediment is being deposited in the estuary and gives rise to natural accretion in the shallow water areas of the Meghna Estuary. The Meghna Estuary is a very dynamic estuarine and coastal system. A study conducted by CEGIS for (1973-2008) indentified rate of net accretion in the area to be 11.75 sq. km. per year; while net accretion rate in other areas were 3.22 sq. km. Because of its enormous possibilities, many studies have been done and results of the studies indicate that the estuary is potential for land reclamation, freshwater reservoir, fisheries development, eco-tourism and enhancement of ecosystem services including oyster reef/crab, renewable energy (tide, wave, wind), etc.
Through the maritime victory with neighboring countries, Myanmar and India in 2012 and 2014 respectively, Bangladesh has received entitlement on 118,813 km2 which is 80.51% of total Bangladesh in the BoB comprising its Territorial Sea, Exclusive Economic Zone (EEZ) and Continental Shelf. The maritime victory provides great opportunity to explore enormous natural resources in the Bay. Along with the exploration of vast marine resources there is huge potential of land reclamation and development.
Policy directives
National Water Policy has given emphasis on planning and implementation schemes for reclamation of land from the sea and river. Accordingly in National Water Management Plan (NWMP), an investment portfolio has been made for land reclamation, coastal protection and aforestation as one of the 84 programs under Agriculture and Water Management cluster. The national policy and activities of Government of Bangladesh for management of the coastal zone are aimed at improving the management of natural resources. Exploitation of potentials for reclamation and development of new land along the coastal fringes always got due importance in development initiatives with funding from Government of Bangladesh as well as development partners.
Background of land reclamation
Noakhali Cross Dam 1 was constructed connecting main land of Lakshmipur with the island, north Hatiya (presently Ramgati) in 1957; Noakhali Cross Dam 2 was constructed connecting main land of Sonapur with Char Jabbar in 1964; and Muhuri closure dam was constructed on flowing channel over Muhuri River outfall in 1985. As a result, more than 1000 sq. km of land reclaimed in the south of Noakhali (Figure 1). In view of land reclamation from the Meghna Estuary, several studies namely (a) Land Reclamation Project (LRP) and (b) Meghna Estuary Study (MES) during 1978 to 2002, and (c) Estuary Development Project (EDP) during 2007 to 2011 were conducted.
Figure 1: Land reclamation in south of Noakhali Figure 2: Priority list of 19 potential cross dam sites
ICID•CIID

20 | BANCID
Based on the LRP and MES findings, BWDB Task Force identified a priority list of 19 potential cross dam sites (Figure 2) with the objective to accelerate the natural processes of land accretion. During 2009-2010 Char Montaj-Char Khalifa Cross Dam (Bestin Closer) was constructed under EDP and approximately 4.0 sq. km. of land was reclaimed.
Out of 19 cross-dams, 4 small cross-dams were closed naturally, and during 2014-15 Char Islam-Char Mantaj Cross Dam was constructed under Climate Change Trust Fund (CCTF) and Char Mainka-Char Islam is under implementation.
In 2010, Government of Bangladesh from its own fund conducted a study titled ‘Engineering and Biological Intervention’ and have identified three potential cross dam sites which might be reclaimed using low cost local technology like bamboo porcupine, geo-tube, etc. These three sites are: (1) Char Nur Islam and Char Pia under Noakhali district, (2) Southern region of Nijhumdwip under Noakhali district, and (3) Under Char, Sonar Char, Rupar Char, Southern region of Rangabali under Potuakhali district.
In 2015, a closure was constructed at the estuary of Sandwip Channel over Little Feni River. Due to construction of this closure, about 3.00 sq. km of land reclamation is in process at the downstream of it.
Under Estuary Development Program (EDP) in 2010 four potential cross dam sites have been identified that would accelerate natural accretion process in the Sandwip–Urir Char–Noakhali (SUN) area. These are: (1) Urir Char-Noakhali, (2) Noakhali-Jahajer Char, (3) Jahajer Char-Sandwip and (4) Sandwip–Urir Char. Among them, the cross dam connecting Urir Char and Noakhali is being considered to be constructed first based on the recommendations of the detailed feasibility study report conducted by the World Bank during 2013-14.
Potential of land reclamation from continental shelf/sea
In view of the present and future plan for the economic progress of Bangladesh, increasing economic activities with more population growth need more land for industry, living and agriculture. Land reclamation from continental shelf/sea may provide an important solution to increasing land areas for a variety of purposes. Many countries like the Netherlands, China, Japan, South Korea, Bahrain, Singapore, the United Arabs Emirates (UAE) and Malaysia have vast experiences on land reclamation from sea. Bangladesh must seriously consider new ways to reclaim more land from the sea for its growing population.
The land reclamation from sea is a very complex process and it needs detailed investigations of sea bed mapping, sea bed topography and resource assessment. The geographical position of continental shelf of Bangladesh makes it more vulnerable to cyclonic storm surge and climate change. Moreover, the country has very limited idea about the impact of land reclamation from sea on environment and ecology. As such a comprehensive feasibility study considering the implementability (both technical and financial), implementation technology, social acceptability, environment, probable location of land and other issues as pointed out above should be undertaken. As per the recommendation of a feasibility study, a pilot program may be undertaken and the program may be spread out elsewhere based on its knowledge and experience.
Island Development
There are a number of islands in the Bay of Bengal such as St. Martin, Kutubdia, Hatiya, Sandwip, etc. These islands can be developed to reduce the demographic pressure on land, and to expand tourism and other economic activities which will help to improve the financial condition of local people and will also contribute to national economy.
One exemplary project regarding island development and inter-agency coordination is the Char Development and Settlement Project-IV (CDSP-IV) in which 5 ministries (MoWR is the lead ministry) and six agencies are involved. After the successive implementation of CDSP-I, II & III, this project was undertaken to reduce poverty and hunger for poor people living on newly accreted coastal chars, which would be achieved via improved and more secured livelihood. Security for people and livelihood would be provided via climate resilient infrastructures and by providing poor households with legal title to land. Under CDSP-I, II & III, about 1,650 sq. km. of land has been developed so far and about 310 sq. km. land development is in process under CDSP-IV.
Conclusion
It may be mentioned that potential cross dams were identified by BWDB task force team almost 14 years back. Since Meghna Estuary is very dynamic in nature, estuarine morphology has been changed a lot over the last few years. So, updated data and knowledge are essential for planning and implementation of land reclamation program and other programs for economic development of the country. In this circumstance, a new study project may be undertaken to update and synthesize all the past studies and field trials and consolidate them under a single umbrella to identify the most viable options for speeding up land winning in the estuary. The land reclamation from sea is a very complex process and it needs detailed investigations of sea bed mapping, sea bed topography and resource assessment.
ICID•CIID

BANCID | 21
Acknowledgement
The data and information used in this write up have been taken from the past studies done by various consultants under different projects of BWDB. The authors are grateful to the Project Director, CDSP-IV of BWDB for providing the data.
Sustainable Management of available Water Resources for hill ecosystemDr. Md. Mohabbat Ullah, Ex-Chief Scientific Officer, BARI
Dr. Sujit Kumar Biswas, Senior Scientific Officer, BARIDr. Sultan Ahmmed, Member Director (Natural Resources Management Division), BARC
Dr. Nazmun Nahar Karim, Chief Scientific Officer (Addl. Charge), BARCMd. Abdul Kader, Scientific Officer, KGF
Chittagong Hill Tracts (CHT) is the only extensive hill area in Bangladesh and is located in the south-eastern part of Bangladesh. The area of the CHT is about 13,184 sq km of which 92% is highland, 2% medium highland, 1% medium lowland and 5% homestead and water bodies. Jhum or shifting cultivation is still the cultivation system in the upland of this region. In the dry season small water bodies e.g. chara (small canal) are the main source of water for domestic and livestock uses and at the same time can serve as a source of irrigation for farming practices of small land holders in the CHT. Water is very scarce resource during the dry season (October-April) and becomes critical factor for ecological balance in CHT (Figure 1). As a result, the tribal people are suffering from food insecurity and the shifting agriculture had led to indiscriminate destruction of forest for food resulting ecological degradation. Traditional agriculture and environmental degradation in the CHT need environmentally compatible and economically viable agricultural systems.
The valley lands of the mountain regions are similar in nature as plain lands of the country. So, crop and water related technologies developed for the plains are also suitable for valley lands of mountain region. The integrated watershed management through rain water harvesting techniques, various conservation techniques for irrigation and fresh surface water of rivers and ‘Chara’ for irrigation are indispensable for the CHT region both for rural development and poverty alleviation. By constructing small water reservoirs in upstream hilly areas water can be supplied for irrigation in both hilly areas by pumping and the low land areas only by gravitational force.
Government is giving thrust to increase cropping intensity and food production. Under this situation, there is a scope of growing more crops in the underutilized and fallow lands of CHT hilly region which is about 10% of total landmass of the country. Introduction of suitable crops and irrigation technologies would increase farm productivity and ensure food security as a whole which will reduce the poverty level of the hilly poor farmers. Therefore, the study was undertaken to evaluate the technical and economic performance of sustainable management of available water resources of unfavorable hill ecosystems within CHT region under the supervision of Agricultural Engineering Unit, NRM Division, BARC and financing of Project Implementation Unit, National Agricultural Technology Project, Phase-1, BARC.
The study area was three upazilas of Khagrachhari hill district namely, Khagrachari sadar, Dighinala and Matiranga. Khagrachhari hill district is situated at the south of Chittagong and west of Rangamati and the other sides are surrounded by Tripura state of India (Figure 2).
Figure 1: Dryness due to lack of water in CHT
ICID•CIID

22 | BANCID
The estimation of available water resources is the prerequisite for fulfilling the demand of water for agriculture and domestic purposes through proper water management of this area. To determine the available water resources in Khagrachari hill district, six perennial charas and two rivers were selected for determining flow rates throughout the year and to see if water of these charas and rivers could be used for irrigation especially in the dry season. The six studied charas were Chenginala, Nayanpur, Komolchhari, Datkuppa, Kooki and Gobesona chara and the two rivers were the Chengi and the Myni. Rainwater harvesting reservoir was constructed for multipurpose use of rain water and zero energy irrigation in valley land. Dam was constructed for irrigation in hilly areas. Low lift pumps was used for irrigating the river belt valley fallow land in hilly areas. Existing cropping pattern was improved for increasing cropping intensity in project areas. Safe drinking water as well as keeping available water for irrigating homestead vegetables garden were ensured.
The flow rates of these charas and rivers changed throughout the year, decreasing during the summer months when rainfall is low and evaporation rate is high and increasing at the onset of rainy season. December to March is usually the months of lowest flow and May to July is the month of highest flow for most charas and rivers (Table 1). Peak flow of these charas was recorded in the month of May and ranged from 840 l/s for Chenginala to as high as 6700 l/s for Kooki chara. Charas were trained by constructing dam, dyke, weir, diversion box, etc. to make its water available for irrigation (Figure 3). Gravity fed irrigation was done by making dam/dyke with diversion box across the charas to raise the water level at a height required for irrigating the adjacent crop field by gravity flow.
Table 1: Discharge data of different Charas during 2013
Besides, three rain water harvesting reservoirs namely Giriswarna, Protap para and Tongthak para were constructed by making small dam between two hills across the water way. The capacity of these reservoirs was maximum in June and minimum in April (Table 2). The facilities of these reservoirs were such that valley land could be irrigated by gravity flow (at zero energy) only by the opening and closing of gate valve (Figure 4). Another facility is to enable the use of suction mode pump instead of force mode pump for lifting water at the hill top. A spillway in each dam was made by which extra storage of water is safely drained out. The storage capacity of these RWH reservoirs varied from 2,115 to 4,822 m3 for Giriswarna, 15,201 to 25,906 m3 for Protap para and 10,420 to 23,235 m3 for Tongthak para.
Chara (l/s) Jan Feb Mar Apr May June Jul Aug Sep Oct Nov Dec Chenginala 24.3 11.8 8.9 10.4 842.8 503.0 308.6 137.3 95.2 139.3 80.2 39.5 Noyonpur 47.0 24.0 14.5 37. 5 1196.0 752.2 1220.0 722.6 433.6 413.9 164.9 87.7 Komolchari 102.7 47.8 27.6 17.1 3995.0 433.3 867.8 1202.0 1767.0 1154.9 434.4 214.6
Figure 2: Map of Khagrachari district
Figure 3: Chara training using different technologies
ICID•CIID
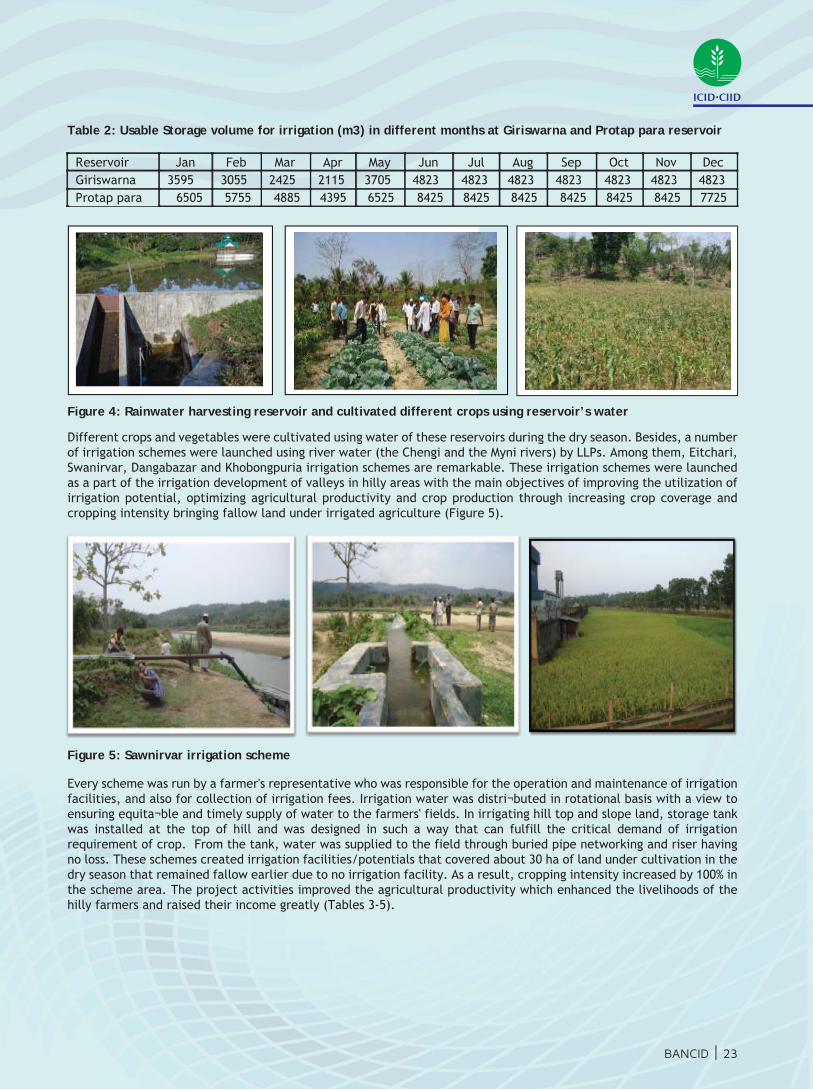
BANCID | 23
Table 2: Usable Storage volume for irrigation (m3) in different months at Giriswarna and Protap para reservoir
Figure 4: Rainwater harvesting reservoir and cultivated different crops using reservoir’s water
Different crops and vegetables were cultivated using water of these reservoirs during the dry season. Besides, a number of irrigation schemes were launched using river water (the Chengi and the Myni rivers) by LLPs. Among them, Eitchari, Swanirvar, Dangabazar and Khobongpuria irrigation schemes are remarkable. These irrigation schemes were launched as a part of the irrigation development of valleys in hilly areas with the main objectives of improving the utilization of irrigation potential, optimizing agricultural productivity and crop production through increasing crop coverage and cropping intensity bringing fallow land under irrigated agriculture (Figure 5).
Figure 5: Sawnirvar irrigation scheme
Every scheme was run by a farmer's representative who was responsible for the operation and maintenance of irrigation facilities, and also for collection of irrigation fees. Irrigation water was distri¬buted in rotational basis with a view to ensuring equita¬ble and timely supply of water to the farmers' fields. In irrigating hill top and slope land, storage tank was installed at the top of hill and was designed in such a way that can fulfill the critical demand of irrigation requirement of crop. From the tank, water was supplied to the field through buried pipe networking and riser having no loss. These schemes created irrigation facilities/potentials that covered about 30 ha of land under cultivation in the dry season that remained fallow earlier due to no irrigation facility. As a result, cropping intensity increased by 100% in the scheme area. The project activities improved the agricultural productivity which enhanced the livelihoods of the hilly farmers and raised their income greatly (Tables 3-5).
Reservoir Jan Feb Mar Apr May Jun Jul Aug Sep Oct Nov Dec Giriswarna 3595 3055 2425 2115 3705 4823 4823 4823 4823 4823 4823 4823 Protap para 6505 5755 4885 4395 6525 8425 8425 8425 8425 8425 8425 7725
ICID•CIID

24 | BANCID
Table 3: Yield, water productivity and economic performance of vegetables
Table 4: Yield, water productivity and economic performance of grain crops
Table 5: Yield, water productivity and economic performance of some horticultural crops
Yield (Kg/ha)
Water use (mm)
Water productivity (kg/ha/mm)
Net benefit (Tk/ha)
Benefit/ cost ratio
60000 340 176.5 105,358 3.01
14800 290 51.03 256,944 2.37
14000 270 51.8 0 120,000 1.85
15000 370 40.5 0 175,000 1.75 1000 250 4.00 100,000 2.00
30600 270 113.3 0 240,000 1.86
60000 310 193.5 0 300,000 2.0 0
66871 345 193.8 0 324,300 1.94
2000 310 6.45 362,500 1.52
14544 270 53.8 0 54,540 1.6 0
Crop varieties Yield (Kg/ha)
Water use (mm)
Water prod uctivity (kg/ha/mm)
Net benefit (Tk/ha)
Benefit/ cost ratio
Maize (green cob) 16666.6 0 450 37.03 19,109 1.4 0
Maize (seed) 3499.9 0 490 7.14 123,600 3.78
BRRI Dhan -28 4000 .00 1100 1.39 11,250 1.39
BRRI Dhan -29 4500 .00 1250 1.2 0 7,540 1.2 0
Crop varieties Yield (Kg/ha)
Water use (mm)
Water productivity (kg/ha/mm)
Net benefit (Tk/ha)
Benefit/ cost ratio
BARI Malta -1 10000 600 16.66 919,375 9.7 0
Litchi 7125 510 13.9 0 45 8,000 4.9 0
BARI -Am 10648 650 16.38 629,919 4.35
Sweet gourd (leaf)
Chilli
Red amaranth
Cucumber (Khira)Black cumin
Raishak
Cabbage
Bottle gourd
Country bean
Nafashak
Crop varieties
ICID•CIID
BANCID | 25
Stakeholder’s participation to manage water in the flood control, drainage and irrigation schemes in Bangladesh Water Development Board
Shamal C. Das, Executive Engineer, Office of the Chief Planning, BWDB Robin K. Biswas, Executive Engineer, Office of the Chief Planning, BWDB
Abstract
Peoples’ participation in the water management schemes is very essential. In the present article, the authors briefly overviewed the structure of the peoples’ participation documented in the major policies and actual implementation of the policy directives regarding the peoples’ participation in the water management schemes of Bangladesh Water Development Board (BWDB). The results suggests that BWDB is practicing the interagency coordination in some of the projects and two and three tier water management organizations (WMOs) for the operation and management of flood control, drainage and irrigation projects.
Introduction
The paradox of abundance and scarcity of water during monsoon and dry season respectively have made the water management a very complex issue in Bangladesh. Fortification from flood and guaranteeing food security remained in the central of the development of major water related policies in Bangladesh. To achieve both goals simultaneously, since inception, a total of 11,436 km of embankments have been implemented by the BWDB of which coastal and submersible embankments are 5,160 km and 2,130 km respectively. The embankments of BWDB provide flood control and drainage facilities to about 6.34 Mha of land which is about seventy five percent of the country’s net cultivable area. A number of studies (Datta et al., 1999, BUET, 1992) have concluded that the intended benefits from water management systems are not materializing, partly because of the institutional weaknesses. As such good water governance is essential in order to be successful in water management and participation of stakeholders is an integral part of good water governance for effective, efficient and sustainable water management.
Adoption of National Water Policy (NWPo) in 1999 was a breakthrough in formulating an inclusive and integrated policy and planning for the development and management of water resources. The NWPo suggested institutional reform by encouraging decentralization of water management through broad public participation (NWPo, 1999). In line with NWPo, the National Water Management Plan (NWMP) focused on integrated water resource management (IWRM) and provided a guiding principle for peoples’ participation at all phases of the project (NWMP, 2001).
In the present article, the authors briefly reviewed the framework of the peoples’ participation manifested in the policy documents and briefly summarized the structures of peoples’ participation which are practiced at present in the water management schemes of BWDB.
Guidelines development for peoples’ participation
The Land Reclamation and Delta Development Project supported by the Dutch introduced the concept of institutional development through the participation of the beneficiaries in late 1970’s (Quassem, 2001) in Bangladesh. However, the initiatives lost its direction by the mid 1980’s. The concept regained momentum again in 1994 after issuing Guidelines for People's Participation (GPP) by the Ministry of Water Resources (MoWR). A revised guideline was issued in 1999 for institutionalizing local participation which is known as the Proposal for Guidelines for Participatory Water Management. In the meantime, the Local Government Engineering Department prepared a numbers of reports to create a framework for peoples’ participation. In the admittance of too many guidelines and following the declaration of the NWPo in 1999, an Inter-Agency Taskforce Committee prepared the Guidelines for Participatory Water Management (GPWM) in order to avoid conflicts, remove duplications and accommodate flexibility, integrity and complementarities in water management through peoples’ participation (GPWM, 2000).
Structure of stakeholders’ participation
Participation of the local stakeholders is a continuous process in the pursuit of a sustainable development. Water sector projects are involved with two parallel but inter-related processes. One process deals with the structural interventions and the other involves with local stakeholders’ participation into its institutional setting. The process of stakeholder participation at different stages of water management is indicated in GPWM and recently enacted Participatory Water Management (PWM) Rules-2014. The institutional framework in which the local stakeholders will participate for water management will be known as the water management organization (WMO). Inhabitants of an area who are directly or indirectly affected by water management are referred to as local stakeholders in the guidelines. As per PWM Rules, beneficiary organizations for water management for schemes above 1,000 ha are no longer established under the coop-erative systems but are registered directly with the BWDB. A three-tier WMO is foreseen consisting of the Water
ICID•CIID

26 | BANCID
Management Group (WMG), Water Management Association (WMA) and Water Management Federation (WMF) depending on project size and complexity as shown in Figure 1. The scale of water management project such as small (less than 1,000 ha), medium (higher than 1,000 but less than 5,000 ha) and large (higher than 5,000 ha) are defined in the NWPo based on the project size.
Figure 1: Organogram of water management organization (WMO)
According to GPWM, the membership of the WMG and WMA is open to women and men belonging to the households of farmers, fishermen, small traders, craftsmen, boatmen, aqua culturists, landless people, destitute women, project affected peoples, etc, within the project who are influenced directly or indirectly and positively or negatively by the project/scheme and they are treated as the general members of both WMG and WMA. Up to June 2016, 1,678 groups have been formed by BWDB, where the male and female stakeholders are 1,16,886 and 29,919, respectively. On the other hand, at the same period, a total of 126 associations have been formed, where male and female stakeholders are 2,751 and 826, respectively.
Stakeholders’ participation in BWDB scheme
BWDB is mandated to implement all major surface water development projects and other FCDI projects having command area higher than 1,000 ha (NWPo, 1999). Therefore, the WMOs have either two or three tiers based on the guidelines of the GPWM. The stakeholders’ participation in different BWDB schemes and their tiers are shown in Table 1.
Table 1: WMOs and tier practiced in the BWDB schemes
Sl. No. Name of Zone Nos. of
projects Total area (×10 3 ha)
WMG (Nos.)
WMA (Nos.)
WMF (Nos.)
1 2 3 4 5 6 7 1 Northern Zone (Rangpur) 27 192 315 42 0 2 North -Western Zone (Rajshahi) 14 201 133 6 0 3 Western Zone (Faridpur) 11 199 345 23 0 4 South -Western Zone (Khulna) 4 129 404 16 0 5 Southern Zone (Barisal) 8 598 343 34 0 6 Central Zone (Dhaka) 53 439 200 11 0 7 Eastern Zone (Comilla) 6 128 106 4 0 8 North -Eastern Zone (Sylhet) 3 26 14 2 0 9 South -Eastern Zone (Chittagong) 17 72 108 8 0 Total 143 1,988 1,968 146 0
WMA WMF
(If necessary)
WMGWMG
WMA
WMG
WMG
WMF
WMA
WMG WMG
Up to 5000 ha. Below 1000 ha. Above 5000 ha.
ICID•CIID

BANCID | 27
The stakeholders are taking part in the operation and maintenance of the hydraulic structures such as operation, minor repairing and maintenance of sluice gates, removing weeds from the canals in order to improve the conveyance capacity and reduce water loss, irrigation water management on a rotational basis to improve the supply efficiency, collection of the service charges, etc. BWDB is responsible to conduct major operation and maintenance work of the structures, taking initiatives to boost up the financial capacity of the WMOs, providing training for capacity building of the WMOs, etc. In addition, BWDB is implementing projects to increase the interagency coordination such as Char Development and Settlement Project (CDSP), Blue Gold, South-west Area Integrated Water Resources Planning and Management Project, etc.
Conclusion
BWDB follows the structure as detailed in the policy documents of the water sector. In most of the cases, the WMOs have two tiers which are WMG and WMA. However, the sustainability and functionality of the WMOs rely on the financial capacity and motivation of the local people. As per PWM Rules, beneficiary organizations for water management for schemes above 1,000 ha are no longer established under the cooperative systems but are registered directly with the BWDB. The task to transfer the responsibility of all water resources management schemes is vast; as it requires the setting up of new beneficiary organizations throughout of the country. Therefore, processes through which the institutional framework for participatory water resources management can be established and strengthened need to be established.
Acknowledgement
The authors are grateful to the Chief Water Management, BWDB for providing the data.
References
BUET, 1992. Pilot program to improve management of FCDI projects (Phase-I), BWDB projects, IFCDR and WRE.
Datta, A. K., Soussan, J., Wattage, P., Nishat, A., Mirjahan, M., Saleh, A. F. M., and Duyne, J. E., 1999. Planning and management of water resources, The University Press Ltd., Dhaka.
GPWM, 2000. Guidelines for Participatory Water Management, Ministry of Water Resources, Government of the People’s Republic of Bangladesh.
NWMP, 2001. National Water Management Plan, Water Resources Planning Organization, Ministry of Water Resources, Government of the People’s Republic of Bangladesh.
NWPo, 1999. National Water Policy, Water Resources Planning Organization, Ministry of Water Resources, Government of the People’s Republic of Bangladesh.
Quassem, M. A., 2001. Water institutions-Bangladesh Experience, WARPO, Bangladesh.
Low-cost raised-bed lysimeter: A viable tool for salinity, drought and drainage research
Dr. Md. Hossain Ali, Agricultural Engineering Division, BINA
Traditional weighing or drainage type lysimeters are installed underground. It has many demerits: (1) Requires installation with an underground room or tunnel below the lysimeters for repair and maintenance of the whole system, (2) Measurement box construction of such design is only possible if there is no existence of shallow water table. Otherwise, this could advocate additional cost for water proof walls, (3) Requires skilled worker for construction, and (4) Cost of construction and maintenance is high. How well a lysimeter performs and represents the surrounding environment depend on a compromise between cost and efficacy.
Considering the above difficulties, a new type, raised-bed lysimeter is designed and constructed at BINA (Bangladesh Institute of Nuclear Agriculture) Head-quarter, Mymensingh. Construction at its sub-station Chapai Nawabgonj and Satkhira is underway. Already, we have conducted salinity and water-logging tolerance studies of different crop varieties successfully. The scope of studies with this type of lysimeter include: (1) the measurement of the hydrologic balance (of the lysimeter soil), (2) the determination of the chemical losses accompanying percolation, and (3) creation of desired drought, water-logging, and salt stress; and thereby identify the drought, water-logging, and salt tolerant crop cultivar. It will also permit multi-scale environmental research (scaling studies, i.e. the transfer of knowledge/technology from one spatial or temporal scale to another, of crop-water and/or hydrological processes).
ICID•CIID

28 | BANCID
1. Design and Construction aspects
1.1 Basic design aspects The lysimeter was constructed at BINA Head-quarter experimental farm, Mymensingh. The overall system consists of eighteen lysimeter boxes (1.2 m × 1.0 m × 0.62 m), arranged in 3 series having 6 in each series. The soil surface area (inner area) of the boxes is 1.2 m2 (1.2 m × 1.0 m) with effective soil depth of 0.5 m. The soil depth provides sufficient root zone depth for most of the field crops. Each lysimeter box has got provisions for surface runoff and deep percolation measurement (Figure 1). To provide better drainage facility and to prevent the soil from washing out through the drain pipe, envelop material (gravel and sand pack) was placed at the inlet of percolation pipe. Details of design aspects can be found in Ali and Rahman (2016).
1.2 Cost of construction Total cost for raised-bed lysimeter construction was around Taka 2.35 Lakh.
1.3 Facilities for measuring components of water balanceAccurate estimates of different components of hydrologic cycle under cropped and uncropped conditions are very important for water resource planning and management. These components can be written in the form of simplified water balance equation as:
I + P = R + D + ET + ΔSM .................... (1)
where, I=irrigation, P=precipitation, R=surface run-off, D=deep percolation, ET=evapotranspiration and ΔSM=change in soil moisture storage. The units in Equation (1) may be expressed in terms of volume or depth of water.
a. Measurement of surface runoff
Figure 1 shows the collection system of surface runoff from each lysimeter box. The runoff outlet pipe (2.0 cm diameter) was placed 12.0 cm from the top of the lysimeter box. Surface runoff can be collected in plastic container. To regulate the runoff, one stop cock is also fixed. Runoff volume can be measured from the runoff collector.
b. Measurement of deep percolation
Deep percolation beyond the root zone of the crops occurs due to frequent rainfall or irrigation practices as per crop need. The percolation collection pipe was set at the bottom of the lysimeter box maintaining a slope of 5% towards the outlet. The percolation amount can be collected in suitable small container and measured.
c. Estimation of evapotranspiration (ET)
The ET can be obtained by rearranging the Equation (1) as follows:
ET = I + P – D – R – ΔSM ........................... (2)
1.4 Measurement of soil-water within the lysimeter Profile soil-moisture within the lysimeter boxes can be measured in different ways: gravimetric method, by tensiometer, quick-draw soil moisture meter, TDR, radiological method (e.g. Neutron Moisture Meter), and Diviner. For using Neutron Moisture Meter and Diviner, the access tube may need to be reduced according to the effective soil depth of lysimeter.
1.5 Limitations of lysimeter and ways to minimize the errorsTo obtain data similar to natural field condition, the structure and profiling of the lysimeter soil should be similar to those of field soil. In case of difficulties to collect monolith soil block, valid data can also be obtained from properly filled-in lysimeters as long as soil disturbances do not significantly affect plant growth (FAO, 1982). In that case, reconstitution of the soil profile and approximation of the bulk density should be attempted as closely as possible. For the same reason, the lysimeter boxes were filled with imported soil. But sufficient care was taken to maintain natural compaction and bulk density.
2. Activities/works already done with the raised-bed lysimeter
Since its inception, salt tolerance study of rice (Figure 2) and water-logging tolerance studies of sesame (Figure 3) have been successfully completed. The system did not show any problem. Overall, the lysimeter performed well.
3. Concluding Remarks Compromising between cost and performance, it is an excellent tool for research of field crops. It can also be used for hydrologic studies and conservative tracer studies.
ICID•CIID
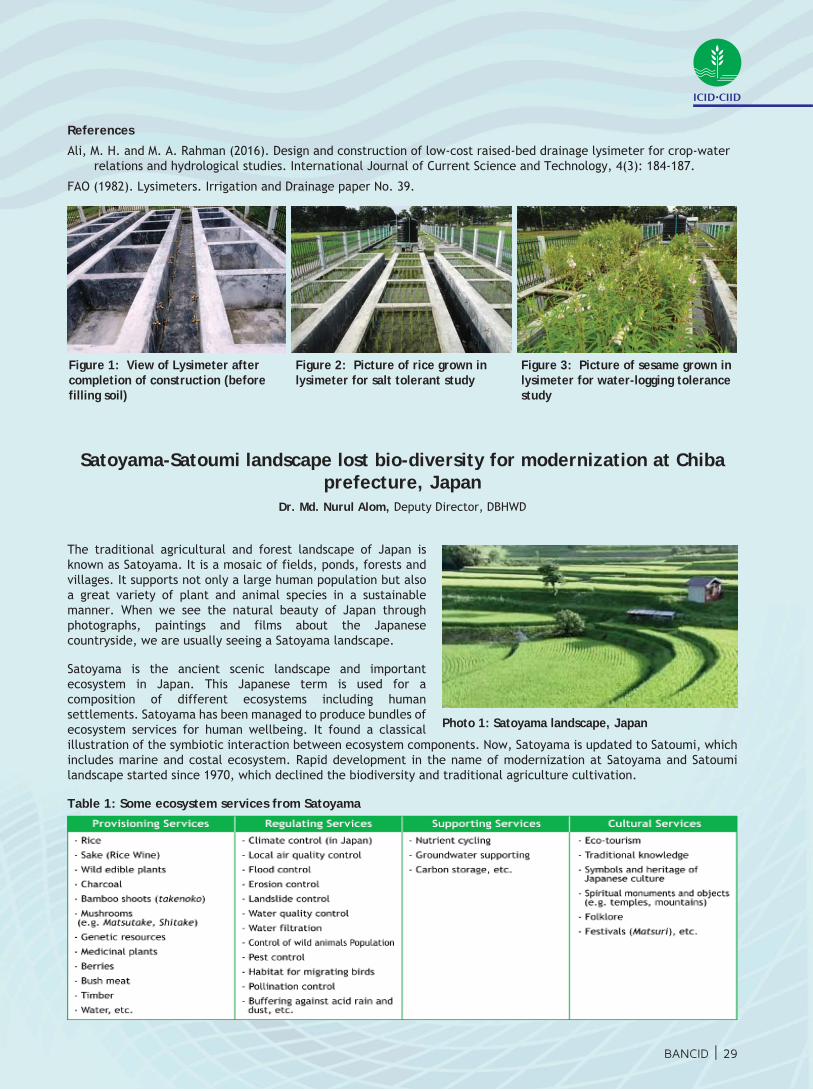
BANCID | 29
References
Ali, M. H. and M. A. Rahman (2016). Design and construction of low-cost raised-bed drainage lysimeter for crop-water relations and hydrological studies. International Journal of Current Science and Technology, 4(3): 184-187.
FAO (1982). Lysimeters. Irrigation and Drainage paper No. 39.
Satoyama-Satoumi landscape lost bio-diversity for modernization at Chiba prefecture, Japan
Dr. Md. Nurul Alom, Deputy Director, DBHWD
The traditional agricultural and forest landscape of Japan is known as Satoyama. It is a mosaic of fields, ponds, forests and villages. It supports not only a large human population but also a great variety of plant and animal species in a sustainable manner. When we see the natural beauty of Japan through photographs, paintings and films about the Japanese countryside, we are usually seeing a Satoyama landscape.
Satoyama is the ancient scenic landscape and important ecosystem in Japan. This Japanese term is used for a composition of different ecosystems including human settlements. Satoyama has been managed to produce bundles of ecosystem services for human wellbeing. It found a classical illustration of the symbiotic interaction between ecosystem components. Now, Satoyama is updated to Satoumi, which includes marine and costal ecosystem. Rapid development in the name of modernization at Satoyama and Satoumi landscape started since 1970, which declined the biodiversity and traditional agriculture cultivation.
Table 1: Some ecosystem services from Satoyama
Figure 1: View of Lysimeter after completion of construction (before filling soil)
Figure 2: Picture of rice grown in lysimeter for salt tolerant study
Figure 3: Picture of sesame grown in lysimeter for water-logging tolerance study
Photo 1: Satoyama landscape, Japan
ICID•CIID

30 | BANCID
Bio-diversity of Satoyama & Satoumi
A traditional landscape of Japan has been adversely affected by the modernization processes like land use conversion, rapid industrialization, urban expansion, land use pattern, drainage system, wetland filling, new ways of farming, cropping pattern change, consized forest area, rural-urban migration, etc. The result has gone against the Satoyama landscapes and yielded a reduction of the overall farm area where many native species of plants, mammals, reptiles, amphibians and freshwater fishes were alive. Twenty percent of these species are now under threat of extinction. Many of them are significant in Japanese culture.
A good number of studies has been done and is still continuing on the adverse effect of this modernization. The Japan Satoyama-Satoumi Assessment (JSSA), Sub-Global Assessment (SAAs), Millennium Ecosystem Assessment (MES), Habitat Evaluation Procedure (HEP), and Satoumi Evaluation Process (SEP) are the major initiatives. Some studies are continuing on a long term basis and some on short term. The author studied Chiba prefecture Satoyama under a training field visit titled “wise use of wetland resources for local benefit” from May to July, 2016 financed by JICA. It was a part of the training course to observe the different ecosystem and wetland resource management.
In the name of modernization, the prefecture government of Chiba reshaped all landscape, changed land use pattern, introduced new ways of agriculture, constructed cemented drainage system, etc. On a short term review, the study on the adverse effect of Satoyama & Satoumi finds that modernization process was not ecofriendly. Bangladesh is moving from the list of developing countries to developed countries. We are on the way to modernization. Urbanization, land use pattern change, crop diversification, squeezing farm area, etc. are the same processes for our modernization like Japan. We could learn a lesson from the ecosystem destruction of Satoyama, Japan.
Acknowledgement
The author is thankful to JICA for the financial help, and the Senior Secretary, Ministry of Water Resources and the Director General, Department of Bangladesh Haor and Wetlands Devel-opment for giving the chance to visit the Satoyama-Satoumi landscape at Chiba Prefecture, Japan.
Bibliography
http://archive.ias.unu.edu/resource_centre/SDM-EN_24Feb2011.pdf
http://arnoldia.arboretum.harvard.edu/pdf/articles/2003-62-4-conservation-for-satoyama-the-traditional- landscape-of-japan.pdf
http://link.springer.com/chapter/10.1007%2F978-94-007-7088-1_8#page-1
http://www.env.go.jp/en/wpaper/2011/pdf/16_Chapter3-2.pdf
Kambu, A. 2008. The need to conserve: The vanishing Satoyama heritage. In Conserving nature: A
Japanese perspective. Biodiversity network, Japan. PP 12-21.
Kumar, D. A. et al. 2012. Satoyama–Satoumi Ecosystems and Human Well-Being: Socio-Ecological
Production Landscapes of Japan. UNU press, Tokyo, Japan. 480 P.
Photo 2: Paddy field at Chiba, Japan
Photo 3: Drainage system at Satoyama
ICID•CIID


