Banca Generali: a successful business model...Bca Generali Bca Mediolanum Azimut Allianz Bank Bca...
29
Banca Generali: a successful business model 9M 2016 results and business overview 8 November 2016
Transcript of Banca Generali: a successful business model...Bca Generali Bca Mediolanum Azimut Allianz Bank Bca...

Banca Generali: a successful business model 9M 2016 results and business overview
8 November 2016

Investor presentation – 9M2016 results and business overview 2
9M 2016 results
Net inflows and recruiting
Assets, clients, FAs
Closing remarks
Agenda

Investor presentation – 9M2016 results and business overview 3
SOLID PROFITS IN A CHALLENGING ENVIRONMENT
• 3Q net profit up by 97% to €51.3m driven by a recovery of market-related revenues coupled with a sound trend in management fees
• Solid 9M net profit at €118.6m driven by growing assets and resilient margins offsetting tough financial markets and a temporary spike in operating costs
€118.6m (vs. €166.1m, -29% yoy)
NNM AND ASSETS AT ALL TIME HIGH LEVELS
• Strong 3Q net inflows, 94% of which in managed products with a growing share represented by ‘wrapper’ solutions
• Best-ever 9M net inflows (+36% yoy). Growth well above sector average thanks to the new wealth advisory approach, cutting-edge investment solutions and best-in-class professionals
• 9M assets at record-high levels of €45.3bn, up by 9% YTD reflecting strong business expansion and asset persistency
€4,087m (Vs. €3,016m, +36% yoy)
9M results at a glance
€51.3m (vs. €26.0m, +97% yoy)
€45.3bn (Vs. €41.6, +9% YTD)
€1,170m (Vs. €780m, +50% yoy)
Investor presentation – 9M2016 results and business overview 4
9M & 3Q 2016 results
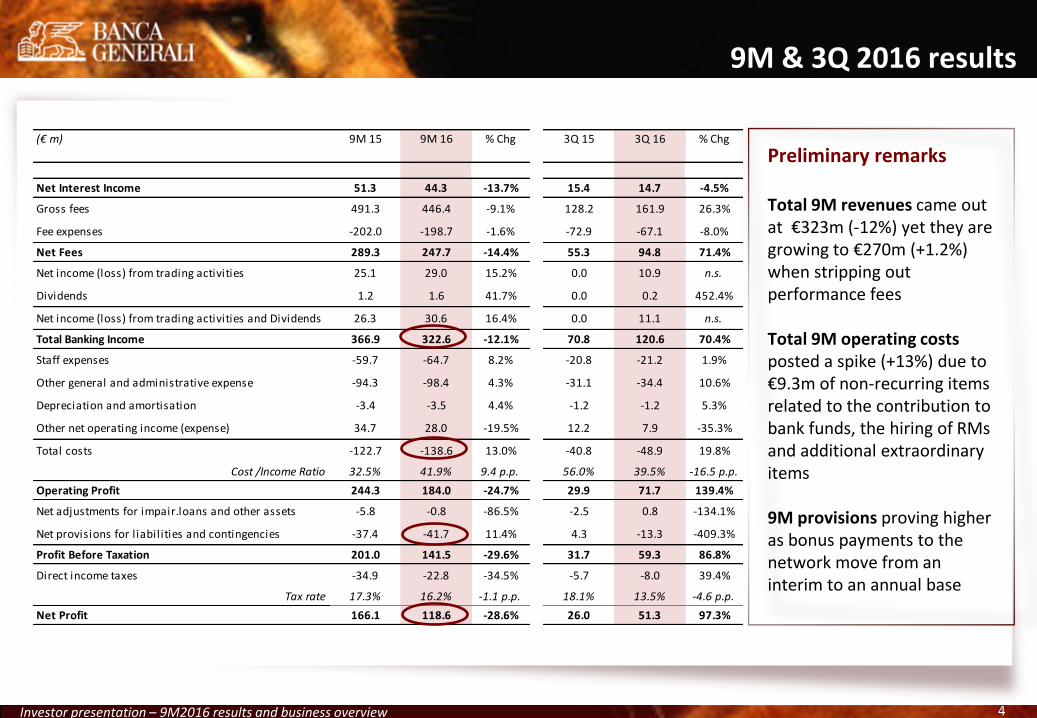
* Preliminary remarks Total 9M revenues came out at €323m (-12%) yet they are growing to €270m (+1.2%) when stripping out performance fees Total 9M operating costs posted a spike (+13%) due to €9.3m of non-recurring items related to the contribution to bank funds, the hiring of RMs and additional extraordinary items 9M provisions proving higher as bonus payments to the network move from an interim to an annual base
(€ m) 9M 15 9M 16 % Chg 3Q 15 3Q 16 % Chg
Net Interest Income 51.3 44.3 -13.7% 15.4 14.7 -4.5%
Gross fees 491.3 446.4 -9.1% 128.2 161.9 26.3%
Fee expenses -202.0 -198.7 -1.6% -72.9 -67.1 -8.0%
Net Fees 289.3 247.7 -14.4% 55.3 94.8 71.4%
Net income (loss) from trading activities 25.1 29.0 15.2% 0.0 10.9 n.s.
Dividends 1.2 1.6 41.7% 0.0 0.2 452.4%
Net income (loss) from trading activities and Dividends 26.3 30.6 16.4% 0.0 11.1 n.s.
Total Banking Income 366.9 322.6 -12.1% 70.8 120.6 70.4%
Staff expenses -59.7 -64.7 8.2% -20.8 -21.2 1.9%
Other general and administrative expense -94.3 -98.4 4.3% -31.1 -34.4 10.6%
Depreciation and amortisation -3.4 -3.5 4.4% -1.2 -1.2 5.3%
Other net operating income (expense) 34.7 28.0 -19.5% 12.2 7.9 -35.3%
Total costs -122.7 -138.6 13.0% -40.8 -48.9 19.8%
Cost /Income Ratio 32.5% 41.9% 9.4 p.p. 56.0% 39.5% -16.5 p.p.
Operating Profit 244.3 184.0 -24.7% 29.9 71.7 139.4%
Net adjustments for impair.loans and other assets -5.8 -0.8 -86.5% -2.5 0.8 -134.1%
Net provisions for l iabilities and contingencies -37.4 -41.7 11.4% 4.3 -13.3 -409.3%
Profit Before Taxation 201.0 141.5 -29.6% 31.7 59.3 86.8%
Direct income taxes -34.9 -22.8 -34.5% -5.7 -8.0 39.4%
Tax rate 17.3% 16.2% -1.1 p.p. 18.1% 13.5% -4.6 p.p.
Net Profit 166.1 118.6 -28.6% 26.0 51.3 97.3%

Investor presentation – 9M2016 results and business overview 5
Total revenue breakdown
Net Interest Income Trading & dividend Management fees Other fees andtrading commissions
Performance fees Fee expenses
51.3 26.3
340.5
50.5 100.3
-202.0
44.3 30.6
362.3
31.4 52.7
-198.7 9M15 (left column) – 9M16 (right column) (€ m)
9M revenue breakdown (€322.6m)
Financial income (NII + trading income) was supported by higher deposits and some profit taking on banking book to reduce risk exposure
Fee-expenses proved stable in absolute value as bonus schemes are still accounted as provisions at the 9M16
Management fees were driven by higher assets and stable asset profitability
Other fees, trading commissions and performance fees reflect persisting volatile financial market conditions over the period

Investor presentation – 9M2016 results and business overview 6
Stable Core NII in absolute value
(€ m)
Net Interest Income Quarterly trend
1Q15 2Q15 3Q15 4Q15 1Q16 2Q16 3Q16
15.7 17.1 15.4 14.9 15.1 14.4 14.2
3.1 0.5
Core NII LTRO/TLTRO
• Stable core NII on a quarterly basis benefiting from higher banking assets (€6.9bn, +31%) almost entirely offsetting lower investment return
• Financial asset portfolio at €4.9bn is retaining a defensive bias: 99% invested in bonds (o/w 87% in govt and 60% floating) with a 1.9 yrs duration and 4.3 yrs time to maturity
• Lending exposure amounts to €1.7bn with an average rate of 1.24%. NPL/total loans remains at negligible levels
1Q15 2Q15 3Q15 4Q15 1Q16 2Q16 3Q16
3.0 3.1 3.3 3.6 3.7 4.8 4.9
1.6 1.7 1.7 1.7 1.7
1.7 1.7
0.4 0.6 0.3 0.3 1.1
0.7 0.3
Financial assets Loans Others
(€ bn)
5.0 5.4 5.3 5.6
6.5 7.2 6.9
Quarterly volumes Quarterly trend
Investor presentation – 9M2016 results and business overview 7
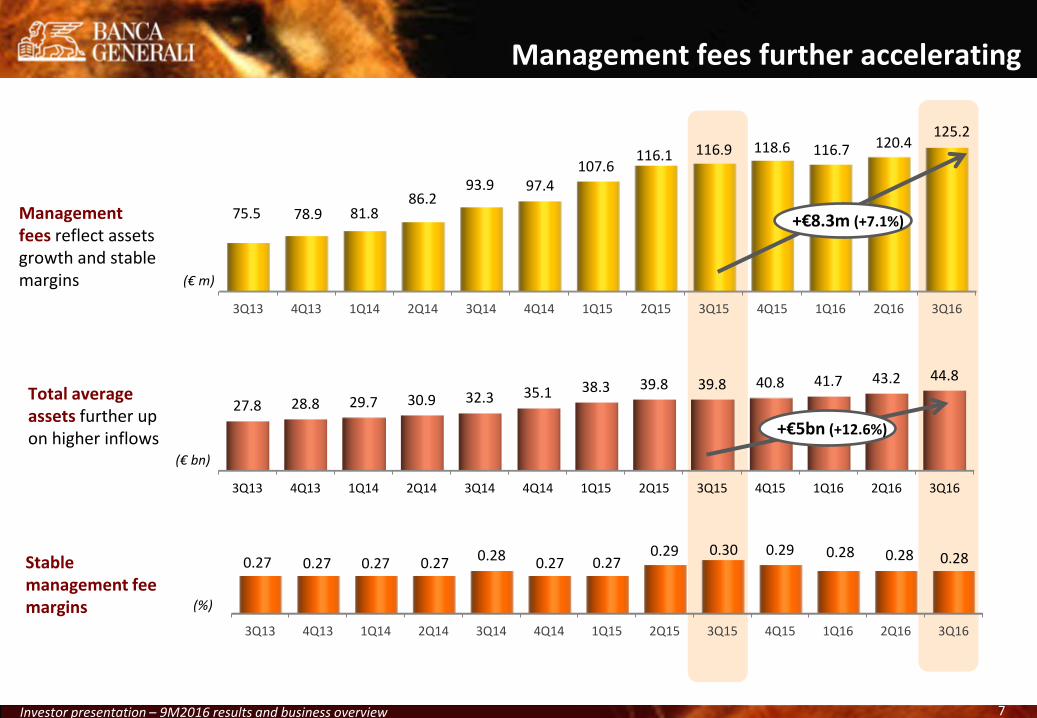
3Q13 4Q13 1Q14 2Q14 3Q14 4Q14 1Q15 2Q15 3Q15 4Q15 1Q16 2Q16 3Q16
27.8 28.8 29.7 30.9 32.3 35.1 38.3 39.8 39.8 40.8 41.7 43.2 44.8
Management fees further accelerating
3Q13 4Q13 1Q14 2Q14 3Q14 4Q14 1Q15 2Q15 3Q15 4Q15 1Q16 2Q16 3Q16
75.5 78.9 81.8 86.2
93.9 97.4 107.6
116.1 116.9 118.6 116.7 120.4 125.2
3Q13 4Q13 1Q14 2Q14 3Q14 4Q14 1Q15 2Q15 3Q15 4Q15 1Q16 2Q16 3Q16
0.27 0.27 0.27 0.27 0.28 0.27 0.27 0.29 0.30 0.29 0.28 0.28 0.28
Management fees reflect assets growth and stable margins
Total average assets further up on higher inflows
Stable management fee margins
+€8.3m (+7.1%)
(€ m)
(€ bn)
(%)
+€5bn (+12.6%)
Investor presentation – 9M2016 results and business overview 8
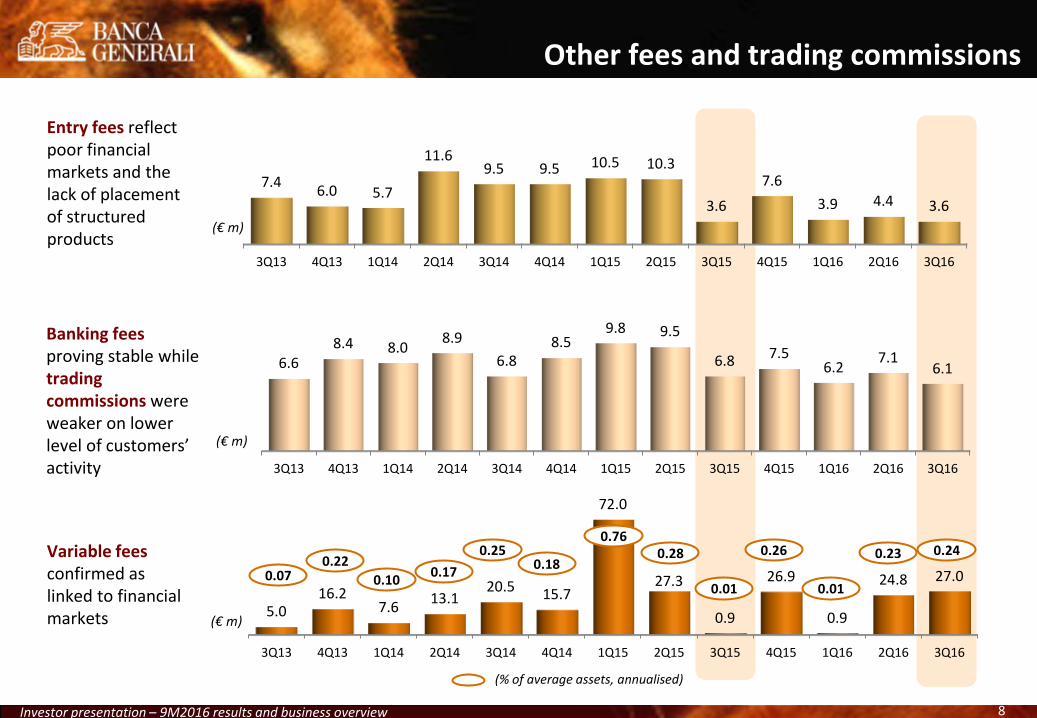
Other fees and trading commissions
Entry fees reflect poor financial markets and the lack of placement of structured products
Banking fees proving stable while trading commissions were weaker on lower level of customers’ activity
Variable fees confirmed as linked to financial markets
3Q13 4Q13 1Q14 2Q14 3Q14 4Q14 1Q15 2Q15 3Q15 4Q15 1Q16 2Q16 3Q16
7.4 6.0 5.7
11.6 9.5 9.5 10.5 10.3
3.6
7.6
3.9 4.4 3.6
3Q13 4Q13 1Q14 2Q14 3Q14 4Q14 1Q15 2Q15 3Q15 4Q15 1Q16 2Q16 3Q16
6.6 8.4 8.0
8.9
6.8 8.5
9.8 9.5
6.8 7.5 6.2
7.1 6.1
3Q13 4Q13 1Q14 2Q14 3Q14 4Q14 1Q15 2Q15 3Q15 4Q15 1Q16 2Q16 3Q16
5.0 16.2
7.6 13.1
20.5 15.7
72.0
27.3
0.9
26.9
0.9
24.8 27.0
(€ m)
(€ m)
(€ m)
0.07 0.22
0.10 0.17
0.25 0.18
0.76 0.28
0.01
0.26
0.01
0.23
(% of average assets, annualised)
0.24

Investor presentation – 9M2016 results and business overview 9
One-off items driving costs temporarily higher
(€ m)
Non-salespersonnel costs
(+5%, +1.8% ex one-offs)
Sales personnelcosts (+24%, +4.8%
ex one-offs)
BRRD and FITDfunds (differently
accounted in 9M15)
G&A (+11%, +8.4%ex one-offs)
Depreciation
49.3
10.5
0
59.6
3.4
51.7
13.0
4.2
66.2
3.5
Operating costs at €129.3m (+5.3%) excl. €9.3m for one-off items
Operating costs breakdown (€138.6m)
9M15 (left column)
9M16 (right column)
Cost guidance of +4% by 2016 YE reaffirmed
1.5
2.0
4.2
1.6
€2.0m for variable compensation for the recruiting of high-profile private bankers
€4.2m accounted as costs instead of provisions like in 9M15
€1.6m related to non recurring items linked to the group reorganization and to other non-core activities
€1.5m for a one-off payment of the Long-term-incentive plan (LTIP)
€1.5m €2.0m €4.2m €1.6m
Investor presentation – 9M2016 results and business overview 10
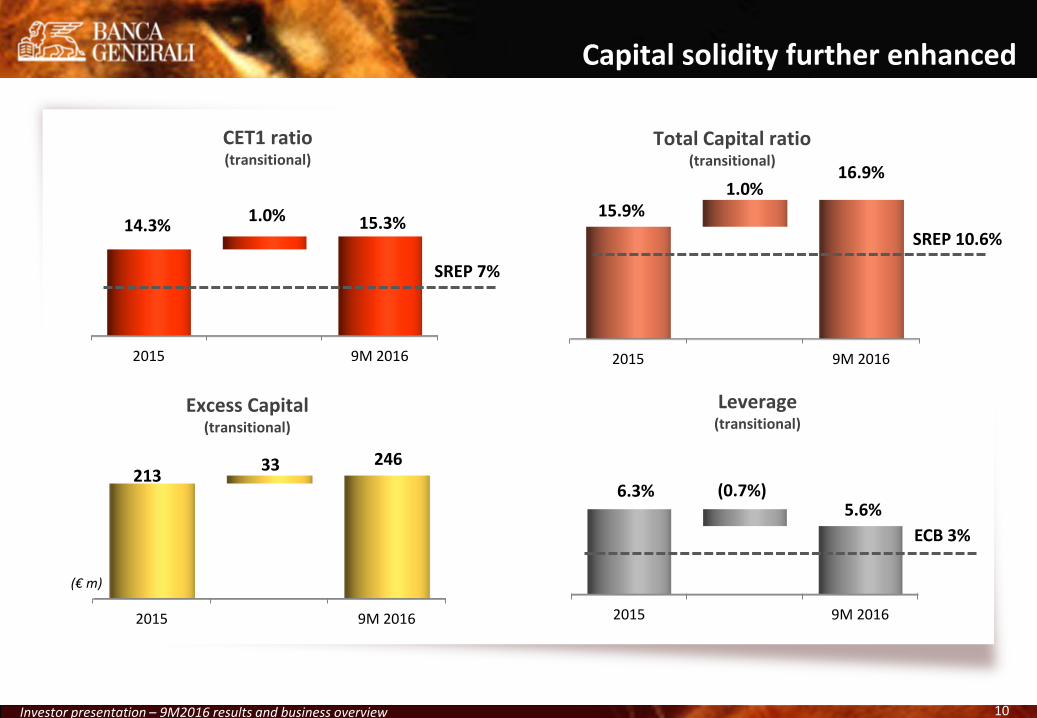
Capital solidity further enhanced
(€ m)
2015 9M 2016
213 33 246
2015 9M 2016
14.3% 1.0% 15.3%
2015 9M 2016
15.9% 1.0%
16.9%
Total Capital ratio (transitional)
CET1 ratio (transitional)
Excess Capital (transitional)
2015 9M 2016
6.3% (0.7%) 5.6%
Leverage (transitional)
SREP 7%
SREP 10.6%
ECB 3%
Investor presentation – 9M2016 results and business overview 11
9M 2016 results
Net inflows and recruiting
Assets, clients, FAs
Business update & closing remarks
Investor presentation – 9M2016 results and business overview 12
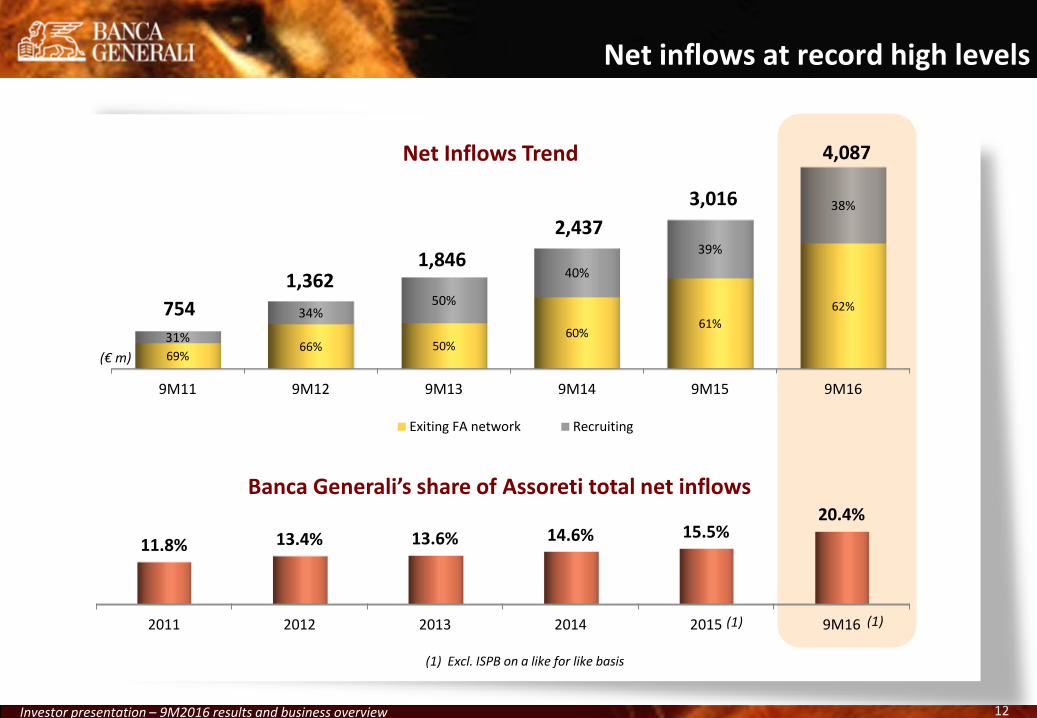
Net inflows at record high levels
Net Inflows Trend
(€ m)
Banca Generali’s share of Assoreti total net inflows
(1)
(1)
2011 2012 2013 2014 2015 9M16
11.8% 13.4% 13.6% 14.6% 15.5% 20.4%
9M11 9M12 9M13 9M14 9M15 9M16
69% 66% 50%
60% 61%
62%
31%
34% 50%
40%
39%
38%
Exiting FA network Recruiting
754
1,362 1,846
2,437
3,016
4,087
(1) Excl. ISPB on a like for like basis
(1)

Investor presentation – 9M2016 results and business overview 13
Net Inflows: Banca Generali vs. sector
1Q 2Q 3Q 9M
7.5 7.7 5.4
20.6
7.7 6.6 5.7
20.0
1Q 2Q 3Q 9M
5.5 5.5 4.1
15.1
5.6 4.8 4.2
14.7
2015 2016
1Q 2Q 3Q 9M
1.1 1.1 0.8
3.0
1.5 1.4 1.2
4.1
Banca Generali
Assoreti (ex-ISPB)
Top 5 (ex-BG)
-14% -3%
+36%
+3% +6%
+3% -13% +2%
-3%
+36% +27% +50% (€ bn)
(€ bn)
(€ bn)
Source: Company data, Assoreti (Italian Association of Financial Advisors’ networks), Top5: Banca Fideuram (ex-ISPB), Banca Mediolanum, Finecobank, Allianz Bank, Azimut
Investor presentation – 9M2016 results and business overview 14
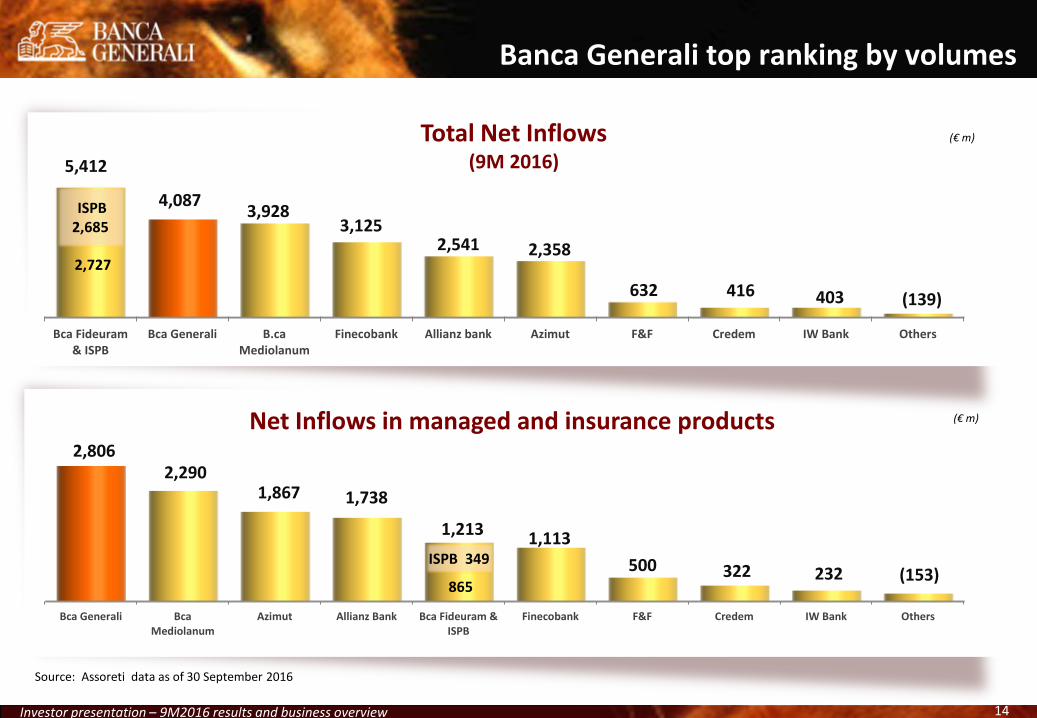
Net Inflows in managed and insurance products (€ m)
Bca Generali BcaMediolanum
Azimut Allianz Bank Bca Fideuram &ISPB
Finecobank F&F Credem IW Bank Others
2,806 2,290
1,867 1,738
1,213 1,113
500 322 232 (153)
Total Net Inflows (9M 2016)
Bca Fideuram& ISPB
Bca Generali B.caMediolanum
Finecobank Allianz bank Azimut F&F Credem IW Bank Others
5,412
4,087 3,928
3,125 2,541 2,358
632 416 403 (139)
Banca Generali top ranking by volumes
(€ m)
ISPB 2,685
2,727
ISPB 349
Source: Assoreti data as of 30 September 2016
865

Investor presentation – 9M2016 results and business overview 15
Net Inflows in managed and insurance products/ Financial Advisor
(€ ‘000)
BANCAGENERALI
Azimut Allianz Bank Credem B.caMediolanum
AVERAGE (ex-BG)
Finecobank F&F IWBank Bca Fideuram
1,562
1,139
755 587 524 435 424 351 287 209
Net Inflows/Financial Advisor
BANCAGENERALI
Azimut Finecobank Allianz Bank B.ca Fideuram B.caMediolanum
AVERAGE (ex-BG)
Credem IW Bank F&F
2,275
1,439 1,190 1,104 930 899 890 758
498 444
Banca Generali ranking No. 1 by productivity
(€ ‘000)
Source: Assoreti data as of 30 September 2016

Investor presentation – 9M2016 results and business overview 16
Well-balanced product mix
Net inflows: Product mix by quarter
1,530 1,387
(€ m)
1Q16 2Q16 3Q16
45% 38%
6%
40%
27%
23%
15%
35%
71%
Banking products Traditional life policies
Managed products
1,170
(€ m)
Net inflows: Wrappers growing fastest
1Q16 2Q16 3Q16
253 305 306
58
365 433
BG Stile Libero BG Solution
311
670 739
Investor presentation – 9M2016 results and business overview 17
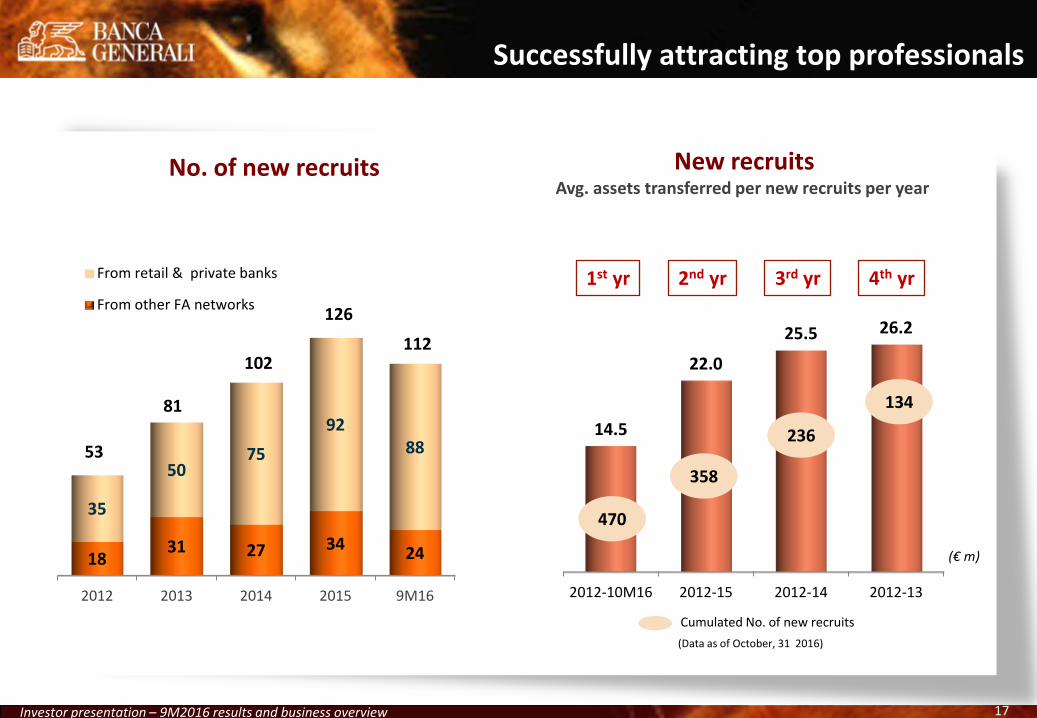
Successfully attracting top professionals
2012 2013 2014 2015 9M16
18 31 27 34
24
35
50 75
92 88
From retail & private banks
From other FA networks
112 102
126
No. of new recruits New recruits Avg. assets transferred per new recruits per year
(€ m)
2012-10M16 2012-15 2012-14 2012-13
14.5
22.0
25.5 26.2
Cumulated No. of new recruits
4th yr
358
236
134 81
53
470
3rd yr 2nd yr 1st yr
(Data as of October, 31 2016)
Investor presentation – 9M2016 results and business overview 18
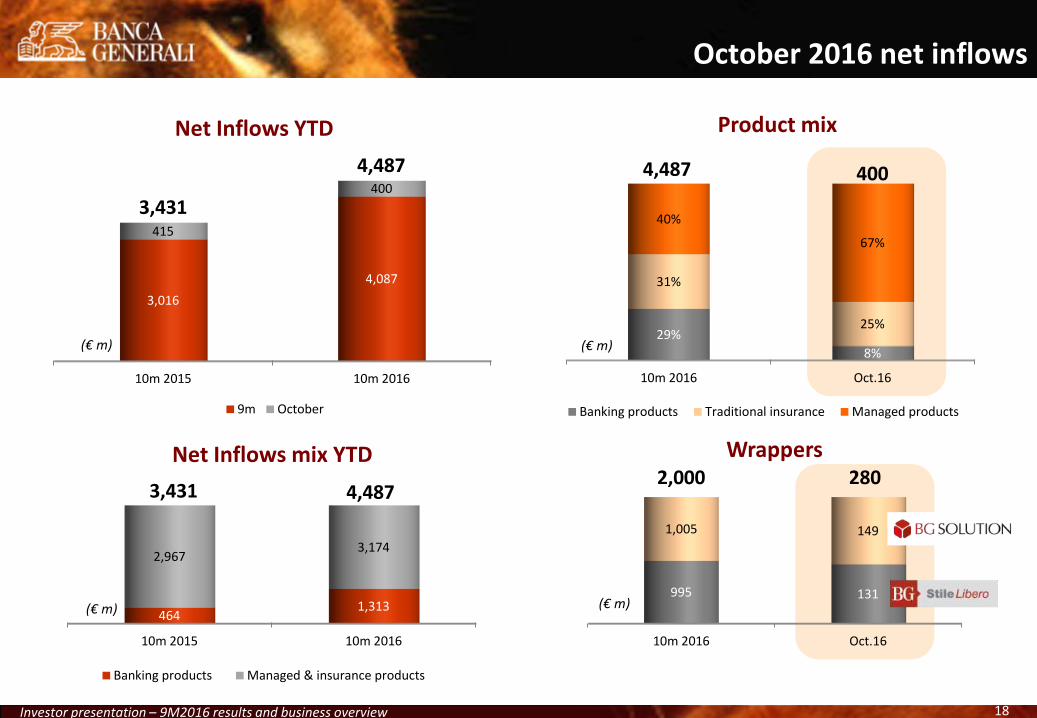
October 2016 net inflows
Product mix
Wrappers
(€ m)
4,487 400
2,000 280
(€ m)
3,431
4,487
(€ m)
Net Inflows YTD
10m 2016 Oct.16
29%
8%
31%
25%
40%
67%
Banking products Traditional insurance Managed products
10m 2016 Oct.16
995 131
1,005 149
10m 2015 10m 2016
464 1,313
2,967 3,174
Banking products Managed & insurance products
Net Inflows mix YTD
3,431 4,487
(€ m)
10m 2015 10m 2016
3,016
4,087
415
400
9m October

Investor presentation – 9M2016 results and business overview 19
9M 2016 results
Net inflows and recruiting
Assets, clients, FAs
Business update & closing remarks

Investor presentation – 9M2016 results and business overview 20
Assets overview (1/2)
(€ bn)
39.3 45.3
Wrapper solutions Total Assets
Managed vs. non-managed
Wrappers/Managed assets
9M15 9M16
3.9 (13%) 6.2 (18%)
26.1 (87%)
28.4 (82%)
Wrappers Other managed assets
9M15 9M16
9.3 (24%) 10.7 (24%)
30.0 (76%)
34.6 (76%)
Administered assets Managed assets
9M15 9M16
10.8 (36%)
12.0 (35%)
19.2 (64%)
22.6 (65%)
BGFM Lux (retail & Institutional) Other managed assets
(€ bn)
Lux-based assets Lux-based assets/Managed assets
30.0 34.6
30.0 34.6
(€ bn)
Investor presentation – 9M2016 results and business overview 21
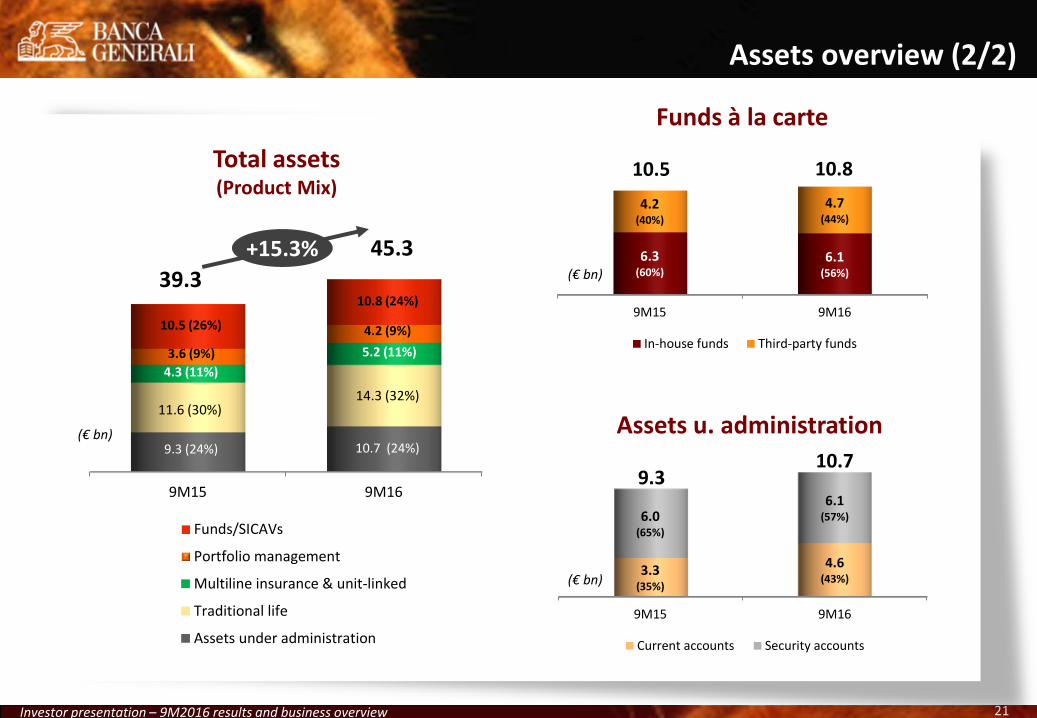
Assets overview (2/2)
(€ bn)
9M15 9M16
9.3 (24%) 10.7 (24%)
11.6 (30%) 14.3 (32%)
4.3 (11%)
5.2 (11%) 3.6 (9%)
4.2 (9%) 10.5 (26%)
10.8 (24%)
Funds/SICAVs
Portfolio management
Multiline insurance & unit-linked
Traditional life
Assets under administration
39.3
45.3 +15.3%
Funds à la carte
Total assets (Product Mix)
Assets u. administration
9M15 9M16
3.3 (35%)
4.6 (43%)
6.0 (65%)
6.1 (57%)
Current accounts Security accounts
9M15 9M16
6.3 (60%)
6.1 (56%)
4.2 (40%)
4.7 (44%)
In-house funds Third-party funds
(€ bn)
(€ bn)
10.5 10.8
9.3 10.7

Investor presentation – 9M2016 results and business overview 22
Financial Advisor overview (1/2)
FAs by avg. portfolio size and related assets
1,797 45.3
No. of FAs (heads) Total Assets (€bn)
23%
7%
20%
10%
58%
83%
4mln - 10 mln 10mln - 15 mln > 15mln
2013 2014 2015 9M16
621
816
943
1,037
No. of FA with assets >€15m
FAs with assets >€15m
33.4
34.3
35.7
36.1
Avg. Assets/FA (€m)
71%
77%
81%
% on total assets
83%
Investor presentation – 9M2016 results and business overview 23
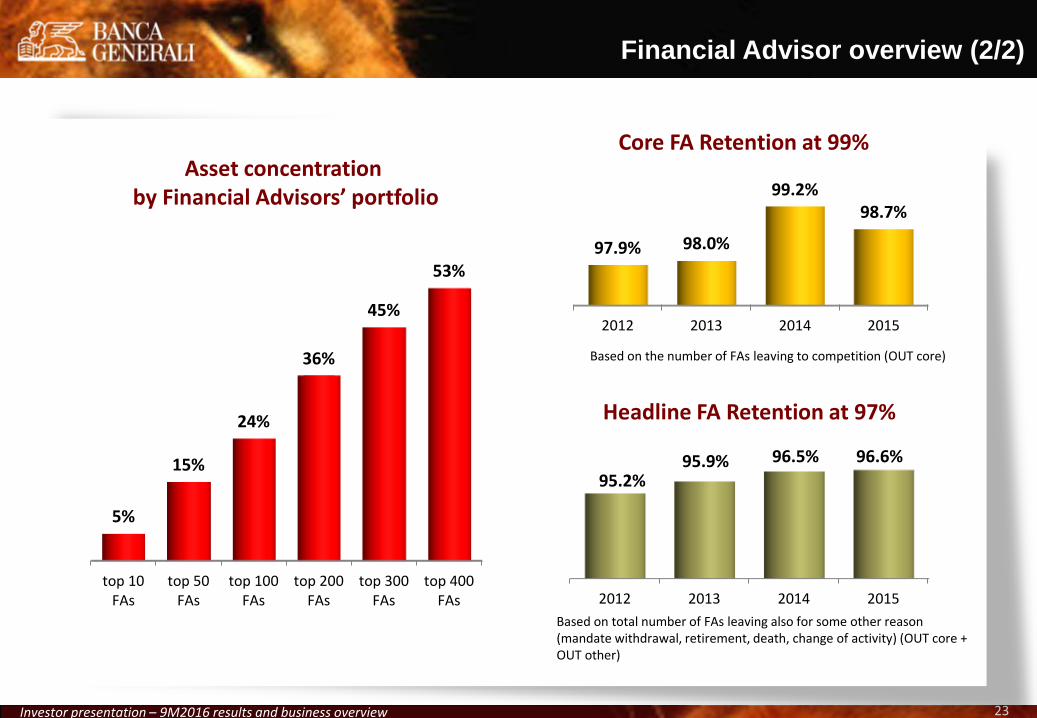
Financial Advisor overview (2/2)
Core FA Retention at 99%
2012 2013 2014 2015
97.9% 98.0%
99.2% 98.7%
Headline FA Retention at 97%
2012 2013 2014 2015
95.2% 95.9% 96.5% 96.6%
Based on total number of FAs leaving also for some other reason (mandate withdrawal, retirement, death, change of activity) (OUT core + OUT other)
Based on the number of FAs leaving to competition (OUT core)
top 10FAs
top 50FAs
top 100FAs
top 200FAs
top 300FAs
top 400FAs
5%
15%
24%
36%
45%
53%
Asset concentration by Financial Advisors’ portfolio

Investor presentation – 9M2016 results and business overview 24
2013 2014 2015 9M16
10,746
13,939
16,073
17,739
No. of clients with assets >500K
Customer overview (1/2)
No. of customers (>€10K) and related assets
(€ bn)
No. of Private Clients with Assets >€500K
Avg. Assets per private client (€m)
54%
58%
60%
61%
% on total assets
197.3 45.1
No. of clients >€10K assets Total related assets
61%
11%
30%
28%
9%
61%
clients <€100K clients <€500K clients > €500k
1.5
1.5
1.6 1.6

Investor presentation – 9M2016 results and business overview 25
Customer overview (2/2)
TOT. CUSTOMER AVG. TENURE 1
13 years 10 months
TOT. CUSTOMER CHURN-RATE 5%
11 years 10 months
Asset concentration by customer
top 25clients
top 100clients
top 500clients
top 1,000clients
top 2,000clients
top 5,000clients
2.7%
6.1%
14.2%
19.5%
26.4%
38.4%
1 Total customer average tenure is calculated on the base of customers with Banca Generali by more than one year

Investor presentation – 9M2016 results and business overview 26
9M 2016 results
Net inflows and recruiting
Assets, clients, FAs
Closing remarks
Investor presentation – 9M2016 results and business overview 27
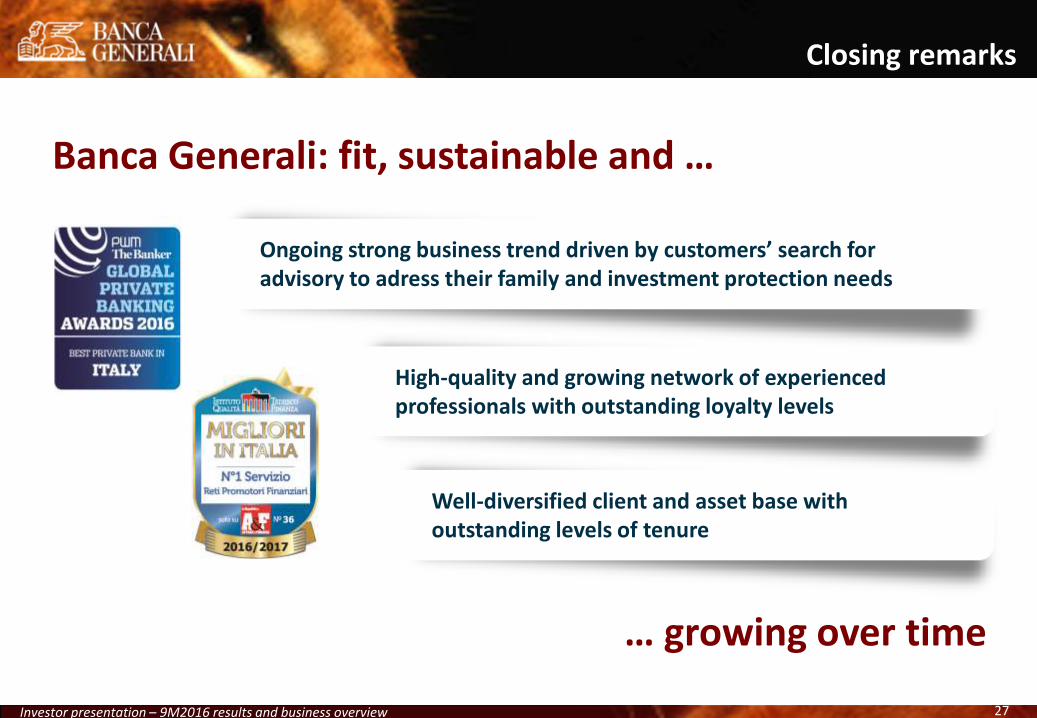
Ongoing strong business trend driven by customers’ search for advisory to adress their family and investment protection needs
Closing remarks
Well-diversified client and asset base with outstanding levels of tenure
High-quality and growing network of experienced professionals with outstanding loyalty levels
Banca Generali: fit, sustainable and …
… growing over time

Investor presentation – 9M2016 results and business overview 28
Contacts
Investor Relations Contacts
Giuliana Pagliari Investor Relations Officer Phone +39 02 6076 5548 Mobile +39 331 65 30 620 E-mail: [email protected] E-mail: [email protected]
Corporate Website www.bancagenerali.com
Banca Generali Investor App
Investor presentation – 9M2016 results and business overview 29
Disclaimer
The manager responsible for preparing the company’s financial reports (Paolo Tamagnini) declares, pursuant to paragraph 2 of Article
154-bis of the Consolidated Law of Finance, that the accounting information contained in this press release corresponds to the document
results, books and accounting records.
P. Tamagnini, CFO
Certain statements contained herein are statements of future expectations and other forward-looking statements.
These expectations are based on management’s current views and assumptions and involve known and unknown risks and uncertainties.
The user of such information should recognize that actual results, performance or events may differ materially from such expectations
because they relate to future events and circumstances which are beyond our control including, among other things, general economic
and sector conditions.
Neither Banca Generali S.p.A. nor any of its affiliates, directors, officers employees or agents owe any duty of care towards any user of
the information provided herein nor any obligation to update any forward-looking information contained in this document.