B&M European Value Retail Preliminary Results Presentation ...
33
B&M European Value Retail Preliminary Results Presentation 52 weeks to 31 st March 2019
Transcript of B&M European Value Retail Preliminary Results Presentation ...

B&M European Value Retail Preliminary Results Presentation
52 weeks to 31st March 2019

Ref: 7504932
FY19 Group Highlights
• Group revenues increased by 17.1% to £3,486.3m
B&M UK LFL revenues +0.7% with a strong finish, Q4 LFL +5.8%
54 gross new B&M store openings in the UK and a net 44
20 gross new store openings at Heron and a net 16
10 new store openings at Jawoll and £129.1m revenues from Babou
• B&M UK adjusted EBITDA growth of +13.5%
• Group adjusted EBITDA increased by 11.9% to £312.3m
• Adjusted diluted EPS 19.7p, an increase of 10.7%
• Net cashflow from operations £259.4m, (FY18: £242.0m)
• Full year dividend 7.6p

Ref: 7504933
Paul McDonald
Chief Financial Officer

Ref: 7504934
Summary Profit and Loss
£ millions, £ millions, March year end FY18A1 FY19A % FY18A (53 Weeks)
Group Stores 927 1,093 17.9% 927
Revenues 2,976.3 3,486.3 17.1% 3,029.8
Gross Profit 1,010.2 1,189.4 17.7% 1,028.4
% 33.9% 34.1% 18bps 33.9%
Operating Costs (731.2) (877.1) 20.0% (745.1)
Adjusted EBITDA 279.0 312.3 11.9% 283.3
% 9.4% 9.0% (42)Bps 9.4%
Depreciation and Amortisation (36.2) (49.7) 37.4% (36.9)
Interest (21.4) (22.9) 7.3% (21.6)
Adjusted Profit Before Tax 221.5 239.8 8.2% 224.8
Costs2 (4.9) 2.5 (146.1)% (4.9)
Interest3 9.4 7.2 (23.7)% 9.4
Profit / (Loss) Before Tax 226.1 249.4 10.3% 229.3
Adjusted Diluted Earnings per Share (p) 17.8p 19.7p 10.7% 18.0p
Statutory Diluted Earnings per Share (p) 18.3p 20.5p 12.0% 18.6pNote: 1. FY18 relates to the 52 weeks ending 24 March 2018Note 2. Refer to financial statementsNote 3. Refer to page 10
Ref: 7504935
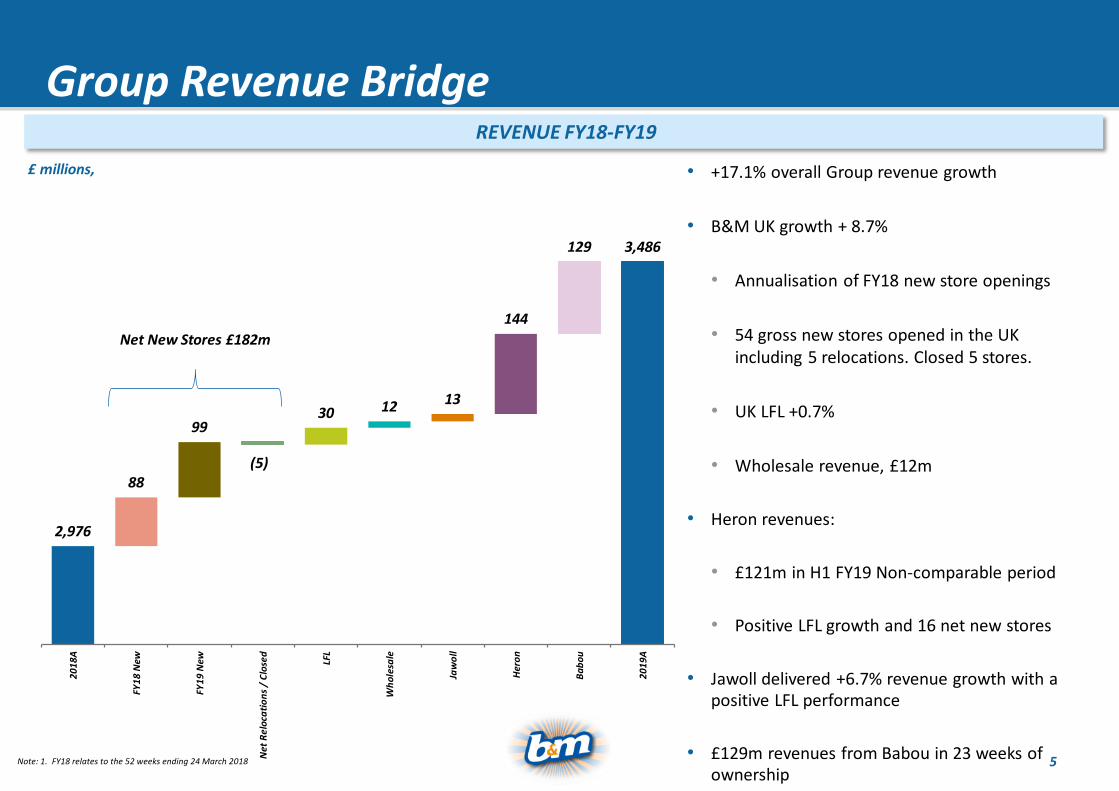
Group Revenue Bridge REVENUE FY18-FY19
£ millions, • +17.1% overall Group revenue growth
• B&M UK growth + 8.7%
• Annualisation of FY18 new store openings
• 54 gross new stores opened in the UK including 5 relocations. Closed 5 stores.
• UK LFL +0.7%
• Wholesale revenue, £12m
• Heron revenues:
• £121m in H1 FY19 Non-comparable period
• Positive LFL growth and 16 net new stores
• Jawoll delivered +6.7% revenue growth with a positive LFL performance
• £129m revenues from Babou in 23 weeks of ownership
2,976
88
99
(5)
30 12 13
144
129 3,486
20
18
A
FY1
8 N
ew
FY1
9 N
ew
Net
Re
loca
tio
ns
/ C
lose
d
LFL
Wh
ole
sale
Jaw
oll
Her
on
Ba
bo
u
20
19
A
Net New Stores £182m
Note: 1. FY18 relates to the 52 weeks ending 24 March 2018

Ref: 7504936
Continued UK EBITDA Growth
ADJUSTED EBITDA BRIDGE FY18-FY19
GroupMargin %
£ millions,
9.4% 9.0%
B&M Fascia
Margin %
10.2% 10.6% +45bps
279.0
10.9
13.2 0.3
14.7
(3.7)
(15.8)
8.2
5.6 312.3
2018
A
FY1
8 N
ew
FY1
9 N
ew
Net
Rel
oca
tio
n/C
lose
d LFL
Cen
tra
l
Jaw
oll
Her
on
Ba
bo
u
2019
A
Note: 1. FY18 relates to the 52 weeks ending 24 March 2018

Ref: 7504937
B&M Fascia LFL Sales FY19 STRONG Q4 COMMENTARY
H1 +0.0%
7.3%7.7%
3.9%
0.1%
1.6%
-1.6% -1.6%
5.8%
Q1 Q2 Q3 Q4
FY18 FY19
H2 +1.4%• Full year LFL sales growth of +0.7%
• Strong Q4 +5.8% LFL and +6.7% excluding Easter impact
• There has been growth in both customer numbers and
average transaction values
• Retail price inflation continues to ease
• The grocery / FMCG price gap remains unchanged and LFL
revenues on that category have been strong in the year
• Homewares had a challenging year and impacted the
overall LFL by approx. -1.8%
• We have seen a pleasing start to the new financial year with
YTD LFL in mid single digits

Ref: 7504938
Group Gross Margin Performance
33.9% 34.1%
FY18A FY19A
GROUP GROSS MARGIN (%) KEY HIGHLIGHTS
• B&M fascia margins were 29bps higher than last year
• Despite headwind of further shift in the mix towards
grocery / FMCG ranges
• Despite impact of wholesale margin on c. £12m sales
• Offset by good sell through on seasonal product
categories and less promotional activity
• Heron margins were 57bps lower than last year reflecting a
higher mix of branded ambient products
• Jawoll margins were 392bps lower than last year impacted
by the stock clearance activities
• Babou traded at a 42.3% margin for the 23 weeks of
ownership

Ref: 7504939
Group Operating Costs
FY18 FY19
B&M 608.5 657.0
Heron 55.5 91.6
Jawoll 67.1 79.4
Babou - 49.1
Total Group 731.2 877.1
Depreciation 36.2 49.7
% of Revenue
B&M 23.7% 23.6%
Heron 26.4% 25.9%
Jawoll 33.5% 37.2%
Babou - 38.0%
Total Group 24.6% 25.2%
Depreciation % 1.2% 1.4%
£ millions, KEY HIGHLIGHTS
• B&M fascia operating costs as a % of sales are 16bps lower
than last year
• impact of living wage mitigated through productivity
gains
• Some worsening in T&D performance
• Store cost operating leverage
• Heron, impact of full period of ownership, cost % 57bps
lower, benefitting from operating leverage
• Jawoll, operating costs increased to £79.4m, 368bps
adverse to last year
• Depreciation reflecting Babou and Heron acquisition.
Note: 1. FY18 relates to the 52 weeks ending 24 March 2018
Ref: 75049310
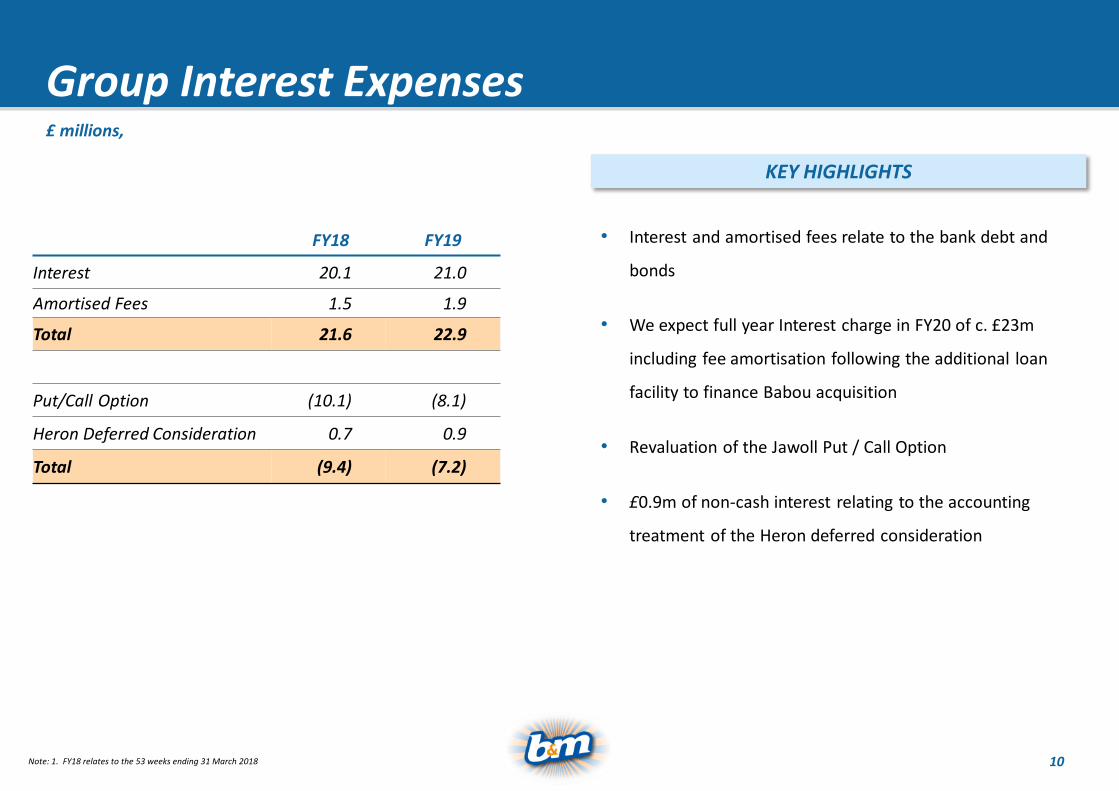
Group Interest Expenses
FY18 FY19
Interest 20.1 21.0
Amortised Fees 1.5 1.9
Total 21.6 22.9
Put/Call Option (10.1) (8.1)
Heron Deferred Consideration 0.7 0.9
Total (9.4) (7.2)
£ millions,
• Interest and amortised fees relate to the bank debt and
bonds
• We expect full year Interest charge in FY20 of c. £23m
including fee amortisation following the additional loan
facility to finance Babou acquisition
• Revaluation of the Jawoll Put / Call Option
• £0.9m of non-cash interest relating to the accounting
treatment of the Heron deferred consideration
KEY HIGHLIGHTS
Note: 1. FY18 relates to the 53 weeks ending 31 March 2018
Ref: 75049311
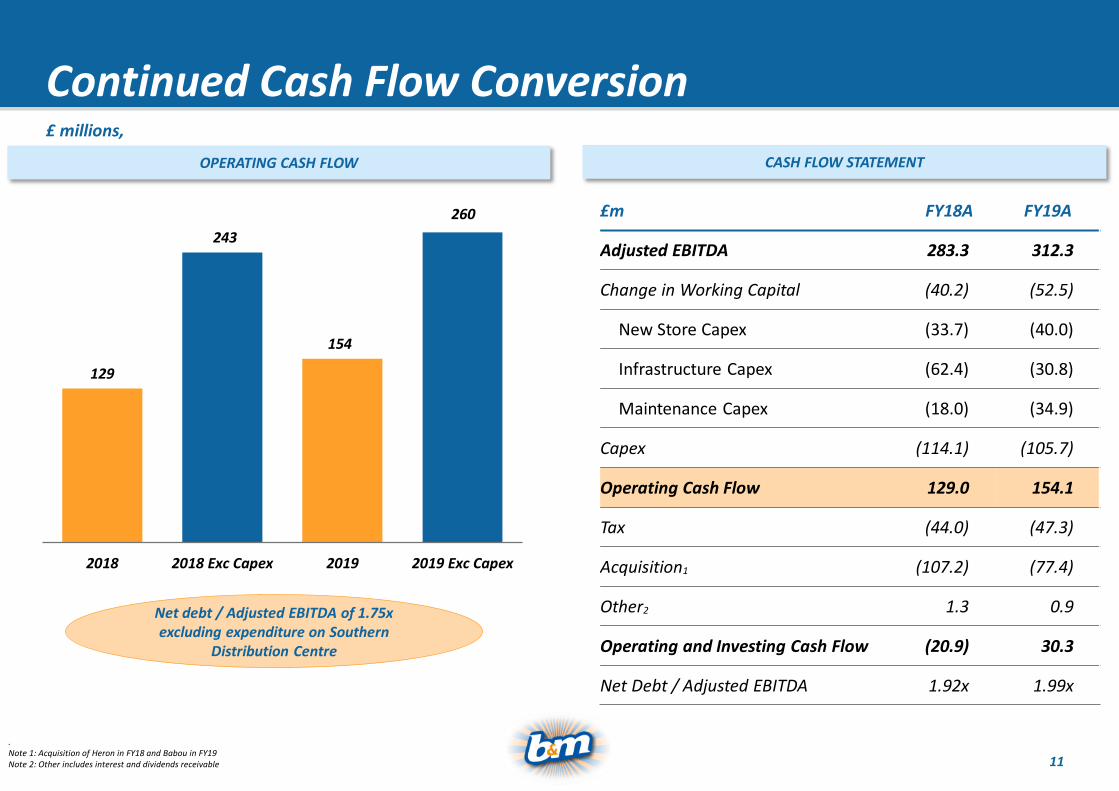
Continued Cash Flow Conversion
. Note 1: Acquisition of Heron in FY18 and Babou in FY19Note 2: Other includes interest and dividends receivable
£m FY18A FY19A
Adjusted EBITDA 283.3 312.3
Change in Working Capital (40.2) (52.5)
New Store Capex (33.7) (40.0)
Infrastructure Capex (62.4) (30.8)
Maintenance Capex (18.0) (34.9)
Capex (114.1) (105.7)
Operating Cash Flow 129.0 154.1
Tax (44.0) (47.3)
Acquisition1 (107.2) (77.4)
Other2 1.3 0.9
Operating and Investing Cash Flow (20.9) 30.3
Net Debt / Adjusted EBITDA 1.92x 1.99x
OPERATING CASH FLOW CASH FLOW STATEMENT
129
243
154
2018 2018 Exc Capex 2019 2019 Exc Capex
£ millions,
260
Net debt / Adjusted EBITDA of 1.75x excluding expenditure on Southern
Distribution Centre

Ref: 75049312
Simon Arora
Chief Executive Officer
Ref: 75049313
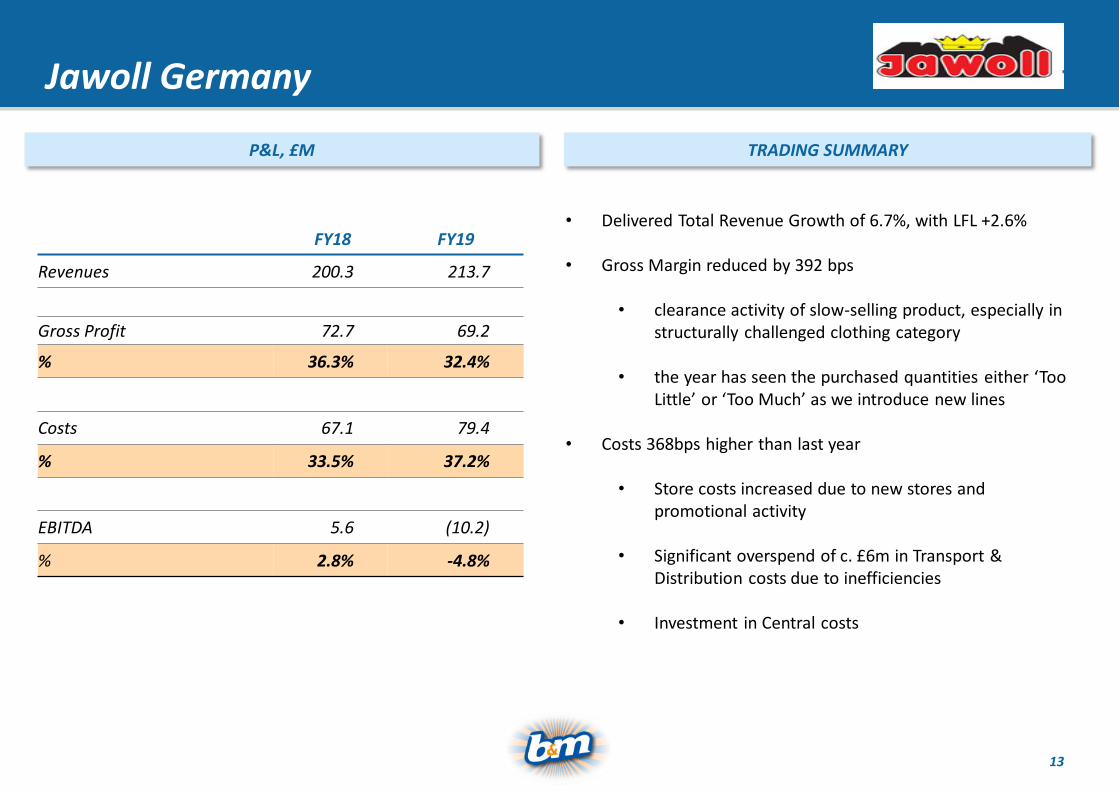
Jawoll Germany
P&L, £M TRADING SUMMARY
• Delivered Total Revenue Growth of 6.7%, with LFL +2.6%
• Gross Margin reduced by 392 bps
• clearance activity of slow-selling product, especially in structurally challenged clothing category
• the year has seen the purchased quantities either ‘Too Little’ or ‘Too Much’ as we introduce new lines
• Costs 368bps higher than last year
• Store costs increased due to new stores and promotional activity
• Significant overspend of c. £6m in Transport & Distribution costs due to inefficiencies
• Investment in Central costs
FY18 FY19
Revenues 200.3 213.7
Gross Profit 72.7 69.2
% 36.3% 32.4%
Costs 67.1 79.4
% 33.5% 37.2%
EBITDA 5.6 (10.2)
% 2.8% -4.8%

Ref: 75049314
Jawoll: Category performance highly mixed
-40.0% -20.0% 0.0% 20.0% 40.0% 60.0% 80.0%
L
K
J
I
H
G
F
E
D
C
B
A• Grocery & FMCG delivered -0.7% LFL
• Gardening delivered +6.1% LFL
• Toys delivered +57.6%
• Clothing experienced -21.3% LFL and at extremely low margin
• Christmas Decorations underperformed, due to understocks on good lines and overstocks on poor lines, at -18.4%, but we have learnt lessons for Christmas 2019
• Homewares was +2.4% LFL but at much reduced Gross Margin as we cleared out discontinued, slow-selling products
Departments which benefited from B&M Supply Chain traded well, but we
have lots more to learn and execute better
CATEGORY PERFORMANCE COMMENTARY

Ref: 75049315
Jawoll: Outlook for FY20
• Build on initial success of B&M sourced ranges but learn from customer reaction on a line-by-line basis
• Repeat order to known Rates of Sale and not “Too Little” or “Too Much” which characterised first seasons
• Clear out remaining stocks that are over 1 year old
• Existing Soltau company owned distribution centre has struggled to cope with volumes of direct sourced product, especially at peak and given overstocking of new items with no previous sales history
• Work with 3PL with infrastructure and capacity to process certain product categories. This will have cost implications but worthwhile over next 2-3 years as we develop the model
• We have invested in central overheads but have further recruitment to do
• More improvements operationally at store level to achieve better consistency of retail standards
• We will open 5 new stores
PRODUCT RANGE
TRANSPORT & DISTRIBUTION
CENTRAL FUNCTION

Ref: 75049316
BABOU: At a glance
• 100% of Babou was acquired October 2018 for €94m
• Babou trades from 96 out of town retail stores with average 2,700m² sales area
• Stores are generally well located and of consistent size
• In 2017, Babou delivered revenues €347m and underlying EBITDA of €17m
• Distribution Centre of 50,000m² and offices in Central France.
• For the year to March 2019, Babou contributed €6m of EBITDA
• On acquisition, General Merchandise was 51% of sales, Seasonal was 9% and Clothing was 41%. We expect clothing to reduce to 20% as we expand Seasonal, Toys, Home and introduce a limited FMCG offer
Store
Head-Office in Cournon & MM offices in Paris
DC in Cournon
HIGHLIGHTS

Ref: 75049317
Accelerated change in product ranges
CASE STUDY: B&M INDOOR FURNITURE LAUNCHED MARCH 2019 COMMENTARY
• In the weeks following launch of the B&M range, the department’s weekly sales tripled
• We have similar launches across Home, Toys, Pet, Stationery & Christmas over H1 of FY20
• FMCG and Ambient food ranges launched January 2019 and have sold well. Babou also implemented B&M’s successful ‘Managers Specials’ programme.
• Clothing department is being dramatically run down, this will create short-term margin headwind; alongside clearance of discontinued ranges.
• The transition period will result in negative LFL’s in the short term.
• We do not expect Babou to generate material EBITDA for FY20, but hope to see clear signs of improvement in Autumn/Winter 2019 and a strong recovery in FY21.

Ref: 75049318
Core UK Market: Spending is SubduedYOY PERCENTAGE CHANGE IN FOOTFALL INDICES
BRC LFL SALES TOTAL BY MONTH (12 MONTHS TO MAR-19)
Source: BRC and Springboard
-6.00
-4.00
-2.00
0.00
2.00
4.00
6.00
8.00
Apr May Jun Jul Aug Sep Oct Nov Dec Jan Feb Mar
FY17
FY18
FY19
-10.0
-8.0
-6.0
-4.0
-2.0
0.0
2.0
4.0
Mar-16 Sep-16 Mar-17 Sep-17 Mar-18 Sep-18 Mar-19High Street
Out of Town
Shopping Centre

Ref: 75049319
Shoppers want to save money
Source: PwC Consumer Sentiment Survey December 2018 (n = 2,053)
How do you think your grocery shopping habits will change over the next 12 months?

Ref: 75049320
-5%
5%
15%
25%
UK Revenue Growth
Last
Rep
ort
ed %
Rev
enu
e In
crea
se
Note: 1. Latest annual accounts or full year announcements, up to May 2019. Revenues exclude VATNote 2. B&M figures include Heron Foods and are stated on a 52 week basis.Note 3. Lidl do not separately disclose UK revenues

Ref: 75049321
(20.00%) (15.00%) (10.00%) (5.00%) 0.00% 5.00% 10.00% 15.00% 20.00%
I
N
O
L
K
M
C
D
B
A
J
G
F
H
E
B&M’s LFL Performance by categoryFULL YEAR CATEGORY LFL SALES % FULL YEAR CATEGORY LFL MARGIN %
FY 19 LFL Sales +0.7%
(15.00%) (10.00%) (5.00%) 0.00% 5.00% 10.00% 15.00% 20.00%
I
N
O
L
K
M
C
D
B
A
J
G
F
H
E
FY 19 LFL Cash Margin +2.0%

Ref: 75049322
Case Study: Toy Department
£175m£192m
£217m
FY17 FY18 FY19
• UK Toy market estimated to be £3.3bn in 2018, of which 34% is online(1),
meaning B&M now enjoys c. 7% total market share and c. 10% of bricksand mortar sales.
• Our increasing size and improved retail standards have encouragedleading brands to engage and supply us with their key products.
• We have become a destination for this category, especially at keyAutumn/Winter seasonal peak.
• This coming year’s performance should be helped by major film releases –Toy Story 4 and Frozen II
• However, we are now annualising one-off market share gain from Toys RUs closure
(1) – Source: British Toy & Hobby Association, 22 Jan 2019
COMMENTARYGROSS TOY SALES

Ref: 75049323
Case Study: Home Department
• Homeware categories underperformed in FY19
• We invested new buying and design resources into the category
• March 2019 saw launch of new ranges and implementation of newvisual merchandising principles
• Q3 YTD LFL Performance: -9.2%
• Q4 LFL Performance: -1.5%
• FY20 Q1 has swung firmly into positive territory across thisdepartment as we have made it more ‘on trend’
• We are focused on maintaining good sell-through at full price ratherthan Promotional Activity and chasing LFL sales
COMMENTARY

Ref: 75049324
New Store ProgrammeFY19 OPENINGS
• 54 gross openings (net 44
stores due to 5 relocations
and 5 store closures)
• Consistent high store returns
• Healthy pipeline for FY20 of
45 net new stores and
promising pipeline for FY21
620 STORES AS AT MARCH 2019
1.5 to 2.0 1.0 to 1.5 0.5 to 1.0 0 to 0.5
FY19 New Stores Relocations
Stores per 100,000 Population
Ref: 75049325
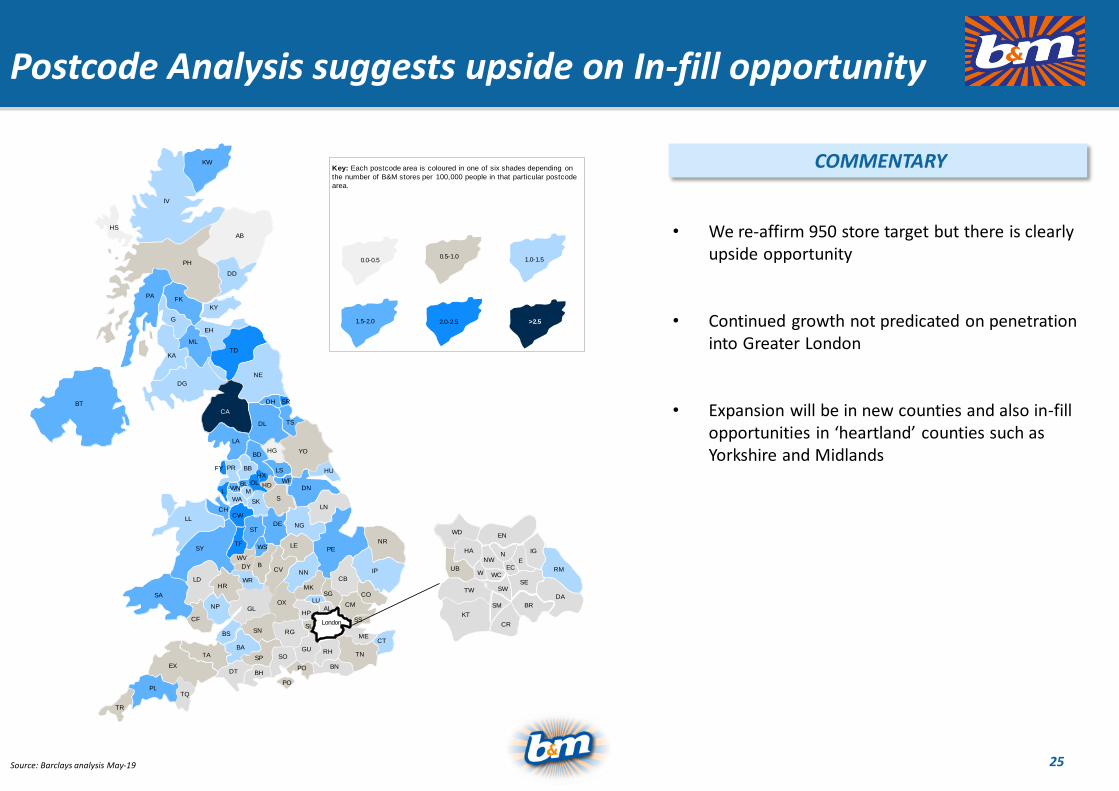
Postcode Analysis suggests upside on In-fill opportunity
• We re-affirm 950 store target but there is clearly upside opportunity
• Continued growth not predicated on penetration into Greater London
• Expansion will be in new counties and also in-fill opportunities in ‘heartland’ counties such as Yorkshire and Midlands
COMMENTARY
Source: Barclays analysis May-19
HS
KW
IV
AB
DD
PH
KY
FKPA
TR
PLTQ
EX
TA
DT
BA
BS
BH
PO
SP
G
EH
ML
KA
DG
TD
CA
BT
DL
LA
TS
DH
YO
HU
DN
LN
NG
S
NR
PE
IP
CB
CO
CM
CT
TN
BNPO
SOGU RH
ME
SS
NE
SR
BDHG
LSBBPRFY
LL
SY
LD
SA
CF
NP
SN RGSL
HP
SG
AL
LU
MK
NN
LE
DE
SK
M
OL HDWF
HX
BLL WN
WA
CWCH
TF
ST
WV
WS
BDY
WR
CV
OXGL
HR
BR
DA
RM
SE
CR
KT
TW
UB
HA
WDEN
IGN
NW
W WCEC
E
SW
SM
5th
0.5-1.01.0-1.5
1.5-2.0 2.0-2.5 >2.5
0.0-0.5
Key: Each postcode area is coloured in one of six shades depending on
the number of B&M stores per 100,000 people in that particular postcode
area.
London

Ref: 75049326
Case Study: Stoke-on-Trent, Staffordshire
COMMENTARY
• Our first Stoke store is over 15 years old.
• We have opened 4 further stores within a 3 mile radius of the first store, most recently Wolstanton, which is only 1 mile away, on 26/04/19.
• Our budget for these 5 stores in FY20:
• The map shows our 5 stores within 3 miles of Stoke town centre.
• These comprise 3 Bargain Stores and 2 Homestores with Garden Centres.
CASE STUDY: STOKE-ON-TRENT
Revenues: £32.0m
Store Contribution: £ 5.7m
Contribution %: 17%
• Our stores can generate high returns even when densely clustered

Ref: 75049327
Marketing Update
Followers May-19: 442k
Followers May-18: 185k
INSTAGRAM EXAMPLE CAMPAIGN B&M APP
T.V. Advertising Spend in FY19 was £NIL
• ‘Mission Christmas’ collects and distributes toys and gifts to underprivileged children across the UK. B&M is a key sponsor and our stores act as collection points
• Through our social media and radio support, B&M collection sites contributed £11m of donations.
• App launched Jan-18
• Actively used to browse products and scan barcodes
1.2m website visits per week

Ref: 75049328
Heron Foods Update
• The Heron acquisition continues to prove successful and integration has gone well
• Positive LFL performance in FY19 driven by B&M ambient food ranges
• Opened 20 gross (16 net) new stores in FY20 and plans to open 20 in FY20
• Further roll-out of Heron’s Frozen/Chilled proposition to B&M stores is paused until Bedford is operational, at which time we will evaluate the return on space of General Merchandise vs Chilled/Frozen
HIGHLIGHTS

Ref: 75049329
New Warehouse Investment in the UK
IMPRESSION OF PROPOSED NEW DC FOR THE SOUTH
• Acquired land in FY18 in Bedford at a cost of £44m, to develop a purpose built 1 million sq. ft. distribution centre for South of UK
• Build costs incurred over FY19 has been £21m
• We propose to ‘Sale and Leaseback’ the facility in H2 of FY20, recouping all the capex plus a modest development gain
• The facility will cost £6.5m p.a. in rent from Sept 2019
• Set-up occupation costs for commissioning, recruitment and training in FY20 expected to be c. £12m, inclusive of rent in FY20, prior to operational efficiencies in FY21
KEY HIGHLIGHTS

Ref: 75049330
Capital Structure
3.10
2.19
1.841.71
1.92 1.99
FY14A FY15A FY16A FY17A FY18A FY19A
DE-LEVERAGING PROFILE
We are not currently evaluating any further acquisition opportunities
CAPITAL ALLOCATION FRAMEWORK
STORE ROLLOUT
ORDINARY DIVIDEND
M&A OPPORTUNITY
RETURN SURPLUS CASH TO SHAREHOLDERS
Note 1: The 3.1x in 2014A is a pro-forma figure reflecting the post IPO capital structure. The actual at March-14 was 3.3x
1
1.75x exc. WarehouseInvestment

Ref: 75049331
Outlook for FY20• B&M model is highly relevant and continues to win market share in UK
• Our strong LFL’s of +5.8% in FY19 Q4 have continued into FY20, albeit only 6 weeks trade so far. We are delighted by our best ever Easter trading period, but prudent to expect more modest LFL growth in the full year as a whole.
• Healthy pipeline of net 45 new openings in FY20 for B&M and 15 openings at Heron. With 5 stores at Jawoll and 5 at Babou expected in FY20, as we prioritise the improvement of the product ranges
• Jawoll needs more time to improve its product range and the effectiveness of distribution.
• Babou is undergoing a year of decisive change to its product ranges as it repurposes closer to the B&M model
• We are not currently pursuing any M&A opportunities, and so we expect to generate additional surplus cash after the Bedford DC sale and leaseback
• The group is well placed for further profit growth and strong cash generation in FY20
Ref: 75049332
Appendix

Ref: 75049333
IFRS16 – Estimated Impact
• We are adopting IFRS16 for FY20
• Significant change on the financial statements, but no impact upon Group cash flows or how we manage our business
• Recognises the lease liability on the balance sheet and a right to use the asset
• The lease liability is the discounted value of future lease payments and at commencement the right to use the asset is equal to this. Average discount rate 5.2%
• Changes to the Statement of Comprehensive Income:
• The rental expense is replaced by an amortisation charge on the right to use asset, which is straight line
• Lease liability decreases by cash rental payments, net of interest charged
• The interest charge is ‘front-end’ loaded reflecting the ‘younger’ lease profile and is dilutive in the early years of a lease
KEY HIGHLIGHTS P&L ESTIMATED IMPACT £m
FY19 Reported
IFRS16 Adjustments
FY19 Pro-Forma
EBITDA 315 167 482
Depreciation (50) (126) (176)
Operating Profit 265 41 306
Interest (15) (55) (70)
Profit Before Tax 249 (14) 235
The overall PBT would have been impacted by c. 5% in FY19
• The indicative impact in FY19 would have been as follows:
• A c. £1.1bn lease liability would be recognised relating to the future contractual cash liabilities on leases
• A c. £1.0bn right to use asset would be recognised
• Lease adjusted leverage increases to c. 3.6x
BALANCE SHEET ESTIMATED IMPACT £bn