BALLONA CREEK, BALLONA ESTUARY, & SEPULVEDA CHANNEL BACTERIA TMDL
112
BALLONA CREEK, BALLONA ESTUARY, & SEPULVEDA CHANNEL BACTERIA TMDL COORDINATED MONITORING PLAN PREPARED BY THE MONITORING PLAN SUB-COMMITTEE CITY OF LOS ANGELES, CHAIR SUBMITTED April 23, 2008
Transcript of BALLONA CREEK, BALLONA ESTUARY, & SEPULVEDA CHANNEL BACTERIA TMDL

BALLONA CREEK, BALLONA ESTUARY, & SEPULVEDA CHANNEL BACTERIA TMDL
COORDINATED MONITORING PLAN
PREPARED BY THE MONITORING PLAN SUB-COMMITTEE
CITY OF LOS ANGELES, CHAIR
SUBMITTED April 23, 2008

ACKNOWLEDGEMENT The Coordinated Monitoring Plan (CMP) was developed by the City of Los Angeles (Primary Jurisdiction), County of Los Angeles (represented by Department of Public Works – Watershed Management Division), Cities of Culver City, Beverly Hills, West Hollywood, Inglewood, Santa Monica and California Department of Transportation (Caltrans).

TABLE OF CONTENTS
LIST OF ACRONYMS ........................................................................................................... 1 1.0 EXECUTIVE SUMMARY ............................................................................................. 2
Coordinated Monitoring Plan (CMP) Development ...................................................... 2 Requirements of the Bacteria TMDL Coordinated Monitoring Plan ............................. 2 Sampling Locations and Schedule .............................................................................. 3 Accelerated Sampling following Elevated Bacterial Levels (Exceedances) ................. 3 Analytical Methodology................................................................................................ 3 Data Management and Reporting................................................................................ 4
2.0 INTRODUCTION ....................................................................................................... 5 2.1 Background ........................................................................................................... 5 2.2 Ballona Creek Watershed Setting ......................................................................... 6 2.3 Waste Load Allocation Targets .............................................................................. 7
2.3.1 Single Sample Limits....................................................................................... 9 12.3.2 Rolling 30-day Geometric Mean Limits ....................................................... 11
2.4 Coordinated Monitoring Plan Development ......................................................... 12 2.5 Requirements of Coordinated Monitoring Plan .................................................... 12
3.0 MONITORING SITES ............................................................................................... 13 3.1 Site Selection Guidelines..................................................................................... 13 3.2 Monitoring Locations............................................................................................ 15
4.0 MATERIALS AND METHODS .................................................................................... 18 4.1 Sampling Schedule.............................................................................................. 18 4.2 Sampling Procedures .......................................................................................... 18
4.2.1 Procedures for missed samples .................................................................... 19 4.2.2 Procedures during Rainfall Events ................................................................ 19 4.2.3 Procedures following Elevated Bacterial Levels (Exceedances) ................... 19 4.2.4 Equipment ..................................................................................................... 19 4.2.5 Safety............................................................................................................ 19
4.3 Analytical Methodology........................................................................................ 20 4.3.1 Quality Assurance/Quality Control ................................................................ 21
4.4 Data Management and Reporting........................................................................ 21 4.4.1 Data Tabulation............................................................................................. 21 4.4.2 Data Format and Archive .............................................................................. 21 4.4.3 “Wet Weather” Determination........................................................................ 22 4.4.4 Exceedance Determination and Accelerated Sampling ................................ 22 4.4.5 Data Reporting .............................................................................................. 23
5.0 REFERENCES........................................................................................................ 24

APPENDICES APPENDIX A Development History of Ballona Creek Bacteria TMDL APPENDIX B Compliance Monitoring and Observation Sites APPENDIX C Field Sampling Equipment and Supply List APPENDIX D Field Sampling Standard Operating Procedures (SOP) APPENDIX E Field and Data Entry Worksheets APPENDIX F Laboratory Equipment and Supply List APPENDIX G Laboratory Standard Operating Procedures (City of Los Angeles) APPENDIX H Data Acquisition, Reduction, Validation, and Reporting SOPs APPENDIX I Quality Assurance/Quality Control APPENDIX J Data Format APPENDIX K Ballona Creek Bacteria TMDL APPENDIX L Laboratory Safety APPENDIX M Participating Organizations Contacts (Monitoring)

1
LIST OF ACRONYMS ALERT Automatic Local Evaluation in Real-Time APHA American Public Health Association AWWA American Water Works Association BCB Ballona Creek Bacteria CA DOHS California Department of Health Services Cal/OSHA California Office of Occupational Safety and Health Administration CalTrans California Department of Transportation CA DOHS California Department of Health Services CFU Colony Forming Unit CHP Chemical Hygiene Plan CMP Coordinated Monitoring Plan COC Chain of Custody CSV Comma Separated Value CWA Clean Water Act DMR Discharge Monitoring Report ELAP Environmental Laboratory Accreditation Program EMD Environmental Monitoring Division (LA City) EPA Environmental Protection Agency GIS Geographic Information System ICSD Information and Control System Division (LA City) LREC-1 Limited Water Contact Recreation LACDPW Los Angeles County Department of Public Works LACSD Los Angeles County Sanitation Districts LARWQCB Los Angeles Regional Water Quality Control Board LIMS Laboratory Information Management System MPN Most Probable Number NIST National Institute of Standards and Technology NPDES National Pollutant Discharge Elimination System PE Performance Evaluation QA/QC Quality Assurance/Quality Control REC-1 Water Contact Recreation REC-2 Non Contact Recreation RPD Relative Percentage Difference SOP Standard Operating Procedure S & T Status and Trends Monitoring Program (LA City) TMDL Total Maximum Daily Loads WLA Waste Load Allocations WP Water Pollution WPCF Water Pollution Control Federation WPD Watershed Protection Division (LA City)

2
1.0 EXECUTIVE SUMMARY The Ballona Creek, Sepulveda Channel, and Ballona Estuary were listed on the State’s 1998 303(d) list as impaired due to exceedance of total and/or fecal coliform water quality standards. To address the high bacteria concentrations in the Creek and its tributaries, the Los Angeles Regional Water Quality Control Board (Regional Board) on June 8, 2006, adopted the Total Maximum Daily Loads for Bacterial Indicator Densities in Ballona Creek, Ballona Estuary, and Sepulveda Channel (Bacteria TMDL). The Bacteria TMDL subsequently became effective on April 27, 2007 after approval by the U.S. Environmental Protection Agency (USEPA). This TMDL has multi-part numeric targets based on the updated bacteria objectives for marine and fresh waters designated for contact recreation (REC-1), and fresh waters with Limited REC-1 and non-contact water recreation (REC-2) beneficial use designations. The Bacteria TMDL identifies the Responsible Jurisdictions and Agencies as the Cities of Los Angeles, Culver City, Beverly Hills, Inglewood, West Hollywood, Santa Monica, County of Los Angeles, and California Department of Transportation (Caltrans). The City of Los Angeles is the Primary Jurisdiction as it controls the majority of the land area in the watershed. The Responsible Jurisdictions and Responsible Agencies are required to submit a comprehensive bacteria water quality monitoring plan for the Ballona Creek Watershed (Coordinated Monitoring Plan or CMP) to the Regional Board for approval by April 27, 2008, 12 months after the effective date of the Bacteria TMDL. Development and submittal of this document is to satisfy this requirement of the Bacteria TMDL.
Coordinated Monitoring Plan (CMP) Development The CMP was developed by the Bacteria TMDL Monitoring Plan Sub-Committee. The Sub-Committee is chaired by the City of Los Angeles, the Primary Jurisdiction. The other members are the Responsible Jurisdictions and Responsible Agencies as designated in the Bacteria TMDL. The CMP has three objectives: 1. To characterize existing water quality based on applicable bacteria water quality
objectives and; 2. To assess compliance with the waste load allocations in the Bacteria TMDL and; 3. To provide data to support re-evaluations that will be made when the Bacteria
TMDL is scheduled for reconsideration on April 27, 2011, four years after the effective date of the Bacteria TMDL.
Requirements of the Bacteria TMDL Coordinated Monitoring Plan a) Ambient Monitoring Ambient monitoring of water quality conditions will begin six months after the Regional Board’s formal approval of the CMP and conclude at the first compliance deadline in

3
each impaired reach and at the confluences of each tributary. As stated in the TMDL, on-going monitoring efforts by the City of Los Angeles and County of Los Angeles within the Ballona Creek watershed may fulfill this requirement; however, all responsible jurisdictions and responsible agencies are ultimately accountable for ensuring that these monitoring requirements are met. Prior to the first compliance deadline weekly ambient monitoring will be conducted at the CMP-specified effectiveness monitoring locations found in Table 3.1 and Section 3.2. b) TMDL Effectiveness Monitoring The TMDL effectiveness monitoring program shall be conducted to assess attainment of the allowable exceedances for Ballona Creek, Ballona Estuary, Sepulveda Channel, and the Waste Load Allocations (WLAs) for the tributaries. As stated in the TMDL: If the number of exceedance days is greater than the allowable number of exceedance days in the REC-1 and LREC-1 waters, and/or the frequency of exceedance is greater than 10% in the REC-2 waters, the responsible jurisdictions and/or responsible agencies shall be considered not attaining the TMDLs and/or assigned allocations (non-attaining). Responsible jurisdictions or agencies will be considered attaining TMDLs and/or assigned allocations based upon the results of an investigation that at minimum shows single sample events meet bacteria water quality objectives through daily sampling results at the existing monitoring location.
Sampling Locations and Schedule The implementation of the CMP will begin six months following its formal approval by the Regional Board with monitoring at eight (8) sites identified in the CMP. Detailed descriptions of each site can be found in Section 3.2.
Accelerated Sampling following Elevated Bacterial Levels (Exceedances) For the summer dry-weather period and the winter dry-weather periods during effectiveness monitoring, accelerated sampling will be conducted as a result of single-sample exceedances. Locations monitored weekly will be subject to accelerated monitoring, at 48 hours after the initial bacterial exceedance and, if the 48-hour sample exceeds, sampling also will occur at 96 hours following the initial bacterial exceedance. All location-required indicator bacteria, not just the exceeding indicator, will be analyzed during accelerated testing.
Analytical Methodology Samples will be tested for specific indicator bacteria (i.e., total coliforms, fecal coliforms and/or E. coli, and enterococcus) whose presence indicates that enteric pathogenic microorganisms also may also be present. Approved sampling and analytical procedures will be used as described in Appendices D and G. Sampling and analytical procedures are to be followed as specified in "Standard Methods for the Examination of Water and Wastewater", 18th – 20thedition, 1992, 1998 respectively, APHA, AWWA, WPCF, Washington, DC, and "Microbiological Methods for Monitoring the Environment, Water, and Wastes", EPA-600/8-78-017.

4
Data Management and Reporting Electronically-formatted data will be archived and submitted to the responsible agencies and the Regional Board promptly after the data become available, and electronic copies of the monthly reports will be distributed to the responsible agencies.

5
2.0 INTRODUCTION This monitoring proposal is submitted to fulfill the 12-month requirement for developing a Coordinated Monitoring Plan for the Ballona Creek, Ballona Estuary, and Sepulveda Channel Bacteria Total Maximum Daily Loads (BC Bacteria TMDL). For reference, the TMDL Regional Water Quality Control Plan (Basin Plan) amendments can be found in Appendix K of this document. All BC Bacteria TMDL documents, including the staff report, can be found on the Los Angeles Regional Water Quality Control Board’s (LARWQCB) website at http://www.waterboards.ca.gov/losangeles/.
2.1 Background Federal Regulations under the Clean Water Act (CWA) require states to develop a list of impaired waters and pollutants for which they are impaired, also known as the 303(d) List. The States must then establish the capacity of the water body to assimilate the impairing pollutants. These criteria are done in the form of the pollutant TMDL, which defines that the water body can still receive pollutant loads up to the water quality objectives necessary to protect beneficial uses (e.g., REC-1, REC-2, and LREC-1). Waste Load Allocations from point sources and load allocations from non-point sources must be reduced as needed according to the schedule set in the TMDL to meet TMDL compliance for the water body. The TMDL is incorporated as an amendment to the regional Basin Plan. Ballona Creek, Ballona Estuary, and Sepulveda Channel were designated as impaired by the State of California and included on California’s 2002 and 1998 CWA §303(d) List of Impaired Waters. Segments of the Ballona Creek, Ballona Estuary, and Sepulveda Channel are listed for high coliform counts. High bacterial loading of these water bodies may result in impairments of the water contact recreation (REC-1) beneficial use of Ballona Estuary1 and Sepulveda Channel, limited water contact recreation (LREC-1) beneficial use of Ballona Creek Reach 22, and non-contact recreation (REC-2) beneficial use of Ballona Creek Reach 13 (Table 2.1). Recreating in waters with elevated bacterial indicator densities has long been associated with adverse human health effects.
1 Ballona Estuary is from Centinela Avenue to the Pacific Ocean for 3.5 miles and its lower portion runs parallel to the main channel of Marina del Rey. 2 Ballona Creek Reach 2 (Ballona Creek to Estuary) is approximately 4 miles from National Boulevard to Centinela Avenue. 3 Ballona Creek Reach 1 is a 2-mile stretch from Cochran Avenue to National Boulevard.

6
Table 2.1 Ballona Creek Beneficial Uses
Water Body Beneficial Use Ballona Estuary REC-1 Marine Water Sepulveda Channel REC-1 Fresh Water Ballona Creek Reach 2 LREC-1 Fresh Water Ballona Creek Reach 1 REC-2 Fresh Water
There are several historical or existing sites monitored by the Los Angeles County Department of Public Works (LACDPW), City of Los Angeles Watershed Protection Division (WPD), and City of Los Angeles Environmental Monitoring Division (EMD) in Ballona Creek, Ballona Estuary, and its tributaries. Beginning in early 2001, the City of Los Angeles, Department of Public Works, Bureau of Sanitation, WPD, under its Status and Trends Monitoring Program (S&T), began monitoring at four (4) locations along the main channel of Ballona Creek for bacteria, metals, and other pollutants. In 2002 the Status and Trends Program was extended to include four (4) tributary monitoring locations. In addition, LACDPW, as part of the Los Angeles County Municipal Stormwater Permit, under its Core Monitoring Program, conducts sampling within the Ballona Creek watershed. The County’s Core Monitoring Program is comprised of one permanent mass emission station (S01) within the main channel, six tributary locations, five estuary locations, and one bioassessment location. During the period of 2005-2006, LACDPW ended the monitoring activities for the six mass emission sites located on tributaries to the main channel of Ballona Creek. Currently, only station S01 is monitored for three storm and two dry-weather events. 2.2 Ballona Creek Watershed Setting The Ballona Creek watershed is the largest sub-watershed within the Santa Monica Bay Watershed Management Area, and is comprised of West Los Angeles, Westwood Village, Culver City, Hollywood, Cienega, and Windsow Hills sub-watersheds as defined by the LARWQCB. The combined size of the six sub-watersheds is approximately 82,878 acres4; however, 13 acres of National Park Service land and 414 acres of miscellaneous State and Federal lands are currently excluded from the LARWQCB-defined jurisdictional group. The LARWQCB recommended that these areas be excluded at this time since they will be covered by separate NDPES permits issued by the LARWQCB. This leaves 82,451 acres as the effective watershed area5. The effective watershed area falls under the jurisdiction of eight agencies. (Table 2.2) 4 Area breakdown was generated with GIS using data from LARWQCB. 5 The overall effective watershed area may change depending on how the Regional Board decides to
enforce National Parks Service and miscellaneous State and Federal areas to comply with the TMDLs.

7
Table 2.2 Ballona Creek Jurisdictional Group
Responsible Agencies Land area City of Los Angeles (lead) 67,053 acres County of Los Angeles 3,928 acres City of Beverly Hills 3,630 acres City of Culver City 3,234 acres City of Inglewood 1,934 acres City of West Hollywood 1,201 acres City of Santa Monica 265 acres Caltrans 1,206 acres
Total 82,451 acres Ballona Creek flows as an open channel for approximately 10 miles from Los Angeles (South of Hancock Park) through Culver City, reaching the Santa Monica Bay just south of Marina del Rey. Tributaries of the Creek and Estuary include Centinela Creek, Sepulveda Channel, Benedict Canyon Channel, and numerous other storm drains. The transition between the Creek and Estuary is considered to occur at Centinela Boulevard; Ballona Creek above Centinela Boulevard is concrete-lined and Ballona Creek below Centinela Boulevard is soft bottom.
2.3 Waste Load Allocation Targets The TMDL has a multi-part numeric target based on four bacteriological parameters: total coliform density, enterococcus density, fecal coliform density, and Escherichia coli (E. coli) density. All bacteria densities shall be reported as the number of bacteria counted in 100 milliliters of water sampled. These numerical targets and the corresponding waste load allocations have been set based on the Los Angeles Basin Plan objectives for water contact recreation (REC-1), limited water contact recreation (LREC-1), and water non-contact recreation (REC-2) uses. The BC Bacteria TMDL specifies three separate periods for compliance purposes, each with specific requirements. The periods are summer dry-weather (April 1 to October 31), winter dry-weather (November 1 to March 31), and wet-weather days (defined as days of > 0.1 inches of precipitation and the three days following the end of the rain event). Waste load allocations in the Ballona Creek TMDLs are expressed as an allowed number of exceedance days. The number of allowable exceedance days at a given location is determined by the number of projected exceedance days during the 90th percentile year at either the designated reference site or historically at the location in question, whichever is lower. Allowable exceedance days, as determined by the reference site method, relative to a weekly monitoring schedule are shown in Table 2.3 and Table 2.4.

8
Table 2.3 Summary of waste load allocations in Ballona Creek, Ballona Estuary, and Sepulveda Channel by Reach.
Time Period Ballona Estuary, Ballona Creek Reach 2, and Sepulveda Channel 1 Ballona Creek Reach 1 2
Summer Dry-Weather (April 1 to October 31)
Zero (0) exceedance days based on the applicable Single Sample Bacteria Water Quality Objectives Zero (0) exceedance days based on the Rolling 30-Day Geometric Mean Bacteria Water Quality Objectives
No more than 10% of the Single Sample Bacteria Water Quality Objectives Zero (0) exceedance days based on the Rolling 30-Day Geometric Mean Bacteria Water Quality Objectives
Winter Dry-Weather (November 1-March 31)
Three (3) exceedance days based on the applicable Single Sample Bacteria Water Quality Objective4 Zero (0) exceedance days based on the Rolling 30-Day Geometric Mean Bacteria Water Quality Objectives
No more than 10% of the Single Sample Bacteria Water Quality Objectives Zero (0) exceedance days based on the Rolling 30-Day Geometric Mean Bacteria Water Quality Objectives
Wet-Weather (days with ≥0.1 inch of rain + 3 days following the rain event)
Seventeen (17)3 exceedance days based on the applicable Single Sample Bacteria Water Quality Objectives4 Zero (0) exceedance days based on the Rolling 30-Day Geometric Mean Bacteria Water Quality Objectives.
No more than 10% of the Single Sample Bacteria Water Quality Objectives Zero (0) exceedance days based on the Rolling 30-Days Geometric Mean Bacteria Water Quality Objectives
1 Exceedance days for Ballona Estuary based on REC-1 marine water numeric targets; for Ballona Creek Reach 2 based on LREC-1 freshwater numeric targets; and for Sepulveda Channel, based on fresh water REC-1 numeric targets 2 Exceedance frequency for Ballona Creek Reach 1 based on freshwater REC-2 numeric targets 3 In Reach 2, the greater of the allowable exceedance days under the reference system approach or high flow suspension shall apply 4 As set forth by the SMBB CMP the maximum allowable number of exceedance days per year based on the reference system during dry weather is scaled back to one (1) day per year based on weekly sampling and the maximum allowable number of exceedance days based on the reference system during year-round wet weather is scaled back accordingly to three (3) exceedance days per year based on weekly sampling.

9
Table 2.4 Summary of waste load allocations and load allocations for Ballona Creek Tributaries
*At the confluence with Reach 2, the greater of the allowable exceedance days under the reference system approach or high flow suspension shall apply. Sepulveda Channel was not assigned a waste load allocation at its confluence with Reach 2 since the TMDL requires the more stringent REC-1 objectives to be met in this water body, which should lead to the attainment of the less stringent LREC-1 objectives of the downstream reach.
Tributary Point of Application Water Quality Objectives
Waste Load Allocation (No. exceedance days)
Ballona Creek Reach 1 At confluence with Reach 2 LREC-1 Freshwater
For single sample objectives: (0) summer dry-weather, (3) winter dry-weather, (17*) wet-weather
For geometric mean objectives: (0) for all periods
Benedict Canyon Channel
At confluence with Reach 2 LREC-1 Freshwater
For single sample objectives: (0) summer dry-weather, (3) winter dry-weather, (17*) wet-weather
For geometric mean objectives: (0) for all periods
Ballona Creek Reach 2 At confluence with Ballona Estuary
REC-1 Marine water
For single sample objectives: (0) summer dry-weather, (3) winter dry-weather, (17) wet-weather
For geometric mean objectives: (0) for all periods
Centinela Creek At confluence with Ballona Estuary
REC-1 Marine water
For single sample objectives: (0) summer dry-weather, (3) winter dry-weather, (17) wet-weather
For geometric mean objectives: (0) for all periods
Del Rey Lagoon At confluence with Ballona Estuary
REC-1 Marine water
For single sample objectives: (0) summer dry-weather, (3)winter dry-weather, (17) wet-weather
For geometric mean objectives: (0) for all periods
2.3.1 Single Sample Limits

10
The Single Sample Limits apply throughout the year, and are shown in Table 2.5 Table 2.5 Single Sample Limits
Marine Waters Designated for Water Contact Recreation (REC-1) Indicator Number of bacteria/100mL
Total Coliform 10,000 Fecal Coliform 400 Enterococcus 104 Total Coliform density* Fecal-to-Total Coliform ratio*
Fresh Waters Designated for Water Contact Recreation (REC-1) Indicator Number of bacteria/100mL
E. coli 235 Fecal Coliform 400
Fresh Waters Designated for Limited Water Contact Recreation (LREC-1)
Indicator Number of bacteria/100mL E. coli 576 Fecal Coliform not assigned Fresh Waters Designated for Water Non-Contact Recreation (REC-2)
Indicator Number of bacteria/100mL E. coli - Fecal Coliform 4000 * Total coliform density shall not exceed 1,000/100mL, if the ratio of fecal-to-total coliform exceeds 0.1
There are a certain number of exceedance days allowed for single sample targets for summer dry-weather, winter dry-weather, and wet-weather days. The number of allowable exceedance days is established using a “reference system/anti-degradation approach,” which is based on historical exceedance levels at existing monitoring locations, including a local reference beach within the Santa Monica Bay coastal watershed (Leo Carrillo State Beach). The maximum number of allowable exceedance days for REC-1, LREC-1 and REC-2 waters are shown in Table 2.3 and Table 2.4 (pages 8-9).
2.3.2 Rolling 30-day Geometric Mean Limits

11
The Rolling 30-day Geometric Mean Limits apply through the year, and are shown in Table 2.6 Table 2.6 Geometric Mean Limits
Marine Waters Designated for Water Contact Recreation (REC-1) Indicator Number of bacteria/100mL
Total Coliform 1,000 Fecal Coliform 200 Enterococcus 35
Fresh Waters Designated for Water Contact Recreation (REC-1) Indicator Number of bacteria/100mL
E. coli 126 Fecal Coliform 200
Fresh Waters Designated for Limited Water Contact Recreation (LREC-1)
Indicator Number of bacteria/100mL E. coli 126 Fecal Coliform 200 Fresh Waters Designated for Water Non-Contact Recreation(REC-2)
Indicator Number of bacteria/100mL E. coli - Fecal Coliform 2000
The Rolling 30-Day Geometric Mean is calculated as the 30th root of the product of 30 numbers using the bacterial densities over the most recent 30 days. The Geometric Mean Limits may not be exceeded at any time. The rolling 30-day geometric means will be calculated on each day, regardless of whether a weekly or daily schedule is selected. If weekly sampling is conducted each test result will supersede the previous result and be assigned to the remaining days of the week until the next sample is collected. Only dry-weather data are to be used to calculate geometric means; wet-weather data will be excluded from this calculation until single sample limits for wet-weather become effective. The Rolling 30-Day Geometric Mean calculation may change. Based on recent communication with the Regional Board, we understand the method of calculating the daily Rolling 30-Day Geometric Mean proposed above has been deemed inappropriate and may be revised. The TMDL will be implemented in two phases over a ten-year period. For the first phase, within six years of the effective date of the TMDL, the allowable number of summer dry-weather, winter dry-weather exceedance days, and the rolling 30-day

12
geometric mean targets must be achieved. For the second phase, within 10 years of the effective date of the TMDL (or by July 15, 2021 if the Integrated Water Resource Approach is implemented), the allowable number of wet-weather exceedance days and rolling 30-day geometric mean targets must be achieved.
2.4 Coordinated Monitoring Plan Development This monitoring plan was developed by the Ballona Creek Monitoring Plan Sub-Committee, which was chaired by the City of Los Angeles (Appendix M). In early 2007 the Ballona Jurisdictional Group began gathering information and meeting with representatives of the various agencies that had historically conducted monitoring within Ballona Creek watershed; namely the City of Los Angeles Bureau of Sanitation and the Los Angeles County Department of Public Works. During development of the CMP, input from the Regional Board, Santa Monica Bay Keeper, and Heal the Bay was sought and incorporated in this document. The first draft of the CMP was completed in January 2008 and presented to the Regional Board and non-governmental organizations. The final draft was submitted to the Regional Board in April 2008.
2.5 Requirements of Coordinated Monitoring Plan As stated in the Ballona Creek, Ballona Estuary, and Sepulveda Channel Bacteria TMDL: “Responsible jurisdictions and responsible agencies must submit, for Regional Board approval, a comprehensive bacteria water quality monitoring plan for the Ballona Creek Watershed [within twelve months of the effective date]. The plan must be approved by the Executive Officer before the monitoring data can be considered during the implementation of the TMDL. The plan must provide for analyses of all applicable bacteria indicators for which the Basin Plan and subsequent amendments have established objectives. The plan must also include a minimum of two sampling locations in Ballona Estuary and Ballona Creek (Reach 2), at least one location in Ballona Creek (Reach 1) and Sepulveda Channel, at the confluence with Centinela Creek and Benedict Canyon Channel, and similar monitoring at the connecting tide gates of Del Rey Lagoon.” The City of Los Angeles is the Responsible Agency for Del Rey Lagoon; therefore the Del Rey Lagoon requirement is not included in this CMP.

13
3.0 MONITORING SITES For the purpose of this TMDL, eight (8) monitoring locations (Table 3.1 and Figure 1) are being proposed. Four of these locations are currently being monitored by Los Angeles County Department of Public Works and/or by City of Los Angeles WPD and EMD as a part of its Status & Trends Program. The other four sites are new, or in close proximity to a historical site. Appendix B provides a summary of geographic data.
3.1 Site Selection Guidelines The eight (8) sampling sites (Table 3.1) have been selected by all responsible agencies in the Jurisdictional Group using the following set of guidelines:
1. Sampling shall be conducted weekly at locations specified in Attachment A to Resolution No. 2006-011, page 8. 2. Monitoring locations shall be located at or close to the boundary of two reaches. 3. Monitoring locations shall have safe access for sampling.
Table 3.1 Summary of effectiveness monitoring sites
Station ID BCB-1 BCB-2 BCB-3 BCB-4 BCB-5 BCB-6 BCB-7 BCB-8 Station Name WASHINGTON DUQUESNE BENEDICT
CANYON CULVER INGLEWOOD CENTINELA LINCOLN PACIFIC
Location Washington Blvd. (at creek)
Duquesne Ave.
(at creek)
Duquesne Ave (at confluence)
Culver Blvd. (at
Sepulveda Channel)
Inglewood Blvd.
(at creek)
South of Centinela Ave.
(McConnell Ave. at creek)
South of Centinela Ave. (at confluence)
Pacific Ave (at creek)
Historical ID & Agency
N/A N/A
TS09 (LACDPW) Duquesne
(S&T)
TS08 (LACDPW)
Culver (S&T)
Inglewood (S&T) N/A N/A Pacific (S&T)
Creek Section Reach 1
Reach 2 (upper; at
creek)
Reach 2 (confluence)
Sepulveda Channel
Reach 2 (lower; at
creek)
Estuary (upper; at
creek)
Estuary (confluence)
Estuary (lower; at
creek) Sampling Frequency Weekly Weekly Weekly Weekly Weekly Weekly Weekly Weekly

Figure 3.1 BC Bacteria TMDL Monitoring Locations
14

15
3.2 Monitoring Locations In accordance with the TMDL requirements, the responsible agencies propose to conduct weekly monitoring at eight (8) locations identified in Table 3.1. More details, including drainage maps, locations, and latitude and longitude coordinates of each site are available in Appendix B. A brief description of each monitoring location is as follows. Site Id: BCB – 1 Status: New Location:
Ballona Creek Reach 1 Historical Site Id: N/A Comments: This is a new sample site located at Washington Blvd. The location is slightly downstream of the historical site TS10 (LACDPW) at La Cienega Blvd. Refer to Thomas Guide coordinates 633:A7
Site Id: BCB – 2 Status: New Location:
Ballona Creek Reach 2 Historical Site Id: N/A Comments: This is a new sample site located at Duquesne Avenue, along the main channel of Ballona Creek and slightly upstream of the Benedict Canyon Channel confluence. Refer to Thomas Guide coordinates 672:H1
Site Id: BCB – 3 Status: Existing Location:
Benedict Canyon Confluence Historical Site Id: TS09 (LACDPW); Duquesne (S&T)
Comments: This is an existing sampling site, located at the confluence of Ballona Creek and Benedict Canyon. The location is currently monitored by the City of Los Angeles as part of its S&T Program and was part of Los Angeles County’s Core Monitoring Program under LA County Municipal Stormwater Permit. This site is the same as site BC-5 in Ballona Creek Metals and Estuary Toxics TMDL CMP. Refer to Thomas Guide coordinates 672:H2

16
Site Id: BCB – 4 Status: Existing Location: Sepulveda Channel
Historical Site Id: TS08 (LACDPW); Culver (S&T)
Comments: This is an existing sampling site, located near Culver Blvd. The location is currently monitored by the City of Los Angeles as part of its Status and Trends Monitoring Program (Culver). This site is the same as site BC-4 in Ballona Creek Metals and Estuary Toxics TMDL CMP. Refer to Thomas Guide coordinates 672:E4
Site Id: BCB – 5 Status: Existing Location:
Ballona Creek Reach 2 Historical Site Id: Inglewood (S&T)
Comments: This is an existing sampling site currently monitored by the City of Los Angeles as part of its Status and Trends Monitoring Program. The site is located at Inglewood Blvd. on the main channel of Ballona Creek. Refer to Thomas Guide coordinates 672:E6
Site Id: BCB – 6 Status: New Location:
Ballona Creek Estuary Historical Site Id: N/A Comments: This is a new sample site located upstream of the Centinela Creek confluence at McConnell Ave. with the closest major street being South Centinela Avenue. Refer to Thomas Guide coordinates 672:D7

17
Site Id: BCB – 7 Status: New Location:
Centinela Creek Confluence Historical Site Id: N/A Comments: This is a new sampling site located at the confluence of Centinela Creek and Ballona Creek. The nearest major cross street is Lincoln Avenue. Refer to Thomas Guide coordinates 672:D7
Site Id: BCB – 8 Status: Existing Location:
Ballona Creek Estuary Historical Site Id: Pacific (S&T) Comments: This is an existing sampling site currently monitored by the City of Los Angeles as part of its Status & Trends Monitoring Program. The site is located at Pacific Ave. in the lower estuary. This is also an observation station for the Santa Monica Bay Beaches Bacteria TMDL. Refer to Thomas Guide coordinates 702:A2

18
4.0 MATERIALS AND METHODS
This section provides a methodology for conducting field sampling at monitoring locations. Also discussed are procedures for bacterial analyses of the samples and data reporting procedures.
4.1 Sampling Schedule During the ambient monitoring period the eight (8) proposed monitoring locations will be monitored weekly with samples to be collected on Mondays. When effectiveness monitoring begins, if there are exceedances in the weekly sampling during summer and winter dry weather, accelerated monitoring will be conducted. Accelerated samples will be collected 48 hours after the original bacterial exceedance and, if the 48-hour sample also exceeds, 96 hours after the initial bacterial exceedances. Sample collection and analysis for the proposed monitoring program will be done by the City of Los Angeles Watershed Protection Division (WPD) and Environmental Monitoring Division (EMD) respectively.
4.2 Sampling Procedures The objective of the sampling program is to provide representative water samples for bacterial analyses, while following defined safety and quality assurance guidelines. The quality assurance guidelines shall include sampling protocol as well as sample documentation, preservation, and holding time requirements. All contracted samplers or agencies (City of Los Angeles) shall submit a Sample Collection Standard Operating Procedure (SOP) which should include sampling protocol and quality assurance guidelines. Appendices C, D, and L provide SOPs for review by the Regional Board Each sampling event shall be associated with recorded observations of site conditions, which should minimally include sample ID, collection date and time, rain measurement (USC rain gauge), weather conditions, sample characteristics (water color and turbidity), and sampler's name (refer to Appendix E). Sampling should only occur when conditions can be assessed as SAFE. The safety of the sample collector is the top priority and should supersede scheduled sampling.

19
For missed samples due to inaccessibility, when sample integrity is compromised, or the scheduled sampling day falls on a holiday, the site should be revisited and sampled on the earliest convenient day, except Sunday, within the week of the originally scheduled sampling date.
During any rain event, field staff must use his/her best judgment to determine if sampling can be performed safely. If a sampling day happens to fall within the 24 hours following a rain event resulting in greater than 0.5” of precipitation, the safety of the sample collector is paramount and sampling may need to be rescheduled to a different time and/or day.
During effectiveness monitoring, the City of Los Angeles (WPD and EMD) will conduct accelerated sampling and testing 48 hours after the initial bacterial exceedances and, if necessary, additional accelerated testing at 96 hours for those sites that still exceed the single sample limits after 48 hours. The purpose of the accelerated monitoring is to identify the persistence of an exceedance, especially during dry weather when source identification is a priority. Accelerated monitoring may not be as critical during wet weather at every location when the source of the exceedance is known to be stormwater runoff, therefore, accelerated testing during wet weather will be considered after the 4 year the re-opener.
Equipment and supplies needed for sample collection are listed in Appendix C.
In an effort to improve employee safety and health awareness, and to prevent occupational related injury and illness, EMD and other participating laboratories have developed a safety program with the intention of satisfying the applicable federal, state, and local regulations. For example, EMD’s Safety and Health Program is composed of specific elements required by Cal/OSHA General Industry Safety Order Section 5191:
4.2.1 Procedures for missed samples
4.2.2 Procedures during Rainfall Events
4.2.3 Procedures following Elevated Bacterial Levels (Exceedances)
4.2.4 Equipment
4.2.5 Safety

20
Occupational Exposure to Hazardous Chemicals in Laboratories, and section 3203: The Injury and Illness Prevention Program, and any other applicable regulations. The written safety plan, titled The Chemical Hygiene Plan, is available to all employees for review, and should be recognized as management's commitment to ensure that all employees carry out their work in the safest and most efficient manner possible. EMD employees will be kept familiar with the Division's written Chemical Hygiene Plan (CHP) through training, annual review and monthly staff safety meetings. It is the City of Los Angeles’ policy and the policy of other participating agencies to provide a safe working environment for all of their employees. In addition, all field and laboratory work is to be performed in a manner that provides the highest level of safety for the protection of every employee. See Appendix L for detailed safety protocols.
4.3 Analytical Methodology Marine/brackish samples collected from the Estuary will be tested for the presence of total coliform, E. coli, and enterococcus bacteria. Freshwater samples will be tested for the presence of E. coli and fecal coliform in REC-1 and LREC-1 designated areas and for fecal coliform in REC-2 designated areas. All indicator groups will be quantified from a single sample collected at the designated monitoring site. Necessary dilutions or aliquot volumes shall be processed to ensure that compliance with water quality objectives can be determined. Bacterial results will be reported as the number of organisms per 100 mL of sample for each bacterial indicator. When selecting analytical bacterial methods for TMDL monitoring, the importance of fast recovery times (24 hours or less) should be emphasized. The presence of total coliform, E. coli, and enterococcus bacteria shall be detected and quantified using the defined chromogenic substrate (CS) method (SM 9223B, APHA 1992-98). Fecal coliforms shall be detected and quantified using the membrane filtration (MF) method (SM9221C APHA 1992-98). For the marine/brackish samples (Ballona Estuary), the CS method will be used to convert the E. coli results to fecal coliform using a 1:1 translator. The application of a 1:1 translator was approved by the Regional Board in October 2002 after review of the Chromogenic Substrate and Membrane Filtration Comparison Study conducted by the City of Los Angeles (approval letter dated October 16, 2002, from Dennis Dickerson, Executive Officer). The Responsible Agencies may consider conducting a fresh water study to draw conclusions about the relationship between E. coli and fecal coliforms similar to the above mentioned study conducted in Santa Monica Bay which led to the development of the 1:1 translator for E. coli to fecal coliforms in marine waters. Based on the execution and results of this future study, reporting of fecal coliform densities obtained and quantified by the MF method may be re-evaluated. All laboratories performing analyses for TMDL bacterial monitoring shall maintain Environmental Laboratory Accreditation Program certification (ELAP administered by

21
California Department of Health Services) for specified methods from ELAP's "Field of Testing 126: Microbiology of Recreational Water". Additionally, all laboratories shall submit detailed SOPs for review by Regional Board staff. Appendix G provides an example of an SOP developed by the City of Los Angeles-EMD. Each analytical method used for the TMDL monitoring program shall be an approved EPA or Standard Methods for the Examination of Water and Wastewater, 18th-20th edition (APHA 1992-98) method. Laboratories receiving Regional Board approval may use other analytical bacterial methods for marine recreational and TMDL monitoring.
All laboratories must employ a program that associates quality assurance with the laboratory facility, staff, instrumentation and equipment, materials and methods, media and reagents, and data validation. These QA/QC measures may be included in the submitted SOPs or defined in a separate QA/QC document such as Appendix I. The quality assurance procedures shall be in accordance with Standard Methods for the Examination of Water and Wastewater, 18-20th Editions (APHA 1992-98). All participating laboratories must maintain ELAP certification, provide QA/QC documentation as required by the Regional Board, and participate in periodic inter-calibration exercises. Data from the EMD Microbiology Laboratory will be utilized to comply with the monitoring requirements of the Ballona Creek Bacterial TMDL. The EMD and WPD divisions of the City of Los Angeles Departments will participate in this monitoring program as processing and sampling agencies respectively.
4.4 Data Management and Reporting
Results will be entered into Excel spreadsheets that automatically compute results (MPN/100 mL for CS analysis and CFU/100 mL for MF analysis). All entered data will be given secondary review, corrected as needed, to ensure error-free data entry. Examples of EMD’s Microbiology Laboratory data worksheets can be found in Appendix E. Data acquisition, validation, reduction, and reporting procedures can be found in Appendix H.
All data collected will be archived within the City of Los Angeles’ Environmental Monitoring Division (EMD) Laboratory Information Management System (LIMS) database or comparable database. For any non-City of Los Angeles monitoring agency performing bacteriological analyses, data will need to be submitted daily to EMD
4.3.1 Quality Assurance/Quality Control
4.4.1 Data Tabulation
4.4.2 Data Format and Archive

22
electronically in a comma-separated value (CSV) format that contains the table structure and syntax provided in Appendix J. The City of Los Angeles’ Information & Control System Division (ICSD) staff will ensure electronic submissions of data are parsed and stored correctly into the LIMS database.
The BC Bacteria TMDL defines “wet weather” as “days with 0.1 inch of rain or greater and the three days following the rain event” (Attachment A to Resolution No. 2006-011, Page 4); however, the TMDL does not specify where the 0.1-inch of rain is to be measured. For clarification, the Ballona Creek Monitoring Sub-committee proposes in Table 4.1 the rainfall gage to be used for this monitoring program to determine wet weather days. Table 4.1 Rainfall gage to be used for the proposed monitoring program.
Jurisdictional Group Rainfall Gage Comment Ballona Creek Watershed University of Southern
California (USC) (375) LACDPW “Manually Observed Non-Mechanical Rain Gauge” Station
The proposed gage is a Manually Observed Non-Mechanical Rain Gauge station owned and operated by the County of Los Angeles. Data can be obtained at http://www.ladpw.org/wrd/precip/ under “Station Information.” The web page displays 148 Manually Observed Non-Mechanical Rain Gages; these gages are measured once daily by volunteers and reported monthly.
Bacteriological data will be summarized in tabular form on a daily basis by EMD’s Microbiology Unit. Exceedances will be clearly notated and triggers indicating “accelerated monitoring needed” will be programmed into the report. Summer dry-weather, winter dry and wet weather spreadsheets with triggers will be created, but as mentioned in section 4.2.3 wet weather accelerated sampling will not be considered until the 4th year reopener. When bacterial levels no longer exceed listed standards, a trigger to return to weekly sampling will be programmed, except for wet weather exceedances which will continue regular sampling regardless of exceedances until the 4th year reopener. The monitoring agency, the City of Los Angeles, will be responsible for performing accelerated monitoring as required. For the purpose of compliance, this CMP proposes that for single-sample limits, accelerated sampling results should not be counted towards compliance
4.4.3 “Wet Weather” Determination
4.4.4 Exceedance Determination and Accelerated Sampling

23
Electronically-formatted data will be archived and submitted to the responsible agencies and the Regional Board promptly after the data becomes available, and electronic copies of the monthly reports will be distributed to the responsible agencies. Monthly data summary reports will be submitted to the LARWQCB by the last day of each month for data collected during the previous month. For EMD, laboratory results will be entered into Microsoft Excel spreadsheets that automatically compute results (MPN/100 mL or CFU/100 mL). All monitoring agencies will archive their own data within LIMS or a comparable database. See Appendix H, Data Acquisition, Reduction, Validation, and Reporting Procedures.
4.4.5 Data Reporting

24
5.0 REFERENCES American Public Health Association. 1992. Standard methods for the Examination of
Water and Wastewater, 18th ed. American Public Health Association, Washington, DC, pp. 9-1 to 9-115.
Noble, R. T., J. H. Dorsey, M. K. Leecaster, M. Mazur, C. D. McGee, D. Moore, V.
Orozco-Borbón, D. Reid, K. Schiff, P. M. Vainik, and S. B. Weisberg. 1999. Southern California Bight 1998 Regional Monitoring Program. I. Summer Shoreline Microbiology. Appendix C, Comparison of Bacterial Indicator Measurements among Southern California Marine Monitoring Laboratories. Southern California Coastal Water Research Project. Westminster, CA, 54-67.
TMDL Draft. The following TMDL drafts are cited in this report: Total Maximum Daily Load to Reduce Bacterial Indicator Densities during Dry Weather at
Santa Monica Bay Beaches—January 14, 2002
Santa Monica Bay Beaches Wet-weather Bacteria TMDL Draft—Version 4. 11/07/02.

25
THIS PAGE INTENTIONALLY LEFT BLANK

26
APPENDIX

27
THIS PAGE INTENTIONALLY LEFT BLANK
28
APPENDIX A
Development History of the Ballona Creek Bacteria TMDL
The Ballona Creek Bacteria TMDL was developed by the Los Angeles Regional Water Quality Control Board (RWQCB) to protect beneficial uses associated with water quality in Ballona Creek. Elevated concentrations of bacteria at Ballona Creek have prompted the development of a TMDL. The effective date of the TMDL is April 27, 2007. Ballona Creek is a ten-mile long channel that begins in Hancock Park and drains into the Pacific Ocean just south of Marina del Rey. The Ballona Creek Watershed totals about 130 square miles. Ballona Creek has 3 segments (or reaches) divided based on the physical characteristics and beneficial use designations: Reach 1 is REC-2, Reach 2 is Limited REC-1, and the Estuary is REC-1. These three segments and Sepulveda Channel are listed as impaired and require a TMDL. This bacteria TMDL addresses the impaired bacterial water quality of the creek and sets waste load allocations (WLAs) or enforceable bacteria concentration limits in the creek. Affected agencies will be required to reduce the amount of bacteria flowing in Ballona Creek, the Estuary, and Sepulveda Channel. The watershed is highly developed, consisting of residential, recreational/open space, commercial and industrial land uses. The watershed also includes all or parts of the Cities of Beverly Hills, Culver City, Inglewood, Santa Monica, West Hollywood, and unincorporated Los Angeles County. The TMDL contains a 14-year compliance schedule to correspond with the Santa Monica Bay Beaches Bacteria TMDL schedule for meeting 100% compliance of waste load allocations (WLAs). The TMDL will be re-evaluated 4 years after the effective date for WLAs based on results of required special studies from year 1 to 3. A comprehensive Coordinated Monitoring Plan is required 12 months after the TMDL effective date. Compliance monitoring or “Effectiveness Monitoring” is required for 8 locations along the creek.

29
THIS PAGE INTENTIONALLY LEFT BLANK

30
APPENDIX B
Monitoring Sites
Coordinates Reach Station ID Station Name Water Body Sampling
Frequency Latitude Longitude Thomas Guide
Description (including historical sites, if any)
1 BCB-1 WASHINGTON Main Channel: Ballona Creek Weekly N34 º
01.938’ W118 º 22.521’ 633:A7
At Washington Blvd. (slightly downstream of LACDPW- TS10 at La Cienega Blvd).
BCB-2 DUQUESNE Main Channel: Ballona Creek Weekly N34º
1.036’ W118º 23.35’ 672:H1 At Duquesne Blvd. on the main
channel of Ballona Creek.
BCB-3 BENEDICT CANYON
Confluence: Benedict
Canyon/Ballona Creek
Weekly N 34º 00.870’
W118º 23.464’ 672:H2
At the confluence of Benedict Canyon Channel/Ballona Creek (cross street is Duquesne Avenue).
BCB-4 CULVER Tributary: Sepulveda Channel
Weekly N33º 59.886’
W118º 24.923’ 672:E4
Near Culver Blvd. (same as site BC-4 in Ballona Creek Metals and Estuary Toxics TMDL CMP).
2
BCB-5 INGLEWOOD Main Channel: Ballona Creek Weekly N33º
59.387’ W118º 24.704’ 672:E6 At Inglewood Blvd. on the main
channel of Ballona Creek.
BCB-6 CENTINELA Main Channel: Ballona Creek Weekly N33º
58.922’ W118º 25.376’ 672:D7 At McConnell Ave. on the main
channel of Ballona Creek
BCB-7 LINCOLN
Confluence: Centinela
Creek/Ballona Creek
Weekly N 33º 58.711’
W118º 25.549’ 672:D7
At the confluence of Centinela Creek/Ballona Creek (cross street is Lincoln Avenue).
Estuary
BCB-8 PACIFIC Main Channel: Ballona Creek Weekly N33º
57.679 W118º 27.142’ 702:A2 In Ballona Creek Estuary, from
Pacific Avenue bridge.
Table B.1 Effectiveness monitoring sites

31
Figure B.1 Effectiveness monitoring sites drainage areas

32
Figure B.2 Effectiveness monitoring sites drainage areas continued

33
THIS PAGE INTENTIONALLY LEFT BLANK

34
APPENDIX C
Field Sampling Equipment and Supply List The following equipment is needed for dry weather water quality sample collection.
1. First Aid kit 2. Portable eyewash bottle with saline solution 3. Ice chest (with ice) 4. Sampling pole with reel 5. Weighted bottle holder (attaches to fishing line/reel) 6. Sterilized polypropylene 125 mL bottles with 1% Sodium Thiosulfate
(necessary for freshwater/stormwater samples) 7. Wash bottle with de-ionized water 8. Foaming disinfectant hand cleanser 9. Waterproof labels 10. Paper towels 11. Water-safe pen and Lab marker 12. Field log sheet 13. Chain-of-Custody (COC) sheet 14. Thomas Guide (street map)/Electronic Navigation System 15. Trash bag 16. Cell phones (1 for each person) 17. Watch 18. Personal protective equipment:
i. Safety vest (ANSI 107 Class 2 compliant, high visibility) ii. Protective gloves (latex, nitrile, etc.) iii. Slip-resistant shoes/boots iv. Protective eyewear: UV protection; impact resistant v. Foul weather gear (when necessary) vi. Rain boots (when necessary) vii. Life vest (if entering the flood channel).

35
THIS PAGE INTENTIONALLY LEFT BLANK

36
APPENDIX D
Field Sampling Standard Operating Procedures
I. Water Quality Sampling A. Overview of Procedure At the beginning of each month, Field Sampling staff provides Laboratory Staff at the Environmental Monitoring Division (EMD) with a sampling schedule detailing when sampling will be conducted, and the number of samples to be delivered. The Laboratory supplies Field Sampling staff with clean, sterile polypropylene bottles with the necessary additives. Sample bottles are labeled and Chain-of-Custody (COC) sheets are prepared prior to going out to the field. All necessary gear, including personal protective equipment, must be brought to the field. Grab samples are collected at designated sampling stations, and the time of collection is recorded on the COC and Field Log sheets. Samples are then stored on ice, sample temperature read and recorded by EMD laboratory staff at DSM (5th floor, Pregerson Building, Hyperion Treatment Plant), and then delivered to the Microbiology Laboratory at the Environmental Monitoring Division (4th floor, Pregerson Building, Hyperion Treatment Plant). Laboratory staff will need to make sure the samples are received within the maximum allowable holding time. The original COC sheet is signed, dated, noted as to the time samples are received and given to EMD staff. The Field Sampling crew retains a copy of the COC. II. Sampling Procedure:
A. Coordination with Laboratory
At the beginning of each month, the monthly sampling schedule is sent via email to the supervisors of the Microbiology Section at EMD. If unforeseen changes are made to the schedule, EMD staff is notified immediately. Contact name is listed below:

37
Microbiology Section: Water Microbiologist III
Supervisor: Ioannice Lee Phone: (310) 648-5196 Email: [email protected]
B. Gather the necessary equipment:
See Appendix C Sampling Locations/Frequency:
Reach Station ID Water Body Sampling
Frequency Thomas Guide
Description (including historical sites, if any)
1 BCB-1
Washington Blvd.; Main
Channel: Ballona Creek
Weekly 633:A7 At Washington Blvd. (slightly downstream of LACDPW- TS10 at La Cienega Blvd).
BCB-2 Duquesne Ave., Main Channel: Ballona Creek
Weekly 672:H1 At Duquesne Blvd. on the main channel of Ballona Creek.
BCB-3
*Duquesne Ave., Confluence:
Benedict Canyon/Ballona
Creek
Weekly 672:H2
At the confluence of Benedict Canyon Channel/Ballona Creek (cross street is Duquesne Avenue).
BCB-4
Culver Blvd.; Tributary: Sepulveda Channel
Weekly 672:E4
Near Culver Blvd. (same as site BC-4 in Ballona Creek Metals and Estuary Toxics TMDL CMP).
2
BCB-5 Inglewood Blvd.,
Main Channel: Ballona Creek
Weekly 672:E6 At Inglewood Blvd. on the main channel of Ballona Creek.
BCB-6 *Centinela Ave., Main Channel: Ballona Creek
Weekly 672:D7 At McConnell Ave. on the main channel of Ballona Creek
BCB-7
*Lincoln Blvd., Confluence:
Centinela Creek/Ballona
Creek
Weekly 672:D7 At the confluence of Centinela Creek/Ballona Creek (cross street is Lincoln Avenue).
Estuary
BCB-8 Pacific Ave.,
Main Channel: Ballona Creek
Weekly 702:A2 In Ballona Creek Estuary, from Pacific Avenue bridge.
* Nearest major cross street to sample site. See provided GPS coordinate for actual sampling site.

38
C. Field Log sheet.
A field log sheet is provided in Appendix E. This form is for recording details about each sampling event (including date, time, locations, samplers, comments), and is retained by the sampling staff. The form is to be prepared before leaving to the field, and the appropriate information is filled out after each sample is collected.
D. Chain of Custody (COC) form.
A COC form is to be completed for each sampling event. The form should be prepared prior to leaving to the field. At each sampling station, the sampler enters his/her initials, along with time of collection. The original COC is to follow the samples at all times. The sampler must sign and date the COC when relinquishing the sample to Laboratory Staff (Sample Receiving, EMD) who in turn, signs the form to indicate receipt of the sample. A photocopy is given to the sampling staff, and the laboratory retains the original COC along with the samples to be analyzed. A blank COC is provided in Appendix E.
E. Collecting Samples When sampling from a bridge, a fishing pole/reel is used to lower the sample bottle into the stream.
a. Obtain clean and sterile polypropylene bottles with Sodium Thiosulfate (necessary for freshwater/stormwater samples). Confirm that the bottle has the appropriate pre-printed label.
b. Note the sample collection time on the Field Log sheet, COC, and sample label.
c. Be very careful to avoid contamination of the sample bottle. Wear clean gloves and avoid touching the mouth of the bottle and the inside of the cap.
d. Attach the bottle-holder to the fishing line, and secure the bottle. Unscrew the bottle lid, and set it aside. Release the drag on the reel, and lower the bottle into the stream. Allow the bottle to fill with water, and then reel it in. Replace the lid securely, and place the sample into the ice chest.
e. Rinse bottle holder with de-ionized water after each station. f. Fill in appropriate information on the COC and field log sheet. g. Samples should be delivered to the laboratory as soon as possible.
When relinquishing custody of the samples, inform Laboratory staff of the start time of the six hour holding time limit for the samples. Laboratory staff will read the sample temperature, sign and date the COC, and make a copy of the COC for field staff to keep.
h. Upon returning from the field, file the COC (copy) and field log sheet in the appropriate binder. Rinse all field equipment with de-ionized water.
39
III. Contact Information: Laboratory: Environmental Monitoring Division Microbiology Section Water Microbiologist III Supervisor: Ioannice Lee Phone: (323) 648-5196 Email: [email protected] Watershed Protection Division Pollution Assessment Section Water Biologist III Supervisor: Jon Ball Phone: (323) 342-1557 Email: [email protected] TMDL Implementation Section Senior Engineer: Reza Iranpour, Ph.D., P.E. Phone: (213) 485-0577 Email: [email protected]

40
THIS PAGE INTENTIONALLY LEFT BLANK

41
APPENDIX E
Field and Data Entry Worksheets
Examples of worksheets for Chain of Custody sheets (2 pages) and recording analytical results used by the City of Los Angeles’ Watershed Protection Division and Environmental Monitoring Division are provided herein. They include field observations, Chromogenic Substrate data entry, and Membrane Filtration data entry. Once completed, data are then entered into the LIMS database.
CITY OF LOS ANGELES – DEPARTMENT OF PUBLIC WORKS – BUREAU OF SANITATION WATERSHED PROTECTION DIVISION – SECTION
FIELD COLLECTION SHEET Program:_________________________________________________________
Sampling Date:
STATIONS STATION CODE
STAFF INITIALS
COLLECTION TIME
TEST REQUESTED SAMPLE ID
COMMENTS (Weather, Water
condition,…)
CHAIN-OF-CUSTODY
Relinquished by: (signature) Print Name Date/Time
Accepted by: (signature) Print Name Date/Time
Email results to: REVISED DATE


43
EMDDepartment of Public Works Sample Chain of Custody LIMS #:Bureau of SanitationEnvironmental Monitoring Division
EMD Sample ID: Project Name:
Sampling Information: Sampling Agency: Sampling Program:Agency Sample ID#: Phone Number:Fax Number: Purpose of program:Contact Person: email address:
Report Time Frame:Sampler's Name: Sampler's Title
Sampler's Signature:
Witness: Name Sample Date: Title
Sampling Time: Name Title
Sample Location: Sampling Address:
Requested Analysis: Metals: Micro Biological:Organics: Toxicity:Conventional Chemistry: Air Testing:
See back of page for specifics analysesSample Notification:
Toxicity: Date: PC: Date:
Metals: Date: Wet: Date:
Semi-Vol: Date: Micro: Date:
Volatile: Date:
Received DateReleased
Date Signature Current Holder Name Title Received Time
Date:

44
Analysis to be performed on the Sample(s):
EMDLIMS #:
Locator: Collection Time: Locator: Collection Time:-1 -6-2 -7-3 -8-4 -9-5 -10
Sample Information: Liquid: Solid: Other: Temperature Grab Composite:
Start time: Finish time: pH Container: Glass Size: Color: Number:
Plastic Size: Color: Number: Residual Cl2 Preservative Number of samples:
Metals:Ag Cu Pb Other:Al Fe SbAs Hg SeBa K SnBe Mg Sr Total
85 Ca Mn Tl DissolvedCd Mo VCo Na ZnCr Ni
Organics: VOC Pesticides/PCB Clopyralid Air VOC BNA Dioxin - screen Dioxin - low resolution Fixed Gases TOX Other: Dioxin - high resolution GC Sulfur Herbicides Tributyltin Siloxanes
Conventional Chemical: Alkalinity MBAS Solids:BOD Nitrogen: Total SolidsBoron Ammonia Nitrogen Total Dissolved SolidsChloride Nitrate-N Total Suspended SolidsCOD Nitrite-N Settleable SolidsConductivity Organic-N Volatile Suspended Solids Cyanide (Free) Kjeldahl Nitrogen Volatile Total SolidsCyanide (Total) Oil & Grease SulfatesFlashpoint pH Sulfides, TotalFluoride Phenols Sulfides, DissolvedGrain Size Phosphate, Total ThiosulfateHardness Phosphate, Dissolved TOCHexavalent Chromium Radioactivity TurbidityH 2 S Salinity Other:
Biological:Total Coliform Salmonella Other:Fecal Coliform Acute Toxicity (Fresh water)E. coli Chronic Toxicity (Sea water)Enterococcus Chronic Toxicity (Fresh water)
Remarks:

45
Environmental Monitoring Division Microbiology Group
QUANTITRAY COUNTS
Station
BCB-1
BCB-2
BCB-3
BCB-4
BCB-5
BCB-6
BCB-7
BCB-8
Blank
Dup 10 ml
Large cells
Small cells
Blank 100 mL
Blank
Large Cells
Small Cells
Station
BCB-1
BCB-2
BCB-3
BCB-4
BCB-5
BCB-6
BCB-7
BCB-8
Blank
Dup 10 ml
Large cells
Small cells
Blank 100 mL
Blank
Large Cells
Small Cells
Date:__________________ Read by:________ Time:_______ Validated:____________________
TOTAL

46
Date: ENVIRONMENTAL MONITORING DIVISION
Entered by 1: 2: Validated by:______ MICROBIOLOGY UNIT
BACTERIAL DENSITIES
ENTEROCOCCUS Read by: Time: ______
VOL. (mL)
BCB-1
BCB-2
BCB-3
BCB-4
BCB-5
BCB-6
BCB-7
BCB-8
Blank
Dup
10
50
100
ENTERO/100 mL
VOL. (mL)
BCB-1
BCB-2
BCB-3
BCB-4
BCB-5
BCB-6
BCB-7
BCB-8
Blank
Dup
10
50
100
E. coli

47
THIS PAGE INTENTIONALLY LEFT BLANK

48
APPENDIX F
Laboratory Equipment and Supply List Chromogenic Substrate Method
Materials and Equipment
o Sterile, transparent, non-fluorescent container - 125 mL volume (use containers provided by Colilert kit if available)
o Colilert-18 reagent packets o Enterolert reagent packets o Quantitray/2000 trays o Graduated cylinder, sterile - 100 mL (optional) o Quantitray/2000 rubber tray insert o UV cabinet or lamp - long wave, 366nm o Deionized water – sterile o Colilert Quantitray/2000 color/fluorescence comparators
Membrane Filtration Method
Materials and Equipment
o Plate Labeling Indelible marking pen Kimwipes Prepared mEndo, mFC, and mE agar plates Agar plate carrier with dark cover
o Filtration 1 mL and 10 mL sterile, bacteriological or Mohr disposable
pipets Pipet biohazard container Vacuum pump Filtration manifold Microfil vacuum support base Microfil filter screen disc (in 95% alcohol jar) Sterile, disposable Microfil funnels Membrane filters - sterile, white, grid-marked, 7mm diameter
filters with 0.45µM pore size Labeled mEndo, mFC, and mE agar plates in covered plate
carrier Alcohol lamp 95% and 70% ethanol Glass safety jar with lid Paper towels Sterile, plastic squirt bottle

49
Forceps - smooth-tipped stainless steel Pipet bulb Alcohol pads Incubator, 35.0 ± 0.5�C Water bath, 44.5 ± 0.2�C Incubator, 41.0 ± 0.5�C Solid heat-sink fecal coliform incubator, 44.5 ± 0.2�C Matches Long-handled forceps Sterile, phosphate-buffered rinse water Sterile, phosphate-buffered water dilution tubes
o Colony Counting
Binocular, stereoscopic microscope with fluorescent lamp Disposable gloves Data worksheets Large biohazard container Incubated mEndo, mFC, and mE agar plates EIA agar plates

50
THIS PAGE INTENTIONALLY LEFT BLANK

51
APPENDIX G
Laboratory Standard Operating Procedures (SOPs) Chromogenic Substrate Method: Shoreline/Marine Samples
Procedure o Disinfect the workbench area with 70% ethanol. Let air-dry. o Preparation of sample container
You will need one sterile container per sample. Label each sample container with station name and test to be performed (e.g., Container1: S01, TC/EC, Container 2: S01, Entero).
Remove the outer plastic ring/label seal around the container cap. Remove the container cap, being careful not to touch the inside of the cap. Pour sterile D.I. water from a flask into each container. Be careful not to touch the rim of the D.I. flask or the container. Pour the D.I. water to the 100 mL mark on each container and replace the cap. Replace the cap back onto the D.I. water flask if there is any D.I. water left in the flask.
If a 10-ml sample aliquot is to be used, remove 10 ml of D.I. water from all sample containers using a sterile 10 ml pipet. If only 1 ml of sample is to be analyzed, skip this step of removing 10 ml of D.I. water.
You will need one Coli-18 reagent pak for each sample container labeled TC/EC and one Enterolert reagent pak for each container labeled Entero. Carefully separate one reagent snap pak from the strip, taking care not to accidentally open the adjacent pak. Tap the snap pak to ensure that all of the reagent powder is in the bottom part of the pack.
Open the pak by snapping back the top at the scoreline. Do not touch the opening of the pak.
Add the reagents to the appropriate sample containers filled with D.I. water. Replace the cap on the container, tighten, and gently mix until the reagent is dissolved. Note that when the Coli-18 reagent is added to the D.I. water in the container, the solution is a clear color and when Enterolert reagent is added to the D.I. water, the solution is a yellow color.
Pipet 10 mL of each sample into the appropriate sample containers. Place the used pipets into the pipet biohazard container. Replace the sample container caps and mix gently.
o Quanti-tray/2000
Turn on Quanti-tray® sealer at the start of sample preparation. You will need one Quanti-tray for each labeled sample container. Check to see that the green Ready Light (above the amber power
light) is illuminated on the sealer. The sealer will not operate until

52
both the amber power light and the green Ready Light are illuminated.
Using one hand, hold a Quanti-tray upright with the well side (plastic) facing your palm. Squeeze the upper part of the Quanti-tray so that it bends towards the palm of your hand. Using your other hand, gently pull the foil tab at the top of the tray to separate the foil from the top of the tray, creating an open pouch. Avoid touching the inside of the foil or tray and be careful not to tear the foil.
Pour the reagent/sample mixture directly into the Quanti-tray, avoiding contact with the foil tab at the top of the tray. Tap the small wells at the bottom of the tray to release any air bubbles. Allow any foam present to settle.
Place the sample-filled tray onto the rubber insert of the sealer with the well side (plastic) of the tray facing down. Align the small and large wells with their corresponding holes in the rubber insert. Make sure the tray is properly seated in the rubber insert. With your hand, gently press on the back of the tray to distribute some of the liquid into the larger wells.
Slide the rubber insert into the sealer until the motor grabs the rubber insert and begins to draw it into the sealer.
In approximately 15 seconds, the tray will be sealed and partially ejected from the rear of the sealer. Remove the rubber insert and tray from the rear of the sealer.
If a misaligned tray is accidentally fed into the sealer, press and hold the “reverse” button (located on the top, front center of the sealer). This will reverse the motor and you can then remove the tray. Do not reverse the motor once the rubber insert has been drawn fully into the input slot of the sealer.
Repeat for each labeled tray. Turn off the sealer and unplug the unit when you are finished sealing all the trays.
Using a felt-tipped marker, label the front of each tray with the incubation time.
Place all Quanti-trays labeled "TC/EC" into the 35°C (Total coliform) incubator for 18 hours.
Place all Quanti-trays labeled "Entero" into the 41°C (Enterococcus) incubator for 24 hours.
o QA Controls Refer to QA/QC SOP
o Clean-up • Dispose of the empty, used sample container in the large, red
biohazard containers. • Dispose of all pipet wrappers and empty reagent packs in the regular
trash receptacle. Return all lab supplies to their proper storage areas.

53
• Disinfect the workbench area with 70% ethanol. Let air-dry. • Discard original sample remaining in sample bottle (can discard down
sink drain). Rinse with tap water and place empty bottles on trash cart for later cleaning.
Reading Quanti-Tray Sample Results
o Disinfect the workbench area with 70% ethanol. Let air-dry. o TOTAL COLIFORMS - read 18-22 hours after incubation.
Remove the Quanti-trays from the 35°C (Total coliform) incubator. Record the date, time, and analyst name or initials on the sample
data sheet for the reading of Total Coliforms. Compare the intensity of the yellow color of the sample wells to the
intensity of the yellow color of the Comparator Quanti-tray. Any well with a yellow color of equal or greater intensity than the Comparator is considered a "positive" well. Wells with a clear color or a yellow intensity less than the Comparator are considered as "negative". If reaction is unclear or borderline yellow, replace the tray in incubator for further incubation up to a total of 22 hours.
Count the number of positive large wells. Remember that the single, large well at the very top of the Quanti-tray should also be included in the count if it is positive. Record the number of positive large wells on the sample data sheet. Count and record the number of large positive wells for each sample dilution that was set.
Count the number of positive small wells. Record the number of positive small wells on the sample data sheet. Count and record the number of small positive wells for each sample dilution that was set.
o E. coli- read 18-22 hours after incubation.
These results are read from the Total coliform Quanti-trays. Record the date, time, and analyst name or initials on the sample
data sheet for the reading of E. coli. Place Quanti-tray under a UV cabinet or lamp. Press the red button on the top of the UV lamp to turn the lamp on.
Make sure the lamp is pointed away from you. Count the number of large and small fluorescent wells for each
sample dilution. Remember that the single, large well at the very top of the Quanti-tray should also be included in the count for the large wells if it is positive. Record the results on the sample data sheet.
If in doubt as to the fluorescence of a well, compare it to the negative fluorescence of the Quanti-tray Comparator. This Comparator is "negative" for fluorescence. If fluorescence on the well(s) is/are still questionable, mark the well(s) with an indelible pen or marker and re-incubate Quanti-tray for an additional 2 - 4 hours. Read Quanti-tray again following the incubation period.

54
ENTEROCOCCUS - read 24-28 hours after incubation
Remove the Quanti-trays from the 41°C (Enterococcus) incubator. Record the date, time, and analyst name or initials on the sample
data sheet for the reading of Enterococcus. Place Quanti-tray under a UV cabinet or lamp Press the red button on the top of the UV lamp to turn the lamp on.
Make sure the lamp is pointed away from you. Shine the UV lamp directly on the sample Quanti-tray within five
inches of the tray. Count the number of large and small fluorescent wells for each sample dilution. Remember that the single, large well at the very top of the Quanti-tray should also be included in the count for the large wells if it is positive. Record the results on the sample data sheet.
If in doubt as to the fluorescence of a well, compare it to the negative fluorescence of the Quanti-tray Comparator. This Comparator is "negative" for fluorescence. If fluorescence on the well(s) is/are still questionable, mark the well(s) with an indelible pen or marker and re-incubate Quanti-tray for an additional 2 – 4 hours. Read Quanti-tray again following the incubation period.
o When finished reading all the Quanti-trays, turn off UV lamp and dispose of all trays into the large red biohazard containers.
o Disinfect the work bench area with 70% ethanol. Let air dry. o Leave the sample data sheets on the clipboard by the Quanti-tray sealer.
Quanti-Tray Calculations o Enter the number of positive large and small wells into the Idexx generator
or read from the Idexx MPN table. Multiply the number given in the table by the dilution factor used. If more than one dilution generates a result, take the average.
Example # Positive large wells: 23
# Positive small wells: 16 Idexx MPN table: 52.7
Calculation (10 ml aliquot of sample): 52.7 (number from table) x 10 (Result based on a 100 ml sample size) = 530 MPN/100 ml
Membrane Filtration Method (for Enterococci analysis)
Media Preparation o mEndo Agar LES

55
To rehydrate the medium, suspend 51 grams in 1 liter deionized water containing 20 mL 95% ethanol and heat to boiling to dissolve completely. Cool to 45-50�C. (If using the agarmatic, follow the agarmatic directions for making mEndo.) Aseptically dispense 4-5 mL amounts into the lower halves of 60x15 mm sterile, disposable petri dishes and allow to solidify. Final pH 7.2 ± 0.2. Record pH results in the media prep log book.
Set QA media controls.
• Refer to QA/QC SOP Place agar plates in a labeled media container and refrigerate until
needed. The holding time for agar plates is two weeks. o mFC Agar
To rehydrate the medium, suspend 52 grams in 1 liter deionized water and heat to boiling to dissolve completely. Add 10 mL of a 1% solution of rosolic acid in 0.2 N NaOH. Continue heating for 1 minute. Cool to 45 -50�C. (If using the agarmatic, follow the agarmatic directions for making mFC.) Aseptically dispense 4-5 mL amounts into the lower halves of 50-60x15 mm tight-fitting sterile, disposable petri dishes and allow to solidify. Final pH 7.4 ± 0.2. Record pH results in the media prep log book.
1% Rosolic Acid Solution - Add 0.1 grams rosolic acid to 10 mL of stock 0.2 N NaOH. Mix well.
Stock 0.2 N NaOH - Add 0.8 grams NaOH to 100 mL deionized
water. Mix to dissolve. Store in a labeled polyethylene reagent bottle.
Set QA media controls.
• Refer to QA/QC SOP Place agar plates in a labeled Tupperware container and refrigerate
until needed. The holding time for agar plates is two weeks. o mE Agar
To rehydrate the medium, suspend 7.12 grams in 100 mL of deionized water. Heat to boiling to dissolve completely. Autoclave for 15 minutes at 121�C. Promptly remove from the autoclave and cool to 45-50�C. Add 0.024 grams Nalidixic Acid and 1.5 mL of a 1% solution of triphenyl tetrazolium chloride (TTC). (If using the agarmatic, follow the agarmatic directions for making mE.) Aseptically dispense 4-5 mL amounts into the lower halves of 60x15 mm sterile, disposable petri dishes and allow to solidify. Final pH 7.1 ± 0.2. Record pH results in the media prep log book.
1% TTC Solution - Add 1 gram TTC to 100 mL of deionized water. Mix well. Using a sterile 0.22µm Millex-GS filter, filter-sterilize the

56
solution into a sterile, labeled 500 mL reagent bottle. Store in the refrigerator.
Set QA media controls. • Refer to QA/QC SOP
Place agar plates in a labeled Tupperware container and refrigerate until needed. The holding time for agar plates is two weeks.
o Esculin Iron Agar (EIA) To rehydrate the medium, suspend 1.65 grams in 100 mL of
deionized water. Heat to boiling to dissolve completely. Autoclave for 15 minutes at 121�C. Promptly remove from the autoclave and cool to 45-50�C. (If using the agarmatic, follow the agarmatic directions for making EIA.) Aseptically dispense 4-5 mL amounts into the lower halves of 60x15 mm sterile, disposable petri dishes and allow to solidify. Final pH 7.1 ± 0.2. Record pH results in the media prep log book.
Set QA media controls. • Refer to QA/QC SOP
Place agar plates in a labeled Tupperware container and refrigerate until needed. The holding time for agar plates is two weeks.
o Phosphate-Buffered Water 1 N NaOH - Carefully add 4 grams NaOH to 100 mL deionized
water. Mix to dissolve. Store in a labeled polyethylene reagent bottle.
Stock Phosphate Buffer Solution - add 34.0 grams potassium dihydrogen phosphate (KH2PO4) to 500 mL deionized water and mix to dissolve. Adjust pH to 7.2 ± 0.5 with 1 N NaOH and bring volume to 1 liter, using a 1 liter volumetric flask. Transfer to a reagent bottle and autoclave for 15 minutes at 121�C. Let cool and refrigerate. Discard if turbidity is present.
Stock Magnesium Chloride Solution - add 81.1 grams MgCl2�6H2O to 1 liter deionized water and mix to dissolve. Transfer to a reagent bottle and autoclave for 15 minutes at 121�C. Let cool and refrigerate. Discard if turbidity is present.
Working Solution of Phosphate-Buffered Dilution/Rinse Water • Add 1.25 mL stock phosphate buffer solution and 5 mL stock
magnesium chloride solution to 1 liter deionized water. Adjust pH to approximately 7.6-7.7 with 1 N NaOH. Mix and dispense approximately 9.5 mL into specially marked dilution test tubes. Autoclave at 121�C for 15 minutes. If phosphate-buffered rinse water is needed, autoclave 1-2 L volumes in large flasks for 45 minutes at 121�C.
• Cool and check that buffered water level is at the marked line (9 mL) on the test tube. Aseptically adjust water level if necessary. Tightened test tube or flask caps and store at room temperature. Holding time for screw-capped media is

57
3 months. Final pH 7.2 ± 0.1. • Sterility control - test the sterility of the buffered dilution
water by aseptically pouring 2 test tubes of dilution water into a sterile bottle containing 100 mL of Tryptic Soy Broth. Test the sterility of the liter flasks of rinse water by aseptically adding 20 mL buffer to a sterile bottle containing 100 mL TSB. Incubate the bottle for 48 hours at 35.0 ± 0.5�C. Record pH and sterility check results in the media prep log book.
o Tryptic Soy Broth (TSB) To rehydrate the medium, suspend 30 grams in 1 liter of deionized
water and mix to dissolve completely. Dispense 100 mL of broth into 125 mL Nalgene bottles. Autoclave for 15 minutes at 121�C. Promptly remove from the autoclave when done. Let cool and then tighten caps. Final pH 7.3 ± 0.2. Record pH results in the media prep log book.
Set QA media controls. • Refer to QA/QC SOP
Place TSB bottles in the refrigerator until needed. The holding time for screw-capped media is three months.
Plate Labeling Procedure
o Clean and wipe the bench-top work area with 70% ethanol and let air dry. o Check the monthly sample calendar for the samples and duplicates
scheduled for the day. o Check the QA results of the prepared agar plates to be used. These
results are recorded in the media prep log book. Use only media that have passed the sterility, positive control, and negative control checks.
o Record the media preparation dates for all the agar plates being labeled. The dates are recorded in the media prep log book under "Prep Date of Media in Use".
o Inspect all agar plates. Discard any plates that have bubbles that will interfere with
bacterial growth when the membrane filter is placed on the agar surface.
Check plates for contamination of any kind (bacterial growth, mold, or strange color). Discard any contaminated plates into a biohazard bag.
o Using an indelible marking pen or pre-printed labels, label each plate with the station name or location at the top of the petri dish, sample volume or dilution in the middle, and sample date at the bottom of the dish.
Consult the Sample Dilution Table for the necessary dilutions for each sample type.
mEndo and mFC agar plates are labeled on the bottom (agar side) of the petri dish.
mE agar plates are labeled on the top (lid side) and the bottom

58
(agar side) of the petri dish. o Stack all the agar plates for the same station together after the plates are
labeled. Stack plates by ascending volume order (smallest volume on top).
o When stacking, be sure to place all plates, agar side up. o Place the stack of plates for each sample into a slot in one of the agar
plate carriers. o Add a small stack of unlabelled mEndo agar plates to the carrier. These
plates will be used for QA blanks as needed during filtering. o Label the cover of each plate carrier with the sample stations or locations
for all plates in the carrier. Include duplicate stations on the label for all boat plate carriers.
o If plates are labeled one day in advance of use, refrigerate the plate carriers. Labeled plates that are refrigerated need to be taken out of the refrigerator on the day of use.
o If plates are labeled on the day of use, the plate carriers can be left out at room temperature until needed.
Filtration Procedure
o Clean and wipe the bench top work area with 70% ethanol and let air dry. o Gather the necessary filtration equipment. o Aseptically transfer sterile, phosphate-buffered rinse water into a sterile
squirt bottle. o Select samples to be filtered. Select the proper agar plates for the
samples and check the plate stacking order to make sure sample volumes are in ascending order.
o Make 1:10 serial dilutions (if needed). Shake the sample vigorously for several seconds (about 25 - 30
times) to break up any bacterial cell aggregates, to separate cells from particulate matter, and to make the sample homogenous.
Aseptically pipet 1 mL of the sample into a sterile 9 mL dilution test tube and shake or vortex vigorously. This is a 1:10 (10-1) dilution of the sample.
Aseptically pipet 1 mL of the 10-1 dilution into a second 9 mL dilution tube and shake or vortex vigorously. This is a 1:100 (10-2) dilution.
Aseptically pipet 1 mL from the second (10-2) dilution tube into a third 9 mL dilution tube and shake or vortex vigorously. This is a 1:1000 (10-3) dilution.
Continue making 1:10 serial dilutions as needed. o Fill the alcohol lamp with 95% ethanol and light it. o Prepare filtration equipment, one filtration unit per sample.
Wipe the Microfil support base with an alcohol pad. Let dry. Remove filter screen disc from the 95% alcohol jar using the long-
handled forceps. Gently shake the disc over the alcohol jar to remove any excess alcohol. Flame-sterilize the disc. Allow flame

59
to self-extinguish. Place disc onto the Microfil support base. Squirt the disc with a small amount of sterile buffer to wash any
residual alcohol off the disc. Apply vacuum to drain the buffer off the disc.
Aseptically remove a membrane filter from the filter dispenser, using an alcohol flame-sterilized forceps. Place the filter, grid-side-up on filter support base.
Aseptically remove a sterile, disposable Microfil funnel from the funnel dispenser.
Put the funnel over the filter on the support base. Place thumbs and index fingers of both hands on the upper, outside ridge of the funnel. Evenly push down on the funnel to securely lock it into place.
o Shake sample vigorously for several seconds (about 25 - 30 times) to break up any bacterial cell aggregates, to separate cells from particulate matter, and to make the sample homogenous. Place bottle at a slant to let any sand or debris in the sample settle to the bottom sides of the bottle.
o Record filtering start time and initials in the LIMS "Micro Log-in" Excel worksheet on the PC computer. Move the cursor to the appropriate cell for the sample being filtered.
If the starting time is the current time, press "CTRL+T". Alternately, enter the time using a colon, ex. "10:25 or 14:00".
o Before filtering the sample, determine if a QA sterility blank needs to be done.
Refer to QA/QC SOP o Wet the membrane filter with an adequate amount of sterile rinse water
before adding sample aliquots delivered with a pipet. Add the sample aliquot to the filter according to the plate stacking order. Use a new filter for each sample aliquot.
o Use sterile pipets for sample volumes < 20 mL. If the pipet is to be used again, rest the pipet tip against the inner lip of the sample bottle. Do not let the pipet tip rest on the bottom of the sample bottle. Discard used pipets into the pipet biohazard container.
o For sample volumes of 50 mL or 100 mL, aseptically pour the sample to the measured lines on the Microfil funnel. If an excess amount of sample is poured into the funnel, use a sterile pipet to remove the excess. Discard the excess sample along with the pipet into the pipet biohazard container.
o Before applying the vacuum, swirl the sample in Microfil funnel by moving the funnel in a gentle circular motion to evenly distribute bacterial cells on the membrane filter surface.
o Apply vacuum, letting the sample drain through the filter. o Thoroughly rinse down the walls of the funnel two times with a generous
amount of sterile buffer water. This will wash down any bacteria that may adhere to the sides of the funnel.
o With one hand on the outside walls of the funnel, use a backwards and

60
upwards motion to pop the funnel off the support base. Continue to hold the funnel with your hand. Use your other hand to aseptically remove the filter with a flame-sterilized forceps (one sterile forceps per membrane filter). Aseptically replace the funnel back on the support base.
o Aseptically place the filter on the surface of the appropriate agar plate, using a rolling motion to avoid trapping air between the agar and the filter, which will result in the formation of bubbles. If any air is trapped under the filter, reset the membrane filter onto the agar surface. Place the used forceps into the jar of ethanol.
o Stack finished plates by sample and media type. Remember to always position finished plates agar (bottom) side up. This is to avoid any condensation dripping onto the surface of the filter during incubation, which may interfere with or distort bacterial growth.
o Continue filtering the sample, following the steps detailed above for each sample volume or dilution labeled on the stack of plates.
o If a duplicate sample is being filtered, the same pipets and dilution tubes (if needed) may be used for both the regular sample and the duplicate sample.
o When the sample is finished being filtered, place mEndo and mE agar plates in a covered incubation container (with moist sponges) according to media type. Total coliform mEndo agar plates are incubated for 23 ± 1 hour at 35.0 ± 0.5 �C. Fecal coliform mFC agar plates are incubated for 24 ± 2 hours at 44.5.0 ± 0.2 �C. It is important that fecal plates are incubated within 20 minutes of filtration to ensure heat-shock of the non-fecal bacteria. Plates are incubated in either the dry heat-sink incubators or sealed in water-proof bags and placed in the 44.5 ± 0.2�C water bath. Enterococcus mE agar plates are incubated for 48 ± 2 hours at 41.0 ± 0.5�C.
o Record filtration finish time, initials, and incubation time in the LIMS "Micro Log-in" Excel worksheet on the PC computer.
o The incubation containers should be labeled with the indicator bacteria, test date, and incubation time.
o Place used Microfil funnels in the biohazard bag for the funnels. Place sample bottles, empty buffer flasks, and used squirt bottles (if not being used for filtering more samples) in a tub for later washing.
o Wipe down the bench-top work area with 70% ethanol and let air dry. o To filter another set of samples, wipe the Microfil support base and filter
screen disc with a new alcohol pad. Rinse the disc with sterile rinse water. Repeat procedure as detailed in the above sections.
o When taking a long break between filtering samples, wipe the Microfil support base and filter screen disc with a new alcohol pad. Leave the alcohol pad on the screen disc. Place an alcohol-wiped cap over the Microfil unit. Before filtering again, remove the cap and re-wipe the Microfil unit and filter screen disc with the alcohol pad. Rinse the disc with sterile rinse water. Repeat procedure as detailed in the above sections.
o When all samples have been filtered, remove the filter screen disc from

61
the Microfil support base and put in the 95% alcohol jar. Wipe the Microfil support base with a new alcohol pad. Leave the alcohol pad in the empty disc space. Place an alcohol-wiped cap over the Microfil unit.
Colony Counting Procedure
o Check the LIMS "Micro Log-in" Excel worksheet for the incubation times of the plates that need to be read that day. Determine when the plates can be read according to their required incubation times.
o Gather the necessary data worksheets for all samples to be read. Each test and sample type has separate data worksheets.
o Record the time the plates are read and analyst initials in the LIMS "Micro Log-in" Excel worksheet and also on the data worksheets.
If the read time is the current time, press "CTRL+T". Alternately, enter the time using a colon, ex. "10:25 or 14:00".
o If desired, wear disposable gloves when handling and reading the plates. o Remove plates from the incubator when it is time to read them and
arrange them in ascending volume order for each station. o Use the stereoscopic microscope with a fluorescent lamp to aid in
identifying and counting colonies. o Starting with the control blank plate if one was done; examine the filter for
bacterial contamination or any notable changes on the filter or agar media. o Examine and count all the plates set for a single sample, starting with the
smallest sample volume filtered or the most dilute sample. o Colonies that have grown into each other should be counted individually.
Separate nuclei or a fine line of contact may usually be seen. o Colonies in each and every filter grid square within the filtering area are to
be counted. o To make counting easy and simple, start counting at the top of the filter.
Count from left to right, following the grid lines, and continue to the bottom of the filter.
o Countable ranges - Due to the possible adverse effect of colony crowding on sheen or color development on the filter membrane, and to be assured of a statistically valid colony count, minimum and maximum bacterial levels have been set for each of the indicator bacteria.
Total bacteria: <200 total colonies (background and indicator bacteria).
Total Coliform: 20 - 80 coliform colonies Fecal Coliform: 20 - 60 fecal coliform colonies Enterococcus: 20 - 60 enterococcus colonies
o Colony Morphology Total Coliforms
• The typical colony has a pink to dark-red color with a shiny, greenish-gold, metallic surface sheen. The sheen may cover the entire colony, or it may appear only in the central area or on the periphery.
• This sheen is produced as a by-product of lactose

62
fermentation (acid aldehyde complex) in combination with the Schiff's reagent (fuschin sulfite) in the mEndo media.
Fecal Coliforms • Any colony exhibiting any light or dark blue color, whether
covering the entire colony or only in or on part of the colony. • This blue color is a result of the acid produced by the
fermentation of lactose combining with the aniline blue dye in the mFC media.
• Colonies exhibiting a cream or grey color are not fecal coliforms.
Enterococcus • After 48 ± 2 hours incubation, mE filters with growth on them
are transferred to room temperature EIA plates. • Using forceps, remove the filter (handling the filter by its
edge, outside of the filtration area) from the mE plate and roll it onto the agar surface of the EIA plate.
• Replace the top of the EIA plate with the labeled top lid of the original mE plate.
• Incubate the EIA plates for 20 minutes at 41.0 ± 0.5�C. • Enterococci are pink to carmine-red colonies with black or
reddish-brown precipitate or halos on the underside of the filter when placed on EIA agar.
• The colony color is due to the reduction of the vital indicator TTC (2,3,5-Triphenyl tetrazolium chloride) to non-reversible formazin. The dark precipitate or halo is the result of the hydrolysis of esculin.
o Record all colony counts and any other notable information on the data worksheet. Comments should include information about unusual conditions on the filter, such as the presence of solids, artifacts or high background counts. The condition of the growth on the filter should also be noted, such as confluent areas or confluent growth over the filter.
CG = confluent bacterial growth with indistinct or non-discrete colonies.
TNTC = Too Numerous To Count >200 = greater than 200 background and indicator colonies on a
filter. o If there are any questions regarding counting colonies or any unusual or
suspicious plates, save all plates for that sample and show them to a microbiologist.
o Dispose of all plates and gloves in a biohazard container. Autoclave at the end of the day.
Calculations
o Due to the possible adverse effect of colony crowding or color development on the filter membrane, and to be assured of a statistically valid colony count, minimum and maximum bacterial levels have been set

63
for each of the indicator bacteria. Total bacteria: <200 total colonies (background and indicator
bacteria). Total Coliform: 20 - 80 coliform colonies Fecal Coliform: 20 - 60 fecal coliform colonies Enterococcus: 20 - 60 enterococcus colonies
o Indicator bacteria are expressed as bacterial density (CFU) per 100 mL of sample.
o The raw bacterial counts from the data worksheets are entered into LIMS "Sample Data Entry" Excel worksheets on the PC computer by a technician. The computer calculates the final bacterial densities for each sample and prints a copy of the data worksheet. See the LIMS Data Entry SOP for more details.
o The supervisor verifies the daily calculated bacterial densities. Daily bacterial density reports are printed out by the computer and E-mailed to the primary leads of the jurisdictional groups, who in turn will communicate this data to its jurisdictional members. The data reports are kept in a labeled notebook and the original data worksheets are kept in the data file cabinet. See the LIMS Data Validation SOP for more details.
o If the final bacterial densities need to be calculated by hand, the following guidelines should be used. All calculated values should have only 1 or 2 significant figures, depending on the colony counts.
Countable Range (Std.Meth., EPA):
Countable range number of colonies x 100 = (value) CFU/100 mL filter volume
Disregard non-countable range counts and volumes.
Volume Count blank 0 0.5 0 5.0 6 35 x 100 = 180 CFU/100 mL 20 35 20 50 95
Two volumes in the countable range (EPA):
Calculate each count independently as in 6.4.1. above and then
average the results.
Volume Count blank 0 20 x 100 = 100 60 x 100 = 120 0.5 0 20 50

64
5.0 6 20 20 100 + 120 = 110 CFU/100 mL 50 60 2
Counts less than the countable range (Std. Meth.):
Add all colonies x 100 = (value) CFU/100 mL Total all volumes
Volume Count blank 0 0.5 0 5.0 1 19 + 4 + 1 + 0 x 100 = 32 CFU/100 mL 20 4 50 + 20 + 5 + 0.5 50 19
No counts on any filter volume (EPA):
1 x 100 = < (value) CFU/100 mL Largest vol filtered
Volume Count blank 0
0.5 0 1 x 100 = <2 CFU/100 mL 5.0 0 50 20 0 50 0
Counts greater than the countable range - too numerous to count
(TNTC) or confluent growth (CG) (EPA):
Highest upper limit count x 100 = >(value) CFU/ 100 mL Smallest vol filtered
Volume Count For Total Coliforms: blank 0 80 x 100 = >16,000 CFU/100 mL 0.5* TNTC or CG 0.5 5.0 TNTC or CG For Fecal Coliforms or
Enterococci: 20 TNTC or CG 60 x 100 = >12,000 CFU/100 mL 50 TNTC or CG 0.5 *NOTE: If the count at the lowest dilution is TNTC, try to estimate the
count on the plate. Estimate the count in a quadrant if necessary. Use this number to calculate the count per 100 mL.

65
Confluent Growth Counts (Std. Meth., EPA):
Disregard all dilution volumes that are confluent growth. Analyze remaining counts and volumes.
Volume Count Volume Count blank 0 blank 0 0.5 0 0.5 3 5.0 CG 5.0 20 20 CG 20 CG 50 CG 50 CG 1 x 100 = <200 CFU/100 mL 20 x 100 = 400 CFU/100 mL 0.5 5.0
Total bacterial count (background bacteria plus indicator bacteria) greater than 200 colonies (Std. Meth.):
Analyze counts and volumes. Report as a greater than value.
Volume Count Volume Count blank 0 blank 0 0.5 0 (>200) 0.5 0 5.0 0 (>200) 5.0 3 20 CG 20 18 (>200) 50 CG 50 60 (>200)
1 x 100 = >20 CFU/100 mL 60 x 100 = >120 CFU/100 mL 5 50
Total colonies less than 200, but indicator bacteria greater than
upper limit (Std. Meth.):
If plate has well isolated, discrete colonies that can be easily counted, use the higher count.
Volume Count Volume Count blank 0 blank 0 0.5 85 0.5 2 5.0 TNTC 5.0 95 20 TNTC 20 TNTC 50 TNTC 50 CG
85 x 100 = 17,000 CFU/100 mL 95 x 100 = 1,900 CFU/100 mL 0.5 5

66
THIS PAGE INTENTIONALLY LEFT BLANK

67
APPENDIX H
Data Acquisition, Reduction, Validation, and Reporting Standard Operating Procedure (SOP)
When performing analyses, results are generally tabulated onto laboratory worksheets (see Appendix E, Field and Laboratory Worksheets) but sometimes are generated electronically via instrumentation. Data on laboratory worksheets are entered into the Laboratory Information Management System using an Excel interface. These data are then validated through a quality assurance process that checks for correctness of data entry and validity of results. The analyst who generates the data has the initial and primary responsibility for the completeness and correctness of the data. The data are then checked by the unit supervisor (or designee). The following procedures describe the data acquisition and entry process then the quality assurance and quality control procedures. Data Acquisition Both raw and calculated data are acquired in the laboratory by manual, electronic, or direct computer acquisition. Acquired data are properly and securely stored for the duration specified by regulatory agencies or the customer. Guidelines for documentation and recording of information are as follows:
Manual (Hand-written) Data Entry
o Data are entered directly into the notebook or worksheet with non-erasable ink.
o Data entries are signed and dated by the analyst making the entry. If the entry is more than one page, each page is signed and dated.
o Mistakes are canceled by drawing a line through the entry, entering the correct value, and signing and dating the correction. The use of correction fluid is not acceptable.
o Blank pages or substantial portions of pages with no entries are marked with a large "X" to indicate that they were intentionally left blank.
Direct Computer Acquisition
o In EMD’s Microbiology Unit, the program/software used to generate
results is prepared internally. A designated staff member of the Information & Control System Division (ICSD) at Hyperion has the responsibility of preparing the program and maintaining the supporting documents.
o The laboratory relies on vendor-supplied information for the validity and integrity of instruments equipped with significant computer functions as an integral part of the system.

68
Data Reduction Data reduction, where applicable, is described in specific SOP's. It involves reporting values with the appropriate significant figures in the concentration units established by the regulatory agency or the data user. Procedure for Entering Microbiology Data into LIMS
Log-On to LIMS Computer System o To log onto the LIMS system, double-click on the "Data Entry" icon on the
PC computer screen. o A Microsoft Excel dialog box will appear. Select the "Enable Macros" button. o Wait until the "Microbiology Laboratory Worksheet StartDialog" dialog box
appears.
Data Entry for CS o Enter the sample date in the dialog box. Please note that current date is
filled in by default. o Select the sample type. There is a list of sample locations to choose from.
(E.g. 5-Mile, Ballona Creek, Cabrillo Beach, LAH Plume, SMB Plume Day1, Shoreline, Inshore, and so on.)
o Dilutions for the CS method are not modified for rain events. For this method always make sure the "No" button is selected.
o Select the "OK" button. o A computer form similar to the raw data worksheet will appear. Select the
Excel worksheet tab for the type of test data to be entered. (ex. Total, E. coli, or Total & E. coli)
o Enter analyst initials, date, and time into the computer in the designated cells.
o Check to make sure the sample volumes or dilutions in the computer match the volumes or dilutions on the raw data worksheet. In the case of Ballona Creek, make changes to the volumes on the computer form, if necessary.
o Enter the number of large and small positive wells. o Check to make sure all data has been entered correctly. If a calculated
value does not appear for a sample, notify a microbiologist or the supervisor. o At the top of the computer worksheet, select the "Send Data to
LIMS/Wisard" button. o Select the "Print" button at the top of the computer worksheet. A printed
hardcopy of the raw data worksheet will print out on the printer in the micro lab.
o Select the "New Worksheet" button at the top of the computer screen if entering data for another sample location. Select the "Save/Exit" button if all the data entry has been done.
o If there are any problems or error messages regarding sending the data to LIMS, please contact LIMS staff at 55749 or 55120.

69
Data Entry for MF o Enter the sample date in the dialog box. Please note that current date is
filled in by default. o Select the sample type. There is a list of sample locations to choose from.
(E.g. 5-Mile, Ballona Creek, Cabrillo Beach, LAH Plume, SMB Plume Day1, Shoreline, Inshore, and so on.)
o If rain dilutions were used on the data worksheet, select "Yes" in the small "Rain" box. If normal dilutions were used, make sure the "No" button is selected.
o Select the "OK" button. o A computer form similar to the raw data worksheet will appear. Select the
Excel worksheet tab for the type of test data to be entered. (ex. Total, Fecal, Entero, or Total & Fecal)
o Enter analyst initials, date, and time into the computer in the designated cells.
o Check to make sure the sample volumes or dilutions in the computer match the volumes or dilutions on the raw data worksheet. In the case of Ballona Creek, make changes to the volumes on the computer form, if necessary.
o Enter the bacterial colony counts. o Check to make sure all data has been entered correctly. If a calculated
value does not appear for a sample, notify a microbiologist or the supervisor. o At the top of the computer worksheet, select the "Send Data to
LIMS/Wisard" button. o Select the "Print" button at the top of the computer worksheet. A printed
hardcopy of the raw data worksheet will print out on the printer in the micro lab.
o Select the "New Worksheet" button at the top of the computer screen if entering data for another sample location. Select the "Save/Exit" button if all the data entry has been done.
o If there are any problems or error messages regarding sending the data to LIMS, please contact LIMS staff at 55749 or 55120.
Review and Validation Review Data review is the process of comparing results to all available information, such as sample preparation and QC sample data, to evaluate the validity of the results. It supports the contention that the data are:
Reasonable (experience with similar situations, common sense), and Capable of supporting a defensible decision.
The analyst and the unit supervisor (or designee) are responsible for reviewing the data relative to the following:

70
Method blanks and QC sample Raw data Calculations Transcription
Validation Data validation is the systematic procedure of reviewing data against a set of criteria to provide assurance of its validity before reporting the data. It is accomplished through routine examination of data collection, flow procedures, and QC sample results. It uses QC criteria to reject or accept specific data
Validation includes the following:
o Dated and signed entries by analysts on the worksheets and logbooks used for all samples.
o Use of QC criteria to reject or accept specific data. o Checking of LIMS data entry and reporting
Validation Guidelines include the following:
o Documentation of methods used and QC applied. o Maintenance performed on instruments. o Documentation of sample preservation, transport, and storage. o Review of QC sample data.
Data validation is performed, signed, and dated by the analyst, the unit supervisor (or designee), and where applicable, the laboratory manager. Reporting Data prepared for release to the Legal Reporting Unit are checked and approved by the unit supervisor (or designee) by the 5th of the following month for the previous month’s data. The final report is prepared by the Legal Reporting Unit of EMD. The report is again scanned for missing data and outliers. Regulatory limitation calculations will be applied to the data set and exceedances clearly listed. If stations are out-of-compliance, accelerated monitoring will be indicated. Any regulatory required summary reports of source identification findings or sanitary surveys will be included. The report is signed by the Division Manager before distribution and may include the following:
Sample ID used by the laboratory and the client (if available). Sample matrix type, description, and method number. The chemical/physical/biological parameters analyzed with the reported values
and units of measurement. Data for all parameters reported with consistent number of significant figures. Results of QC samples, if appropriate.

71
Footnotes referenced to specific data, if required, to explain reported values. If there are regulatory limits applicable to specific analyses, then limits are
clearly notated and exceedances listed. Discussion on non-compliance data Report transmittal letter or memorandum identifying the person sending the
report and the person(s) receiving the data.

72
THIS PAGE INTENTIONALLY LEFT BLANK
73
APPENDIX I
Quality Assurance/Quality Control (QA/QC) The quality assurance objectives for measurement of data are unique to the particular program for which the data are collected and utilized. They describe the overall uncertainty that the data user is willing to accept in order to make decisions for environmental or other concerns. This uncertainty describes the data quality that is needed, which are usually expressed in terms of precision, bias, representativeness, comparability, and completeness. The participating laboratories will use approved and recognized test methods, and comply with uncertainty requirements of the method. Quality control samples are measured and uncertainties are assessed and results must be within the range prescribed by the methods. Internal acceptance criteria are established by analyzing laboratory control samples on a daily basis. The participating laboratories will strive to meet the QA/QC goals described in this section and, therefore, be able to attest to the integrity of the sampling and analytical process. The following QA/QC procedures will be conducted for sample collection, laboratory analyses, and data management to ensure the production of reliable and defensible data for Ballona Creek, estuary and tributaries. Sample Collection Only trained laboratory staff will be assigned to collect samples using proper sampling procedures, appropriate sampling equipment, required containers, and proper preservation techniques. General guidelines for sample collection by laboratory staff are as follows:
Assure sterility check on sample bottles and avoid contamination. Label sample containers with sample date, sample time, sampling point, sample
type (grab/composite), preservatives added (if needed), the name of the sampler, and analyses needed.
Use aseptic technique when collecting samples to prevent contamination (e.g. the inner surfaces or lip edges of the bottle or cap are not to be touched).
Avoid collecting sample in multiple sweeps and no refilling of the sample bottle. Once the sample is collected, immerse at least one-third of the sample bottle in
ice. Do not exceed maximum allowable transport time (time of sample collection to
sample analysis) of 6 hours. Once received, log the samples into the laboratory system as soon as possible,
assigned a unique login number, and properly stored. Sample preparation steps done prior to analysis, such as sample preservation
are described in individual test SOP's.

74
Sample Handling Chain-of-Custody
The purpose of the chain-of-custody is to establish detailed written and legal documentation of all transactions in which samples are transferred from the custody of one individual to another. The custody procedure is also used whenever samples are submitted to a laboratory within the division or to a contract laboratory. The chain-of-custody begins at the sample collection site and includes couriers or messengers who handle the sample in transit. It follows the sample in the laboratory until its ultimate disposal. It is a form of proof used to establish the authenticity and integrity of the sample, since the results will be used to show compliance with the TMDL requirements, i.e., numeric targets and waste load allocations. A Chain-of-Custody (COC) must accompany each sample submitted to a participating laboratory. If a COC has not been filled out prior to delivery of the sample, a form will be provided to the delivery person prior to acceptance of said sample. The COC will be reviewed to make sure that all of the needed information has been supplied. As an example, the Chain-of-Custody Form being used at EMD is attached (Appendix E). Samples that are collected by EMD’s Microbiology Unit staff for bacteriological testing are delivered directly to the microbiology laboratory. A COC sheet is not required since technically there is no sample exchange, i.e., the sample collection staff and the analytical staff are one and the same. Sample Holding & Preservation
Samples must meet EPA holding time requirements for each testing parameter. The sample refrigeration and holding time of six hours until analyses are performed are crucial for microbiological testing. Microbiological samples must be handled and stored under contamination free environments. After the sample is received, the participating laboratory will enter the sample information into the Laboratory Information Management System (LIMS) or comparable database and a unique laboratory registration number will be generated for that sample. Sample Disposal After the analyses are completed, the sample will be retained as legal evidence or legally disposed of as determined by the microbiological analysis of the sample. Analyzed samples and standards used in analyses are disposed of in accordance with the laboratories written procedures, e.g., EMD's Chemical Hygiene Plan.

75
Analytical Procedures Analyses Analyses performed at EMD laboratories are generally driven by regulatory concerns and plant operations' requirements. There are many different analytical methods applicable to environmental analyses. EMD’s methods are generally based on those specified by EPA, Federal and State regulatory agencies, or professional organizations. As a guide, references for the microbiological procedures are listed below.
"Standard Methods for the Examination of Water and Wastewater", 18th – 20thedition, 1992, 1998 respectively, APHA, AWWA, WPCF, Washington, DC.
"Microbiological Methods for Monitoring the Environment, Water, and Wastes", EPA-
600/8-78-017.
Standard Operating Procedures (SOPs)
Routine analyses are defined in Standard Operating Procedures (SOPs), which are detailed
descriptions of how to use and what to expect from a method. They contain method-specific QC
criteria (i.e., instrument calibration, reagent blank, method blank, calibration standards, etc.), and
QC requirements such as duplicate analysis, spike recoveries, holding time, etc. EMD follows a
standardized SOP format, its content and application is presented in Appendix H of this document.
Microbiological Analyses
The following methods and target organisms are used in analysis of samples for Ballona Creek,estuary and tributaries:
o Membrane Filtration
Fecal coliform
o Chromogenic Substrate Total coliform E. coli Enterococcus
For the BCB TMDL Monitoring Program, all methods used will be EPA, Regional Board, or Standard Methods for the Examination of Water and Wastewater (APHA, 18th-20th 1992, 1998, respectively) approved methods

76
The following QA/QC checklist is applicable for the chromogenic substrate and membrane filtration methods. Chromogenic Substrate
- QC Checks on Idexx Reagent o Colilert-18 and Enterolert –sterility check performed with each use;
autofluorescence, positive and negative controls; performed on each new lot of reagent
o Monthly QC verification of at least 10 positive wells/target organism
- Quanti-trays: o Leak test performed on each new lot of trays
- DI Water
o Sterility check performed with each autoclaved batch o Heterotrophic plate count performed monthly o Amm-N, Org-N, and TOC performed monthly o Heavy metals, total and single, performed annually o Total chlorine performed with each new batch o Water suitability test performed with change of E-Pure system filters or
water source
- Equipment and Laboratory Environment: o Incubator temperatures checked twice daily (morning and late afternoon) o Refrigerator temperatures checked twice daily (morning and late
afternoon) o Thermometers calibrated semiannually o Autoclaves calibrated semiannually; preventative maintenance performed
quarterly o Air and Rodac testing for laboratory air and surface environments
performed monthly. o Balances calibrated semiannually; weight check with each use o PH meters- calibrated semiannually; standardized with each use o Quanti-tray sealers checked and cleaned weekly
- Personnel QA checks
o Reagent blanks o Sample duplicates (done on 10% of the samples per month) o Standard sample analysis and comparison count performed monthly
Membrane Filtration
- QC Checks on Media (mEndo, mFC, mE, EIA; phosphate buffered water):

77
o mEndo, mFC, mE, EIA: pH, sterility check, and positive and negative controls with each new batch
o Phosphate buffered water: pH and sterility check with each new batch o Monthly QC verification of at least 10 positive colonies/target organism
- Equipment and Laboratory Environment:
o Incubator temperatures checked twice daily (morning and late afternoon) o Refrigerator temperatures checked twice daily (morning and late
afternoon) o Thermometers calibrated semi-annually o Autoclaves calibrated semi-annually; preventative maintenance performed
quarterly o Air and Rodac testing for laboratory air and surface environments
performed monthly. o Balances calibrated semi-annually; weight check with each use o PH meters- calibrated semi-annually; standardized with each use o Residue on glass- performed annually for glassware and petri dishes o Water suitability test performed with change of E-Pure system filters or
water source
- Personnel QA checks (performed by all technical lab staff) o Reagents blanks o Sample duplicates (done on 10% of the samples per month) o Standard sample analysis and comparison count performed monthly for
MF analysis
System and Performance Audits An audit is a periodic check to ensure that the laboratory operates according to the policies and procedures described in the Quality Assurance Manual, complies with good laboratory practices, and meets the requirements of regulatory agencies. It may be either a system or performance audit. System Audit A system audit is a review of laboratory operations conducted to verify that the laboratory has the necessary facilities, equipment, staff, and procedures in place to generate acceptable data. It is an on-site inspection of the laboratory's system of operations. It may be an internal or external audit. Internal inspections may be performed by quality assurance personnel. External audits are generally laboratory certification-related activities. 1. Internal

78
Periodically, the QA Officer (or designee) audits the laboratories and reports the results to the Division Manager (or laboratory director), laboratory managers, and unit supervisors.
2. External State-certified laboratories are site visited every two years by auditors from
the Environmental Laboratory Accreditation Program (ELAP) of the California Department of Health Services (CA DOHS). Accreditation is by scientific discipline or field of testing. Non-compliances with good laboratory practices are identified and reported as deficiencies and are subject to corrective action before accreditation is renewed.
Performance Audit A performance audit is a review to evaluate the laboratory's analytical activities as
well as the data produced by analysts. It verifies the ability of the laboratory to correctly identify and quantify compounds in unknown samples submitted by the auditing entity. The purpose of these audits is to determine the laboratory's capability to generate scientifically sound data.
1. Internal Periodically, the QA staff submits unknown samples to most of the
laboratories. These samples are usually from the inventory of previous Performance Evaluation (PE) samples from EPA. Analysis of these samples is also a corrective action requirement for Discharge Monitoring Report (DMR) and/or Water Pollution (WP) samples evaluated with "unacceptable results". The QA staff may also conduct intra- and inter-comparison studies.
2. External All laboratory units, including the Microbiology laboratory, at EMD participate
in mandatory QA Performance Evaluation (PE) Study Programs. a. Mandatory PE Programs * Water Pollution QA Study Program (WP) serves a dual
purpose. It satisfies EPA's wastewater testing laboratory requirements and meets one of ELAP's laboratory certification criteria. Test samples are analyzed for parameters listed under each field of testing on our certifications and are specified in the WP Program following certified procedures. A laboratory can participate in a WP Study twice a year.

79
* For the Microbiology Performance Evaluation (PE) Study, Drinking Water/Wastewater Enumeration is required for ELAP certification. Like all the other PE programs, the samples are acquired from NIST-approved vendors and analyses are done for certified analytes.
b. Voluntary PE Program The Microbiology Unit also takes part in the inter-laboratory
calibration studies with EPA. These programs are performance based.
Assessment of Precision and Accuracy Data quality may be assessed in terms of precision, accuracy, representativeness, completeness, and comparability. The latter three are usually determined outside of the laboratory operations and with limited involvement of laboratory staff. These measures are not included in this section. The internal quality control measures (i.e., precision and accuracy) that are performed in the laboratory to evaluate data quality are described in this section. Precision Precision is the agreement among a set of replicate measurements without
knowledge of the true value. It is the degree to which a measurement is reproducible. Precision, expressed as Relative Percent Difference (RPD), is determined for each laboratory unit by analyzing replicates of the same sample, a number of duplicate pairs, or matrix-spiked duplicate samples.
Accuracy Accuracy is a measurement of how close the result is to the true value. Each
laboratory unit establishes its accuracy of measurement by analyzing QC check samples (spiked samples, standard reference materials from a reliable source, etc). The results of the QC samples are correlated to documented, certified values. Results of spiked samples are calculated as Percent Recovery. Actual Percent Recovery is compared to established reference data. The degree of closeness of the QC check sample contributes to the general assurance that the accuracy of the data is within acceptable limits.
Corrective Action Laboratory events and data that fall outside established quality acceptance criteria may require investigation or corrective action. The corrective action implemented depends on the type of analysis, the extent of the error, and whether the error can be determined and

80
corrected. The purpose of the corrective action is to resolve the problem and to restore the system to proper operation. Investigative steps and corrective actions implemented are documented.
Corrective Action Procedures 1. The initial corrective action procedures may be handled at the bench level.
The unit supervisor is immediately notified of the deviation. The analyst reviews the sample preparation for possible errors and checks the instrument calibration, calibration and spike solutions, instrument sensitivity, etc.
2. If the error cannot be resolved by the analyst, the unit supervisor has the
responsibility of resolving the problem with assistance, if needed, from the laboratory manager and/or the QA Officer.
3. The corrective action adopted may be determined by the analyst, the unit
supervisor, the laboratory manager, the QA Officer, or through a consensus. If needed, the final decision for corrective action rests with the laboratory manager after consultation with the QA Officer.
4. The unit supervisor shall maintain an accurate and up-to-date record of
corrective actions taken in the unit. A corrective action report form (included herein as an attachment) is available for use.
5. The laboratory manager shall periodically review corrective action records
and plan for system improvement by involving analysts, unit supervisors, and QA personnel.
General Guidelines for Initiating a Corrective Action
1. Identify/define the problem. 2. Assign responsibility for investigating the problem. 3. Investigate and determine the causes. 4. Develop corrective action to eliminate the problem. 5. Measure the effectiveness of the corrective action. 6. Analyst, unit supervisor, laboratory manager, and the QA Officer meet to review
and evaluate the process, if necessary. 7. Document the process by filling out the Corrective Action Report Form.

81
THIS PAGE INTENTIONALLY LEFT BLANK

82
APPENDIX J
Data Format and Archive
Data format. List of fields, type of data, whether it is required, and description of data format to be used for submission for archival.
Field Name Type Required Description
Agency Text Y A unique code used by the submitting agency (luAgency) Account Text Y Place-holder code to contain “TMDL”. Program Text Y Place-holder code to contain “BC TMDL”. StationID Text Y The station name from the list of stations provided in lookup list (luStations). AgencySampleID Text N The laboratory internal sample identifier SampleDate Date/Time Y The date the sample was analyzed (must be the same date as when the sample was taken) expressed as dd-mmm-yyyy SampleTime Number Y The time the sample was collected expressed as hh:mm SamplerID Text Y Name of person collecting sample AnalysisDate Date/Time Y The date the sample was analyzed (must be the same date as when the sample was taken) expressed as dd-mmm-yyyy AnalysisTime Number Y The time the testing was started expressed as hh:mm AnalystID Text Y Name of person analyzing sample ParameterCode Text Y What type of bacteria are being tested Qualifier Text N Qualifier for the result Result Number Y The numerical results of the test ResultUnits Text Y The units for the results TextValue Text Y Explanation for sample not analyzed, default None, luAnalyticalFailure Dilution Number Y The dilution factor associated with the result. LabRep Text Y The count of the lab replicate. AnalysisMethod Text Y The Method used to do the analysis Comments Text N Additional comments

83
luStations Station Name DESCRIPTION
luAnalyticalFailure None No analytical failure, default value AE Analyst error NA Station not accessible, no sample taken NS No sample NT Sample not tested
luAgencyCode Agency Code Agency Description CLA EMD City of Los Angeles, Environmental Monitoring Division DHS Department of Health Services LACSD Los Angeles County Sanitation Districts

84
THIS PAGE INTENTIONALLY LEFT BLANK

85
APPENDIX K

86

87

88

89

90

91

92

93
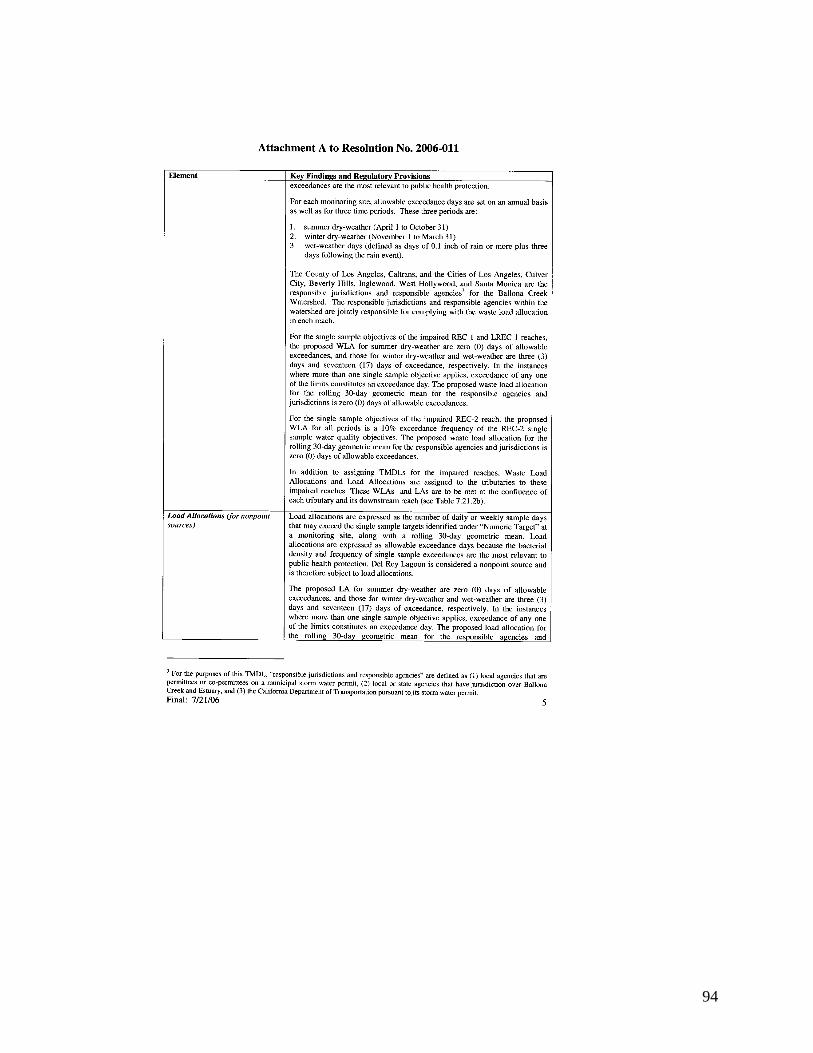
94

95

96

97

98

99

100

101

102

103
THIS PAGE INTENTIONALLY LEFT BLANK

104
APPENDIX L
Laboratory Safety The collection and analysis of environmental samples involves contact with samples that may contain agents that pose a microbiological hazard. The primary means of exposure to these microbiological hazards involve body contact during sample collection and hand-mouth or nose contact while handling the samples. Personal protective measures are mandatory while working in the field and laboratory. Following are some key steps to be followed by all laboratory analysts:
a. Assure that all persons wear appropriate eye protection when toxic materials (chemicals or biochemicals) are handled. Contact lenses should not be worn when working with chemicals.
b. Wear appropriate gloves when the potential for contact with toxic materials exists; inspect gloves before each use, wash them before removal, and replace them periodically.
c. Persons doing sampling must wear boots. The boots must be cleaned before entering the building. Boots cannot be worn in the lunchroom, under any circumstances. Steel-toed chemical resistant boots should be worn for the harshest environments, where there is also risk of injury to the foot and toes.
d. Use any other protective and emergency apparel and equipment as appropriate.
e. Remove laboratory coats immediately on significant contamination. In addition, persons who work in biological laboratories are often at risk of exposing themselves to a number of infectious agents, especially those known to be indigenous to wastewater. Most persons trained in biological and especially microbiological fields usually are aware of the risks involved, and even if precautions are taken, most of the work-related infections are due to certain practices conducted in the laboratory resulting in the generation of aerosols or through cutaneous pathways. The following guidelines are designed to prevent any exposure of personnel to infectious agents.
1. General chemical hygiene practices apply as well to the biological laboratories.
2. All work areas must be disinfected before and after all laboratory operations. 3. Hazardous areas and receptacles of contaminated items are to be marked
with a biohazard sign. 4. No eating or drinking in the laboratory. No food or drink is to be stored in
laboratory refrigerators, incubators or on bench tops. 5. Store personal effects outside the microbiology laboratory area to prevent
contamination. Manager and supervisors are responsible for enforcing this rule.
6. It is policy to wear a lab coat while working in the microbiology lab. Lab coats and street clothes should be stored separately. Lab coats are prohibited in the lunchroom.

105
7. Latex or plastic gloves are to be provided and used by employees. 8. Always wash your hands thoroughly after handling sewage, sludge, or
receiving water samples of any source before handling food or leaving the lab. “All” samples should be treated as potentially hazardous. Germicidal soap is to be available to all employees, and should be kept in stock.
9. Laboratory workers should not touch their hands to their face, especially the eyes, nose, and mouth when working with wastewater and sludge samples.
10. For workers who handle wastewater and its byproducts, it is recommended that they have been vaccinated for polio and tetanus. Persons in poor health and at risk of infection should inform their supervisor, and arrange for an improvement in their personal protection.
11. Handle all microorganisms as if they are pathogenic. The principle of sterile technique should be understood and applied during the handling of cultures and their related equipments.
12. Never pipette by mouth. Use bulbs or other mechanical means to draw up the liquid. Discard all used pipettes into a jar containing disinfectant solution for decontamination before washing them.
13. Avoid generation of aerosols during operations such as inoculation, pipetting, mixing, or centrifuging.
14. Equipment: a. Microscopes, colony counters, etc. are to be kept in the work area and
be dust free; they are to be cleaned after use. b. Water baths should be kept free of growth deposits. c. Autoclaves, hot air sterilizing ovens, and water distilling equipment and
centrifuges should be cleaned regularly to ensure safe operating. d. Employees are to be trained in autoclave operation and operating
instructions posted near each instrument. e. Performance checks of autoclaves and hot air sterilizers should be
conducted with the use of spore strips, spore ampoules, indicators, etc. 15. Safety cabinets of the appropriate type and class are to be supplied,
maintained, and used. 16. Personnel are to be trained in the proper procedures for handling lyophilized
(freeze-dried) cultures when used. 17. Employees should use the provided bottle carriers when moving reagents,
acids, and solvents through the building. 18. Laboratory personnel must follow labeling protocols in the laboratory to
prevent mix-ups of reagents, and when possible use the pre-labeled or permanently labeled bottles. Secondary containers are to be labeled as well.
19. In the event of a spill, all possible contaminated surfaces and tools are to be disinfected and the absorbent material placed in a biohazard bag for disposal.
20. All contaminated plates and Quanti-trays are to be autoclaved in biohazard bags at the end of the analysis and then disposed of in the labeled bags as regular trash.
21. Sterilize biological waste materials and contaminated equipment (cultures, glassware, etc.) before washing, storage, or disposal by autoclaving or decontaminating.

106
22. Eliminate flies and other insects to prevent contamination vectors of sterile equipment, media, samples, cultures, and infection of personnel (i.e., provide screens on windows and doors to outside if there is no air conditioning).

107
THIS PAGE INTENTIONALLY LEFT BLANK

108
APPENDIX M.
Participating Organizations and Contacts
Responsible Agencies
Contact Phone E-mail
Reza Iranpour (213) 485-0577 [email protected] City of Los Angeles Gerry McGowen (310) 648-5611 [email protected]
Angela George (626) 458-4341 [email protected] County of Los Angeles Nathan Stevenson (626) 458-4368 [email protected]
Beverly Hills Josette Descalzo (310) 285-2498 [email protected] Culver City Steven Finton (310) 253-6406 [email protected] Inglewood Salvador Ramirez (626) 396-9424 [email protected]
West Hollywood Jan Harmon (323) 848-6499 [email protected] Santa Monica Neal Shapiro (310) 458-8223 [email protected]
Caltrans Bob Wu (213) 897-8936 [email protected]
Other Participants
Contact Phone E-mail Regional Board Ginachi Amah (213) 576-6685 [email protected]
Heal the Bay Mark Gold (310) 453-0395 [email protected] SM Baykeeper Carlos Carreon (310) 305-9645 [email protected]