Bald eagle nest site selection and productivity related to habitat and human presence in Minnesota
172
BALD EAGLE NEST SITE SELECTION AND PRODUCTIVITY RELATED TO HABITAT AND HUMAN PRESENCE IN MINNESOTA A Dissertation Submitted to the Graduate Faculty of the North Dakota State University of Agriculture and Applied Science By Jeremy Eugene Guinn In Partial Fulfillment of the Requirements for the Degree of DOCTOR OF PHILOSOPHY Major Department: Biological Sciences May 2004 Fargo, North Dakota
Transcript of Bald eagle nest site selection and productivity related to habitat and human presence in Minnesota

BALD EAGLE NEST SITE SELECTION AND PRODUCTIVITY RELATED
TO HABITAT AND HUMAN PRESENCE IN MINNESOTA
A Dissertation Submitted to the Graduate Faculty
of the North Dakota State University
of Agriculture and Applied Science
By
Jeremy Eugene Guinn
In Partial Fulfillment of the Requirements for the Degree of
DOCTOR OF PHILOSOPHY
Major Department: Biological Sciences
May 2004
Fargo, North Dakota

ii
North Dakota State University
Graduate School
Title BALD EAGLE NEST SITE SELECTION AND PRODUCTIVITY RELATED TO
HABITAT AND HUMAN PRESENCE IN MINNESOTA.
By
JEREMY EUGENE GUINN
The Supervisory Committee certifies that this disquisition complies with North Dakota State University's regulations and meets the accepted standards for the
degree of
Degree Granted
SUPERVISORY COMMITTEE:
James W. Grier, Chair
Craig Stockwell
Malcolm Butler
Robert Arthur
Approved by Department Chair:
Date Signature

iii
ABSTRACT Guinn, Jeremy Eugene, Ph.D., Department of Biological Sciences, College of Science and Mathematics, North Dakota State University, May 2004. Bald Eagle Nest Site Selection and Productivity Related to Habitat and Human Presence in Minnesota. Major Professor: Dr. James W. Grier. Removal of the bald eagle from the federal Endangered and Threatened
Species List has been proposed but delayed, pending consideration of habitat
needs and the development of a population-monitoring plan. This project
evaluated the species' use of nesting habitat in Minnesota, where a large
population of bald eagles nests across several different ecoregions and near
varying levels of human activity. A total of 24 habitat and human-presence
variables were measured at a sample of 120 active nest sites and 166 random
sites. Measurements within 100 m of nests were taken on site while variables up
to 1,000 m were measured by analyzing remote-sensing data and aerial
photographs. Discriminant Analysis separated nest sites from random sites
primarily on the basis of tree diameter and distance from shoreline. Information-
theoretic Model Selection showed little relationship of productivity at each nest to
the characteristics of the site. Within the range of basic requirements (proximity to
water, substantial trees for nest support, and an adequate prey base), eagle
habitat was highly variable and not specialized. The rebound of bald eagle
populations did not occur with concurrent increases in habitat. Rather, it appears
that recent population trends were the result of demographic factors that were
probably not related directly to habitat or human presence. As long as the public
does not harass the birds or impact eagle reproduction and survival, nesting bald
eagles appear to coexist satisfactorily with humans in close proximity. The

iv
continued welfare of bald eagles depends most importantly on protection of the
birds themselves, via continuing education of the public and enforcement of
existing regulations. While bald eagle nesting habitat should not be ignored, there
is little evidence from this study that it is currently a major concern in the state of
Minnesota.

v
ACKNOWLEDGMENTS
Support for this project was received from the Minnesota Nongame Wildlife
Tax Check-off, the Reinvest in Minnesota Program, the State of Minnesota
General Fund, and the U. S. Fish and Wildlife Service (U.S. FWS) through the
Minnesota Department of Natural Resources, Division of Ecological Services (MN
DNR). Additional support was provided by the Department of Zoology at North
Dakota State University (NDSU) and the North Dakota BRIN Association located at
University of North Dakota (UND).
Primary gratitude goes to my advisor, James Grier, for his honesty, integrity,
and willingness to share ideas about research, teaching, and life in general. His
mentoring in raptor ecology and his knowledge of bald eagles were invaluable to
the success of this dissertation research. I thank Craig Stockwell (NDSU),
Malcolm Butler (NDSU), and Robert Arthur (NDSU) for serving on my research
committee and for their helpful suggestions and revisions of this dissertation.
I gratefully thank Gary Clambey (NDSU), Kyle Zimmer (NDSU and
University of Minnesota), and Paul Klatt (NDSU and UND) for assistance in
developing the sampling techniques used to evaluate the primary zone around
nest trees. I thank Craig Stockwell (NDSU), Malcolm Butler (NDSU), Robert Arthur
(NDSU), and Jeffrey Bell (NDSU and UND) for revisions of proposals and
manuscripts associated with this project. Wesley Newton (U.S. FWS, Northern
Prairie Wildlife Research Center – NPWRC), Mario Biondini (NDSU), Michael
Collyer (NDSU and Iowa State University), and James Church (NDSU) were
especially helpful in developing multivariate analyses. The use of complex and

vi
relatively recent statistical techniques was greatly assisted by consultation and
advising from Wesley Newton, Supervisory Statistician (NPWRC) and Mario
Biondini (NDSU).
I thank several agency personnel and private individuals statewide that, in
varying degrees, facilitated the fieldwork for this project. Special thanks to Leland
Grim (Voyageur’s National Park), Gary Hushely (Agassiz National Wildlife Refuge),
Jeanne Hall (Sherburne National Wildlife Refuge), Joan Galli (MN DNR), Brian
Tangen (NDSU and NPWRC), and Thomas Dunstan (Western Illinois University—
WIU), who were especially helpful in providing access to nest sites. Al Buchert
(MN DNR), James Grier (NDSU), Joan Galli (MN DNR), and Lisa Gelvin-Innvaer
(MN DNR) were involved in conducting aerial surveys of nests, which was
essential for this study. Rich Baker (Rich Baker) and Jodi Millar (U.S. FWS, Rock
Island) were instrumental in communications on proposal and manuscripts.
Helpful suggestions on and discussions about manuscripts and presentations
related to this dissertation were provided by Paul Klatt (NDSU and UND), Greg
Forcey (NDSU), Mandy Price (NDSU), Jessica Petersen (WIU), Anne Marguerite
Coyle (UND), John Shabb (UND), Thomas Dunstan (WIU), Lilian Anderson
(Ontario Ministry of Natural Resources), and Shawn Hawks (NDSU).

vii
TABLE OF CONTENTS ABSTRACT.............................................................................................................iii ACKNOWLEDGMENTS.......................................................................................... v LIST OF TABLES.................................................................................................... x LIST OF FIGURES..................................................................................................xi CHAPTER 1. INTRODUCTION............................................................................... 1 Project Objectives ........................................................................................... 6 CHAPTER 2. LITERATURE REVIEW..................................................................... 7 Nests............................................................................................................... 8 Nest Sites........................................................................................................ 9 Variation in Nesting Habitat........................................................................... 12 Historical Populations.................................................................................... 16 Sources of Mortality ...................................................................................... 16 Reasons for Decline...................................................................................... 21 Reasons for Recovery................................................................................... 24 Human Dimensions....................................................................................... 26 CHAPTER 3. MATERIALS AND METHODS ........................................................ 31 Study Area .................................................................................................... 31 Scale of Measurements ................................................................................ 31 Data Collection.............................................................................................. 32 Data Analysis ................................................................................................ 44 Appropriate Statistical Techniques................................................................ 49 CHAPTER 4. RESULTS ...................................................................................... 52

viii
Nest Site Descriptions................................................................................... 52 Nest Sites vs. Random Sites Comparison .................................................... 60 Discriminant Analysis .................................................................................... 69 Productivity Modeling .................................................................................... 75 Unusual Nesting Substrate ........................................................................... 79 Distance to Houses ....................................................................................... 86 CHAPTER 5. DISCUSSION, CONCLUSIONS, AND RECOMMENDATIONS..... 90 Transmission Tower Nesting Area ................................................................ 92 Recommendations ........................................................................................ 93 Generational Habituation .............................................................................. 95 Limitations of Study..................................................................................... 100 Future Research ......................................................................................... 101 REFERENCES CITED........................................................................................ 103 APPENDIX A. SCIENTIFIC NAMES FOR ALL SPECIES................................... 114 APPENDIX B. LAND-USE DATA INFORMATION.............................................. 115 APPENDIX C. DATA FORM FOR PRIMARY ZONE ANALYSIS ........................ 116 APPENDIX D. DATA FORM FOR SECONDARY ZONE EVALUATION............. 117 APPENDIX E. SAS PROGRAM CODE FOR VARIABLE EVALUATION AND PRODUCTIVITY MODELING ............................................................................. 118 APPENDIX F. MULTI-CORRELATION SCREENING OF VARIABLES FOR DISCRIMINANT ANALYSIS................................................................................ 120 APPENDIX G. MULTI-CORRELATION SCREENING OF VARIABLES FOR PRODUCTIVITY MODELING ............................................................................. 126 APPENDIX H. RANGE DISTRIBUTION SCREENING OF VARIABLES FOR DISCRIMINANT ANALYSIS................................................................................ 132

ix
APPENDIX I. RANGE DISTRIBUTION SCREENING OF VARIABLES FOR PRODUCTIVITY MODELING ............................................................................. 140 APPENDIX J. DISTRIBUTION AND CORRELATIONS OF EACH VARIABLE MEASURED FOR DISCRIMINANT ANALYSIS.................................................. 150 APPENDIX K. DISTRIBUTION AND CORRELATIONS OF EACH VARIABLE MEASURED FOR PRODUCTIVITY MODELING................................................ 155

x
LIST OF TABLES Table Page 1. Measurements at the primary zone........................................................... 33 2. Measurements at the secondary zone ...................................................... 42 3. Variables chosen for Discriminant Function Analysis................................ 46 4. Variables chosen for initial interaction assessment by Mallow's Cp……....47 5. Annual productivity ratings for bald eagle nests........................................ 49 6. Characteristics of bald eagle nests (n = 120) in Minnesota....................... 53 7. Bald eagle nest tree species within ecoregions ........................................ 54 8. Mean height and diameter of bald eagle nest trees and trees in the
surrounding stand within 1,000 m ............................................................. 58 9. Mean characteristics of bald eagle nest sites (n = 120) in Minnesota ....... 59 10. Characteristics of nest trees, random sites, and their associated stand
trees .......................................................................................................... 64 11. Acceptance or exclusion status of variables for Discriminant Analysis ..... 72 12. Reasons for accepting or rejecting measured variables for Model Selection Analysis ..................................................................................... 76 13. The Candidate Set of Models used for Information-theoretic Model
Selection ................................................................................................... 78 14. AIC-values for models describing effects of habitat features on productivity................................................................................................ 78 15. Transmission tower nesting area history................................................... 85 16. Productivity ranks in relation to distance to and number of houses .......... 87 17. Evaluation of variables for Discriminant Analysis.................................... 120 18. Evaluation of variables for Productivity Modeling.................................... 126

xi
LIST OF FIGURES
Figure Page 1. Comparative increases in populations of humans and bald eagles in
Minnesota between 1960 and 2000........................................................... 3 2. Geographic ecoregions found in Minnesota .............................................. 5 3. Scales for examining bald eagle nesting habitat and human presence ... 32 4. Sample bald eagle nests and random sites examined in Minnesota ....... 35 5. Water body buffer and 1 km2 cells grid system for selection of random
sites ......................................................................................................... 37 6. Sampling strategy for measurement of the primary zone ........................ 38 7. Strategy for measuring primary zone at sites with one band of trees
surrounding water. ................................................................................... 40 8. Strategy for measuring the primary zone at sites located within 10 m of
water........................................................................................................ 41 9. Mean bald eagle productivity ranks (+ standard error) within tree
categories ................................................................................................ 55 10. Mean bald eagle productivity ranks (+ standard error) within ecoregions ............................................................................................... 55 11. Mean bald eagle productivity ranks (+ standard error) within categories
within ecoregion....................................................................................... 56 12. Mean bald eagle nest tree diameter (+ standard error) within ecoregions ............................................................................................... 57 13. Mean bald eagle nest tree height (+ standard error) within ecoregions ... 57 14. Mean bald eagle nest height (+ standard error) within ecoregions .......... 58 15. Mean height of nest trees and associated stand trees (+ standard error)
within ecoregions ..................................................................................... 59 16. Tree height at nest sites and random sites (+ standard error) within
ecoregions ............................................................................................... 61

xii
17. Tree diameter at nest sites and random sites (+ standard error) within ecoregions ............................................................................................... 61
18. Distance to shoreline at nest sites and random sites (+ standard error)
within ecoregions ..................................................................................... 62 19. Density of land-use types at nest sites and random sites (+ standard error) within ecoregioins ....................................................... 62 20. Density of roads at nest sites and random sites (+ standard error) within ecoregions ..................................................................................... 63 21. Density of houses at nest sites and random sites (+ standard error) within ecoregions ..................................................................................... 63 22. Mean distance bald eagle nests were located from the nearest terrestrial edge (+ standard error)............................................................ 64 23. Mean height and diameter of bald eagle nest trees, trees within the
surrounding stand, and trees at random sites (+ standard error)............. 66 24. Mean distance bald eagle nest sites and random sites were located from the nearest house (+ standard error) ............................................... 66 25. Mean density of houses within 1,000 m of bald eagle nest sites and
random sites (+ standard error) ............................................................... 67 26. Mean density of roads within 1,000 m of bald eagle nest sites and random sites (+ standard error) ............................................................... 67 27. Mean distance bald eagle nest sites and random sites were located from the nearest urban area (+ standard error) ....................................... 68 28. Mean density of land-use types within 1,000 m of bald eagle nest sites and random sites (+ standard error) ................................................ 68 29. Mean distance bald eagle nest sites and random sites were located from the nearest body of water (+ standard error) ................................... 69 30. Mean distance bald eagle nest sites and random sites were located from the nearest terrestrial edge (+ standard error)................................. 70 31. Mean distance bald eagle nest sites and random sites were located from the nearest active bald eagle nest (+ standard error) ...................... 70

xiii
32. Canonical Plot showing the most important variables for discriminating nest sites and random sites (Exploration Set) ......................................... 73
33. Canonical Plot showing the most important variables for discriminating
between nest sites and random sites (Validation Set) ............................. 74 34. Canonical Plot showing the distance to water and tree diameter
discriminating between nest sites and random sites (Validation Set) ...... 75 35. Transmission tower structure used as nesting substrate by bald eagles in western Minnesota............................................................................... 80 36. Transmission tower nesting area used by bald eagles and ospreys in
western Minnesota................................................................................... 82 37. Transmission tower nest site used by bald eagles in western Minnesota during the 2003 breeding season........................................... 84 38. Distance eagle nests were located from the nearest house within
ecoregions ............................................................................................... 88 39. Canonical Plot with Distance to House variable inserted......................... 89

1
CHAPTER 1. INTRODUCTION
Bald eagle populations have risen sharply since the banning of DDT and the
administration of new laws limiting harassment of eagles and destruction of their
nest sites. Gains in nesting bald eagle populations over the last two decades led
to a proposed delisting of the bald eagle from the federal Endangered and
Threatened Species List (Fish & Wildlife Service 1999; Bednarz 2000). Bald
eagles are currently protected in the United States by the Bald and Golden Eagle
Protection Act, the Migratory Bird Treaty Act, the Lacey Act, and the Endangered
and Threatened Species Act. A substantial amount of protection for eagle habitat
would vanish under the current delisting proposal (Bednarz 2000; Barth 1999).
Concern about eagle habitat requirements expressed by both experts and
the general public resulted in delaying a change in the listing status of the bald
eagle. Some groups recommended that delisting not occur unless provisions for
habitat protection were first implemented (Bednarz 2000; Barth 1999). However,
bald eagle habitat has been difficult to define. In many areas, populations have
recently expanded their ranges into new habitat types.
Over the last decade, bald eagles have shown the ability to successfully
nest in many areas that were previously thought to be sub-optimal habitat (pers.
observations and corresp. with U. S. and Canadian eagle experts). For these
reasons, re-evaluation of bald eagle nesting habitat was deemed necessary to
determine the importance of habitat features within a context of varying levels of
human presence. This project examined habitat use, including degrees of isolation
from human activity, by breeding bald eagles in the state of Minnesota.

2
The primary factor influencing the survival of many wildlife species today is
habitat loss. Animals must have certain essential environmental features available
to them for sufficient food, water, and shelter for themselves and their offspring.
Identifying these essential habitat features allows for the design of more effective
management strategies. Several raptor species show varying degrees of
decreased reproductive success due to contact with human activities (Fyfe &
Olendorf 1976; Stalmaster 1987; Gerrard & Bortolotti 1988). These concerns need
to be more fully examined in order to create an accurate view of the habitat
requirements of nesting bald eagles and the factors limiting successful breeding.
The role of human activity near nest sites, once considered to be the
primary threat to nesting and foraging eagles (Mathisen 1968; Evans 1982; Green
1985; Herkert 1992), should be re-examined. The number of eagles successfully
nesting near human activity appears to be increasing. Bald eagle populations in
Minnesota have increased in the face of increasing human populations since 1970
(Fig. 1). Observing a pair of eagles nesting near human activity has become a
relatively common occurrence rather than an exceptional case.
Many questions can be considered concerning current eagle populations.
How tolerant are eagles of humans intruding into their territory? What level of
disturbance does a hiker walking along a trail cause, compared to the activities
that occur in an agricultural field? Are eagles able to successfully breed within
close proximity to human activity? Are buffer zones, which were designed to
protect eagle nests from potential human intrusions, really necessary? What
activities should be prohibited or controlled within these zones? Do eagles only

3
Figure 1. Comparative increases in populations of humans and bald eagles in Minnesota between 1960 and 2000. nest in certain types of trees within certain types of forests? Is proximity to a
sizable body of water a necessary requirement?
It is essential that managers have accurate data concerning these issues in
order to design management strategies that will provide sufficient habitat,
seclusion, and protection for eagles in the future. Many investigators have
proposed the use of site-specific management for every nest (Mathisen et al. 1977;
Fraser et al. 1985; Grubb & King 1991). However, as the number of eagle nesting
sites continues to rise, this becomes financially and logistically unfeasible. Nests
on private land are particularly difficult to manage. Future management plans for
3500000
4000000
4500000
5000000
5500000
Hum
an P
opul
atio
n
0
150
300
450
600
750
Eagle B
reeding Pairs
1960 1967 1974 1981 1988 1995 2002Year
Human Population Source: U.S. Census Bureau Bald Eagle Breeding Pairs X Source: U.S. Fish and Wildlife Service

4
large populations must consider regional differences in habitats and land-use
patterns (Wood et al. 1989).
The state of Minnesota contains one of the largest breeding populations of
bald eagles in the contiguous United States. During the year 2000, the Minnesota
Department of Natural Resources, Nongame Wildlife Program (MN DNR)
sponsored the Millennium Bald Eagle Survey (M.B.E. Survey), an initiative to gain
information on the locations and activity of all known eagle nests in the state
(Baker et al. 2000). The survey’s goal was to locate, map, and gather nesting
information on every eagle nest across the state. The information gathered during
the M.B.E. Survey facilitated examination of nesting habitat. A major subset of all
known active nests located during the M.B.E. Survey was examined for this
project. The original set of sample nests represented a very large sample size (n =
180) and were spread across a broad spectrum of habitat types and human
presence throughout the state of Minnesota. A large sample size provided the
ability to obtain good estimates of variability and range, permitted the statistical
separation of the role(s) of various factors involved, and allowed for comparisons
of the factors relative to the productivity of each nest.
Eagle nests across the entire state of Minnesota were examined. The state
has been subdivided according to ecological habitat types into four major
ecoregions (Henderson et al. 1997) (Fig. 2). The largest ecoregion, the Laurentian
Mixed Forest, includes the central and northeast portions of the state. This area
consists mainly of large aspen/conifer forests, numerous large lakes, and
peatlands. Most of the Southern and Eastern portions of the state are considered

5
Figure 2. Geographic ecoregions found in Minnesota.
Eastern Broadleaf Forest (also known as the hardwood forest transition zone),
which is composed of deciduous forests. The Western portion is considered
Prairie Parkland. This area is the typical shortgrass prairie found in the Mid-
western states, which consists of large expanses of grassland interspersed with
small pothole wetlands. The smallest ecoregion, the Tallgrass Aspen, is found in
the Northwest portion of the state. It is characterized by open terrain with many
Eastern Broadleaf Forest Prairie Parkland
Tallgrass Aspen
Laurentian Mixed Forest

6
marshy areas and scattered aspen wood lots. Regional habitats were evaluated
and assigned to an ecoregion by the Minnesota DNR (Henderson et al. 1997).
Project Objectives
The objectives of this project were designed to evaluate habitat features
and human presence features near bald eagle nests. Initial objectives were to
(1) obtain 2001 productivity, habitat, and (potential) disturbance data for a sample
of bald eagle nests and random sites in Minnesota; and (2) analyze the
relationship between bald eagle productivity and habitat and human disturbance
variables.
Each objective was subdivided into several tasks: objective 1: (a) conduct
survey flights at a subset of the eagle nests identified in 2000; (b) obtain remote
sensing measurements for each sample nest and for other, random sites;
(c) obtain on-site habitat measurements for each sample nest and random site;
objective 2: (a) conduct GIS-based spatial analyses of data and (b) employ
Information-theoretic Model Selection analysis to investigate the relationship
between productivity and habitat and potential disturbance features. Additional
objectives included using Discriminant Analysis to compare nest and random sites
and disseminating these findings through a dissertation, professional journal
articles, and presentations at national professional conferences.
7
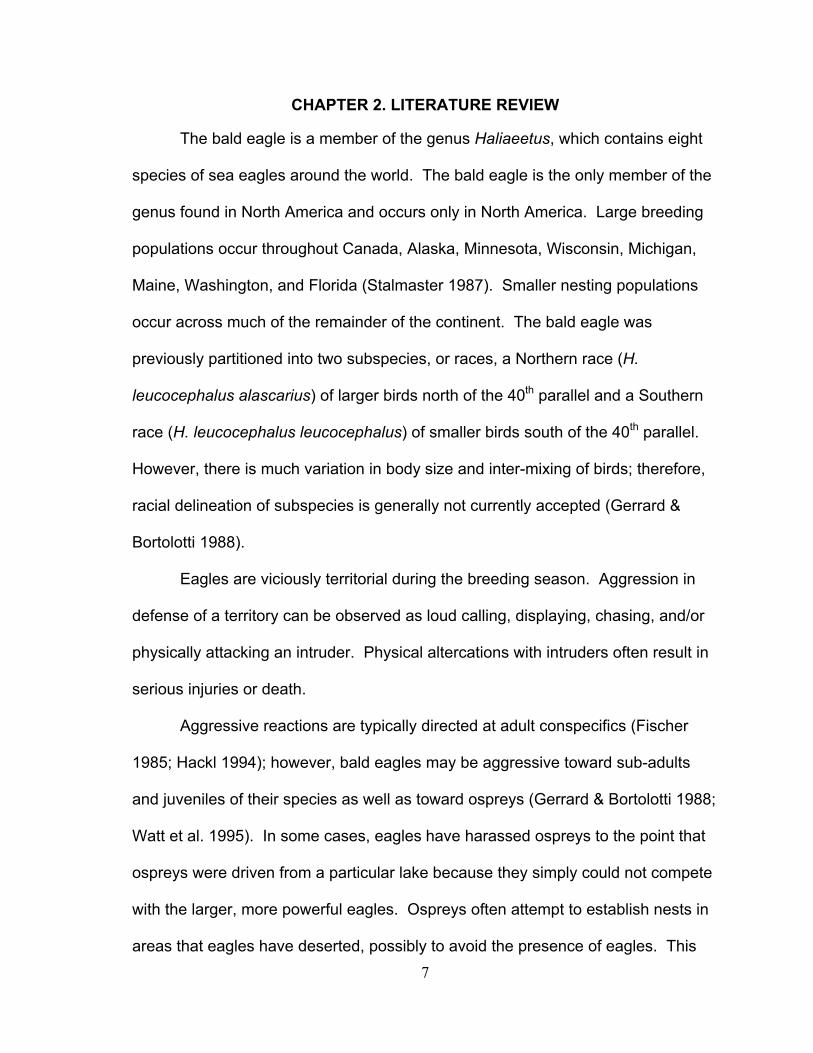
CHAPTER 2. LITERATURE REVIEW The bald eagle is a member of the genus Haliaeetus, which contains eight
species of sea eagles around the world. The bald eagle is the only member of the
genus found in North America and occurs only in North America. Large breeding
populations occur throughout Canada, Alaska, Minnesota, Wisconsin, Michigan,
Maine, Washington, and Florida (Stalmaster 1987). Smaller nesting populations
occur across much of the remainder of the continent. The bald eagle was
previously partitioned into two subspecies, or races, a Northern race (H.
leucocephalus alascarius) of larger birds north of the 40th parallel and a Southern
race (H. leucocephalus leucocephalus) of smaller birds south of the 40th parallel.
However, there is much variation in body size and inter-mixing of birds; therefore,
racial delineation of subspecies is generally not currently accepted (Gerrard &
Bortolotti 1988).
Eagles are viciously territorial during the breeding season. Aggression in
defense of a territory can be observed as loud calling, displaying, chasing, and/or
physically attacking an intruder. Physical altercations with intruders often result in
serious injuries or death.
Aggressive reactions are typically directed at adult conspecifics (Fischer
1985; Hackl 1994); however, bald eagles may be aggressive toward sub-adults
and juveniles of their species as well as toward ospreys (Gerrard & Bortolotti 1988;
Watt et al. 1995). In some cases, eagles have harassed ospreys to the point that
ospreys were driven from a particular lake because they simply could not compete
with the larger, more powerful eagles. Ospreys often attempt to establish nests in
areas that eagles have deserted, possibly to avoid the presence of eagles. This

8
situation occurs in regions that have been abandoned by eagles supposedly
because of human disturbances (Stalmaster 1987; Gerrard & Bortolotti 1988). If
eagle populations continue to spread into areas of high human activity, the future
success of ospreys in regions where they coexist with eagles could be
jeopardized.
Nests
Bald eagles build one of the largest, most conspicuous nests of any North
American bird (Stalmaster 1987). The largest nest on record was 9 ft in diameter,
18 ft deep, and weighed over 2 tons (Broley 1947). Average nests are typically 1-2
m in diameter and 1 m in depth (Stalmaster 1987), although much variation exists.
Nests are built with branches and sticks that interlock to form a large, sturdy
platform structure (Stalmaster 1987; Gerrard & Bortolotti 1988). The supporting
structure partially determines the shape of the nest (Stalmaster 1987). The
platform of the nest is lined with grasses, moss, and other soft vegetation to form a
complete mat on which to lay the eggs (Gerrard & Bortolotti 1988).
Nests are typically used for several successive years, with as much as 1 to
2 ft of new nest material being added each year (Broley 1947). The longevity of an
eagle nest varies tremendously. Extremely sturdy nests may last up to 30-40
years, although most do not survive that long (Stalmaster 1987). Nest trees are
especially vulnerable to wind, lightning, and disease, as well as being weakened
from supporting the large and heavy nest structure. Grier (unpubl. data) suggests
that some areas of Northern Ontario annually lose more than 10% of nests
because of weather and tree condition issues.

9
Nest Sites
Foraging habitat is one of the primary determinants of raptor breeding site
distributions (Newton 1979). Eagles choose nest areas with a constantly available
food resource (Hansen 1987; Canton et al. 1992), tending to place their nests near
a sizable body of water with fish as the primary food source (Stalmaster 1987;
Anthony & Isaacs 1989; Hackl 1994). An available food source near nesting sites
is essential to provide sufficient food for their young (Todd et al. 1982; Hansen
1987; Anthony & Isaacs 1989; Livingston et al. 1990; Canton et al. 1992; Hackl
1994). Nesting rarely occurs more than 3 km from water and is usually much
closer (Gerrard & Bortolotti 1988).
Several studies have investigated nest site selection in various areas across
the bald eagle’s range (Murphy 1965; Mathisen 1968; Whitfield et al. 1974;
McEwan & Hirth 1979; Andrew & Mosher 1982; Fraser et al. 1985; Anthony &
Isaacs 1989; Livingston et al. 1990; Dzus & Gerrard 1993; Cornutt & Robertson
1994; Wood 1999). Comparisons of the results of these studies, however, have
shown a high amount of variation in habitat use. Some researchers suggest that
suitable nesting trees and a degree of seclusion from human disturbance may
influence nest locations (Stalmaster 1987; Livingston et al. 1990). Currently, there
are no methods sufficient for evaluating eagle nests over their entire range to
facilitate recommendations for management.
Determining patterns of nest site selection by bald eagles and the effects of
potential human disturbances has long been problematic for managers and
researchers. According to Martin & Roper (1988), habitat characteristics likely

10
effect nest placement by avian species at two different levels. The first level is the
area immediately surrounding the nest. The second level involves a larger area
surrounding the nest. Several researchers have examined nest site habitat and
human disturbances for bald eagles (Mathisen 1968; McEwan & Hirth 1979;
Andrew & Mosher 1982; Fraser et al. 1985; Anthony & Isaacs 1989; Livingston et
al. 1990; Dzus & Gerrard 1993; Wood 1999). The majority of these researchers,
both within and among their various studies, suggest that eagles exhibit wide
variation in nest site selection.
Large variation in nesting habitat and the effects of potential human
disturbances may be the result of several project-design factors including sample
size and habitat heterogeneity within and among different study areas. Some
studies looked at a limited number of nests (Mathisen 1968; McEwan & Hirth 1979;
Andrew & Mosher 1982; Dzus & Gerrard 1993; Fraser et al. 1985; Wood 1999)
and usually only in a small area of land or in one continuous habitat (Mathisen
1968; Whitfield et al. 1974; McEwan & Hirth 1979; Andrew & Mosher 1982; Fraser
et al. 1985; Anthony & Isaacs 1989; Dzus & Gerrard 1993; Wood 1999). High
variability observed when comparing studies of nesting habitat may be the result of
examining nests in completely different habitat types. It is logical to believe that a
nest site in a deciduous forest will appear much different from one in a coniferous
forest. Therefore, identifying nest site selection in one particular small area does
little for managers working outside that specific area or habitat type. For example,
Cornutt and Robertson (1994) reported bald eagles nesting in mangroves of
Florida Bay. Their results are quite relevant for that specific habitat. However,
11
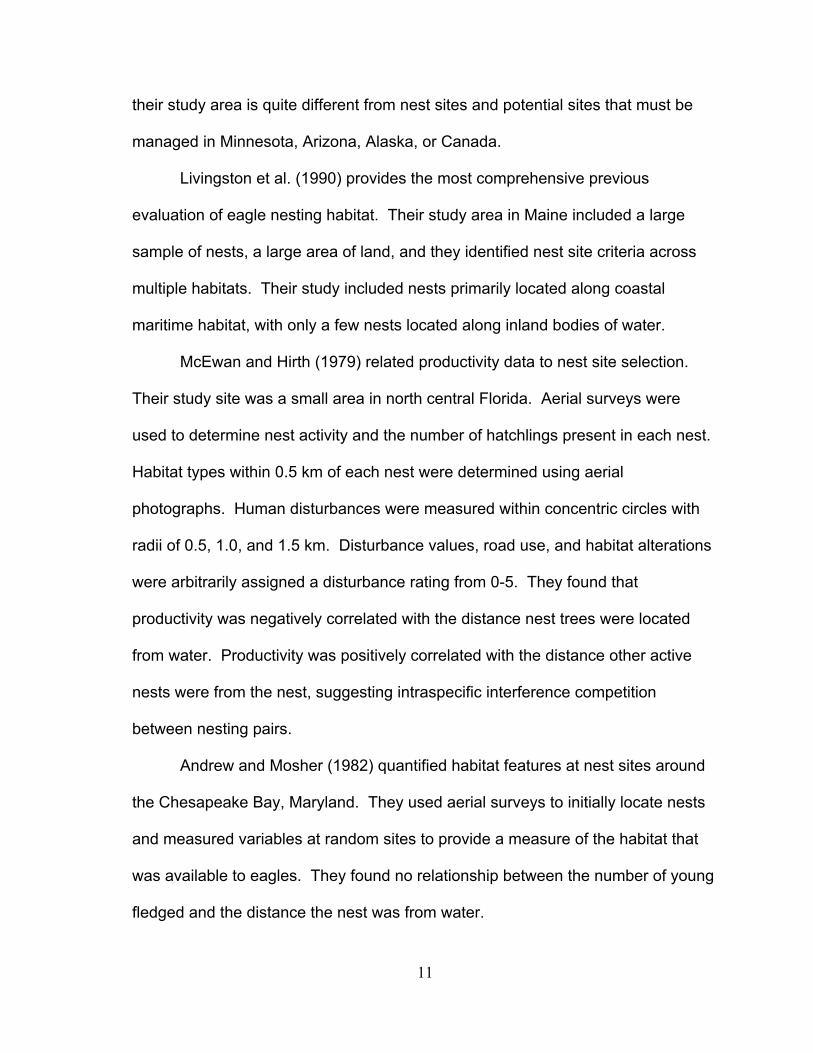
their study area is quite different from nest sites and potential sites that must be
managed in Minnesota, Arizona, Alaska, or Canada.
Livingston et al. (1990) provides the most comprehensive previous
evaluation of eagle nesting habitat. Their study area in Maine included a large
sample of nests, a large area of land, and they identified nest site criteria across
multiple habitats. Their study included nests primarily located along coastal
maritime habitat, with only a few nests located along inland bodies of water.
McEwan and Hirth (1979) related productivity data to nest site selection.
Their study site was a small area in north central Florida. Aerial surveys were
used to determine nest activity and the number of hatchlings present in each nest.
Habitat types within 0.5 km of each nest were determined using aerial
photographs. Human disturbances were measured within concentric circles with
radii of 0.5, 1.0, and 1.5 km. Disturbance values, road use, and habitat alterations
were arbitrarily assigned a disturbance rating from 0-5. They found that
productivity was negatively correlated with the distance nest trees were located
from water. Productivity was positively correlated with the distance other active
nests were from the nest, suggesting intraspecific interference competition
between nesting pairs.
Andrew and Mosher (1982) quantified habitat features at nest sites around
the Chesapeake Bay, Maryland. They used aerial surveys to initially locate nests
and measured variables at random sites to provide a measure of the habitat that
was available to eagles. They found no relationship between the number of young
fledged and the distance the nest was from water.
12
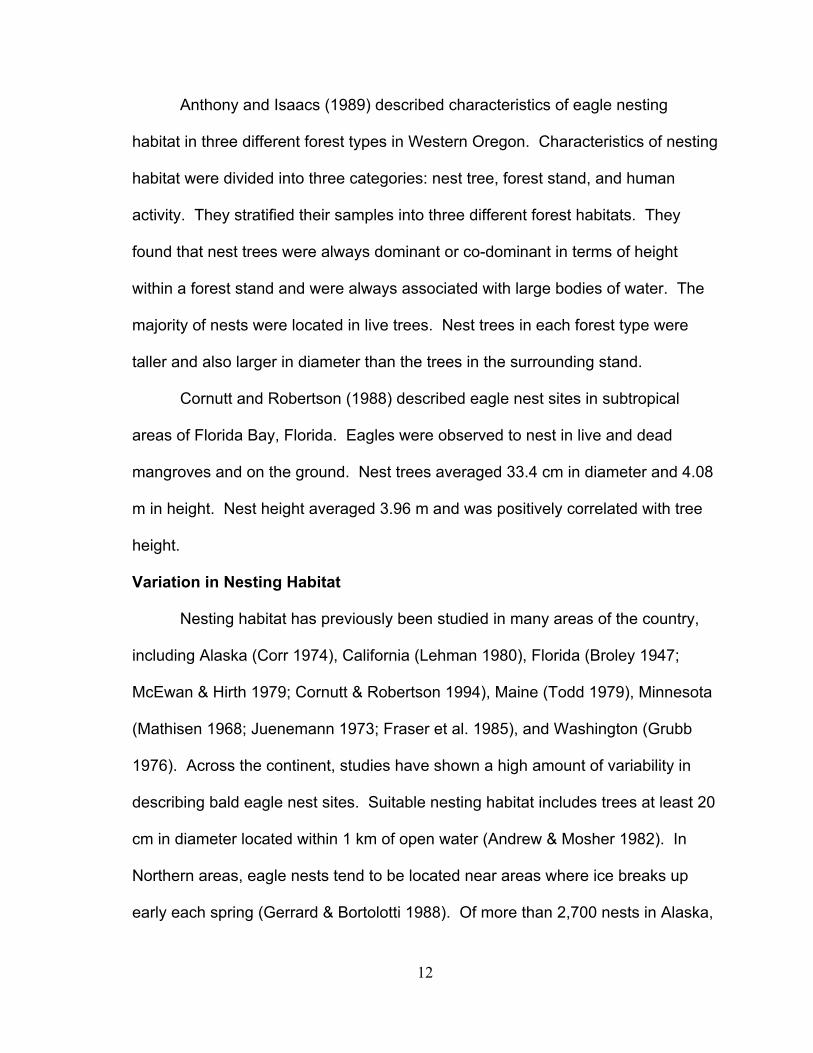
Anthony and Isaacs (1989) described characteristics of eagle nesting
habitat in three different forest types in Western Oregon. Characteristics of nesting
habitat were divided into three categories: nest tree, forest stand, and human
activity. They stratified their samples into three different forest habitats. They
found that nest trees were always dominant or co-dominant in terms of height
within a forest stand and were always associated with large bodies of water. The
majority of nests were located in live trees. Nest trees in each forest type were
taller and also larger in diameter than the trees in the surrounding stand.
Cornutt and Robertson (1988) described eagle nest sites in subtropical
areas of Florida Bay, Florida. Eagles were observed to nest in live and dead
mangroves and on the ground. Nest trees averaged 33.4 cm in diameter and 4.08
m in height. Nest height averaged 3.96 m and was positively correlated with tree
height.
Variation in Nesting Habitat
Nesting habitat has previously been studied in many areas of the country,
including Alaska (Corr 1974), California (Lehman 1980), Florida (Broley 1947;
McEwan & Hirth 1979; Cornutt & Robertson 1994), Maine (Todd 1979), Minnesota
(Mathisen 1968; Juenemann 1973; Fraser et al. 1985), and Washington (Grubb
1976). Across the continent, studies have shown a high amount of variability in
describing bald eagle nest sites. Suitable nesting habitat includes trees at least 20
cm in diameter located within 1 km of open water (Andrew & Mosher 1982). In
Northern areas, eagle nests tend to be located near areas where ice breaks up
early each spring (Gerrard & Bortolotti 1988). Of more than 2,700 nests in Alaska,

13
99% were within 200 m of water with an average of less than 40 m (Robards &
Hodges 1977). In Minnesota, half of 43 nests were within 500 m and the average
was approximately 600 m away from water, possibly due to lack of suitable trees
along the shoreline (Fraser 1981). In areas of Saskatchewan and Manitoba, 90%
of nests were within 183 m of a lake or river (Whitfield et al. 1974; Henny et al.
1974). Thelander (1973) found that 75% of nests were within ¼ mile of the
shoreline. Hehnke (1973) reported that all nests found on the Alaskan Peninsula
were within 50 yards (units as originally published) of shore. McEwan (1977)
found that 66% of 61 nests were within 1 km of water. Todd (1979) found that
67% of nests were within 100 m and 81% were within 250 m. Corr (1974) found
that 99% of nests were located within 200 m. Gerrard et al. (1975) found that
eagles nested within 220 yards of shore. Mathisen (1963) found that only 8% of
48 nests were located further than 1 mile from shore. The variation across studies
could be due to variation in techniques used to locate nests (Fraser 1981). A more
extensive review of nests in relation to water can be found in Fraser (1981).
Eagles typically place their nests high in one of the largest trees in a forest
stand (Stalmaster 1987). A term popularly used to describe the nest tree of a bald
eagle in some areas is “super canopy.” Super canopy trees are those that are
substantially taller than the other trees in the surrounding forest stand, rising above
the general canopy. In some areas, super canopy trees are preferentially chosen
as nest trees by bald eagles (Fraser 1981; Stalmaster 1987; Retfalvi 1965).
Eagles tend to pick tall and especially sturdy trees (Gerrard et al. 1975). Super
canopy trees may provide good vantagepoints for watching prey and intruding

14
eagles or ospreys (Johnson 1981; Stalmaster 1987; Gerrard & Bortolotti 1988). In
Virginia, nest trees averaged 29 m in height while the surrounding trees averaged
just 24 m (Stalmaster 1987). Mean nest tree height varies according to the
species of tree in which the nest is placed (Retfalvi 1965; Hensel & Troyer 1964).
In Chippewa National Forest, Minnesota, nests were higher than the surrounding
trees or the nest tree was situated at a habitat edge (Fraser 1981).
Hackl (1994) states that nest trees are an overall average of 25 m tall.
Because large eagles have trouble maneuvering in dense forests, tall nest trees
allow for unobstructed landing flights to the nest and provide a location to display
to intruders (Stalmaster 1987). Selecting a tall, sturdy structure increases the
support for a large nest, provides an open flight path to and from the nest, and
allows for a panoramic view of the surrounding terrain for defense and display
purposes (Stalmaster 1987). Nests are usually placed a few meters below the top
of the tree, rather than at the very top (Lehman 1979; Andrew & Mosher 1982;
Stalmaster 1987; Gerrard & Bortolotti 1988). Nest trees, regardless of species, are
usually stout for their height (Fraser 1981; Anthony et al. 1982; Andrew & Mosher
1982) and have large crowns (Gerrard & Bortolotti 1988). Nest trees in 14 areas
around the country ranged from mean values of 20-60 m in height and 50-190 cm
in diameter (Stalmaster 1987).
The tree species appears to vary according to the available trees in the
stand and selection is likely to be an opportunistic choice (Palmer 1988). Further
investigation on this matter is needed (Gerrard & Bortolotti 1988; Hackl 1994).
Many studies have reported a strong preference for pine trees. Cornutt and

15
Robertson (1994) reported that in Florida until 1994, “nearly all nest trees
described had been conifers.” Wood et al. (1989) reported that 112 of 116 nests in
Florida were located in pine trees. McEwan and Hirth (1979) reported that all of
the 18 nest trees measured were in pines. Of 140 nests observed, Broley (1947)
found 134 nests in pines. Mathisen (1963) reported that 79% of 48 nests were in
red and white pines. Nesbitt et al. (1975) reported a similar preference for pine
trees. However, this may not be the situation in many other parts of the country.
It is common to find one or more additional alternate, or supernumerary,
nests within a few hundred meters of each other inside of a single breeding
territory (Broley 1947; Hensel & Troyer 1964; McGahan 1968). Only one of the
nests is used for producing eggs and young each year, but different ones may be
used during different years. There are several potential reasons for a pair to build
supernumerary nests. This act may fulfill an urge to build a nest before laying
eggs or serve as insurance in case of the destruction of the primary nest (Newton
1979). The pair may avoid long-lived ectoparasites by alternating nests (Newton
1979). Supernumerary nests may serve as additional advertisement of the
occupancy status of a breeding territory (Newton 1979). Regardless of the reason,
supernumerary nests within the same breeding territory seem to be a common
phenomenon in many areas across the continent. In areas of high nesting density,
determining single breeding territories for monitoring research and management
purposes is often difficult because of the presence of supernumerary nests.

16
Historical Populations
When European settlers first arrived in North America, there may have been
between 250,000 and 500,000 bald eagles on the continent, occurring in areas
covered by at least 45 current states (Fyfe & Olendorf 1976; Gerrard & Bortolotti
1988). As of 1972, occupied nests had been eliminated in at least 14 of those
states (Fyfe & Olendorf 1976). Ninety percent of occupied nests were found in just
10 states (Fyfe & Olendorf 1976). Howell (1965) indicated a 75% loss in occupied
sites between the 1930s and 1962.
In 1985, estimates placed the bald eagle population in North America at
between 70,000 and 80,000 eagles (Stalmaster 1987). About 13,000 eagles
wintered in the lower 48 states in the 1980s, and there were around 1,400
breeding pairs (Stalmaster 1987). For reasons discussed below, the number of
known breeding pairs reported in the lower 48 states increased steadily from 417
in 1963; to 1,188 in 1981; 2,475 in 1988; 3,014 in 1990 (Kjos 1992); 4,016 in 1993
(Fish & Wildlife Service 1994); 4,452 in 1994 (Fish & Wildlife Service 1995); and
5,748 by 1998 (Baker et al. 2000). The population is currently thought to be well
over 7,000 nesting pairs (Baker et al. 2000).
Sources of Mortality
After fledging, bald eagles have no natural predators, although many
species may feed on dead or injured eagles, and many eagles are casualties of
intraspecific aggression. Winter is thought to be a high period of highest natural
mortality due to decreased availability of prey and increased energy needs during
periods of extreme cold and migration. During the winter months, starvation may

17
be a major natural cause of death. Eagles are also vulnerable to a variety of other
natural events. Eagles are occasionally struck by lightning while on the nest
(Howell 1941; Broley 1947; Broley 1952). Territorial fights with other eagles during
the breeding season can be injurious and may either directly or indirectly cause
death (Prouty et al. 1977). Injuries caused by fights are increasing as population
densities in many areas continue to increase (pers. comm. Leland Grim).
A variety of animals may prey on eagle eggs and young. Raccoons are
often suspected of preying on eggs and/or young hatchlings (Nash et al. 1980;
Fyfe & Olendorf 1976). In fact, eagle nesting success dramatically increased after
a disease decimated the raccoon population on the San Juan Islands, WA (Nash
et al. 1980). Other nest invaders and potential predators include bobcats,
magpies, crows, gulls (Hensel & Troyer 1964; Fyfe & Olendorf 1976), and
wolverines (Doyle 1995). Even black bears have been observed sitting in eagle
nests, although there was speculation over whether the bear had actually attacked
the young (McKelvey & Smith 1979; McEwan & Hirth 1979). Adult eagles will
usually flee the nest when a large predator approaches. Older, pre-fledging young
may jump from the nest and glide to an ungraceful landing near the base of the
tree, after which the adults typically feed the young on the ground until they are
able to fly (pers. comm. J. Grier).
Humans have either directly or indirectly caused high rates of mortality for
bald eagles, as with many wildlife species. Until 1975, as many as 500 or more
eagles died annually because of various types of interactions with humans (Braun
et al. 1975). Of 200 eagles admitted to one rehabilitation center in the U.S., 76%

18
had traumatic injuries caused by gunshots, traps, collisions, electrocution, or other
human-related accidents (Redig et al. 1983). Impacts with cars, airplanes, towers,
trains (Stone et al. 2001) and power lines are frequent occurrences (Stalmaster
1987). Eagles may also become entangled in traps and eat poisoned carrion that
has been set as bait for other predators, such as wolves or coyotes. Eagles have
been observed in flight dangling a leg-hold trap from one leg after binding to the
bait animal (Gerrard & Bortolotti 1988; Durham 1981). Trapping injuries and
fatalities, however, have now been largely eliminated by changes in trapping
regulations that prohibit open-view baiting.
Chemical pollutants have had a tremendous impact on raptor populations.
Contaminants such as insecticides, herbicides, and industrial wastes are major
concerns due to the fact that eagles are directly exposed to both air and water
pollution. Biomaginificiaton and bioaccumulation of many chemical substances as
they move through the food chain have been detrimental to eagle populations.
Eagles are vulnerable to lead poisoning because they often rely heavily on
wounded birds or avian carrion for food (Mulhern et al. 1970, Pattee & Hennes
1983, Hennes 1985). Lead shot from waterfowl hunters was found in 43% of all
living adult Canada Geese in Swan Lake National Wildlife Refuge, Missouri (Griffin
et al. 1980). Lead accumulation in bald eagles has been found at concentrations
high enough to cause mortality (Kaiser et al. 1980, Reichel et al. 1984).
Other mortality factors are best classified as accidental. Some eagle chicks
have been impaled on fishing hooks that were brought by the adults to the nest still
attached to fish (Stalmaster 1987) and eagles of all ages have become entangled

19
in monofilament fishing line, causing a variety of disabilities. Each year many
eagles are injured and killed by collisions with automobiles. Of particular danger to
eagles are road-cuts in hillsides with steep banks where eagles are attracted by
road kills, but do not have the space needed to escape an oncoming vehicle (pers.
comm. Lilian Anderson). Eagles have been injured and electrocuted by being
struck by lightning while incubating eggs or otherwise on the nest (Howell 1941).
Historically, one of the biggest sources of eagle mortality has been by
gunshot wounds. Until the last few decades, many farmers did not hesitate to
shoot raptors on sight because they assumed they were foraging on livestock. Of
198 eagles treated at the Minnesota Raptor Center from 1972-1980, 54 were
admitted due to gunshot wounds (P. Redig, pers. comm.). Many more are found
injured beyond the point of rehabilitation. In 1984, Reichel et al. (1984) reported
that shooting was the cause of as many as 20% of the total eagle deaths across
the nation. Another study showed the number to be as high as 60% (Fraser et al.
1985). Stalmaster (1987) reported that 43% of 374 eagles died due to gunshot
wounds from 1960 to 1977. Shooting of eagles appears to vary greatly from year
to year and across different regions of the country. An outbreak of shootings in a
particular area for a short period of time appears to be the trend. In such an
instance, the person(s) responsible are either brought to justice or the act loses its
thrill. In some areas, over 50% of all fledgling eagles have been shot (Retfalvi
1965). Juvenile eagles, which have mottled plumage, are often mistaken for
hawks or other raptors and are thus killed (even though all birds of prey are
currently protected).

20
Included in the above records are several isolated, but organized hunting
campaigns. Some private groups hunted down eagles by the hundreds. One of
these groups included several ranchers that mistakenly blamed eagles for killing a
large portion of their livestock. In the 1930s, sheep ranchers in California shot
several hundred golden eagles each year (Stalmaster, 1987). In the 1970s, eagles
were even hunted from helicopters and airplanes. O’Gara (1982) determined that
eagles often fed on the carcasses of livestock animals, but were not predatory on
living livestock.
Another group causing eagle mortalities involves persons who sell eagle
parts for profit on the black market. Native Americans can legally possess and use
eagle feathers and other body parts in rituals and as dance ornamentation.
However, they must obtain eagle parts from governmental suppliers. In 1982, 300
birds were killed by a group of professional eagle harvesters who then sold their
bounty to Native American groups (Seattle-Post Intelligencer 1983). In the early
1980s, over 50 people were indicted for killing 200-300 eagles in South Dakota to
supply “authentic” Indian artifacts to tourists. In the past, the black market for
eagle parts has been very lucrative. In 1987, a whole carcass could draw $1,000,
a tail feather fan $500, and a single eagle feather as much as $25. In more recent
times, authorities have tightened enforcement of the illegal sale of eagle parts.
At present, human activities in and around eagle nest sites, foraging areas,
and wintering areas are often cited as being the largest threat to the species’
survival. In some areas, feeding efficiency declines as the frequency of human
encounters increases (Knight & Knight 1984). However, this is not consistent with

21
the findings of McGarigal et al. (1991), who reported that there was no evidence
that eagles modified their foraging activity levels in relation to daily fluctuations in
human activity. In many areas, fish discarded by sport and commercial fishermen
and other sources of carcasses such as road-killed or hunter-injured deer, may
provide a major or supplementary source of food for bald eagles.
In some areas of the country, logging activities present a serious concern
for bald eagle habitat. Welchsler (1971) reports that logging within ¼ mile of a
nest may cause desertion of the nest site. In some areas, logging has resulted in
nest abandonment (Welchsler 1971; Juenemann 1973) or relocation (Thelander
1973). However, proper management strategies attempt to avoid these situations.
Continuous year-round disturbance associated with developed areas may have a
greater negative impact on bald eagle populations than periodic disturbances such
as timber operations, particularly if logging coincides with the non-breeding
season.
Reasons for Decline
Bald eagle populations showed dramatic losses from the time Europeans
settled in the New World until about the 1980s. Population numbers dropped
significantly after colonization, but began to rebound in the 1940s (Gerrard &
Bortolotti 1988). In 1890 on the Chesapeake Bay, there was reported to be a bald
eagle nest for every mile of shoreline (Gerrard & Bortolotti 1988). By 1936 that
number had dropped to between 600 and 800 breeding pairs (Gerrard & Bortolotti
1988).

22
There are many reasons for the decline in eagle population numbers over
the last two centuries. A few of the primary reasons have been directly related to
humans. The Raptor Research Foundation Bald Eagle De-listing Committee felt
that “although there are some data suggesting that eagles can habituate to some
levels of human development, essentially all peer-reviewed, published scientific
data indicate that eagle populations have been and will continue to be impacted
adversely by habitat alterations” (Bednarz 2000). Losses of habitat, human
disturbances, and shooting have all taken a large toll on eagle populations (Broley
1958; Howell & Heinzmann 1967; Sprunt 1969, Retfalvi 1965; Fraser et al. 1985).
Among these factors are destruction of territories, cutting of nest trees, collecting
of eggs, killing of young and adults (Broley 1952), and human development of
nesting sites.
Stalmaster (1987) provides five major causes for eagle population declines:
killing, poisoning, habitat destruction, prey base change, and disturbance by
humans. Frequent small alterations to the habitat result in a large cumulative
impact on bald eagles (Stalmaster 1987). Stalmaster (1987) suggests that it is
undeniable that humans have been a significant force in changing many features
of eagle habitat and have driven the eagle from many of its former territories
through direct persecution. As humans depleted aquatic food stocks and other
prey sources, eagles had more difficulty finding an adequate meal (Stalmaster
1987). Many prey populations have been decimated. Salmon were once plentiful,
but populations have now been reduced. Channelization projects in several areas
for controlling floods have reduced the amount of prey available and in each case,

23
eagle populations in these areas have declined (Stalmaster 1987; Steenhof 1978;
Shapiro et al. 1982).
Another hypothesis suggests that declines in eagle populations during the
1800s may have been linked to the near extermination of the huge bison
population that provided winter food for eagles in many areas (Andrew & Mosher
1982). Along with bison population declines, there was intensive hunting pressure
on large flocks of waterfowl (Andrew & Mosher 1982). The loss of these two major
sources of food likely impacted eagle populations.
Biocides such as insecticides and other pesticides have also been proven to
be detrimental to eagle populations (Krantz et al. 1970). Among these, DDT
(Dichlorodiphenylethane trichloride) caused the most problems. Broley (1958)
determined that DDT was responsible for decreasing the number of chicks
produced in Florida. He was one of the first researchers to voice concern that the
bald eagle was not reproducing at a sustainable rate. In 1942, eagles in Broley’s
(1958) study areas showed a nest success rate of 89%. By 1952, nest success
had plummeted to 14% (Broley 1958).
DDT was widely used throughout North American to control insects,
especially mosquitoes, from the end of World War II until it was banned in 1972
(Stalmaster 1987). DDT disrupts calcium metabolism in bald eagles and many
other species, causing thin eggshells (Stickel 1973; Stalmaster 1987). As few as a
couple parts per million of DDT may cause problems in eggshell development
(Stalmaster 1987).

24
Around the same time, Fawks (1961 & 1974) was finding similar decreases
in eagle numbers during winter surveys along the Mississippi River in Illinois and
Iowa. Carson (1962) took up the battle against environmental contaminants with
the writing of Silent Spring, a powerful book discussing the woes of DDT. DDT
was proven to reduce the thickness of eggshells, making them much easier to
break than before its introduction in 1946 (Anderson & Hickey 1972; Grier 1982).
Many eagles were unable to hatch a viable chick due to effects of DDT.
Researchers working in many areas of the country reported drastic declines
in nesting success from the mid-1940s to the mid-1970s due to the depression of
eagle nesting success and productivity (Sprunt 1969; Nye 1977; Dunstan 1978;
Green 1985). Eagles, ospreys, and many other avian species were negatively
affected by DDT exposure. Even with substantial contrary evidence, the impacts
of DDT have recently been questioned by industry-related groups (Edwards 1992;
Jukes 1994; Hecht 2002). Grier (1980) suggested that DDT was not singularly
responsible for drastic declines in eagle populations. Rather, it was likely that a
combination of several factors, including both reduced productivity and high
mortality, was likely to blame.
Reasons for Recovery
Between 1974 and 1995, the number of occupied breeding areas in the
lower 48 states increased 462% (Fish & Wildlife Service 1999). Between 1990
and 1995, breeding areas increased 47% (Fish & Wildlife Service 1999). Although
the growth rate is slowing as areas become saturated with eagles, the breeding

25
population of bald eagles in the contiguous United States has approximately
doubled every 6-7 years since 1970 (Fish & Wildlife Service 1999).
There are many reasons for the dramatic increase in populations of eagles
in North America in the last two to three decades. Recovery has been assisted by
intensive management that includes systematic monitoring, increased protection,
enforcement of laws, captive breeding, relocation of wild birds, and public
awareness of the eagles’ plight (Matthews & Mosely 1990). Productivity has
increased since the ban of DDT in 1972 (Grier 1982). The construction of locks,
dams, and reservoirs on the Mississippi and Missouri Rivers, begun in the 1920s
and 1930s, has improved wintering habitat for bald eagles (Sprunt & Ligas 1966;
Spencer 1976; Gerrard & Bortolotti 1988). Eagles gather in large concentrations
just downstream of many dams along the Mississippi River (Musselman 1949;
Southern 1963, 1964), particularly between Minneapolis, Minnesota and St. Louis,
Missouri. Eagles also find late-winter foraging habitat along the Missouri River in
North Dakota and South Dakota (pers. observations).
Programs designed to restore eagle populations by breeding eagles in
captivity and releasing young eagles hatched and raised by humans (known as
hacking) have increased populations in some areas (Gerrard & Bortolotti 1988). In
Alaska, a bounty on eagles was finally eliminated in 1952 and eagles have
reproduced relatively free from human disturbances since that time (Stalmaster
1987). In Glacier National Park, an introduced run of Kokanee salmon fed the
densest concentration of wintering eagles in the lower 48 states (McClelland et al.
1981). The human image of the bald eagle has changed dramatically and respect

26
for eagles has been passed along to younger generations. For most members of
today’s generation, it would be unthinkable to shoot an eagle purely for sport.
Changes in human perception have been important for protection of eagles from
direct persecution and also for fund-raising ventures and land acquisitions for
protecting eagle nest sites and roosting habitat.
Human Dimensions
Human activities have, without a doubt, had detrimental effects on a variety
of wildlife populations. Some studies have reported that some eagle nest failures
were clearly associated with human disturbances (Hunt et al. 1992). However,
bald eagle responses to different types of human activities vary widely (Grier 1969;
McGarigal et al. 1991; Steidl and Anthony 1996).
Several studies have associated lowered productivity and site desertion with
nest disturbances (Murphy 1965; Retflavi 1965; Juenemann 1973; Weekes 1974;
Fyfe & Olendorf 1976; Grubb 1976; Fraser 1981; Anthony & Isaacs 1989). Murphy
(1965), Thelander (1973), Fraser (1981), and Fraser et al. (1985) suggest that
eagles choose new nest sites farther away from shorelines because of human
activities. Often these sites are in what was considered to be less favorable
habitat areas for eagles (Hunt et al. 1992). However, others have found little or no
evidence of nest failures being caused by human activity (Mathisen 1968; Grier
1969; Swenson 1975; McEwan & Hirth 1979; Fraser 1981; Bangs et al. 1982).
Fraser (1981) found that less than 4.5% of failed nesting attempts could be
attributed to human disturbance.
With increasing development and recreational use of shorelines and
waterways, it is important to better understand human interactions with eagles.
27
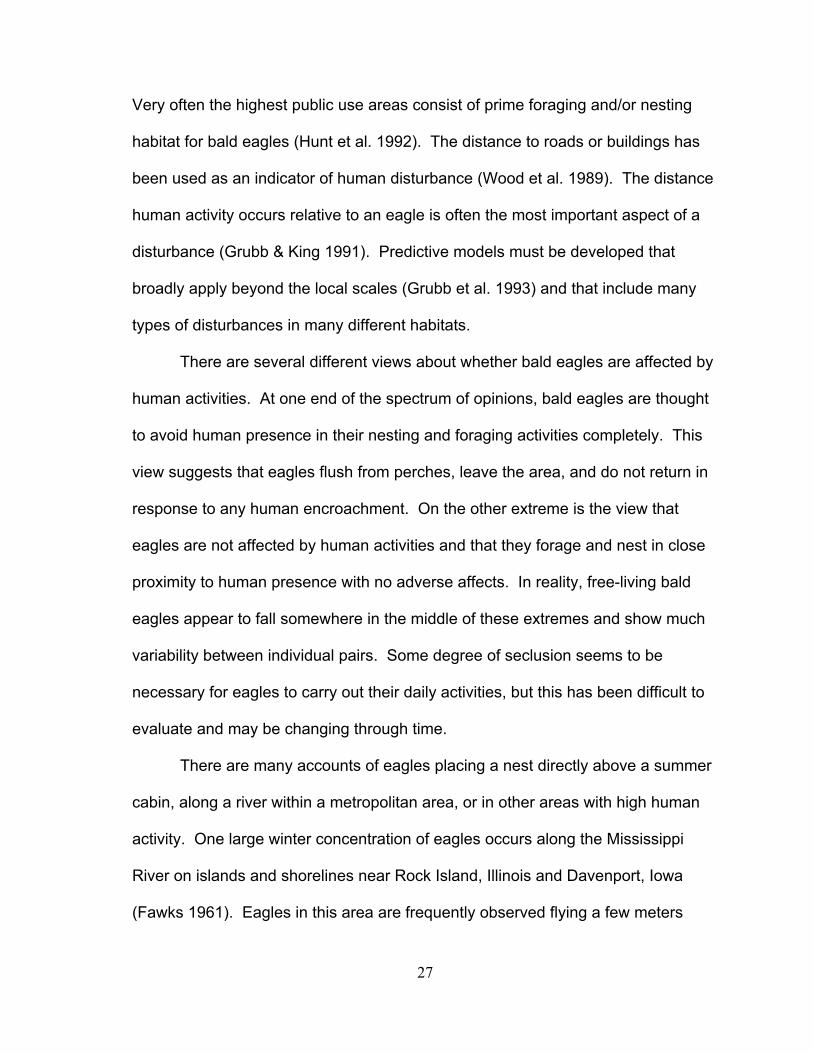
Very often the highest public use areas consist of prime foraging and/or nesting
habitat for bald eagles (Hunt et al. 1992). The distance to roads or buildings has
been used as an indicator of human disturbance (Wood et al. 1989). The distance
human activity occurs relative to an eagle is often the most important aspect of a
disturbance (Grubb & King 1991). Predictive models must be developed that
broadly apply beyond the local scales (Grubb et al. 1993) and that include many
types of disturbances in many different habitats.
There are several different views about whether bald eagles are affected by
human activities. At one end of the spectrum of opinions, bald eagles are thought
to avoid human presence in their nesting and foraging activities completely. This
view suggests that eagles flush from perches, leave the area, and do not return in
response to any human encroachment. On the other extreme is the view that
eagles are not affected by human activities and that they forage and nest in close
proximity to human presence with no adverse affects. In reality, free-living bald
eagles appear to fall somewhere in the middle of these extremes and show much
variability between individual pairs. Some degree of seclusion seems to be
necessary for eagles to carry out their daily activities, but this has been difficult to
evaluate and may be changing through time.
There are many accounts of eagles placing a nest directly above a summer
cabin, along a river within a metropolitan area, or in other areas with high human
activity. One large winter concentration of eagles occurs along the Mississippi
River on islands and shorelines near Rock Island, Illinois and Davenport, Iowa
(Fawks 1961). Eagles in this area are frequently observed flying a few meters

28
over heavily traveled interstate bridges. In some areas of the country, eagles
appear to be highly disturbed by human activities and avoid interactions at all
costs, including abandonment of nestlings, while others appear not to be affected
by human activity and actually seem to seek out sites near human structures (e.g.
lakeside cabins).
Human activity has in the past been negatively correlated with eagle
reproduction (Broley 1947; Murphy 1965; Mathisen 1968). Investigations of the
actual effects of human disturbances have evolved along with technology and
research techniques. Livingston et al. (1990) suggested that isolation from
humans might be the most important factor in the selection of islands as a nest
site. Mathisen (1968) examined human disturbances as a potential cause of
nesting failure among bald eagles on the Chippewa National Forest in North-
central Minnesota. He evaluated the effectiveness of buffer zones established in
1963 by the U. S. Forest Service to protect eagle nests from human disturbances.
A Wilderness Factor was developed for each nest site. He rated four factors
(human activity, roads, modified habitat, and difficulty getting to/finding nests) on
an arbitrary scale of High, Moderate, and Low disturbance. He also gathered
productivity data, but did not relate it to nest site selection. Andrew and Mosher
(1982) identified land-use practices that may influence the status of eagle
populations. Juenemann (1973), Thelander (1973), and Gerrard et al. (1975)
reported the importance of vegetation as a buffer for creating a visual barrier
between human activity and the nest.
29
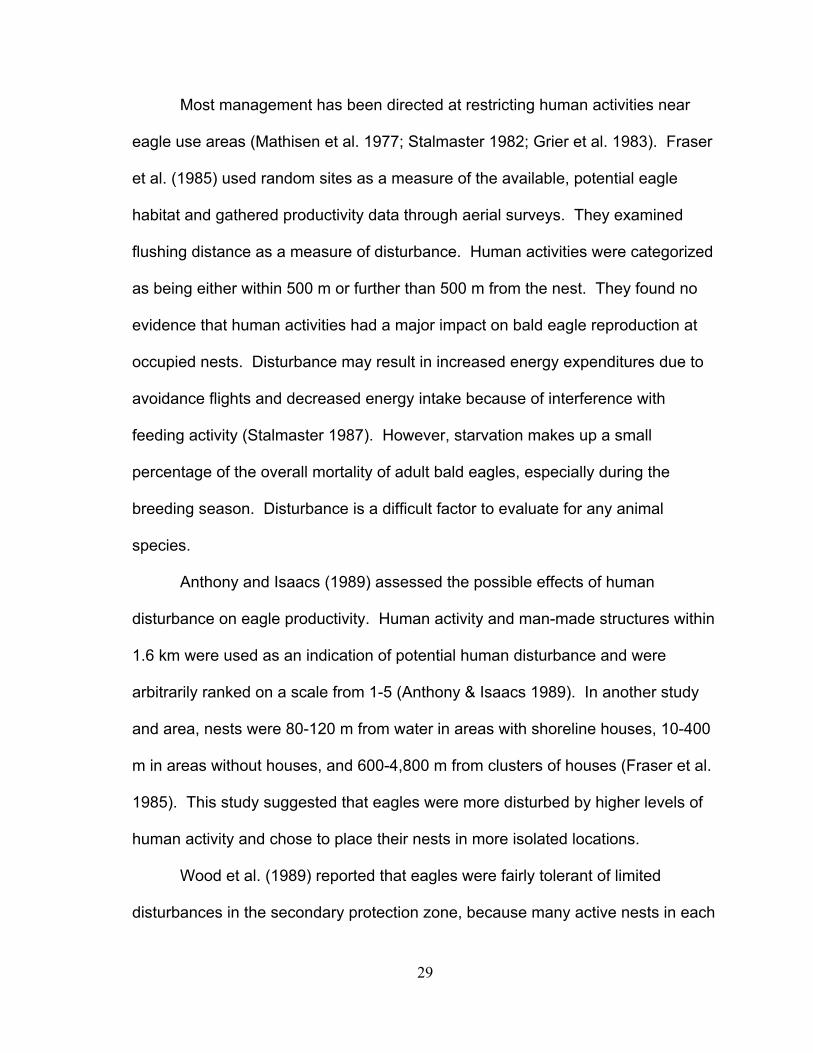
Most management has been directed at restricting human activities near
eagle use areas (Mathisen et al. 1977; Stalmaster 1982; Grier et al. 1983). Fraser
et al. (1985) used random sites as a measure of the available, potential eagle
habitat and gathered productivity data through aerial surveys. They examined
flushing distance as a measure of disturbance. Human activities were categorized
as being either within 500 m or further than 500 m from the nest. They found no
evidence that human activities had a major impact on bald eagle reproduction at
occupied nests. Disturbance may result in increased energy expenditures due to
avoidance flights and decreased energy intake because of interference with
feeding activity (Stalmaster 1987). However, starvation makes up a small
percentage of the overall mortality of adult bald eagles, especially during the
breeding season. Disturbance is a difficult factor to evaluate for any animal
species.
Anthony and Isaacs (1989) assessed the possible effects of human
disturbance on eagle productivity. Human activity and man-made structures within
1.6 km were used as an indication of potential human disturbance and were
arbitrarily ranked on a scale from 1-5 (Anthony & Isaacs 1989). In another study
and area, nests were 80-120 m from water in areas with shoreline houses, 10-400
m in areas without houses, and 600-4,800 m from clusters of houses (Fraser et al.
1985). This study suggested that eagles were more disturbed by higher levels of
human activity and chose to place their nests in more isolated locations.
Wood et al. (1989) reported that eagles were fairly tolerant of limited
disturbances in the secondary protection zone, because many active nests in each

30
region were in close proximity to roads or buildings within the zone. Fraser et al.
(1985) found no evidence that human activity within 500 m of occupied nests
significantly affected reproduction. The question concerning factors that actually
cause a disturbance to eagles remains controversial. This project examines the
tolerance of nesting eagles near varying levels of human presence.

31
CHAPTER 3. MATERIALS AND METHODS Study Area
Minnesota offered a unique opportunity to study nesting bald eagles. The
state has a large breeding population of bald eagles (n ~ 700 breeding pairs), four
distinct habitat regions, varying amounts of human activity near nest sites, and a
history of monitoring bald eagle populations. It was essential to examine a large
number of nests in a large study area to eliminate potential biases that have
resulted from past studies that investigated smaller land areas and/or had small
sample sizes. The habitat available for eagles in the state varies dramatically
among the four ecoregions (Fig. 2): Laurentian Mixed Forest, Eastern Broadleaf
Forest, Prairie Parkland, and Tallgrass Aspen (Henderson et al. 1977).
Scale of Measurements
Habitat features of each site were measured at two scales: a 100 m radius
plot (primary zone) and a 1,000 m radius plot (secondary zone) (Fig. 3). This
terminology purposely corresponded closely with management terminology used in
determining restrictions of human activity near nest sites. Primary and secondary
zones correspond to proximal characteristics and landscape concerns,
respectively. Several habitat and human presence variables (discussed later)
were measured at each nest site. Primary zone evaluation consisted
predominantly of measurements of trees within 100 m of nest trees. Analysis of
the larger secondary zone consisted of evaluating land management activities and
human presence using aerial photographs and land-use maps (MN DNR Data Deli
2001) for each selected nest site and random site.

32
1,000 m
100 m
Figure 3. Scales for examining bald eagle nesting habitat and human presence. Data Collection
Measurements of features within 100 m of the nest tree were taken on-site.
Aerial photographs and land-use maps of each nest site were used to determine
secondary zone features within 1,000 m of each nest tree. Human presence may
affect bald eagles at greater distances than 100 m (Fraser et al. 1985; Anthony &
Isaacs 1989). Therefore, examining human presence within 1,000 m provides a
more thorough evaluation of potential disturbance factors. Human presence at
sample sites was evaluated utilizing ArcView GIS (Geographical Information
System) to examine aerial photographs and land-use maps (MN DNR Data Deli
Online GIS data). A description of each feature measured during the physical
Secondary Zone
Nest TreePrimary Zone

33
inspections of the primary zone of each nest and random sites is recorded below
(Table 1).
Table 1. Measurements at the primary zone FEATURE DESCRIPTION
Location
Measured at the base of the nest tree or the mid-point of random habitat sites using a hand-held Garmin GPS 3+. Waypoint averaging of locations was used to accurately determine the location of each site.
Species
Species of nest tree.
Height
Measurement of the distance from the base of the tree to the top of the highest branch. Measurement taken with clinometer to nearest foot and converted to meters.
Diameter at Breast Height
Diameter of tree at 1.4 m from the ground. Measured in centimeters using Ben Meadows Company 5 m/160 cm Diameter Tape
Canopy Elevation
Average height measurement of overall canopy in area taken measured using a clinometer. Comments on slope of terrain and height of canopy compared to nest and nest tree.
Ground to nest
Measurement of distance from the ground at the base of the nest tree to the bottom of the nest. Measurement taken with Brunton Survey Master Clinometer to nearest foot and converted to meters.
Nest to top
Measurement of distance from the top of the nest to the top of the nest tree. Measurement taken with clinometer to nearest foot and converted to meters.
Nest Site
Measurements were taken of trees greater than 20 cm dbh within a 10m radius of the nest tree. Measurements taken of each tree were: species, height, and diameter at breast height, as above.
Additional Sites
Additional sites were chosen at a random distance and direction from the nest tree. Measurements were taken of trees greater than 20 cm dbh within a 10 m radius extending from the random point.

34
FEATURE DESCRIPTION
Human Presence
Comments on location, size, distance, and type of human activity in area.
Distance to Active Nest
Distance to nearest known or visible active nest.
Shoreline Distance Distance to closest known or visible shoreline.
Shoreline Description
Comments on closest visible shoreline features.
Sample nests (Fig. 4) for the study were selected from the group of all
active nests observed during the M.B.E. Survey. For analytical purposes, active
nests were stratified according to the four ecoregions. The vast majority of known
eagle nests in Minnesota were located in the Eastern Broadleaf Forest and
Laurentian Mixed Forest ecoregions. There were relatively few nests in the Prairie
Parkland and Tallgrass Aspen ecoregions. Therefore, the nests included in the
sample set were every known, active nest in the Prairie Parkland (~40 nests) and
the Tallgrass Aspen (~20 nests) ecoregions and a random sample of the total
known, active nests in the Eastern Broadleaf Forest (~60 nests) and Laurentian
Mixed Forest (~60 nests) ecoregions.
Sites chosen by eagles as nest sites were compared to the available habitat
in each ecoregion by evaluation of a number of random sites, equal to the
anticipated number of sample nests within each ecoregion (n = 180). The sample
number of nests was reduced due to nest losses during the study or incorrect site
locations resulting in some nests not being found. Identical habitat variable
Table 1. (continued)

35
Figure 4. Sample bald eagle nests and random sites examined in Minnesota. measurements were taken at random sites and compared to those measured at
each nest site. Random sites were selected using criteria that restricted sites to
areas that would include the shoreline zone in which nearly all nests are found.
The most important criterion was proximity to water. Livingston et al. (1990) found
that 107 of 115 eagle nests occurred within 1 km of a major body of water. Fraser
et al. (1985) found that, in the Chippewa National Forest, Minnesota, the mean
distance of nests to the shoreline was less than 1 km. Likewise, in Alaska (Corr
Sample Nest Random Site

36
1974) and Canada (Whitfield et al. 1974; Gerrard et al. 1975), the mean distance
from water was less than 330 m (also, see Literature Review).
Random sites were selected according to two main criteria. Potential sites
were (1) restricted to being within 1 km of a major water body and (2) required to
include trees larger than 20 cm in diameter. To meet the first criterion, a grid of
1 km2 cells was developed to overlay the entire state using ArcView GIS (ESRI
1999). A 1 km buffer (Fig. 5) was then selected to border all major water bodies.
Any grid cell that contained an amount of the buffered area (i.e., all areas of land
within 1 km of a major body of water) was considered a potential random site.
From that set, random sites were selected using ArcView Spatial Analysis
Extension corresponding to the number of nest sites within each ecoregion. Each
habitat cell was then examined manually and omitted if it did not include usable
eagle nesting substrate (e.g., if the cell was entirely water or in the middle of a
metropolitan area with no trees). The total number of random sites chosen from
each ecoregion was equal to the initial number of sampled nest sites within that
ecoregion. The closest tree to the mid-point of the grid cell was designated to
symbolize the “mid-point tree” of a random site. Habitat measurements were
initiated from that mid-point tree, and all relevant measurements were taken.
At each nest site and random site, measurements were taken within a total
of four-10 m radius circular plots (Fig. 6). The initial plot used the nest tree (or the
mid-point of a random site) as the center of the circular plot. The other three plots
were chosen at a random compass direction and random distance within 100 m of
the nest tree. Compass degrees were selected randomly using a random numbers

37
Figure 5. Water body buffer and 1 km2 cells grid system for selection of random sites (Not to scale). table to determine the direction of each additional site from the nest tree. Distance
was constrained to >10 m (to avoid overlapping with the initial site closest to the
nest tree) and <100 m (the limit of primary zone evaluation). Measurements taken
at sites 1, 2, and 3 were considered to be measurements of the surrounding stand
trees. Measurements taken within the primary zone are listed in Table 1.
Access to each site was gained via automobile, foot, canoe, boat, or air-
boat and was facilitated by a variety of federal and state agency personnel (see
Acknowledgments). Visits to each nest area were limited to less than 45 minutes
to reduce any possible researcher-induced disturbances to nesting eagles.
Water
Border

38
1 Figure 6. Sampling strategy for measurement of the primary zone. Stand measurements taken at sites 1, 2, and 3 (Not to scale).
Measurements were not initiated until after 15 June of each year, as an additional
precaution against possible disturbances during the most critical part of the
breeding season (March-May) (Fish & Wildlife Service 1990; Fraser 1981).
Measurements were taken between 15 June 2001 and 15 December 2001 and
between 15 June 2002 and 10 August 2002.
To identify and gather data at random habitat sites, some rules of priority
were followed (1) All sites had to include several measurable (i.e., >20 cm in
diameter) trees and (2) Measurements had to be taken for each site selected. To
ensure all sites contained measurable trees, the mid-point for the random site
needed to be adjusted in several special cases. I traveled to the designated mid-
point of the site using a hand-held GPS unit. If the site contained trees larger than
1
10 m
3
2
100 m
Nest Tree

39
20 cm in diameter, then measurements were taken as normal using the tree
closest to the mid-point of the site as the mid-point tree. If the site did not contain
measurable trees, I moved in the direction of the closest water body to the nearest
stand of measurable trees. The closest tree larger than 20 cm in diameter within
that stand was chosen as the mid-point tree. Measurements were taken at the site
in the usual manner. If the original site was completely (unexpectedly) water, I
moved to the closest trees along the nearest shoreline. The closest tree larger
than 20 cm within that stand was designated as the mid-point tree and
measurements were taken as usual.
Eagles often nest close to shore; therefore, shoreline areas required special
attention in this study. In many instances nests were located less than 100 m from
water, requiring adjustment of my sampling methods to avoid biases when
examining tree densities (Fig. 7). For random sites, the following rules applied. If
the site contained only a small band of trees along the perimeter of a lake or
stream, then the tree (>20 cm) closest to the middle point of the site was
designated as the mid-point tree. A coin flip determined the direction of travel for
each of the additional habitat sites. If the sites that were chosen overlapped in any
way, the second site was eliminated and a replacement site was chosen at
random. Measurements of the sites were then taken as usual. For nest sites, the
nest tree was located and directions were followed as above.
If the nest tree (or mid-point of a random site) was less than 10 m from the
water in a more heavily forested area, a different approach was taken. I moved 10
m from the shoreline in the opposite direction of the shoreline (i.e. into the forest)

40
Figure 7. Strategy for measuring primary zone at sites with one band of trees surrounding water. Additional habitat sites are numbered 1, 2, and 3 (Not to scale). and used that point as the center of the initial plot (Fig. 8). All other measurements
were taken as usual, taking a random distance and direction from the actual nest
tree (or the actual middle point of a random site).
Some variables were measured utilizing ArcView GIS data provided by the
Minnesota DNR including aerial photographs and land-use maps. Habitat and
disturbance factors that were not measured via ArcView GIS were verified or
gathered by direct measurement in the field. Nests and random site locations
were marked with a hand-held GPS (Global Positioning System) unit. Secondary
100 m
2
3
1
Nest Tree
Band of Trees
Lake

41
Figure 8. Strategy for measuring the primary zone at sites located within 10 m of water (Not to scale). zone evaluation consisted of examining aerial photographs and land-use maps of
nest sites and random sites. The proportion of land area consisting of certain
habitat categories and potential human disturbances was evaluated within the
secondary zone. Features that were examined for each site are listed in Table 2.
Data concerning nesting activity and productivity were gathered using aerial
surveys according to Grier et al. (1981). Aerial surveys are the traditional method
for locating and censusing bald eagles and their nests (King et al. 1972; Hodges et
al. 1984; Fuller & Mosher 1987). Aerial survey data for 2000 was obtained during
100 m
1
Nest Tree
Lake
3
2

42
Table 2. Measurements at the secondary zone FEATURE DESCRIPTION
Distance to Forest Distance (m) to nearest forested land as shown on land-use maps and/or aerial photographs.
Distance to Water Distance (m) to nearest body of water as shown on land-use maps and/or aerial photographs.
Distance to Bog Distance (m) to nearest bog, marsh, fen, or swamp as shown on land-use map.
Distance to Grassland
Distance (m) to nearest grassland as shown on land-use maps or aerial photographs.
Distance to Cultivated Field
Distance (m) to nearest cultivated field as shown on land-use maps or aerial photographs.
Distance to Roads Distance (m) to nearest road as shown on aerial photographs.
Distance to Structures
Distance (m) to nearest structures as shown on aerial photographs.
Distance to Brushland
Distance (m) to brushland as shown on land-use maps and aerial photographs.
Density of Roads Number of roads within 1,000 m as shown on aerial photographs.
Density of Structures
Number of structures within 1,000 m as shown on aerial photographs.
Density of Land-use Types
Number of land-use types within 1,000 m as shown on land-use maps.
the MN DNR’s M.B.E. Survey. Aerial surveys were performed as part of this
project to gather productivity figures for 2001. Two years of productivity data
reduced the chance of bias due to annual fluctuations in nest productivity.

43
All nests were surveyed from single engine, fixed-wing airplanes (Cessna
185 or similar aircraft) in April to determine nest occupancy and again in June to
determine the productivity (number of nestlings present) of the nest. Few nestlings
perish after the late stage of nesting; therefore, the number of nestlings observed
during the final stage of nesting is usually accepted as the number of birds that will
fledge (pers. corresp. with experts in Canada and the U.S.).
Experienced eagle survey workers from the MN DNR and/or North Dakota
State University (NDSU) recorded aerial survey data. Fraser (1981) and Fraser et
al. (1983) suggested a high amount of error when surveys are taken at an
inappropriate time during the breeding season. Attempts were made to avoid
sampling error by consulting pilots, managers, and other researchers familiar with
nesting schedules in each part of the state. The general trend is for eagles in the
Southern part of the state to initiate nesting earlier than eagles in the North. Pilots
from the MN DNR or other governmental agencies flew aerial surveys in their
specific areas, recorded data, and reported findings to the DNR and/or directly to
me.
Data collected during aerial surveys included the presence or absence of
adult eagles at nest sites, a description of the location and activity of any eagles at
the nest (i.e. incubating, brooding, perching in nest tree or nearby tree), presence
of juvenile eagles, general notes on the terrain, and position of the nest in the nest
tree. The terminology used to describe nest usage and occupancy was according
to Postupalsky (1974). All survey data were recorded immediately on data forms
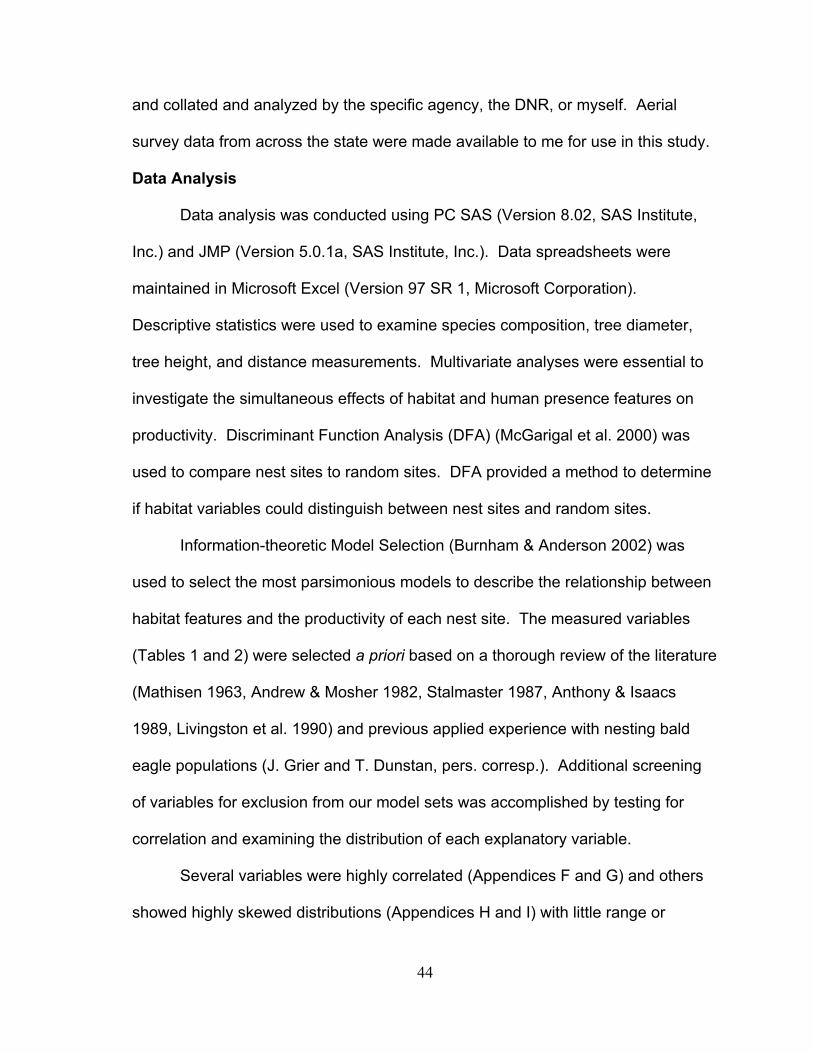
44
and collated and analyzed by the specific agency, the DNR, or myself. Aerial
survey data from across the state were made available to me for use in this study.
Data Analysis
Data analysis was conducted using PC SAS (Version 8.02, SAS Institute,
Inc.) and JMP (Version 5.0.1a, SAS Institute, Inc.). Data spreadsheets were
maintained in Microsoft Excel (Version 97 SR 1, Microsoft Corporation).
Descriptive statistics were used to examine species composition, tree diameter,
tree height, and distance measurements. Multivariate analyses were essential to
investigate the simultaneous effects of habitat and human presence features on
productivity. Discriminant Function Analysis (DFA) (McGarigal et al. 2000) was
used to compare nest sites to random sites. DFA provided a method to determine
if habitat variables could distinguish between nest sites and random sites.
Information-theoretic Model Selection (Burnham & Anderson 2002) was
used to select the most parsimonious models to describe the relationship between
habitat features and the productivity of each nest site. The measured variables
(Tables 1 and 2) were selected a priori based on a thorough review of the literature
(Mathisen 1963, Andrew & Mosher 1982, Stalmaster 1987, Anthony & Isaacs
1989, Livingston et al. 1990) and previous applied experience with nesting bald
eagle populations (J. Grier and T. Dunstan, pers. corresp.). Additional screening
of variables for exclusion from our model sets was accomplished by testing for
correlation and examining the distribution of each explanatory variable.
Several variables were highly correlated (Appendices F and G) and others
showed highly skewed distributions (Appendices H and I) with little range or

45
spread of values, thus, providing little information. In the former case, a variable
that was explained by another variable was eliminated from the model set. In the
latter case, the variable was transformed using a loge transformation in an attempt
to provide a distribution with a more useful spread, in order to facilitate the
detection of any possible effects. If transformation was unsuccessful in providing a
less-skewed distribution, the variable was considered unlikely to provide any
explanatory value (due to extremely small spread) and eliminated from
consideration. In this manner, the final variables included in the models were
selected.
The full data set (including data collected at both nest sites and random
sites) was used to determine differences between nest sites and random sites.
Five of the original variables were eliminated based on their lack of biological
importance and/or to avoid overlapping variables. Overlapping variables were
those determined to be too closely related to provide sufficient information. In
addition, five were eliminated due to inappropriate distributions and four were
eliminated due to being highly correlated with other variables. A categorical
variable, “NestorRandom”, was used as the response variable for determination of
a discriminant function. A Discriminant Analysis plot of the final variable set (Table
3) was used to discriminate between nest sites and random sites.
A validation step was established, setting aside 20% of the data as the
Validation Set. The Validation Set was chosen by selecting sites from both the
extremes and the median portions of the data to enhance the evaluation of the
chosen models (analogous to designing treatments in a controlled experiment).
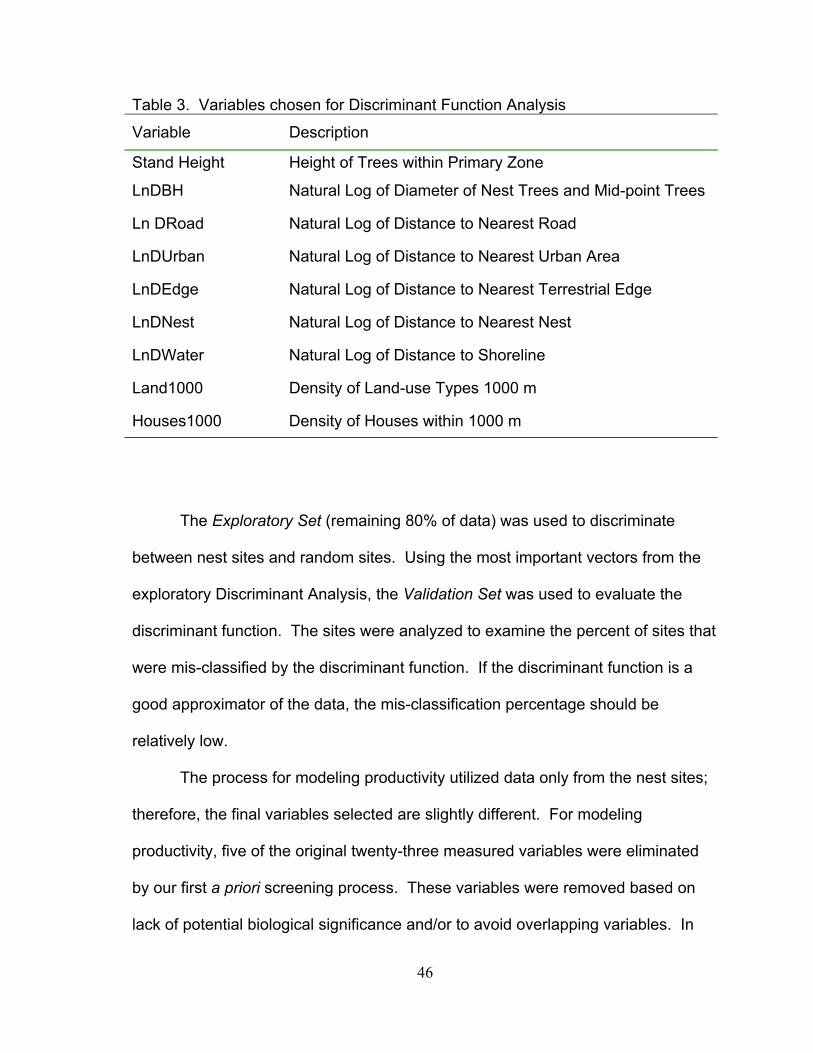
46
Table 3. Variables chosen for Discriminant Function Analysis
Variable Description
Stand Height Height of Trees within Primary Zone
LnDBH Natural Log of Diameter of Nest Trees and Mid-point Trees
Ln DRoad Natural Log of Distance to Nearest Road
LnDUrban Natural Log of Distance to Nearest Urban Area
LnDEdge Natural Log of Distance to Nearest Terrestrial Edge
LnDNest Natural Log of Distance to Nearest Nest
LnDWater Natural Log of Distance to Shoreline
Land1000 Density of Land-use Types 1000 m
Houses1000 Density of Houses within 1000 m The Exploratory Set (remaining 80% of data) was used to discriminate
between nest sites and random sites. Using the most important vectors from the
exploratory Discriminant Analysis, the Validation Set was used to evaluate the
discriminant function. The sites were analyzed to examine the percent of sites that
were mis-classified by the discriminant function. If the discriminant function is a
good approximator of the data, the mis-classification percentage should be
relatively low.
The process for modeling productivity utilized data only from the nest sites;
therefore, the final variables selected are slightly different. For modeling
productivity, five of the original twenty-three measured variables were eliminated
by our first a priori screening process. These variables were removed based on
lack of potential biological significance and/or to avoid overlapping variables. In

47
addition, seven variables were screened from our set due to inappropriate
correlation and/or distribution concerns. The remaining variables (Table 4) were
examined using an initial variable-interaction technique.
Table 4. Variables chosen for initial interaction assessment by Mallow's Cp
The 11 variables and each of their 2-way comparisons were examined
using SAS PROC REG to determine Mallow’s Selection Criterion (Cp) to identify
the best fitting interactions. The “best” interactions were then analyzed by SAS
PROC GENMOD to determine the log-likelihood of each model. Next, the log-
likelihood values were used to calculate Akaike’s Information Criterion (AICc)
Variable Description
LnNtoTop Loge Distance from Nest to Top of Tree
LnDWater Loge Distance to Shoreline
LnDBH Loge Nest Tree Diameter at Breast Height
LnStandDBH Loge Average Diameter at Breast Height of Trees Measured within 100 m of the Nest Tree
Nland1000 Number of Land-use Types within 1,000 m
Nroads1000 Number of Roads within 1,000 m
LnDHouse Loge Distance to Nearest Structure
Durban Distance to Nearest Urban Area (designated by city streets)
LnDCultv Loge Distance to Nearest Cultivated Field
LnDGrass Loge Distance to Nearest Grassland
LnDActive Loge Distance to Nearest Active Nest

48
values and the associated Akaike weights (Wi) to arrive at the best approximating
models for the data set (Burnham & Anderson 2002). AICc, i∆ , and Wi were
calculated using equations from Burnham & Anderson (2002). AICc was calculated
using the formula as follows:
, where LΘ equals the Likelihood of the model, k equals the number of estimable
parameters in the model, and n equals the number of samples. The i∆ values
were calculated using the formula as follows:
,
where the minimum AICc is the smallest AICc value from the previous equation.
The WI values were calculated using the formula as follows:
. Using a similar strategy as above, the exploratory model-building process
utilized 80% of the data (Exploratory Set). The remaining 20% of the data
(Validation Set) was set aside to cross validate the models. The Validation Set
was chosen by selecting sites from both the extremes and the median portions of
the data to enhance the evaluation of the chosen models. The Root Mean Square
Error (RMSE) was calculated and evaluated as a comparison between the two
sets. The RMSE is a single standard deviation for multiple variables in a model,
estimating the common within-group standard deviation.
i∆ = AICci – minimum AICc
wi = ∑ ∆−
∆−)i2/1exp(
i)2/1exp(
AICc = -2 log(LΘ ) + 2k
−− 1knn

49
The response variable for these models was the productivity of the eagles
at individual nests. Productivity was the number of chicks produced from a nest.
Two years of productivity data, 2000 and 2001, were obtained. For each year,
productivity ratings were determined (Table 5). A Productivity Rank for each nest
site was obtained by summing the annual productivity ratings for each nest. The
result of productivity ranking is a normally-distributed response variable on a scale
from 2 to 10. All nests used in data analysis were active in both 2000 and 2001.
Table 5. Annual productivity ratings for bald eagle nests
Annual Productivity Rating Description
1 Nest Not Active
2 Nest Active, Productivity = 0 chicks fledged
3 Nest Active, Productivity = 1 chick fledged
4 Nest Active, Productivity = 2 chicks fledged
5 Nest Active, Productivity = 3 chicks fledged Appropriate Statistical Techniques
Significance values are not included in this dissertation. Rather, a different
and relatively newer paradigm of data analysis, Information-theoretic Model
Selection, has been incorporated. Although studies of this type have traditionally
been associated with null hypothesis (i.e. significance testing) and p-values (e.g., p
> 0.05), I agree with D. H. Johnson (1999) and D. R. Anderson et al. (2000) that
“significance values are not appropriate for field studies of this nature.” W. L.
Thompson (http://www.cnr.colostate.edu/~anderson/thompson1.html) provides a

50
thorough bibliography of sources which question the indiscriminate use of
hypothesis testing in observational studies. Likewise, Anderson et al. (2000)
reports a dramatic increase in the number of articles in various disciplines that
contest the use of null hypothesis testing in research that does not involve
controlled experiments. Carver (1978), Cohen (1994), and Nester (1996) offer
some of the most aggressive statements concerning the use of null hypothesis
testing.
The main issue is that null hypothesis testing is useful and appropriate for
strictly controlled experiments, but not for observational studies. “Results from null
hypothesis testing have led to relatively little increase in understanding and divert
attention from the important issues—estimation of effect size, its sign and its
precision, and meaningful mechanistic modeling of predictive and causal
relationships” (Anderson et al. 2000).
The use of significance testing in an uncontrolled, non-experimental project
design is not appropriate because it only offers one alternate hypothesis. In
practice if the null hypothesis is rejected, the single alternative hypothesis is often
accepted as truth and management strategies are devised accordingly. However,
due to the nature of observational studies, there are often many alternate
hypotheses that can be associated with a single null hypothesis.
Null hypothesis testing requires that the researcher assume complete
ignorance of the system. Information-theory, on the other hand, allows the
researcher to use previous information obtained through personal observations,
prior investigations, and the published literature. Information-theoretic Model

51
Selection places the emphasis on formulating a proper research question
(Burnham & Anderson 2002). Information-theory finds its basis in Likelihood
Theory and includes ideas such as the Principle of Parsimony and Kullback-Leibler
Information, two fundamental principals of modern statistical theory. Model
Selection allows for multi-modal inference, making inferences based on several
models instead of a single model that is assumed to be the best (Burnham &
Anderson 2002). For the purposes of this project, null hypothesis testing was
avoided in favor of more appropriate statistical techniques.

52
CHAPTER 4. RESULTS Nest Site Descriptions
Nests were located in living and dead trees of a variety of species. Eleven
tree species and one man-made structure were used by bald eagles as nesting
substrate (Table 6). Sample nests were most frequently located in cottonwood
trees. Use of this species was particularly important in the Eastern Broadleaf
Forest and Prairie Parkland ecoregions (Table 7). Red and white pines were also
well represented as nest trees, especially in the Laurentian Mixed Forest
ecoregion. This was consistent with earlier reports of the importance of pine trees
as eagle nesting trees in the same area of the state (Fraser 1981; Mathisen 1963).
However, other tree species were used across the eagles’ range in Minnesota
(Table 7).
Nest trees were placed into five a posteriori categories to facilitate
univariate analyses. Nest tree categories included Coniferous, Cottonwoods,
Quaking Aspen, Other Deciduous, and Steel. Productivity rankings were similar
across all tree categories (Fig. 9), except for Steel, which represented only one,
highly productive nest. Productivity rankings were similar in different ecoregions
across the state (Fig. 10). An overall comparison of productivity ranks among tree
categories and ecoregions show no differences across tree types and habitat
regions (Fig. 11).
Nests were generally located in large, tall trees in each ecoregion. On
average, nest trees in the Eastern Broadleaf Forest ecoregion were the largest in
diameter (Fig. 12), while nest trees in the Laurentian Mixed Forest ecoregion were
the tallest (Fig. 13). Similarly, the nest structure was located farthest from the

53
Table 6. Characteristics of bald eagle nests (n = 120) in Minnesota
Tree Species
N
Percent of Nest Trees
Tree DBH (cm)
Mean SE
Tree Height (m)
Mean SE
Nest Height (m)
Mean SE
Cottonwood 39 32.5 59.95 4.83 24.66 0.76 19.58 0.72
White Pine 35 29.2 45.94 2.86 26.21 0.99 21.87 0.92
Quaking Aspen 17 14.2 49.4 15.31 21.84 1.55 18.98 1.41
Red Pine 10 8.3 43.75 8.29 25.73 1.12 21.66 1.41
Silver Maple 4 3.3 55.7 26.01 17.84 0.83 14.70 0.93
Slippery Elm 4 3.3 45.35 9.99 17.68 1.23 13.79 1.83
Green Ash 3 2.5 54.5 17.75 16.51 2.90 13.56 3.69
White Oak 3 2.5 45.94 2.86 23.83 5.08 17.79 4.11
White Poplar 2 1.7 43.8 7.6 21.80 1.37 19.65 1.37
Paper Birch 1 0.8 36.2 -- 23.17 -- 17.37 --
Sugar Maple 1 0.8 41.3 -- 25.30 -- 23.77 --
Steel 1 0.8 54 -- 16.62 -- 16.61 --
All Structures 120 100.0 51.56 2.97 23.99 0.52 19.78 0.48 ground in the Laurentian Mixed Forest ecoregion (Fig. 14). On average, nests
were located in the upper 20% of the nest tree (Table 7) at an average height of
19.78 m.
In comparison to trees in the surrounding stand (i.e. within 100 m), nest
trees were larger in diameter and height than nest stand trees (Table 8). Nest
trees were the tallest trees measured at only 65 of 120 (54.2%) nest sites. On the
other hand, the nest tree was larger in diameter than stand trees at 97 of 120
(80.1%) nest sites.

54
Table 7. Bald eagle nest tree species within ecoregions
Tree Species Eastern
Broadleaf Laurentian
Mixed Forest Prairie
Parkland Tallgrass
Aspen
Cottonwood 19 -- 17 3
White Pine 5 27 2 1
Quaking Aspen 3 6 -- 8
Red Pine -- 10 -- --
Silver Maple 2 -- 2 --
Slippery Elm -- 3 -- 1
Green Ash 1 -- 1 1
White Oak 1 -- 2 --
White Poplar -- 1 1 --
Paper Birch -- 1 -- --
Sugar Maple -- 1 -- --
Steel 1 -- -- --
In the Laurentian Mixed Forest ecoregion, nests were taller than stand trees
(Fig. 15). This is consistent with Fraser (1981) who reported that bald eagles nest
in super canopy trees in the same area of Minnesota. However, in the Eastern
Broadleaf Forest and Prairie Parkland ecoregions, nests were just slightly (i.e.,
< 1 m) taller while, in the Tallgrass Aspen ecoregion, nests were shorter than stand
trees (Fig. 15). Overall, nests were taller than stand trees at only 25 of 120 sites.
On average, nest sites were closer than 160 m to water (Table 9). This is
substantially closer than reported distances of approximately 600 m in the

55
Figure 9. Mean bald eagle productivity ranks (+ standard error) within tree categories.
Figure 10. Mean bald eagle productivity ranks (+ standard error) within ecoregions.
3
4
5
6
7
8
9
10
Con
ifero
us
Cot
tonw
ood
Oth
er D
ecid
uous
Qua
king
Asp
en
Stee
l
Mea
n P
rodu
ctiv
ity R
ank
4.5
5.0
5.5
6.0
6.5
7.0
7.5
Laur
entia
n
Eas
tern
Pra
irie
Tallg
rass
Mea
n P
rodu
ctiv
ity
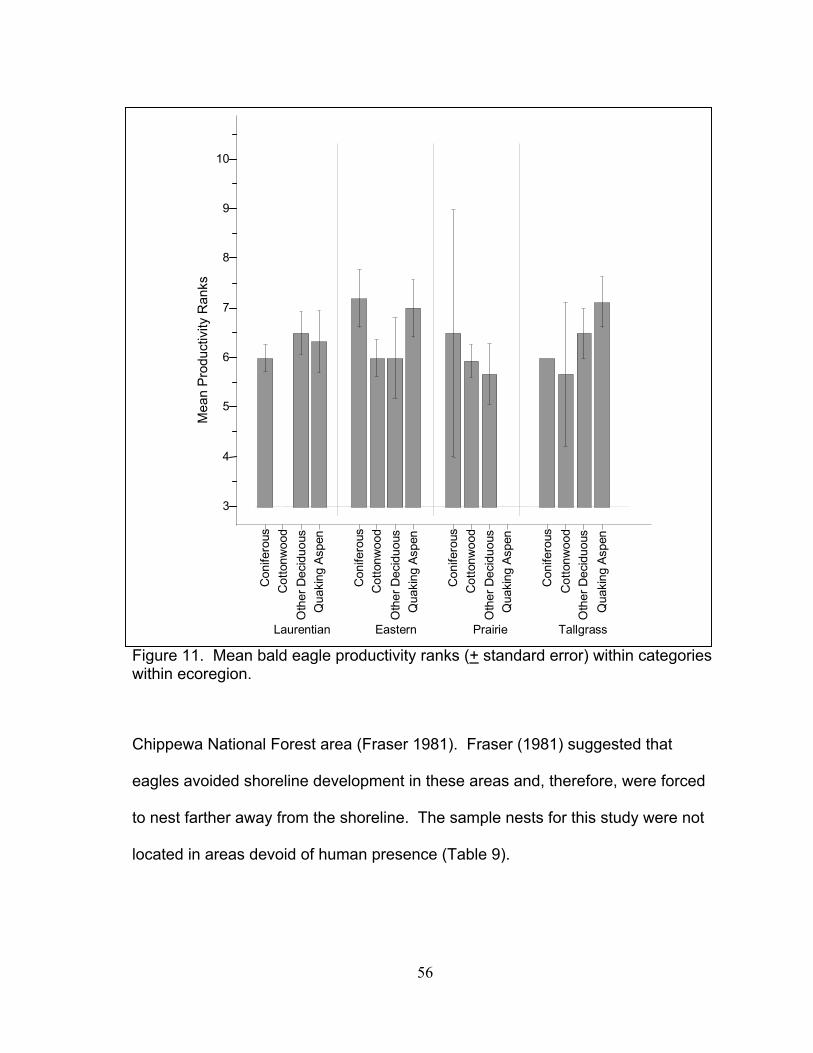
56
Figure 11. Mean bald eagle productivity ranks (+ standard error) within categories within ecoregion.
Chippewa National Forest area (Fraser 1981). Fraser (1981) suggested that
eagles avoided shoreline development in these areas and, therefore, were forced
to nest farther away from the shoreline. The sample nests for this study were not
located in areas devoid of human presence (Table 9).
3
4
5
6
7
8
9
10
Con
ifero
us
Cot
tonw
ood
Oth
er D
ecid
uous
Q
uaki
ng A
spen
Con
ifero
us
Cot
tonw
ood
Oth
er D
ecid
uous
Q
uaki
ng A
spen
Con
ifero
us
Cot
tonw
ood
Oth
er D
ecid
uous
Q
uaki
ng A
spen
Con
ifero
us
Cot
tonw
ood
Oth
er D
ecid
uous
Q
uaki
ng A
spen
Laurentian Eastern Prairie Tallgrass
Mea
n P
rodu
ctiv
ity R
anks
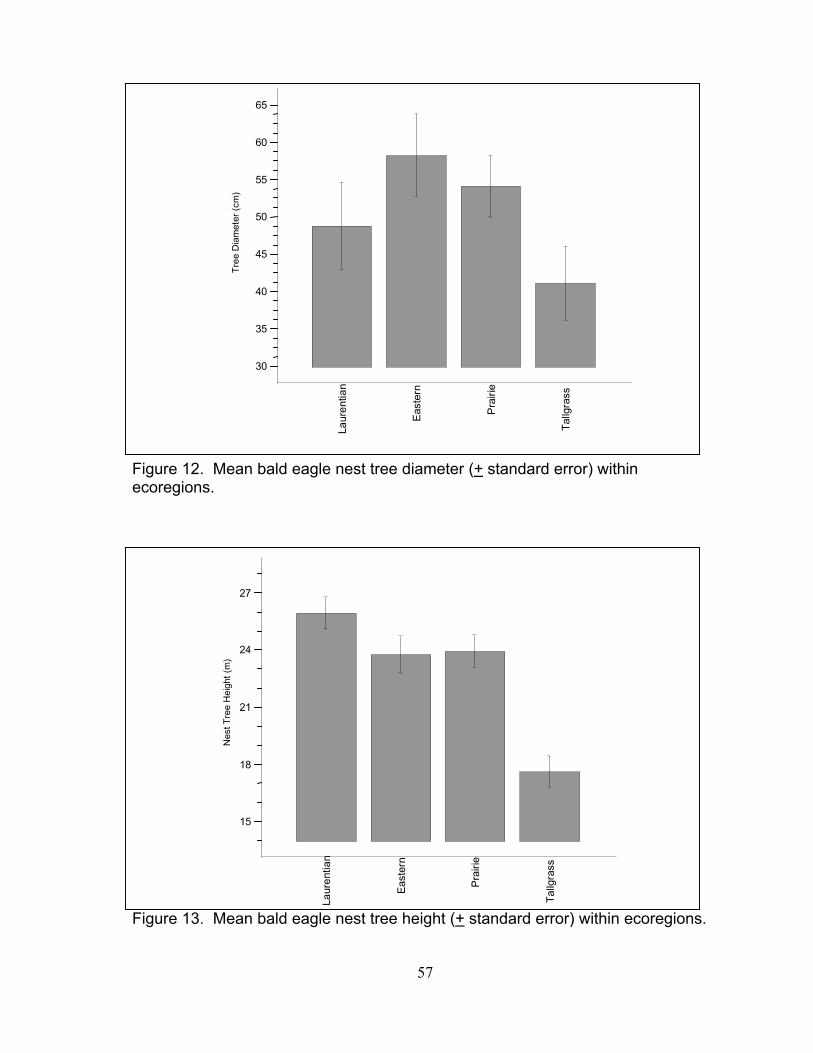
57
Figure 12. Mean bald eagle nest tree diameter (+ standard error) within ecoregions.
Figure 13. Mean bald eagle nest tree height (+ standard error) within ecoregions.
30
35
40
45
50
55
60
65
Tree
Dia
met
er (c
m)
Laur
entia
n
Eas
tern
Pra
irie
Tallg
rass
15
18
21
24
27
Nes
t Tre
e H
eigh
t (m
)
Laur
entia
n
East
ern
Pra
irie
Tallg
rass

58
Figure 14. Mean bald eagle nest height (+ standard error) within ecoregions.
Table 8. Mean height and diameter of bald eagle nest trees and trees in the surrounding stand within 1,000 m
Nest Tree Stand Trees Mean Tree Height (m)
(SE) 23.99 (0.52)
18.55 (0.39)
Mean Tree Diameter (cm) (SE)
51.56 (2.97)
31.41 (0.83)
12
15
18
21
24
Mea
n N
est H
eigh
t (m
)
Laur
entia
n
Eas
tern
Pra
irie
Tallg
rass

59
Figure 15. Mean height of nest trees and associated stand trees (+ standard error) within ecoregions.
Table 9. Mean characteristics of bald eagle nest sites (n = 120) in Minnesota Variable Mean (SE)
Distance (m) to Nearest Active Nest 8876.58 (813.74)
Distance (m) to Water 159.28 (27.57)
Distance (m) to Nearest House 6147.60 (1455.98)
Distance (m) to Nearest Road 668.88 (170.20)
Distance (m) to Urban Area 9752.03 (710.90)
Distance (m) to Cultivated Fields 6128.97 (1325.73)
Distance to Terrestrial Edge 413.68 (66.04)
Number of Land-use Types in 1000m 5.47 (0.12)
Number of Roads in 1000 m 4.58 (0.34)
Houses in 1000 m 12.42 (2.93)
12
14
16
18
20
22
Laurentian Eastern Prairie Tallgrass Nest Trees Stand Trees
Hei
ght (
m)

60
Nest Sites vs. Random Sites Comparison Univariate comparisons between nest sites and random sites within
ecoregions are shown in Figures 16-22. Differences associated with each
ecoregion were primarily attributed to extreme differences in habitat types between
the four areas. For example, distances to the nearest body of water were much
greater in the Prairie Parkland ecoregion than in the Laurentian Mixed Forest
ecoregion. This is to be expected because of the geological events that have
occurred and the nature of the biomes that exist in each area. Similarly, on
average, there were few land-use types (and, therefore, greater distances from
terrestrial edges) in the Laurentian Mixed Forest ecoregion because this area
contains large tracts of protected forests with little agricultural activities or open
grasslands. Mean distance to the nearest active nest was much greater for
random sites in the Prairie Parkland ecoregion because nearly all of the nests in
this region were associated with the Minnesota River. The river was located a
great distance from many of the randomly chosen sites, while sample nests were
relatively close to one another.
Nest trees were larger in diameter and height than mid-point trees of
random sites (Table 10). The number of species observed was similar between
nest trees (12 species) and mid-point trees (16 species); however, their frequency
distributions were much different. Nest sites were closer to water (Fig. 18)
andcloser to other active nests than random sites. Human-presence variables
showed minimal differences between nest and random sites with a large amount of
variation among sites (Figs. 20 and 21).

61
Figure 16. Tree height at nest sites and random sites (+ standard error) within ecoregions.
Figure 17. Tree diameter at nest sites and random sites (+ standard error) within ecoregions.
20
30
40
50
60
70
Mea
n Tr
ee D
BH
(cm
)
Ran
dom
Nes
t
Ran
dom
Nes
t
Ran
dom
Nes
t
Ran
dom
Nes
t
Prairie Tallgrass Eastern Laurentian
12
16
20
24
28
Mea
n Tr
ee H
eigh
t (m
)
Ran
dom
Nes
t
Ran
dom
Nes
t
Ran
dom
Nes
t
Ran
dom
Nes
t
Prairie Tallgrass Eastern Laurentian

62
Figure 18. Distance to shoreline at nest sites and random sites (+ standard error) within ecoregions.
Figure 19. Density of land-use types at nest sites and random sites (+ standard error) within ecoregions.
0
150
300
450
600
750
Mea
n D
ista
nce
to W
ater
(m)
Ran
dom
Nes
t
Ran
dom
Nes
t
Ran
dom
Nes
t
Ran
dom
Nes
t
Prairie Tallgrass Eastern Laurentian
4.5
5.0
5.5
6.0
6.5
Mea
n N
umbe
r of L
and-
use
Type
s in
100
0 m
Ran
dom
Nes
t
Ran
dom
Nes
t
Ran
dom
Nes
t
Ran
dom
Nes
t
Prairie Tallgrass Eastern Laurentian

63
Figure 20. Density of roads at nest sites and random sites (+ standard error) within ecoregions.
Figure 21. Density of houses at nest sites and random sites (+ standard error) within ecoregions.
2
3
4
5
6
7
8
Mea
n N
umbe
r of R
oads
with
in 1
000
m
Ran
dom
Nes
t
Ran
dom
Nes
t
Ran
dom
Nes
t
Ran
dom
Nes
t
Prairie Tallgrass Eastern Laurentian
0
5
10
15
20
25
30
Mea
n N
umbe
r of H
ouse
s w
ithin
100
0 m
Ran
dom
Nes
t
Ran
dom
Nes
t
Ran
dom
Nes
t
Ran
dom
Nes
t
Prairie Tallgrass Eastern Laurentian

64
Figure 22. Mean distance bald eagle nests were located from the nearest terrestrial edge (+ standard error).
Table 10. Characteristics of nest trees, random sites, and their associated stand trees
Variable or Tree Species
Nest Sites (n =120)
Nest Tree Stand
Random Sites (n = 166)
Mid pt. Stand
All Sites
Combined Mean Diameter
(SE) 51.56 (2.97)
31.41 (0.83)
30.33 (0.80)
27.30 (0.56)
34.22 (0.99)
Mean Height (SE)
23.99 (0.52)
18.55 (0.39)
17.22 (0.34)
15.97 (0.29)
18.59 (0.30)
Species (% of total species)
12 (31.0)
30 (78.9)
16 (42.1)
29 (76.3)
38 (100)
Number of Trees (% of total trees)
120 (5.1)
865 (36.8)
162 (6.9)
1206 (51.3)
2353 (100)
Nests were farther from the nearest house and slightly farther from the
nearest road than random sites. However, the density of houses was greater for
0
1000
2000
Mea
n D
ista
nce
to T
erre
stria
l Edg
e (m
)
Ran
dom
Nes
t
Ran
dom
Nes
t
Ran
dom
Nes
t
Ran
dom
Nes
t
Prairie Tallgrass Eastern Laurentian

65
nest sites than random sites, and the distance to the nearest urban area was less
for nest sites. Eagles chose sites close to a terrestrial edge (Fig. 22).
Tree height (Fig. 16) might appear to be an important factor, but it is
confounded with tree diameter, making its importance is misleading. This issue
will be developed further in the next section. Mean nest tree diameter was much
greater than the diameter of either trees in the surrounding stand or random site
trees. The mean tree height between these groups was similar. Tree height was
slightly greater for nest trees, but this represented a small difference. Tree
diameter (Fig. 17) and distance to water (Fig. 18) represented the only valid
univariate differences between nest sites and random sites that would show
statistical significance overall (if that were considered a valid approach, see
Appropriate Statistical Methodology in Methods and Materials section). Nest trees
were much larger in diameter than either the trees in the surrounding stand or the
trees sampled at random sites (Fig. 23).
Removing the ecoregion variable from the analysis allowed trends that were
more important for management of nesting habitat across a broader range to
become evident. Nest sites and random sites were similar in their distances from
most of the human presence variables measured (Figs. 24-27). Distance to the
nearest house (Fig. 24) showed the largest difference with nest sites being farther
from houses than random sites. However, the density of houses (Fig. 27), roads
(Fig. 28), and land-use types (Fig. 29) associated with each site was similar for
nest sites and random sites.

66
Figure 23. Mean height and diameter of bald eagle nest trees, trees within the surrounding stand, and trees at random sites (+ standard error).
Figure 24. Mean distance bald eagle nest sites and random sites were located from the nearest house (+ standard error).
Size of nest trees versus trees in surrounding stand and trees at random sites
0
10
20
30
40
50
60
Mean Diameter Mean Height
Uni
t of M
easu
re
Nest Tree Nest Stand Random Sites
Distance from site to nearest house
0
1000
2000
3000
4000
5000
6000
7000
8000
Dis
tanc
e (m
)
Nest Sites Random Sites

67
Figure 25. Mean density of houses within 1,000 m of bald eagle nest sites and random sites (+ standard error).
Figure 26. Mean density of roads within 1,000 m of bald eagle nest sites and random sites (+ standard error).
Density of roads within 1,000 m of nest sites and random sites
3
3.5
4
4.5
5
5.5
6
Num
ber o
f roa
ds w
ithin
1,0
00m
Density of houses within 1,000 m of nest sites and random sites
0
2
4
6
8
10
12
14
16
18
Num
ber o
f Hou
ses
with
in 1
,000
m
Nest Sites Random Sites
Nest Sites Random Sites

68
Figure 27. Mean distance bald eagle nest sites and random sites were located from the nearest urban area (+ standard error).
Figure 28. Mean density of land-use types within 1,000 m of bald eagle nest sites and random sites (+ standard error).
Distance from site to nearest urban area
0
2000
4000
6000
8000
10000
12000
14000
Dis
tanc
e (m
)
Density of Landuse Types within 1,000 m of nest and random sites
4.8
4.9
5
5.1
5.2
5.3
5.4
5.5
5.6
5.7
Num
ber o
f Lan
duse
Typ
es w
ithin
1,0
00 m
-
Nest Sites Random Sites
Nest Sites Random Sites

69
\
Figure 29. Mean distance bald eagle nest sites and random sites were located from the nearest body of water (+ standard error).
Bald eagle nests were located closer to terrestrial edges than random sites
(Fig. 30). In many cases, nests were located within 20 m of an open edge. This
suggests that bald eagles do not require large tracts of continuous forests. Eagles
are large-bodied birds and may choose nest sites close to edges to take
advantage of open flight lanes. Sample nests were located closer to other active
nests than random sites (Fig. 31). This was primarily because of high-density
nesting locations in some parts of the state. High-density nesting is likely
associated with quality food sources.
Discriminant Analysis
Multivariate analyses were utilized to examine correlations between habitat
variables and productivity, and to determine multi-dimensional differences between
Distance from site to nearest body of water
0
100
200
300
400
500
600
Dis
tanc
e (m
)
Nest Sites Random Sites
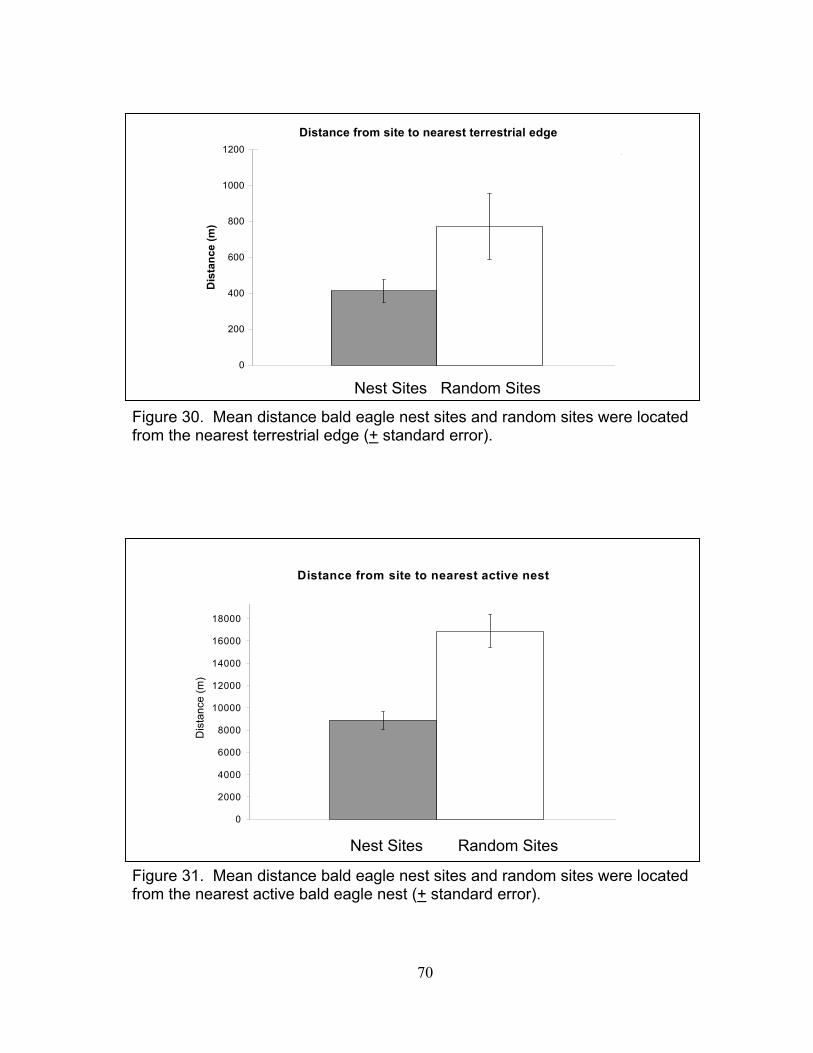
70
Figure 30. Mean distance bald eagle nest sites and random sites were located from the nearest terrestrial edge (+ standard error).
Figure 31. Mean distance bald eagle nest sites and random sites were located from the nearest active bald eagle nest (+ standard error).
Distance from site to nearest active nest
0
2000
4000
6000
8000
10000
12000
14000
16000
18000
20000
Dis
tanc
e (m
)
Distance from site to nearest terrestrial edge
0
200
400
600
800
1000
1200
Dis
tanc
e (m
)
Nest Sites Random Sites
Nest Sites Random Sites

71
nest sites and random sites. For multivariate analyses in this study, it was
necessary to examine the data as two separate sets. The first set was the entire
body of data collected at random sites and nest sites. The second set consisted of
data gathered at only nest sites. Each multivariate analysis utilized a separate,
reduced list of variables. In other words, within each data set, each variable was
intensely screened in order to obtain a short list of variables that were not
confounded with other variables and that had appropriately distributed ranges to
be analytically meaningful.
Data for the productivity modeling process consisted of only nest sites,
while comparing nest sites and random sites utilized a data set comprised of nest
site and random site data. Variables were separately screened for multiple
correlations for Discriminant Analysis (Appendix F) and for productivity modeling
(Appendix G). Variables were separately screened for limited range distributions
for Discriminant Analysis (Appendix H) and for productivity modeling (Appendix I).
Variables that possessed an appropriate range distribution and that were not
tightly correlated to other variables were selected for use in the associated
multivariate process.
Discriminant Function Analysis (DFA) is a technique used for assessing the
differences between pre-defined groups, in this case nest sites and random sites.
DFA is comprised of both descriptive and predictive sections, making it ideal for
examining separations in data sets containing a categorical grouping variable such
as nesting activity. The measured variables were rigorously screened before
being selected as potential discriminating variables. The measured variables and

72
their reasons for acceptance or removal from the preliminary procedures of DFA
are shown in Table 11.
Table 11. Acceptance or exclusion status of variables for Discriminant Analysis Variable Acceptance Status
Species Excluded: multiple correlations
Nest Tree Height Excluded: multiple correlations
Nest Tree Diameter Accepted with loge transformation
Canopy Elevation Excluded: difficult to measure in the field
Stand Diameter Excluded: multiple correlations
Stand Height Accepted with loge transformation
Distance to Active Nest Accepted with loge transformation
Distance to Shoreline Accepted with loge transformation
Distance to Roads Accepted with loge transformation
Density of Roads Excluded: multiple correlations
Distance to House Excluded: multiple correlations
Density of Houses Accepted
Distance to Urban Accepted
Distance to Forest Excluded: distribution showed few extreme values
Distance to Grassland Accepted with loge transformation: Combined to form Distance to Terrestrial Edge
Distance to Bog Excluded: distribution showed few extreme values
Distance to Brushland Accepted with loge transformation: Combined to form Distance to Terrestrial Edge
Distance to Cultivation Accepted with loge transformation: Combined to form Distance to Terrestrial Edge
Density of Land-use Types Accepted

73
Discrimination between nest sites and random sites using the selected
explanatory variables (Table 11) was possible (Fig. 32). Nest sites and random
sites were clearly represented as separate, non-overlapping circles. The length
and direction of Eigenvectors represent the relationships among variables. A
strong association existed between nest sites and trees with large diameters. In
other words, the diameter of trees (also see Table 10 and Fig. 23) was a
discriminating variable with larger trees observed at nest sites. A strong
association was also observed for random sites and greater distances to
shorelines. Other variables including the distance to the nearest terrestrial edge
and the height of stand trees had weak associations with nest sites.
Figure 32. Canonical Plot showing the most important variables for discriminating nest sites and random sites (Exploration Set).
4
5
6
7
8
9
Nest Random
Stand Height(m)
DBH Edge
Water
Active Nest
1 2 3 4 5 6 7 8 9 10 11Canonical1
12.83% Misclassified

74
The Validation Set was analyzed to evaluate the utility of the discriminant
function. The discriminant function was successful in discriminating between nest
sites and random sites using the Validation Set (Fig. 33). Discriminant Analysis
was then conducted utilizing only the two most important variables (Tree Diameter
and Distance to Water). These two variables were nearly as successful in
discriminating between nest sites and random sites (Fig. 34) as the full model (Fig.
33). Therefore, the most important differences between nest sites and random
sites appear to be diameter of trees and distance from the shoreline.
Figure 33. Canonical Plot showing the most important variables for discriminating between nest sites and random sites (Validation Set).
7
8
9
10
11
12
NestRandom
Stand Height
DBHWater
EDGE
5 6 7 8 9 10 11 12Canonical1
16.67% Misclassified

75
Figure 34. Canonical Plot showing the distance to water and tree diameter discriminating between nest sites and random sites (Validation Set). Productivity Modeling
Model selection techniques were employed to determine the effects of
habitat features on productivity. Variables were rigorously screened as described
previously. The process consisted of four steps. The first three were (1) reducing
overlapping and biologically unimportant variables, (2) eliminating variables with
limited range distribution, and (3) eliminating variables with many correlations.
Each measured variable and the reasons for exclusion or acceptance from the first
three steps are reported in Table 12.
After the initial three screening steps, the accepted variables were
examined to determine any interactions among the variables using Mallow’s
9
10
11
12
13
14
Nest Random
WaterDBH
-9 -8 -7 -6 -5 -4Canonical1
16.67% Misclassified

76
Table 12. Reasons for accepting or rejecting measured variables for Model Selection Analysis
Variable Acceptance Status
Nest Height Excluded: correlations and distribution
Nest to top Accepted with loge transformation
Species Excluded: correlations, confounding factor
Nest Tree Height Excluded: confounding correlations
Nest Tree Diameter Accepted with loge transformation
Canopy Elevation Excluded: difficult to measure in the field
Stand Diameter Accepted with loge transformation
Stand Height Excluded: distribution showed few extreme values
Distance to Active Nest Accepted with loge transformation
Distance to Shoreline Accepted with loge transformation
Distance to Roads Excluded: confounding correlations
Density of Roads Accepted
Distance to House Accepted with loge transformation
Density of Houses Excluded: distribution showed few extreme values
Distance to Urban Accepted
Distance to Forest Excluded: distribution showed few extreme values
Distance to Grassland Accepted with loge transformation
Distance to Bog Excluded: distribution showed few extreme values
Distance to Brushland Excluded: confounding correlations
Distance to Cultivation Accepted with loge transformation
Density of Land-use Types Accepted

77
Selection Criterion. The important variables and interactions developed with
Mallow’s Selection Criterion were used to develop the final candidate set of models
(Table 13). Although some of the listed variables (Table 12) appeared to offer
some information about the system and were accepted to be examined with
Mallow’s Selection Criterion, not all of them provided support for inclusion in the
candidate set. The candidate set of models created using the results of Mallow’s
Selection Criterion was then ranked in order of importance as described in the next
section.
AICc values and their associated log-likelihood values were calculated to
determine the best approximating models for the data set (Table 14). AIC provides
a method for evaluating the likelihood of a model given the data and comparing the
usefulness of multiple models. AIC uses maximum likelihood estimation to rank
the models in the candidate set in order of importance. It is unlikely that one
model is the single best model for the system. Therefore, it is usually necessary to
acknowledge several models that represent the system well.
For this data set, it was appropriate to use AICc (a correction for smaller
sample sizes) rather than AIC because the n/K ratio (ratio of number of sample
and number of parameters in our models) was relatively small (Burnham &
Anderson 2002). The AIC Wi-values (Akaike weights) were essential for
comparing the relative importance of the models. Larger Akaike weights
represented a greater likelihood of the model being the best in the Candidate Set.
The number of estimable parameters in the model was designated as K.

78
Table 13. The Candidate Set of Models used for Information-theoretic Model Selection Model Model Description
E(y) = Bo + B1(lnStandDBH) + B2(lnDGrass) + B3 (lnStandDBH*lnDGrass)
Diameter of Stand Trees and Distance to Grassland
E(y) = Bo + B1(Nland1000) Density of Land-use Types within 1000 m
E(y) = Bo + B1(lnDGrass) Distance to Grassland
E(y) = Bo + B1(lnDBH) Nest Tree Diameter E(y) = Bo + B1(lnDBH) + B2(lnDGrass) + B3 (lnDBH*lnDGrass)
Nest Tree Diameter and Distance to Grassland
E(y) = Bo + B1(lnDBH) + B2(Nland1000) + B3(lnDBH*Nland1000)
Nest Tree Diameter and Density of Land-use Types within 1000 m
Table 14. AIC-values for models describing effects of habitat features on productivity
Model Cp r2 LogL K AICc Delta AICc
Wi
Diameter Stand Trees and Distance to Grassland
-1.938 0.054 -171.26 5 353.046 0 0.6006
Density of Land-use Types within 1000 m
-2.688 0.040 -174.88 3 355.9732 2.9268 0.1390
Distance to Grassland -2.555 0.039 -175.22 3 356.6565 3.6101 0.0988
Nest Tree Diameter -2.115 0.034 -175.34 3 356.8873 3.8409 0.0880 Nest Tree Diameter and Distance to Grassland
-2.763 0.063 -173.96 5 358.4387 5.3926 0.0405
Nest Tree Diameter and Density of Land-use Types within 1000 m
-2.012 0.055 -174.16 5 358.8465 5.8001 0.0330

79
Although the candidate set was selected using the best available
information, none of the resulting models explained more than 7% of the variation
in the system (see r2 values). In other words, productivity did not appear to vary in
response to any of the variables examined, even after careful consideration of the
candidate factors (alone and in combination). Although the first model is the best
model given the Candidate Set, it is still a poor model for productivity, explaining
less than 6% of the variation.
Unusual Nesting Substrate
Many sample nests would have once been termed, “abnormal”, according to
descriptions of bald eagle nest sites in previous studies. In particular, bald eagles
in many areas of Minnesota did not reflect the “wilderness bird” description
depicted by Stalmaster (1987) and others. One nest area possessed many
contrary traits of modern bald eagle nests. Although some aspects of this nesting
territory were highly unusual or represented the initial occurrence for bald eagles,
many aspects are becoming more frequent traits of bald eagle nesting sites in
Minnesota.
Bald eagles typically nest in large coniferous and deciduous trees. In some
areas, bald eagles also nest on cliffs (Arizona, Saskatchewan), pinnacles of rock
(Alaska), on the ground (Northern Canada), rarely on large cacti (California), and
recently in a goose nest tub (Ohio). Nesting attempts on artificial nest platforms
have been observed in some areas. Artificial nests are more readily accepted by
eagles if the structure is a replacement for a nest that was destroyed earlier in the
same breeding season, rather than the structure being erected before the initiation

80
of the season. In many of the cases of alternative nest substrate use, suitable nest
trees were not locally available (see Stalmaster [1987] and Gerrard & Bortolotti
[1988] for nest substrate review).
Bald eagle populations in most areas of Minnesota do not appear to be
limited by suitable nest trees. Eagles in Minnesota take advantage of the
availability of many large trees, such as white pines, red pines, and cottonwoods.
The population has grown dramatically over the past two decades, and currently,
many pairs nest close to human activity. Recently, one pair of eagles in Minnesota
chose an alternative nesting substrate, a high-voltage transmission tower. The
transmission tower provided a flat platform on one end and a perch site 2 m above
the platform on the other end (Fig. 35).
Figure 35. Transmission tower structure used as nesting substrate by bald eagles in western Minnesota.

81
The transmission tower nesting area was located in the western edge of the
Minnesota and nearing “atypical” eagle habitat, characteristic of the western and
southwestern parts of the state. However, there was certainly not a lack of
potential nest trees in this area. The transmission lines at this site were cut directly
through a forested area, leaving a mowed buffer of 30 m on each side of the tower.
It was approximately 730 m from (but within site of) a divided highway, 1250 m
from two small farmhouses, and within 50 m of cattle grazing. The particular tower
chosen for the nest was at the pinnacle of a rounded hill, making the nest the
tallest point in the immediate area. Ospreys frequently nest on transmission
towers and telephone poles, but bald eagles have never been reported to use
these types of structures. Nests assumed to be inhabited by ospreys should be
observed more closely, especially during aerial surveys.
Bald eagles and osprey utilize similar habitats for foraging and nesting.
Bald eagles are very aggressive toward ospreys within their breeding territory.
Continual harassment at nests and klepto-parasitization attempts at foraging sites
by eagles are common and may result in decreased osprey productivity
(Stalmaster 1987). For these reasons, it is uncommon for eagles and ospreys to
nest within close proximity to each other (Mackenzie 1986). However, nesting
attempts at the transmission tower nesting area provide additional information on
the relationship between these two species and allude to possible population
trends in areas where they overlap.
The transmission tower nesting area (Fig. 36) was initially reported in 1995
and censused by the Minnesota Department of Natural Resources in 1995, 1996,

82
1997, and 2000. In three of the four study seasons, bald eagles were active at the
nest site (Nest Site 1) (Fig. 35); however no productivity surveys were conducted
during these years. Information about the nest area was then provided to me for
this study.
Figure 36. Transmission tower nesting area used by bald eagles and ospreys in western Minnesota (Not to scale).
Houses
Pond
Nest Site 1
Nest Site 2
Nest Site 3
Substation
Pasture
Forest
Gravel Road
Divided Highway

83
In 2001, the nest was surveyed from fixed-wing aircraft by Department of
Natural Resources pilot, A. Buchert and J. Grier on 24 April and 28 June. The nest
was active and contained three full-grown bald eagle chicks. The nest was
ground-checked on 10 July. Three full-grown bald eagle chicks were observed on
the nest. A remnant of a nest was located on a nearby transmission tower (Nest
Site 2) within 20 m of a farmhouse. The landowner reported that an osprey had
built a substantial nest structure at that site earlier in the season. The landowner
witnessed an altercation at Nest Site 2 between the osprey and an adult bald eagle
on 15 April. During the altercation, the eagle repeatedly dove at the osprey,
eventually chasing it from the area. The eagle then returned within 5 min. and
destroyed the osprey’s nest by grasping the sticks in its talons and pulling it apart
until only a few sticks remained. An adult eagle was often observed perched at
Nest Site 2 during this breeding season.
In 2002, the nesting area was ground-checked on 3 July. I observed an
active nest at Nest Site 1, with three eagle chicks present, and no nest structure at
Nest Site 2. One nestling flushed from the nest and flew from the area, suggesting
that the juvenile had recently fledged from the nest, which brought the total to three
chicks produced for the second consecutive year.
In 2003, the nest area was ground-checked on 31 July. As soon as visual
contact with Nest Site 1 was made, an adult osprey flushed from the nest and
began an alarm/defense call. The osprey circled, called, and swooped at the
intruding researcher the entire 10 min. period he was within site of the nest.
Although chicks were not visible in the nest, the osprey’s actions were consistent

84
with behaviors related to protecting chicks on a nest. The timing of the visit was
also consistent with the nesting chronology of ospreys, as osprey chicks do not
fledge until mid-August in this area (Dunstan 1973). A large nest was also
observed at Nest Site 2 (Fig. 37) containing two juvenile eagles. Another juvenile
eagle was observed perched in a tree within 30 m of the nest. As the nest was
approached, one juvenile flew to a tree approximately 60 m away. Upon leaving
the area, a third active nest was observed at Nest Site 3. At least three osprey
chicks were visible in this nest, while two adult ospreys circled and called as the
nest was approached. This was the initial nesting attempt recorded at Nest Site 3.
Figure 37. Transmission tower nest site used by bald eagles in western Minnesota during the 2003 breeding season.
Guinn

85
This nesting area is worthy of discussion because of the close nesting
proximity, the unusually high productivity of the nests (Table 15), and the use of
transmission towers by bald eagles. The three active nests were within a total of
1210 m of each other. Nest Site 1 and 2 were within 384 m of each other. The
eagle pair nested at Nest Site 1 between 2000 and 2002, but built and used
another nest at Nest Site 2 in 2003. Nest Site 2 was much closer to houses,
roads, and cattle activities and was in an open cattle pasture. Nest Site 1, on the
other hand, was in a forested area and on the pinnacle of a hill. This pair of eagles
not only chose an artificial nesting substrate, but also moved closer to human
activity and farther from forested areas.
Table 15. Transmission tower nesting area history
Year Nest Site Resident Productivity
2001 1 Bald Eagles 3
2001 2 Osprey Abandoned (chased by eagles)
2001 3 None 0
2002 1 Bald Eagles 3
2002 2 None 0
2002 3 None 0
2003 1 Osprey 3+
2003 2 Bald Eagles 3
2003 3 Osprey 4

86
Distance to Houses The variable Distance to Houses was re-evaluated a posteriori due to
concerns about removing the variable from the Discrimant Analysis when
univariate analyses showed strong differences between nest and random sites.
For example, eagle nests were located much farther from the nearest house than
random sites (Fig. 24). However, the variable was eliminated before the
Discriminant Analysis due to multiple correlations with other variables and limited
range distribution of the data. This variable required additional attention due to its
importance for management strategies. Further development of this variable
included examining differences between productivity, ecoregions, and minimum
nesting distances.
Productivity did not appear to be related to the number of houses within the
Primary Zone (100 m), Secondary Zone (1000 m), and an Intermediate Zone (500
m) of nests (Table 16). Many of the highest productivity values were observed
within high house densities. However, few nests were located within 100 m of
houses (n = 7), four of which had only one house within 100 m. And, no sample
nests were located within 30 m of a house. Although my sampling method did not
detect house density effects on productivity, there appeared to be a minimum
nesting distance for the majority of eagle nests.
The area of the state within which the nest was located may have an effect
on the distance a nest is located from a house because of the varying densities of
houses between the ecoregions. It was assumed that the Laurentian Mixed Forest
Ecoregion would have the greatest mean Distance to Nearest House values

87
Table 16. Productivity ranks in relation to distance to and number of houses Productivity
Rank N Houses within 100 m
Houses within 500 m
Houses within 1000 m
3 6 0 (-) 0.333 (0.2118) 1.667 (0.7601) 4 11 0.091 (0.0909) 2.273 (1.6900) 32.455 (22.9043) 5 21 0.095 (0.0952) 2.333 (1.0336) 11.714 (5.7218) 6 32 0.125 (0.0745) 0.625 (0.1944) 8.313 (3.5711) 7 21 0 (-) 1.000 (0.4254) 5.238 (2.2792) 8 23 0.044 (0.0453) 1.783 (0.9023) 10.957 (4.2512) 9 5 0.400 (0.4) 4.200 (1.4629) 49.000 (25.706)
10 1 1.000 (-) 2.000 (-) 4.000 (-)
because of the large amount of state and federally protected forests in the
northeastern section of the state. Similarly, it was thought that nests in the Eastern
Broadleaf Ecoregion would be observed closest to houses because of the many
developed and urban areas in that part of the state.
However, nests in the Tallgrass Prairie Ecoregion were observed to be
located much farther from houses than in other parts of the state (Fig. 38). Nests
in this area were located primarily in and around the Agassiz National Wildlife
Refuge. This ecoregion was one of the least developed areas of the state, but did
not contain as much public land as the Laurentian Mixed Forest. Nests in the
Laurentian Mixed Forest Ecoregion were located the next farthest distance, while
nests in the Prairie Parkland Ecoregion were located the closest to roads. The
Prairie Parkland Ecoregion was primarily agricultural lands with many section
roads and farm buildings, therefore nests were seldom located a great distance
from a house.

88
Figure 38. Distance eagle nests were located from the nearest house within ecoregions.
The variable Distance to House was re-inserted into the Discriminant
Analysis a posteriori to examine the differences between nest sites and random
sites. When inserted into the Discriminant Analysis, the loge transformed Distance
to House values did not show a strong association with either nest sites or random
sites (Fig. 39). Although the length of the igenvector suggests that the variable
represented some importance to the system, it did not appear to drive the
separation between nest sites and random sites. Distance to water and diameter
of trees remained the most important differences between nest sites and random
sites.
0
5000
10000
15000
20000
25000
Laurentian Eastern Prairie Tallgrass
Dis
tanc
e to
Hou
se (m
)

89
Figure 39. Canonical Plot with Distance to House variable inserted.
4
5
6
7
8
9
Nest Random
Stand Height(m)
DBH Edge
Water
Active Nest
1 2 3 4 5 6 7 8 9 10 11Canonical1
Dist to House
18.54% Mis-classified

90
CHAPTER 5. DISCUSSION, CONCLUSIONS, AND RECOMMENDATIONS Bald eagles in Minnesota utilize many different trees for nesting.
Cottonwoods are more important as nest trees than previously reported for eagles
in the state. This probably reflects the scale of this project. Examining a large
range of habitats enabled the detection of nest tree species other than the pine
trees that have been traditionally reported. The species of trees does not seem to
be important to eagles; rather, selection of the nest tree appears to be driven by
searching for structures based on size (primarily diameter). My data support
Palmer (1988) who reported that the species of nest tree is likely to be an
opportunistic choice. Nests in the northern ecoregions were typically found in
pines, while nests in the southern and western ecoregions were typically located in
cottonwoods or other deciduous trees. The choice of nest tree species
corresponded to the availability and frequency of occurrence of trees in each
ecoregion.
Bald eagles in Minnesota choose the largest trees (as measured in
diameter) available in an area for nesting. Nest trees on average are taller and
larger in diameter than those in the surrounding stand and trees at random sites,
with diameter being the more important of the two variables. Although nest tree
height is slightly greater, my data support both Cornutt and Robertson (1994) and
Wood et al. (1989) who found that nest trees were taller at only 2 of 12 sites and
19 of 98 sites, respectively. On the other hand, nest trees were usually much
bigger in diameter than those in the stand. If fact, once I was inside the tree stand,
searching for large diameter trees became a useful method for finding nests that

91
were otherwise camouflaged from view from the ground. Tree choice is likely
driven by the requirements of supporting a large, heavy nest structure.
There was no evidence that bald eagles require large expanses of
continuous forests for nesting purposes. Several nests were located in isolated
trees on small islands or in small band of trees bordering a lake or river.
Additionally, many other nests were located very close to some type of edge.
Being within close proximity of a body of water appeared important for eagle
nests as suggested by prior studies. Nest sites were located much closer to water
than random sites. This was a powerful trend considering that the random sites
were limited to being within 1,000 m of water by product of my sampling methods.
However, there was no evidence of a trend relating productivity to distance from
shoreline.
Protection of large diameter, older growth trees within 1 km of a water body
may be helpful for nesting eagles as nest sites both for the present and for
potential nest sites in the future. This is especially important as the eagle
population continues to grow and expand into new areas. Large trees seem to be
necessary for nesting eagles. However, most of our sample nest trees were not
“super canopy” trees (Stalmaster 1987, Fraser 1981, Retfalvi 1965). Nest trees at
sample sites were usually one of the tallest, but seldom towered above the
surrounding tree stand. These data are somewhat limited in that only a sample of
trees within 100 m was measured. If every tree in the primary zone were
measured, it is likely that the nest tree would not be the tallest in the zone at many
sites. I often observed trees in the primary zone of comparable height to the nest
92
tree that were not measured because they were not inside of one of the sampling
plots.
Interactions among eagles and defense of breeding territories has been
previously suggested to result in lowered productivity, apparently acting as a
density dependent effect of increasing eagle populations (pers. corresp. Leland
Grim, Voyageur’s National Park, others). Analysis of these data suggested that
nest sites were closer to other active nests than were random sites, therefore there
was little support for a trend relating productivity to the distance to the nearest
active nest. Additional analyses of edge-of-range nests may show that nests on
the edge of a local population have higher productivity than nests within the dense
core of the population, but this study was not designed to detect that situation.
Transmission Tower Nesting Area
The transmission tower nests described in this study were the first
occurrences of the use of transmission towers as nesting substrate by bald eagles;
however, this situation may occur in other areas with similarly designed towers.
There are several possible reasons for bald eagles to use transmission towers as
nest sites in areas where suitable nesting trees exist. (1) Transmission lines are
often cut along ridges between two or more lakes, providing elevated structures
near prime foraging locations. (2) Transmission towers are often larger and taller
than the trees in the immediate area, providing support and tall perches that may
be preferred for displaying or for good visibility of the surrounding area.
(3) Transmission towers offer open flight lanes for large-bodied eagles to approach
and leave the nest. (4) Transmission towers of this design provide stable perch
locations near the nest for adults to watch the nest and for chicks just prior to

93
fledging. For this reason, I believe the design of the transmission tower is
important in that it allows a perch site several meters above the nest.
(5) Transmission towers are much more stable than natural trees. In some areas,
weather damage and disease destroy more than 10% of nest trees each year
(Grier, unpublished data).
This nesting situation may be the result of continued generational
habituation (see Generational Habituation below) by bald eagle populations to
human presence and structures in breeding areas. This nest site is located in an
area with many potential nesting trees. Nesting on transmission towers may offer
a substantial advantage for bald eagles over using traditional tree nests and may
become a more frequent occurrence. Eagles nesting on transmission towers
potentially face the danger of electrocution, but the design of this particular tower
makes that risk slight. No evidence was found to suggest that electrocution had
occurred during any of the study seasons.
Recommendations
Our best approximating models explained only a small percentage of the
variation in the data. This suggests that the variables measured, the best and
most obvious ones for bald eagles, were not good predictors of eagle productivity.
These variables were chosen after careful consideration and provided a thorough
picture of eagle habitat and human presence factors. Previous work (Fraser 1981)
suggested that only 4.5% of nest failures could be attributed to human
disturbances. My data support Fraser (1981) in that human presence near nests
did not appear to have an effect on bald eagle productivity. Eagle habitat was not

94
well defined according to specific features of the habitat within the primary or
secondary zones.
Bald eagles have proven to be more adaptable to different habitats and
human presence levels than previously considered and I do not believe that habitat
or the physical presence of humans, per se, is a limiting factor for nesting bald
eagles in the state of Minnesota. Current effects of human development did not
appear to be limiting for the occurrence of nesting bald eagles. As a consequence,
there are few recommendations for nesting habitat management beyond insuring
the continued existence of large diameter trees within a relatively close distance to
a body of water. However, human development of shoreline property in Minnesota
and other states is increasing and could become important at higher levels in the
future. It should remain a constant concern in spite of the current situation.
The rebound of the eagle population did not result from large changes
(increases) in habitat factors, but most likely occurred from changes in eagle
demographic factors (reproduction and survival). The essential needs for nesting
bald eagles are large trees in which to place a nest in close proximity to lakes or
rivers with an adequate available food source. A landscape comprised of trees
and lakes is the image for which Minnesota has become known, but development
is continually changing the landscape of Minnesota. Aside from habitat factors,
although not a component of this project, it seems obvious that protection of the
species depends most importantly on protection of the birds themselves, through
continuing education of the public and enforcement of established regulations.

95
Generational Habituation
Habituation has been defined as a decrease in an animal’s responsiveness
upon repeated exposure to a stimulus (Hinde 1970). During habituation, an animal
learns not to perform a characteristic behavior because the stimulus has been
shown to be harmless and is not associated with a threat (Clark 1960; Hinde
1970). The adaptive benefit of habituation is a reduction in energy used during
responses to frequently occurring stimuli that have no detrimental effect on the
animal’s welfare. At the same time, significant and/or dangerous stimuli continue
to elicit responses without diminished reactions (Hinde 1970).
Although traditionally thought of as a bird of wilderness areas (Stalmaster
1987; Gerrard & Bortolotti 1988), bald eagles have shown an ability to successfully
nest in areas close to human activity (Fraser et al. 1985). When compared to
several decades ago, bald eagles are currently nesting in relatively high densities
near human presence in many areas of the United States and Canada. Growing
eagle populations and increases in recreation and development along the
shorelines of lakes and rivers within prime eagle habitat have resulted in more
frequent interaction between our species. Many studies have attempted to
quantify habituation of eagles to human activities with varying and often
contrasting results (Mathisen 1968; McEwan & Hirth 1979; Fraser et al. 1985;
Anthony & Isaacs 1989).
The purpose of this section of the dissertation is to address the issue of
possible eagle habituation to human presence over generations of eagles. It may
be important to incorporate a generational habituation hypothesis in future eagle

96
management strategies. Generational habituation concerns particular events
during which habituation is carried over to subsequent generations.
Buehler et al. (1991) suggested that eagles become more tolerant of human
activity as the breeding season progresses. However, individuals that appear
tolerant of human activities may actually be increasing defense and attentiveness
of their young as opposed to defending eggs during the incubation stage, or even
defending an empty nest prior to egg laying. In other words, the adult has invested
more energy in raising a chick to the point of fledging and therefore, may be less
likely to abandon the nest in the presence of similar disturbance. Steidl and
Anthony (1996) found no evidence of eagle habituation to repeated approaches
throughout the breeding season, but agreed with Russel (1980) and Knight and
Knight (1984) that eagles in high human activity areas either habituate to human
presence or relocate to areas with lower levels of human presence.
Animal habituation to human presence, resulting in desensitization to
disturbance over time, is well studied in controlled laboratory environments (Clark
1960; Rushforth 1965; Carew & Kandel 1973; Bonardi et al. 1991). It is important
to recognize that habituation only occurs when human presence is not
accompanied by any harmful activity (Grier 1984). Observations of the acceptance
of human activities near nest sites by some bald eagle pairs led to reports that an
eagle pair becomes habituated to human presence throughout the course of their
lives, or perhaps, during a single breeding season. Previous research has
concentrated on quantifying an eagle’s response to human activity through direct
observations over a limited amount of time.
97
However, the question is not whether a single individual (or breeding pair)
becomes desensitized to human activity. The central issue requires consideration
of eagle responses on a much larger scale. The important question is whether the
bald eagle population is becoming habituated, not just at one finite point in time,
but rather over several generations. In other words, have increasing numbers of
eagles in the population become habituated to human presence over the last three
decades, which has seen a dramatic increase in the number of individuals.
A chick that has hatched and fledged in an area close to human activity will
probably identify with that type of nesting area and choose a similar situation when
it becomes part of the breeding population. The nest-selection image is likely to be
neither innate nor obtained through a period of trial and error, but rather
established while on the nest. The initial step in generational habituation is
imprinting on a nest site and utilizing a similar breeding site later in life. This
process might occur in several ways.
The following example is one hypothetical, but potential situation. A
breeding pair returns to a traditionally wilderness nest site and lays eggs. At the
time of hatching (or, perhaps later in the season), some form of human activity
begins (construction, recreational activity, a seasonal cabin becomes occupied,
etc.). The adults, although possibly annoyed or disturbed by the presence of this
activity, may continue to care for the chicks until after fledging. If the process of
choosing a nest location is acquired by the young through imprinting or some other
learned behavior, and not innately, then the chicks may choose a nest site without
avoiding human activity when they become mature. Chicks from the second

98
generation that are raised in areas of high human activity without negative incident
will likely choose to nest in a similar area when they become adults. The process
continues as successive generations of chicks choose nest sites in close proximity
to human activity.
The generational habituation hypothesis might be testable in an
experimental field project. A study consisting of a group of nests within several
different disturbance regimes could be designed and implemented, with either
naturally occurring or researcher-induced disturbances and exchanging chicks
from different areas of human presence. Generational habituation would be
detected by following chicks from those disturbance regimes until reproductive age
and examining their nest site choices. In reality, however, this study could be
difficult, if not impossible, to see through to completion. Low survival of eagles
entering the breeding population would be a major problem requiring a large
number of chicks within each disturbance regime to be banded. Following juvenile
eagles for 4-5 years until maturity would also be difficult due to logistics, funding,
and technological limitations. In addition, the mechanism controlling a pair’s nest-
site choice is not well understood and would confound the study to a greater
extent. For example, if one gender is responsible for choosing the nest site, the
other gender simply complies. Complexities arise due to collective selection if both
genders contribute.
I suspect that generational habituation of bald eagle populations is
widespread and occurring in many areas of the continent including Minnesota,
where bald eagles are increasingly nesting close to human presence. It is likely

99
that humans no longer pose a strong threat association for bald eagles, as
habituation focuses the attention and energy of the animal on the important
aspects of the environment such as prey and territory defense (Leibrecht & Askew
1980). However, the need for certain protective measures near nest sites is still
necessary as there is a likely a threshold distance for eagle tolerance of human
activity, particularly early in the nesting season.
Generational habituation is not limited to bald eagles, or even to bird
species. Many species thrive in urban areas with constant interactions with human
activity. The adaptation of a species to human presence may be associated with
innate knowledge and/or learned experience. However, there is an important
aspect of learning positioned between these two areas that seems to be
overlooked by many researchers. This type of habituation to human activities is
based on one generation being exposed to human activity at an early age, with
little or no harmful experiences. Behavioral responses to those activities are then
passively “passed on” to the next generation.
Identifying this type of developmental learning at the population level is
more important than quantifying habituation within a single individual. A population
that is undergoing generational habituation is more important, in an ecological and
management sense, than a single individual that has become habituated to a
disturbance. During individual habituation, each individual from every successive
generation must become habituated to human presence. In effect, individual
habituation is the same as starting over with the birth of each new generation. In
generational habituation, each successive generation is more habituated to human

100
presence from the beginning of life because of experience gained by prior
generations. Generational habituation may be responsible for faster changes in
behavioral responses to human activities. Under increasing pressures from
human encroachment and habitat fragmentation, generational habituation may be
a primary means by which animals adapt to human presence.
Future management strategies for bald eagle populations would benefit
from incorporating the generational habituation hypothesis. It is important for
managers to recognize that generational habituation is a continuing process. We
do not believe that eagle populations, at this time, are fully habituated to human
presence, although data collected during this study suggest that eagles do not
avoid areas of human activity. Generational habituation provides a method for
explaining previous trends in eagle biogeography associated with human presence
and predicts future changes in the behavior of individuals of the population.
Limitations of Study
There were two main limitations of this study. (1) Prey densities and
availability potentially may affect productivity. However, it was not within the scope
of this project to examine prey bases for eagles at individual nests. Bald eagles
are considered to be generalists in their prey selection and will readily switch prey;
therefore, they are not especially affected by the loss of particular prey species at
a nest site. A specific prey base likely does not have a large effect on bald eagle
productivity, although more study of that aspect would be useful. (2) Productivity
at any given nest typically varies over time. Although I obtained only two years of
productivity data, I used a very large number of nests and, thus, should have
detected any habitat or human presence effects that were present.

101
Nest distance from houses remains a concern, with no clear relationship
being determined relating productivity and density of houses at several distance
levels. No clear relationship could be determined concerning distance from
houses based and productivity or comparisons between nest sites and random
sites. The issue of nest distance from houses is discussed below (see Future
Research).
Future Research
Further research should investigate the generational habituation hypothesis
and its usefulness in management strategies. Additionally, research should focus
on developing an effective and efficient population-monitoring program for bald
eagles and examining the effects of seasonal changes in human presence on a
landscape scale. The temporal effect of seasonal human activities of humans on
nesting eagles was not within the scope of this project. Eagles may respond
differently to seasonally-active versus continually-active structures. Continuing
development and changes in trends of development may have a greater impact on
bald eagle populations in the future. Currently, bald eagles do not appear to be
limited by the number of nesting areas in Minnesota. However, increased
development of shoreline areas may shift the carrying capacity of the species.
Primary prey sources of bald eagles have been impacted by human
activities in the past and are likely to continue to be locally effected by pollutants
and over harvesting. Bald eagles are opportunistic foragers and have the ability to
change their diet when certain species are not available. However, if prey species
remain available (although somehow compromised by pollutants or disease), bald

102
eagles will likely continue to choose those prey items that are readily available.
Therefore, bioaccumulation of chemical pollutants in prey species remains a
concern for many eagle populations.
Additionally, many diseases have the potential to cause sudden declines in
bird populations. West Nile Virus has recently decimated several bird populations
in Mid-western States and has been observed to cause serious health problems in
captive eagles (pers. corresp. J. Grier). Currently, wild eagle populations do not
appear to be greatly effected by West Nile Virus, although researchers in many
parts of the country are testing eagle populations for the virus. It is essential that
monitoring programs continue in the future to ensure early detection of any sudden
changes in eagle populations.
Bald eagle populations have made a dramatic recovery since the 1960’s
due in part to biological and ecological research, active management strategies,
and the dedication of hundreds of people. The future of the population depends on
protecting and cultivating the public’s opinion, pride, and concern for eagles,
especially for those nesting in close proximity to human presence. In many cases,
wilderness nests are likely receiving sufficient protection through current forestry
management mandates concerning bald eagles. Nests in areas that are
designated as recreational sites or that are located on private land are likely to be
more of a concern. Many eagle pairs appear to have adjusted satisfactorily to
current human presence near nest sites. However, in Minnesota, there is still likely
a threshold distance or disturbance level within which eagles will not nest, but
which was not detected in this study.
103
REFERENCES CITED
Anderson, D. R., K. P. Burnham, and W. L. Thompson. 2000. Null hypothesis testing: problems, prevalence, and an alternative. J. Wildl. Manag. 64:912-923.
Anderson, D. W. and J. J. Hickey. 1972. Egg shell changes in certain North
American birds. Proc. of the 15th International Ornithological Congress, The Hague, Netherlands. Pages 514-540
Andrew, J. M. and J. A. Mosher. 1982. Bald eagle nest site selection and nesting
habitat in Maryland. J. Wildl. Manag. 46:383-390. Anthony, R. G. and F. B. Isaacs. 1989. Characteristics of bald eagle nest sites in
Oregon. J. Wildl. Manag. 53:148-159. Anthony, R. G., R. L. Knight, G. T. Allen, B. R. McClelland, and J. I. Hodges. 1982.
Habitat use by nesting and roosting bald eagles in the Pacific Northwest. Trans. 47th North American Wildlife and Natural Resources Conference, Seattle, Washington. Vol. 48:332-42.
Baker, R., J. Galli, and S. Nelson. 2000. Minnesota bald eagle survey. Nongame
Wildlife Program Report. Minnesota Department of Natural Resources, St. Paul, Minnesota.
Bangs, E. E, T. N. Bailey, and V. D. Berns. 1982. Ecology of nesting bald eagles
on the Kenai National Wildlife Refuge. Alaska. W. N. Ladd and P. F. Schempf, (eds.) Proc. Symposium and workshop on raptor management and biology in Alaska and Western Canada. Fish & Wildlife Service, Anchorage, Alaska. U.S. FWS/AK/proc-82. Pages 47-54
Barth, J. 1999. Unpublished letters from National Wildlife Federation to United
States Fish & Wildlife Service. Bednarz, J. M. 2000. RRF conservation activities. Wingspan 9(1): 6-7. Bonardi, C., D. Guthrie, and G. Hall. 1991. The effect of a retention interval on
habituation of the neophobic response. Animal Learning Behavior 19(1):11-17.
Braun, C. E., F. Hamerstrom, T. Ray, and C. M. White. 1975. Conservation
committee report on status of eagles. Wilson Bull. 87:140-143. Broley, C. L. 1947. Migration and nesting of Florida bald eagles. Wilson Bull. 59:3-
20.

104
Broley, C. L. 1958. The plight of the American bald eagle. Audubon 60:162-71. Broley, M. J. 1952. Eagle man. Pellegrini and Cudahy, New York. Buehler, D. A., T. J. Mersmann, J. D. Fraser, and J. K. D. Seegar. 1991. Effects of
human activity on bald eagle distribution on the northern Chesapeake Bay. J. Wildl. Manag. 55:282-290.
Burnham, K. P. and D. R. Anderson. 2002. Model selection and multi-model
inference: a practical information-theoretic approach. Second edition. Pringer-Verlag, New York.
Canton, E. L., B. R. McClelland, D. A. Patterson, and R. E. Yates. 1992.
Characteristics of foraging perches used by breeding bald eagles in Montana. Wilson Bull. 104:136-142.
Carew, T. J. and E. R. Kandel. 1973. Acquisition and retention of long-term
habituation in Aplysia: correlation of behavioral and cellular processes. Science. Dec 14, 182(4117):1158-60.
Carson, R. I. 1962. Silent Spring. Houghton Mifflin Co., New York. Carver, R. P. 1978. The case against statistical significance testing. Harvard
Educational Review 48:378-399. Clark, R. B. 1960. Habituation of the polychaete Nereis to sudden stimuli: general
properties of the habituation process. Animal Behavior 8:82-91. Cohen, J. 1994. The earth is round (p < .05). American Psychologist 49:997-1003. Cornutt, J. L. and W. B. Robertson, Jr. 1994. Bald eagle nest site characteristics in
South Florida. J. Wildl. Manag. 58(2):218-221. Corr, P. O. 1974. Bald eagle (Haliaeetus leucocephalus alaskanus) nesting related
to forestry in Southeastern Alaska. M. S. Thesis, University of Alaska, Anchorage, Alaska.
Doyle, F. I. 1995. Bald eagle, Haliaeetus leucocephalus, and Northern goshawk,
Accipiter gentilis, nests apparently preyed upon by a wolverine(s), Gulo gulo, in Southwestern Yukon Territory. Canadian-Field Naturalist 109:115-116.
Dunstan, T. C. 1973. Biology of the osprey in Minnesota. Loon 45:108-113. Dunstan, T. C. 1978. Our bald eagle: freedom’s symbol survives. National
Geographic 153:186-99

105
Durham, K. 1981. Injuries to birds of prey caught in leg-hold traps. International Journal for the Study of Animal Problems 26:317-328.
Dzus, E. H. and J. M. Gerrard. 1993. Factors influencing bald eagle densities in
Northcentral Saskatchewan. J. Wildl. Manag. 57:771-778. Edwards, J. G. 1992. The lies of Rachel Carson. 21st Century Science &
Technology Magazine. Summer:41-52. ESRI. 1999. ArcView GIS 3.2. Environmental Systems Research Institute. Neuron
Data, Inc. Evans, D. L. 1982. Status reports on twelve raptors. U.S. Department of the
Interior, Fish & Wildlife Service, Scientific Report No. 238. Fawks, E. 1961. A survey of wintering bald eagles, 1960-61. Iowa Bird Life
31(3):54-60. Fawks, E. 1974. Wintering eagles: our eagle’s future? Proc. of bald eagle days,
February 8-10, 1974. Eagle Valley Environmentalists, Inc. Apple River, IL. Pages 101-103.
Fish & Wildlife Service. 1990. FWS #30181-0-J014. Cooperative agreement
between the Minnesota Department of Natural Resources and the U.S. Fish and Wildlife Service. U.S. FWS, Bloomington, Minnesota.
Fish & Wildlife Service. 1994. Status of bald eagle in lower 48 states. Federal
Register. July 12. Vol. 59 FR 35584. Fish & Wildlife Service. 1995. Final rule to reclassify the bald eagle from
endangered to threatened in all lower 48 states. Federal Register. Vol. 60 No. 133. 50 CFR Part 17 RIN 1018-AC48.
Fish & Wildlife Service. 1999. Proposed rule to remove the bald eagle in the lower
48 states from the list of endangered and threatened wildlife. Federal Register. Vol. 64 (128):36454-36463.
Fischer, D. L. 1985. Piracy behavior of wintering bald eagles. Condor 87:246-251. Fraser, J. D. 1981. The breeding biology and status of the bald eagle on the
Chippewa National Forest, Ph.D. Dissertation, University of Minnesota, St. Paul, Minnesota.
Fraser, J. D., L. D. Frenzel, J. E. Mathisen, F. Martin, and M. E. Shough. 1983.
Scheduling bald eagle reproduction surveys. Wildlife Society Bull. 11(1):13-16.

106
Fraser, J. D., L. D. Frenzel, and J. E. Mathisen. 1985. The impact of human activities on breeding bald eagles in North-central Minnesota. J. Wildl. Manag. 49:885-892.
Fuller, M. R. and J. A. Mosher. 1987. Raptor survey techniques. B. A. Giron
Pendleton. B. A. Millsap, K. W. Cline and D. M. Bird (eds.). Raptor management techniques manual. National Wildlife Federation. Washington, DC. Pages 37-65.
Fyfe, R. W. and R. R. Olendorf. 1976. Minimizing the dangers of nesting studies to
raptors and other sensitive species. Canadian Wildlife Service, Occasional Paper 23.
Gerrard, J. M. and G. R. Bortolotti. 1988. The bald eagle: haunts and habits of a
wilderness monarch. Smithsonian Institute Press, Washington, D.C. Gerrard, J. M., P. N. Gerrard, W. J. Maher, and D. W. A. Whitfield. 1975. Factors
influencing nest site selection of bald eagles in Northern Saskatchewan and Manitoba. Blue Jay 33:169-176.
Green, N. 1985. The bald eagle. R. L. DiSilvestro (ed.), Audubon Wildlife Report
1985. National Audubon Society, New York. Pages 508-531. Grier, J. W. 1969. Bald eagle behavior and productivity responses to climbing
nests. J. Wildl. Manag. 41:438-443. Grier, J. W. 1980. Modeling approaches to bald eagle population dynamics.
Wildlife Society Bull. 8:316-322. Grier, J. W. 1982. Ban of DDT and subsequent recovery of reproduction in bald
eagles. Science 218:1232-1234. Grier, J. W. 1984. Biology of animal behavior. Times Mirror/Mosby College Publ.
St. Louis, Missouri. Grier, J. W., J. M. Gerrard, G. D. Hamilton, and P. A. Gray. 1981. Aerial-visibility
bias and survey techniques for nesting bald eagles in Northwestern Ontario. J. Wildl. Manag. 45(1):83-92.
Grier, J. W., F. J. Gramlich, J. Mattsson, J. E. Mathisen, J. V. Kussman, J. B.
Elder, and N. F. Green. 1983. The bald eagle in the Northern United States. Temple, S.A. (ed.) Bird Conservation, Vol. 1. University of Wisconsin Press, Madison. Pages 41-66.
Griffin, C. R., T. S. Baskett, and R. D. Sparrowe. 1980. Bald eagles and the
management program at Swan Lake National Wildlife Refuge. Trans. of the

107
North American Wildlife and Natural Resources Conference, Seattle, Washington. Vol. 45:252-262.
Grubb, T. G. 1976. A survey and analysis of bald eagles in Western Washington.
M. S. Thesis. University of Washington, Seattle, Washington. Grubb, T. G. and R. M. King. 1991. Assessing human disturbance of breeding bald
eagles with classification tree models. J. Wildl. Manag. 55(3):500-511. Grubb, T. G., W. W. Bowerman, J. P. Giesy, and G. A. Dawson. 1993. Responses
of breeding bald eagles, Haliaeetus leucocephalus, to human activities in Northcentral Michigan. Canadian Field-Naturalist. 106:443-453.
Guinn, J. E. and J. W. Grier. 2002. Bald eagle nest site selection and productivity
related to habitat and human presence in Minnesota. Unpubl. report to USFWS-30 April 2002.
Hackl, V. C. 1994. Site characteristics and spacing of bald eagle nests in Quetico
Provincial Park, Ontario. Honour’s Thesis, Lakehead University, Thunder Bay, Ontario.
Hansen, A. J. 1987. Regulation of bald eagle reproductive rates in Southeast
Alaska. Ecology 68:1387-1392. Hecht, M. M. 2002. Bring back DDT, and Science with it. 21st Century Science &
Technology Magazine. Summer:21-23. Hehnke, M. F. 1973. Nesting ecology and feeding behavior of bald eagles on the
Alaska Peninsula. M. S. Thesis, California State University, Humboldt, California.
Henderson, C. L. , A. L. Lambrecht, J. Anderson, B. Erpelding, J. Galli, K. Haws, J.
Hines, J. Mooty, P. Perry, J. Schladweiler, and J. Schultz. 1977. Traveler’s guide to wildlife in Minnesota. Minnesota Department of Natural Resources, Division of Fish & Wildlife, Nongame Wildlife Program, St. Paul, Minnesota.
Hennes, S. K. 1985. Lead shot ingestion and lead residues in migrant bald eagles
at the Lac Qui Parle Wildlife Management Area, Minnesota. M. S. Thesis, University of Minnesota, St. Paul, Minnesota.
Henny, C. J., M. M. Smith, and V. D. Stotts. 1974. The 1973 distribution and
abundance of breeding ospreys in the Chesapeake Bay. Chesapeake Sci. 15:122-133.
Hensel, R. J. and W. A. Troyer. 1964. Nesting studies of the bald eagle in Alaska.
Condor 66:282-86.

108
Herkert, J. R. (ed.) 1992. Endangered and threatened species of Illinois: status and distribution. Vol. 2: Animal Endangered Species Protection Board.
Hinde, R. A. 1970. Animal Behaviour: A synthesis of ethology and comparative
physiology. 2nd ed. McGraw-Hill, New York. Hodges, J. I., J. G. King, and R. Davies. 1984. Bald eagle breeding population
survey of coastal British Columbia. J. Wildl. Manag. 48:993-998. Howell, J. C. 1941. Bald eagle killed by lightning while incubating its eggs. Wilson
Bull. 53:42-43. Howell, J. C. 1965. Comparison of nesting sites of bald eagles in central Florida
from 1930 to 1965. Auk 84:602-603. Howell, J. C. and G. M. Heinzmann. 1967. Comparison of nesting sites of bald
eagles in central Florida from 1930-1965. Auk 84:602-603. Hunt, W. Grainger, D. E. Driscoll, E. W. Bianchi, and R. E. Jackman. 1992.
Ecology of bald eagles in Arizona. Part B: field studies. Report to U. S. Bureau of Reclamation, Contract 6-CS-30-04470. BioSystems Analysis, Inc., Santa Cruz, California.
Johnson, D. H. 1999. The insignificance of significance testing. J. Wildl. Manag.
63 :763-772. Johnson, D. R. 1981. The study of raptor populations. University Press of Idaho.
Moscow, Idaho. Juenemann, B. E. 1973. Habitat evaluations of selected bald eagle nest sites on
the Chippewa National Forest. M. S. Thesis. University of Minnesota, St. Paul, Minnesota.
Jukes, T. H. 1994. Silent Spring and the betrayal of environmentalism. Fall:47-54. Kaiser, T. E. W. L. Reichel, L. N. Locke, E. Cromartie, A. J. Krynitsky, T. G.
Lamont, B. M. Mulhern, R. M. Prouty, C. J. Stafford, and D. M. Swineford. 1980. Organochlorine pesticide, PCB, and PBB residues and necropsy data for bald eagles from 29 states—1975-1977. Pesticides Monitoring Journal 13:145-149.
King, J. G., F. C. Robards, and C. J. Lensink. 1972. Census of the bald eagle
breeding population in Southeast Alaska. J. Wildl. Manag. 36:1292-1295. Kjos, C. 1992. Bald eagle numbers continue to rise. Endangered Species
Technical Bull. 17(1-2):3-4.

109
Knight, R. L. and S. K. Knight. 1984. Responses of wintering bald eagles to boating activity. J. Wildl. Manag. 48:999-1004.
Krantz, W. C., B. M. Mulhern, G. E. Bagley, A. Sprunt IV, F. J. Ligas, and W.
Robertson, Jr. 1970. Organochlorine and heavy metal residues in bald eagle eggs. Pesticides Monitoring Journal 3:136-140.
Lehman, R. N. 1979. A survey of selected habitat features of 95 bald eagle nest
sites in California. California Department of Fish and Game Report, Sacramento, California.
Lehman, R. N. 1980. A survey of selected habitat features of 95 bald eagle nest
sites in California. California Department of Fish and Game, Wildlife Management Branch Administration Report 79-1, Sacramento, California.
Leibrecht, B. C. and H. R. Askew. 1980. Habituation from a comparative
perspective. M. R. Denny (ed.) Comparative Psychology: an evolutionary analysis of animal behavior. John Wiley and Sons, Inc. New York. Pages 208-229
Livingston, S. A., C. S. Todd, W. B. Krohn, and R. B. Owen, Jr. 1990. Habitat
models for nesting bald eagles in Maine. J. Wildl. Manag. 54:644-653. Mackenzie, J. P. 1986. Birds of the world: birds of prey. Key Porter Books. New
York. Martin, T. E. and J. J. Roper. 1988. Nest predation and nest site selection in a
Western population of the Hermit thrush. Condor 90:51-57. Mathisen, J. E. 1963. The status of the bald eagle on the Chippewa National
Forest. Flicker December:114-117. Mathisen, J. E. 1968. Effects of human disturbance on nesting of bald eagles. J.
Wildl. Manag. 32:1-6. Mathisen, J. E., D. J. Sorenson, L. D. Frenzel, and T. C. Dunstan. 1977. A
management strategy for bald eagles. Trans. North American Natural Resources Conference 42:86-92.
Matthews, J. R. and C. J. Mosley (eds.) 1990. The official World Wildlife Fund
guide to endangered species of America. Vol. 1. Plants, mammals. Beach Publications, Inc., Washington, D. C.
McClelland, B. R., L. S. Young, D. S. Shea, P. T. McClelland, H. L. Allen, and E. B.
Spettigue. 1981. The bald eagle concentration in Glacier National Park, Montana: origin, growth, and variation in numbers. Living Bird 21:133-155.
110
McEwan, L. C. 1977. Nest site selection and productivity of the Southern bald eagle. Master’s Thesis. University of Florida, Gainesville, Florida.
McEwan, L. C. and D. H. Hirth. 1979. Southern bald eagle productivity and nest
site selection. J. Wildl. Manag. 43:585-594. McGahan, J. 1968. Ecology of the golden eagle. Auk 85(1):1-12. McGarigal, K., R. G. Anthony, and F. B. Isaacs. 1991. Interactions of humans and
bald eagles on the Columbia River estuary. Wildlife Monographs 115:1-47. McGarigal, K, S. Cushman, and S. Stafford. 2000. Multivariate statisitics for wildlife
and ecology research. Springer-Verlag, New York. McKelvey, R. W. and D. W. Smith. 1979. A black bear in a bald eagle nest.
Murrelet 60:106-107. Minnesota DNR Data Deli. 2001. http//deli.dnr.state.mn.us April-December 2001.
Minnesota Department of Natural Resources, St. Paul, Minnesota. Mulhern, B. M., W. L. Reichel, L. N. Locke, T. G. Lamont, A. Belisle, E. Cromartie,
G. E. Bagley, and R. M. Prouty. 1970. Organochlorine residues and autopsy data from bald eagles 1966-1968. Pesticides Monitoring Journal 4:141-144.
Murphy, J. R. 1965. Nest site selection by the bald eagle in Yellowstone National
Park. Utah Academy Proc. 42(II):261-264. Musselman, T. E. 1949. Concentrations of bald eagles on the Mississippi River at
Hamilton, IL. Auk 66:83. Nash, C., M. Pruett-Jones, and G. T. Allen. 1980. The San Juan Islands bald eagle
nesting survey. Knight, R. L., G. T. Allen, M. V. Stalmaster, and C. W. Servheen (eds.) 1980. Proc. of the Washington Bald Eagle Symposium. Seattle, Washington. Pages 105-115
Nesbitt, S. A., R. R. Roth, and W. B. Robertson, Jr. 1975. The status of the bald
eagle in Florida, 1972-1975. Proc. of the Southeastern Assoc. of Game and Fish Commissioners. 24th Annual Conference. St. Petersburg. Pages 424-428.
Nester, M. R. 1996. An applied statistician's creed. Applied Statistics 45: 401-410. Newton, I. 1979. Population ecology of raptors. Buteo Books, Vermillion, South
Dakota.

111
Nye, P. E. 1977. Ecological relationships of bald eagles on a wintering area in New York state. Master’s Thesis. College of Saint Rose, Albany, New York.
O’Gara, B. W. 1982. Let’s tell the truth about predation. Trans. North American
Wildlife and Natural Resources Conference 47:476-484. Palmer, R. S. (ed.) 1988. Handbook of North American birds. Vol. 4. Yale Univ.
Press, New Haven, Conn. Pattee, O. H. and S. K. Hennes. 1983. Bald eagles and waterfowl: the lead shot
connection. Trans. North American Wildlife and Natural Resources Conference 48:230-237.
Postupalsky, S. 1974. Raptor reproductive success: some problems with methods,
criteria and terminology. Raptor Research Report 2:21-31. Prouty, R. M., W. L. Reichel, L. N. Locke, A. A. Belisle, E. Cromartie, T. E. Kaiser,
T. G. Lamont, B. M. Mulhern, and D. M. Swineford. 1977. Residues of organochlorine pesticides and polychlorinated biphenyls and autopsy data for bald eagles, 1973-74. Pesticides Monitoring Journal 11:134-137.
Redig, P. T., G. E. Duke, and P. Swanson. 1983. The rehabilitation and release of
bald and golden eagles: a review of 245 cases. Bird, D. M. (ed.). 1983. Biology and management of bald eagles and ospreys. Harpell Press, Ste. Anne de Bellevue, Quebec. Pages 137-147.
Reichel, W. L., S. K. Schmeling, E. Cromartie, T. E. Kaiser, A. J. Krynitsky, T. J.
Lamont, B. M. Mulhern, R. M. Prouty, C. J. Stafford, and D. M. Swineford. 1984. Pesticide, PCB, and lead residues and necropsy data for bald eagles from 32 states—1978-81. Environ. Monit. Assess. 4:395-403.
Retfalvi, L. I. 1965. Breeding behavior and feeding habits of the bald eagle
(Haliaeetus leucocephalus l.) on San Juan Island, Washington. M. S. Thesis, Univ. British Columbia, Vancouver, British Columbia, Canada.
Robards, F. C. and J. I. Hodges. 1977. Observations from 2,760 bald eagle nests
in Southeast Alaska. Fish & Wildlife Service, Juneau, Alaska. Rushforth, N. B. 1965. Inhibition of contraction responses of Hydra. Am. Zool.
5:505-513. Russel, D. 1980. Occurrence and human disturbance sensitivity of wintering bald
eagles on the Sauk and Suiattle rivers, Washington. R. L. Knight, G. T. Allen, M. V. Stalmaster, and C. W. Servheen, (eds.) Proc. of the Washington bald eagle symposium, 14-15 June 1980. Seattle, Washington. The Nature Conservancy. Pages 165-174.

112
Seattle Post-Intelligencer. 1983. Watt hunts down eagle killers. 16 June. Seattle,
Washington. Shapiro, A. E., F. Montabano III, and D. Mager 1982. Implications of construction
of a flood control project upon bald eagle nesting activity. Wilson Bull. 94:55-63.
Southern, W. E. 1963. Winter populations, behavior, and seasonal dispersal of
bald eagles in Northwestern Illinois. Wilson Bull. 75:42-55. Southern, W. E. 1964. Additional observations on winter bald eagle populations.
Wilson Bull. 76:121-137. Spencer, D. A. 1976. Wintering of migrant bald eagles in the lower 48 states. Nat.
Agric. Chemicals Assoc. Sprunt, A., IV. 1969. Population trends of the bald eagle in North America. in . J. J.
Hickey (ed.) 1969. Peregrine falcon populations: their biology and decline. University of Wisconsin Press, Madison. Page 347-51.
Sprunt, A. IV and F. J. Ligas. 1966. Continental bald eagle project progress. Rep
3. A Florida notebook. Proc. Natl. Audubon Soc. Conv. 59:2-7. Stalmaster, M. V. 1982. Management strategies for wintering bald eagles in the
Pacific Northwest. R. L. Knight, G. T. Allen, M. V. Stalmaster, and C. W. Servheen(eds.) Proc. Of the Washington Bald Eagle Symp. The Nature Conservancy, Seattle, Wash. Pages 49-67
Stalmaster, M. V. 1987. The Bald Eagle. Universe Books, New York. Steidl, R. J. and R. G. Anthony. 1996. Responses of bald eagles to human
disturbance during the summer in interior Alaska. Ecological Applications 6:482-491.
Stickel, L. F. 1973. Pesticide residue in birds and mammals. Environmental
pollution by pesticides. C. A. Edwards (ed.) Plenum Press, New York. Pages 254-312.
Steenhof, K. 1978. Management of wintering bald eagles. Fish & Wildlife Service
FWS/OBS-79/79. Stone, W.B, P.E. Nye, and J.C. Okoniewski. 2001. Bald eagles killed by trains in
New York state. J. Raptor Research 35:64-65. Swenson, J. E. 1975. Ecology of the bald eagle and osprey in Yellowstone
National Park. M. S. Thesis, Montana State University Bozeman.

113
Thelander, C. G. 1973. Bald eagle reproduction in California, 1972-1973. California
Department of Fish and Game, Administrative Report No. 73-5, Sacramento, California.
Thompson, W. L. http://www.cnr.colostate.edu/~anderson/thompson1.html. Todd, C. S. 1979. The ecology of the bald eagle in Maine. Master’s Thesis,
University of Maine, Orono, Maine. Todd, C. S., L. S. Young, R. B. Owen, Jr., and F. J. Gramlich. 1982. Food habits of
bald eagles in Maine. J. Wildl. Manag. 46:636-645. Watt, J., B. Krausse, and T. M. Tinker. 1995. Bald eagles kleptoparasitizing sea
otters at Amchitka Island, Alaska. Condor 97:588-590. Weekes, F. M. 1974. A survey of bald eagle nesting attempts in Southern Ontario,
1969-1973. Canadian Field Naturalist 88:415-419. Welchsler,. C.A. 1971. The bald eagles of Chippewa. Minnesota Volunteer. July-
Aug. 50-58. Whitfield, D. W. A., J. M. Gerrard, W. J. Maher, and D. W. Davis. 1974. Bald eagle
nesting habitat, density, and reproduction in central Saskatchewan and Manitoba. Canadian Field-Naturalist 88:399-407.
Wood, P. B. 1999. Bald eagle response to boating activity in Northcentral Florida.
J. Raptor Research 33(2):97-101. Wood, P. B., T. C. Edwards, M. W. Collopy. 1989. Characteristics of bald eagle
nesting habitat in Florida. J. Wildl. Manag. 53(2):441-449.

114
APPENDIX A. SCIENTIFIC NAMES FOR ALL SPECIES
COMMON NAME SCIENTIFIC NAME American Crow Corvus brachyrhynchos Bald Eagle Haliaeetus leucocephalus Bison Bos bison Black Bear Ursus americanus Bobcats Lynx rufus Canada Geese Branta canadensis Cottonwood Populus deltoides Golden Eagle Aquila chrysaetos Green Ash Fraxinus pennsylvanica Gulls Larus sp. Kokanee Salmon Oncorhynchus nerka Magpies Pica sp. Osprey Pandion haliaetus Paper Birch Betula papyrifera Quaking Aspen Populus tremuloides Raccoon Procyon lotor Red Pine Pinus resinosa Salmon Oncorhynchus and Salmon sp. Silver Maple Acer saccharinum Slippery Elm Ulmus rubra Sugar Maple Acer saccharum White Oak Quercus alba White Pine Pinus strobus White Poplar Populus alba Wolverines Gulo gulo

115
APPENDIX B. LAND-USE DATA INFORMATION
Minnesota Land Use and Cover - A 1990's Census of the Land This data set integrates six different source data sets to provide a simplified
overall view of Minnesota's land-use / cover. The six source data sets covered
different parts of the state, were in differing formats, and used different legend
classifications. The Minnesota Department of Natural Resources developed a
simplified 8-category legend and translated each source data set's original detailed
classification into the 8-category system. They also standardized the data to 30-
meter grid cells.
Categories 1 - Urban and Rural Development 2 - Cultivated Land 3 - Hay/Pasture/Grassland 4 - Brushland 5 - Forested 6 - Water 7 - Bog/Marsh/Fen 8 - Mining 9 - Unclassified Source: Minnesota Department of Natural Resources. 2000. Minnesota.data, vol. 1 and 2. State of Minnesota, St. Paul, MN 55155.

116
APPENDIX C. DATA FORM FOR PRIMARY ZONE ANALYSIS
Minnesota Bald Eagle Nest Habitat Survey—Field Survey Data #_____ Lat_________ Long__________ Date _____ Log.______________________________________________ Nest: grnd2:_____ 2top______ cond.________ comm._________________________________________________ Nest Tree: species______ height ________ dbh________ cond.___________ elev.___________________________ Nest Site:________________________________________________________ ________________________________________________________________ Surr Area: canopy______ Description __________________________________ Site 1: dir______ dist______ _________________________________________________________________ _________________________________________________________________ Site 2: dir______ dist______ __________________________________________________________________ __________________________________________________________________ Site 3: dir______ dist______ __________________________________________________________________ __________________________________________________________________ Human dist: __________________________________________________________________ Nearby Nest:____________ Shoreline: dist_________ dir___________ description_________________________________________________________ Additional Comments:

117
APPENDIX D. DATA FORM FOR SECONDARY ZONE EVALUATION
Variable Number Cat. < 100m Cat. <500m Cat. <1,000m Cat.Landuse Types {X} {X}
Number of Roads {X} {X} Number of Houses {X} {X} {X} {X} {X}
Distance to Nearest Road {X} {X} {X} {X} {X} {X}Distance to Nearest House {X} {X} {X} {X} {X} {X} {X}Distance to Nearest Lake {X} {X} {X} {X} {X} {X} {X}Distance to Nearest River {X} {X} {X} {X} {X} {X} {X}
Distance to Nearest Railroad {X} {X} {X} {X} {X} {X} {X}Distance to Nearest Urban Area
(as designated by city roads) {X} {X} {X} {X} {X} {X} {X}
Distance to Nearest Cultivated Land (brownish) {X} {X} {X} {X} {X} {X} {X}
Distance to Nearest Hay, Pasture, Grassland
(orangish)
{X} {X} {X} {X} {X} {X} {X}
Distance to Nearest Brushland (greenish) {X} {X} {X} {X} {X} {X} {X}
Distance to Nearest Forest (dark blue) {X} {X} {X} {X} {X} {X} {X}
Distance to Nearest Bog, Marsh, Fen
(purple) {X} {X} {X} {X} {X} {X} {X}
Distance to Nearest Mining (white) {X} {X} {X} {X} {X} {X} {X}
Amount of Urban/Rural Devel. (pale yellow) {X} {X} {X} {X} {X}
Amount of Cultivated Land (brownish) {X} {X} {X} {X} {X}
Amount of Hay, Pasture, Grassland (orangish) {X} {X} {X} {X} {X}
Amount of Brushland (greenish) {X} {X} {X} {X} {X}
Amount of Forest (dark blue) {X} {X} {X} {X} {X}
Amount of Water (light blue) {X} {X} {X} {X} {X}
Amount of Bog, Marsh, Fen (purple) {X} {X} {X} {X} {X}
Amount of Mining (white) {X} {X} {X} {X} {X}
Amount of Roads {X} {X} {X} {X} {X}Distance to Other {X} {X} {X} {X} {X} {X} {X}Distance to Other {X} {X} {X} {X} {X} {X} {X}
Distance to Nearest Active Nest {X} {X} {X} {X} {X} {X} {X}

118
APPENDIX E. SAS PROGRAM CODE FOR VARIABLE EVALUATION AND PRODUCTIVITY MODELING
PROC UNIVARIATE DATA=Eagle PLOT; VAR NestorRandom Dwater lnDwater DBH lnDBH Height lnHeight StandDBH lnStandDBH StandHeight lnStandHeight Nland1000 lnNland1000 Nroads1000 lnNroads1000 Nhouses1000 lnNhouses1000 droad lndroad dhouse lndhouse Durban lnDurban Dcultv lnDcultv Dgrass lnDgrass Dactive lnDactive Dforest lnDforest; RUN; PROC CORR DATA=Eagle; VAR NestorRandom Dwater lnDwater DBH lnDBH Height lnHeight StandDBH lnStandDBH StandHeight lnStandHeight Nland1000 lnNland1000 Nroads1000 lnNroads1000 Nhouses1000 lnNhouses1000 droad lndroad dhouse lndhouse Durban lnDurban Dcultv lnDcultv Dgrass lnDgrass Dactive lnDactive Dforest lnDforest; RUN; PROC REG DATA=eagle; TITLE 'MODEL ALL POSSIBLE'; MODEL ProdRank = lnNtoTop lnDWater lnDBH lnStandDBH Nland1000 NRoads1000 lnDhouse Durban lnDCultv lnDGrass lnDactive / selection = cp; RUN; ***** TAKE THE BEST MODELS FROM ABOVE AND RUN THROUGH GENMOD TO GET LOG-LIKELIHOOD VALUES.********** PROC GENMOD DATA=eagle; TITLE 'MODEL lnDiameter lnDistancetoGrassland'; MODEL ProdRank = lnDBH lnDGrass / DIST=NORMAL LINK=ID P; PROC GENMOD DATA=eagle; TITLE 'MODEL DensityofLanduseTypes'; MODEL ProdRank = Nland1000 / DIST=NORMAL LINK=ID P; PROC GENMOD DATA=eagle; TITLE 'MODEL lnDistancetoGrassland'; MODEL ProdRank = lnDGrass / DIST=NORMAL LINK=ID P; PROC GENMOD DATA=eagle; TITLE 'MODEL lnDiameter'; MODEL ProdRank = lnDBH / DIST=NORMAL LINK=ID P; PROC GENMOD DATA=eagle; TITLE 'MODEL lndiameter DensityoflanduseTypes';

119
MODEL ProdRank = lnDBH Nland1000 / DIST=NORMAL LINK=ID P; PROC GENMOD DATA=eagle; TITLE 'MODEL lnStandDiameter lnDistancetoGrassland'; MODEL ProdRank = lnStandDBH lnDGrass / DIST=NORMAL LINK=ID P; RUN;

120
APPENDIX F. MULTI-CORRELATION SCREENING OF VARIABLES FOR DISCRIMINANT ANALYSIS
Table 17 presents pairwise correlation coefficients and significant
correlations between each variable. Coefficients summarize the strength of the
linear relationship between each response variable. These data were used in
screening variables for Discriminant Analysis. Significant probabilities are
arranged in descending order. Values less than 0.05 are highly correlated.
Table 17. Evaluation of variables for Discriminant Analysis
VARIABLE BY VARIABLE CORRELATION SIGN. PROB. Landuse 1000m Distance to Forest (m) 0.00023585 0.99685394 Roads 1000m Stand Diameter (cm) -0.0014297 0.98093083
Stand Diameter (cm) Nest to Top Distance (m) -0.0028308 0.97552063 Distance to Nearest Nest (m) Tree DBH (cm) -0.0022357 0.97018377 Distance to Nearest House
(m) Tree Height (m) 0.00308786 0.95882848
Roads 1000m Distance to Brushland (m) -0.0036715 0.95105611 Distance to Nearest Nest (m) Distance to Brushland (m) 0.00372455 0.95034918
Houses 1000m Tree Height (m) 0.00389145 0.94812733 Roads 1000m Nest Height (m) -0.0066751 0.94231715
Distance to Terrestrial Edge (m) Tree Height (m) 0.00435384 0.94197397
Distance to Water (m) Distance to Cultivation (m) 0.00609958 0.91877624 Houses 1000m Distance to Bog (m) -0.0063919 0.91489808
Distance to Water (m) Distance to Railroad (m) -0.0064635 0.91394775 Distance to Brushland (m) Stand Height (m) 0.0067812 0.9097362 Distance to Nearest House
(m) Stand Diameter (cm) -0.0072124 0.90402281
Distance to Bog (m) Nest to Top Distance (m) -0.0123118 0.89382763 Distance to Water (m) Distance to Bog (m) -0.0090191 0.88014381
Distance to Railroad (m) Tree DBH (cm) -0.0101522 0.8652218 Distance to Brushland (m) Distance to Railroad (m) -0.0104216 0.86167986
Roads 1000m Distance to Water (m) 0.01204538 0.84039738 Tree DBH (cm) Nest Height (m) -0.0203732 0.82519808 Houses 1000m Stand Height (m) -0.0135928 0.82022267
Stand Height (m) Nest to Top Distance (m) 0.02186671 0.81261106 Distance to Bog (m) Stand Diameter (cm) -0.0146895 0.80599469
Distance to Nearest House (m) Tree DBH (cm) 0.01565975 0.79346028
Distance to Bog (m) Distance to Nearest Roads (m) -0.0158253 0.79132718
Distance to Water (m) Distance to Brushland (m) -0.016023 0.78878118 Distance to Forest (m) Nest to Top Distance (m) -0.0286399 0.75616998
Houses 1000m Stand Diameter (cm) 0.02047793 0.73205634

121
VARIABLE BY VARIABLE CORRELATION SIGN. PROB. Landuse 1000m Tree Height (m) -0.0209752 0.72580819
Distance to Railroad (m) Stand Height (m) -0.0211082 0.72413963 Distance to Brushland (m) Stand Diameter (cm) 0.02142496 0.72017164
Roads 1000m Tree DBH (cm) -0.0217766 0.71577599 Distance to Nearest Nest (m) Stand Diameter (cm) -0.0240124 0.68804902
Distance to Brushland (m) Tree Height (m) -0.024519 0.68182316 Roads 1000m Nest to Top Distance (m) -0.0418776 0.64972535 Houses 1000m Nest to Top Distance (m) -0.0425151 0.64475335
Distance to Bog (m) Tree DBH (cm) 0.0281115 0.63830611 Distance to Cultivation (m) Nest to Top Distance (m) 0.04417577 0.6318745 Distance to Nearest Roads
(m) Stand Diameter (cm) 0.02926256 0.62461228
Houses 1000m Tree DBH (cm) 0.02940296 0.62295064
Landuse 1000m Distance to Nearest Nest (m) -0.0312137 0.60169334
Distance to Water (m) Nest Height (m) 0.04945014 0.59171149
Distance to Brushland (m) Distance to Nearest House (m) -0.0320999 0.59141077
Distance to Water (m) Distance to Forest (m) -0.0354069 0.55376535
Distance to Water (m) Distance to Nearest Roads (m) -0.0357438 0.54999676
Houses 1000m Nest Height (m) -0.0555856 0.54650704
Distance to Water (m) Distance to Terrestrial Edge (m) 0.03701654 0.53587376
Roads 1000m Distance to Nearest Nest (m) 0.0370461 0.53554801
Distance to Forest (m) Stand Diameter (cm) 0.03842204 0.52049197 Distance to Nearest Roads
(m) Nest to Top Distance (m) 0.06007818 0.51451467
Distance to Nearest Roads (m) Nest Height (m) -0.0603392 0.51268569
Stand Diameter (cm) Nest Height (m) 0.06283013 0.49540366 Houses 1000m Distance to Forest (m) -0.0409894 0.49299096 Houses 1000m Distance to Grassland (m) -0.0420331 0.48203615
Distance to Forest (m) Tree DBH (cm) 0.04256564 0.47649796 Distance to City Roads (m) Nest to Top Distance (m) 0.06632541 0.47168099
Distance to Water (m) Distance to Grassland (m) 0.04306778 0.4713077
Houses 1000m Distance to Terrestrial Edge (m) -0.043722 0.46459191
Nest to Top Distance (m) Nest Height (m) -0.0689634 0.4541943 Distance to Brushland (m) Nest Height (m) -0.0727205 0.42992437 Distance to Nearest Roads
(m) Tree DBH (cm) 0.04894697 0.4129009
Distance to Nearest Nest (m) Nest to Top Distance (m) -0.0778868 0.39779733 Distance to Railroad (m) Stand Diameter (cm) -0.0518442 0.38576173
Landuse 1000m Stand Height (m) -0.0518521 0.38568987
Distance to Forest (m) Distance to Nearest Roads (m) -0.0521955 0.38254622
Distance to Forest (m) Distance to Grassland (m) -0.0540692 0.36567444 Distance to Railroad (m) Nest to Top Distance (m) 0.08804952 0.33892203
Distance to Nearest House (m) Nest to Top Distance (m) -0.0901989 0.32721658
Distance to Forest (m) Distance to Nearest House (m) -0.0589674 0.32379416
Distance to Railroad (m) Nest Height (m) 0.09084674 0.32373966
Table 17. (continued)

122
VARIABLE BY VARIABLE CORRELATION SIGN. PROB. Distance to Brushland (m) Distance to City Roads (m) 0.05959743 0.31864197
Distance to Bog (m) Nest Height (m) -0.0918641 0.31832786 Distance to Grassland (m) Nest to Top Distance (m) 0.09382914 0.30804198
Distance to Bog (m) Tree Height (m) -0.0615321 0.3031571
Distance to Forest (m) Distance to Terrestrial Edge (m) -0.0620233 0.29930663
Distance to Railroad (m) Distance to Nearest House (m) 0.06241628 0.29624913
Distance to Grassland (m) Stand Diameter (cm) -0.0635976 0.28718364 Distance to Terrestrial Edge
(m) Stand Height (m) 0.06655218 0.26533393
Distance to Brushland (m) Distance to Grassland (m) 0.06669159 0.26433182 Distance to Nearest Roads
(m) Tree Height (m) 0.06708716 0.26150272
Distance to Bog (m) Distance to Nearest House (m) -0.0684394 0.25198905
Distance to Nearest Nest (m) Distance to Nearest House (m) -0.0694255 0.24520437
Roads 1000m Distance to Forest (m) -0.0695841 0.24412508
Distance to Nearest Nest (m) Distance to Nearest Roads (m) -0.0696238 0.24385566
Distance to Grassland (m) Tree Height (m) 0.07039727 0.23864398 Distance to Grassland (m) Tree DBH (cm) -0.0706018 0.23727933
Roads 1000m Stand Height (m) -0.0707567 0.23624935 Distance to Nearest Nest (m) Distance to Grassland (m) -0.0715437 0.23106439
Landuse 1000m Nest to Top Distance (m) 0.11090387 0.22785653 Distance to Nearest House
(m) Stand Height (m) 0.07205776 0.22772127
Distance to Forest (m) Nest Height (m) -0.1179483 0.19948564 Distance to Nearest Nest (m) Distance to City Roads (m) -0.0768443 0.19823117
Houses 1000m Distance to Cultivation (m) -0.0782465 0.19014312 Distance to Bog (m) Distance to Grassland (m) -0.0792344 0.18459206
Distance to Nearest Nest (m) Distance to Railroad (m) -0.0793481 0.18396084
Distance to Bog (m) Distance to Terrestrial Edge (m) -0.0811545 0.17414485
Distance to Terrestrial Edge (m) Nest to Top Distance (m) -0.1250203 0.17365947
Houses 1000m Distance to Nearest Roads (m) -0.081532 0.17214387
Distance to Terrestrial Edge (m) Stand Diameter (cm) -0.0818772 0.17032902
Distance to Railroad (m) Tree Height (m) 0.08191703 0.17012033
Distance to Nearest Nest (m) Distance to Terrestrial Edge (m) -0.0829622 0.16471724
Distance to Brushland (m) Nest to Top Distance (m) -0.1285161 0.16184403 Distance to Water (m) Distance to City Roads (m) 0.08551216 0.15207523
Houses 1000m Distance to Railroad (m) -0.0859423 0.15001707 Distance to Water (m) Stand Height (m) -0.0861143 0.1492001
Distance to Terrestrial Edge (m) Tree DBH (cm) -0.0870639 0.14475025
Distance to Cultivation (m) Stand Diameter (cm) -0.0884324 0.138516 Distance to Forest (m) Distance to Cultivation (m) -0.0890625 0.13571557
Distance to City Roads (m) Tree DBH (cm) -0.0891347 0.1353976 Distance to Grassland (m) Stand Height (m) 0.09170619 0.12443839
Houses 1000m Distance to Nearest Nest -0.0923254 0.12190536
Table 17. (continued)

123
VARIABLE BY VARIABLE CORRELATION SIGN. PROB. (m)
Houses 1000m Distance to Brushland (m) 0.09312691 0.11868591 Distance to City Roads (m) Tree Height (m) 0.09382956 0.11591857
Houses 1000m Landuse 1000m 0.09386681 0.11577329
Distance to Brushland (m) Distance to Nearest Roads (m) 0.09435917 0.1138663
Distance to Nearest House (m) Nest Height (m) -0.1467126 0.10982082
Roads 1000m Tree Height (m) -0.0959203 0.10798216 Stand Diameter (cm) Stand Height (m) 0.09633285 0.10646786
Houses 1000m Distance to Water (m) -0.0974297 0.10252304 Distance to Terrestrial Edge
(m) Distance to Nearest House
(m) 0.09816735 0.09993602
Roads 1000m Distance to Bog (m) 0.09950461 0.09537812 Distance to Forest (m) Tree Height (m) -0.1007182 0.09138638 Distance to Bog (m) Stand Height (m) -0.1026265 0.08538113
Distance to Water (m) Nest to Top Distance (m) -0.1589029 0.08300576
Houses 1000m Distance to Nearest House (m) -0.1066249 0.07382719
Distance to Cultivation (m) Tree DBH (cm) -0.1073665 0.07183076 Distance to Grassland (m) Nest Height (m) 0.16932463 0.06448419 Distance to Brushland (m) Distance to Cultivation (m) 0.11098837 0.06270356 Distance to City Roads (m) Stand Diameter (cm) -0.1121309 0.06003044 Distance to Cultivation (m) Nest Height (m) 0.17313743 0.05861344 Distance to Cultivation (m) Tree Height (m) 0.11303671 0.05797877
Stand Height (m) Tree DBH (cm) 0.11408016 0.05568743 Distance to Terrestrial Edge
(m) Nest Height (m) 0.17845582 0.05116329
Landuse 1000m Distance to Bog (m) -0.1172472 0.04918792 Distance to Bog (m) Distance to Cultivation (m) -0.1180961 0.04755752
Landuse 1000m Distance to Railroad (m) -0.1191566 0.04558449 Distance to Nearest Nest (m) Distance to Forest (m) 0.11978168 0.0444541
Distance to Forest (m) Distance to City Roads (m) -0.1209835 0.04234659 Distance to City Roads (m) Nest Height (m) 0.1856596 0.04233643
Distance to Nearest Nest (m) Nest Height (m) -0.1866403 0.04123945
Distance to Water (m) Distance to Nearest House (m) -0.1252242 0.03556978
Distance to Terrestrial Edge (m) Distance to Railroad (m) 0.12673766 0.03338522
Landuse 1000m Nest Height (m) -0.2022657 0.02672781 Distance to Bog (m) Distance to Railroad (m) 0.13245672 0.02613122
Stand Height (m) Nest Height (m) 0.20579384 0.02413609 Distance to Bog (m) Distance to Brushland (m) 0.14190758 0.01710102
Landuse 1000m Tree DBH (cm) 0.14332773 0.01601208 Distance to Nearest Roads
(m) Stand Height (m) 0.1462567 0.01395606
Distance to Railroad (m) Distance to Nearest Roads (m) 0.14765544 0.01305875
Roads 1000m Distance to Grassland (m) -0.1496495 0.01186736 Stand Diameter (cm) Tree Height (m) 0.15243073 0.01036602
Distance to Brushland (m) Tree DBH (cm) 0.15337531 0.0098958 Tree DBH (cm) Nest to Top Distance (m) 0.23540046 0.00964874 Landuse 1000m Stand Diameter (cm) 0.15449953 0.00936087
Distance to Cultivation (m) Distance to Nearest House (m) 0.16115459 0.00668838
Table 17. (continued)
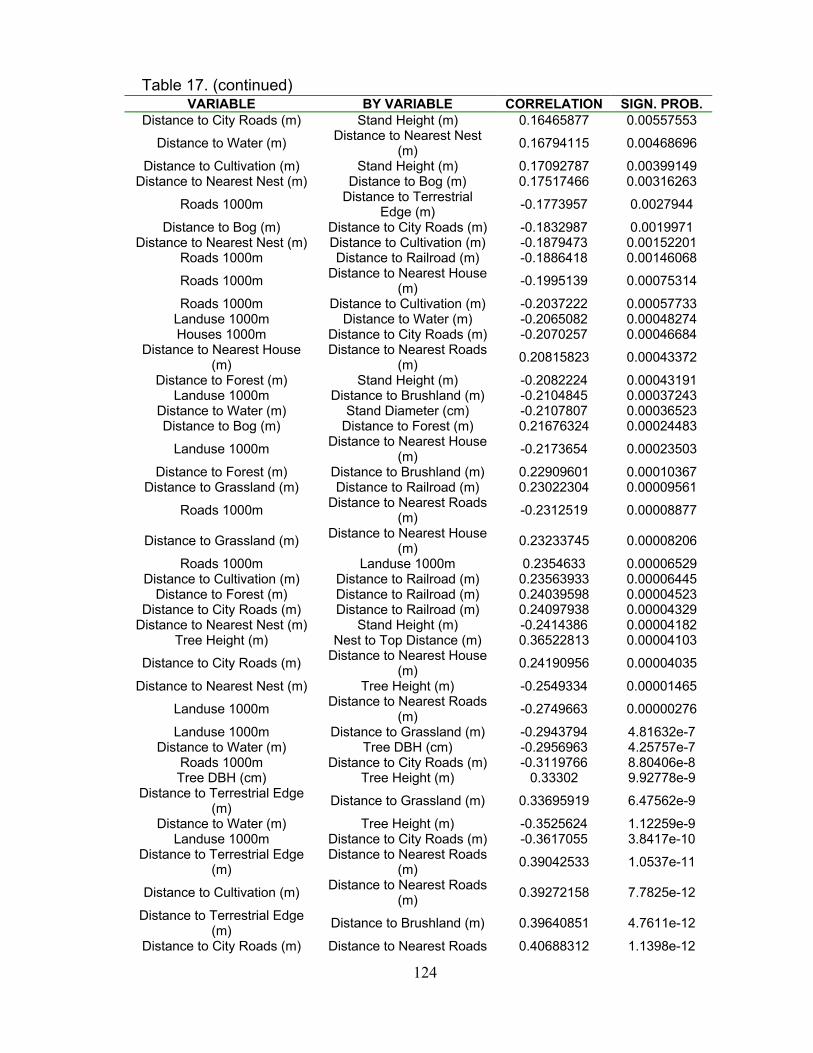
124
VARIABLE BY VARIABLE CORRELATION SIGN. PROB. Distance to City Roads (m) Stand Height (m) 0.16465877 0.00557553
Distance to Water (m) Distance to Nearest Nest (m) 0.16794115 0.00468696
Distance to Cultivation (m) Stand Height (m) 0.17092787 0.00399149 Distance to Nearest Nest (m) Distance to Bog (m) 0.17517466 0.00316263
Roads 1000m Distance to Terrestrial Edge (m) -0.1773957 0.0027944
Distance to Bog (m) Distance to City Roads (m) -0.1832987 0.0019971 Distance to Nearest Nest (m) Distance to Cultivation (m) -0.1879473 0.00152201
Roads 1000m Distance to Railroad (m) -0.1886418 0.00146068
Roads 1000m Distance to Nearest House (m) -0.1995139 0.00075314
Roads 1000m Distance to Cultivation (m) -0.2037222 0.00057733 Landuse 1000m Distance to Water (m) -0.2065082 0.00048274 Houses 1000m Distance to City Roads (m) -0.2070257 0.00046684
Distance to Nearest House (m)
Distance to Nearest Roads (m) 0.20815823 0.00043372
Distance to Forest (m) Stand Height (m) -0.2082224 0.00043191 Landuse 1000m Distance to Brushland (m) -0.2104845 0.00037243
Distance to Water (m) Stand Diameter (cm) -0.2107807 0.00036523 Distance to Bog (m) Distance to Forest (m) 0.21676324 0.00024483
Landuse 1000m Distance to Nearest House (m) -0.2173654 0.00023503
Distance to Forest (m) Distance to Brushland (m) 0.22909601 0.00010367 Distance to Grassland (m) Distance to Railroad (m) 0.23022304 0.00009561
Roads 1000m Distance to Nearest Roads (m) -0.2312519 0.00008877
Distance to Grassland (m) Distance to Nearest House (m) 0.23233745 0.00008206
Roads 1000m Landuse 1000m 0.2354633 0.00006529 Distance to Cultivation (m) Distance to Railroad (m) 0.23563933 0.00006445
Distance to Forest (m) Distance to Railroad (m) 0.24039598 0.00004523 Distance to City Roads (m) Distance to Railroad (m) 0.24097938 0.00004329
Distance to Nearest Nest (m) Stand Height (m) -0.2414386 0.00004182 Tree Height (m) Nest to Top Distance (m) 0.36522813 0.00004103
Distance to City Roads (m) Distance to Nearest House (m) 0.24190956 0.00004035
Distance to Nearest Nest (m) Tree Height (m) -0.2549334 0.00001465
Landuse 1000m Distance to Nearest Roads (m) -0.2749663 0.00000276
Landuse 1000m Distance to Grassland (m) -0.2943794 4.81632e-7 Distance to Water (m) Tree DBH (cm) -0.2956963 4.25757e-7
Roads 1000m Distance to City Roads (m) -0.3119766 8.80406e-8 Tree DBH (cm) Tree Height (m) 0.33302 9.92778e-9
Distance to Terrestrial Edge (m) Distance to Grassland (m) 0.33695919 6.47562e-9
Distance to Water (m) Tree Height (m) -0.3525624 1.12259e-9 Landuse 1000m Distance to City Roads (m) -0.3617055 3.8417e-10
Distance to Terrestrial Edge (m)
Distance to Nearest Roads (m) 0.39042533 1.0537e-11
Distance to Cultivation (m) Distance to Nearest Roads (m) 0.39272158 7.7825e-12
Distance to Terrestrial Edge (m) Distance to Brushland (m) 0.39640851 4.7611e-12
Distance to City Roads (m) Distance to Nearest Roads 0.40688312 1.1398e-12
Table 17. (continued)

125
VARIABLE BY VARIABLE CORRELATION SIGN. PROB. (m)
Landuse 1000m Distance to Cultivation (m) -0.407894 9.9025e-13
Landuse 1000m Distance to Terrestrial Edge (m) -0.4295097 4.3591e-14
Distance to Grassland (m) Distance to Cultivation (m) 0.45145896 1.4437e-15
Distance to Grassland (m) Distance to Nearest Roads (m) 0.45887322 4.3153e-16
Distance to Terrestrial Edge (m) Distance to City Roads (m) 0.46610835 1.2906e-16
Distance to Grassland (m) Distance to City Roads (m) 0.47233983 4.4591e-17 Stand Diameter (cm) Tree DBH (cm) 0.47857942 1.5051e-17
Stand Height (m) Tree Height (m) 0.48455126 5.2125e-18 Distance to Terrestrial Edge
(m) Distance to Cultivation (m) 0.49521121 7.4521e-19
Distance to Cultivation (m) Distance to City Roads (m) 0.50379915 1.4789e-19 Tree Height (m) Nest Height (m) 0.83226499 5.1563e-32 Houses 1000m Roads 1000m 0.70548671 9.1495e-44
Table 17. (continued)

126
APPENDIX G. MULTI-CORRELATION SCREENING OF VARIABLES FOR PRODUCTIVITY MODELING
Table 18 presents pairwise correlation coefficients and significant
correlations between each variable. Coefficients summarize the strength of linear
relationship for each response variable. These data were used in screening
variables for modeling productivity. Significant probabilities are arranged in
descending order. Values less than 0.05 are highly correlated.
Table 18. Evaluation of variables for Productivity Modeling VARIABLE BY VARIABLE CORRELATION SIGN. PROB.
Distance to Bog (m) Distance to Grassland (m) 0.00066479 0.99425035 Distance to Water (m) Distance to Railroad (m) -0.0024202 0.97906988 Stand Diameter (cm) Nest to Top Distance (m) -0.0028308 0.97552063
Houses 1000m Tree DBH (cm) 0.0029053 0.97487649 Houses 1000m Stand Diameter (cm) 0.00319911 0.97233668 Landuse 1000m Stand Height (m) -0.004759 0.95885759
Distance to Bog (m) Stand Diameter (cm) 0.00476137 0.95883739 Distance to Nearest Nest (m) Stand Height (m) -0.0057204 0.95055639 Distance to City Roads (m) Tree DBH (cm) -0.0063164 0.94541251
Distance to Brushland (m) Distance to Nearest Roads (m) -0.0064116 0.94459036
Roads 1000m Tree DBH (cm) 0.00654295 0.94345747 Roads 1000m Nest Height (m) -0.0066751 0.94231715 Roads 1000m Tree Height (m) 0.00679383 0.94129323
Distance to Nearest Nest (m) Distance to Nearest House (m) 0.00719471 0.93783586
Distance to Water (m) Distance to Brushland (m) -0.0080348 0.93059427
Distance to Railroad (m) Distance to Nearest House (m) 0.00904447 0.92189883
Distance to Cultivation (m) Stand Diameter (cm) 0.01068431 0.90779598 Distance to Bog (m) Nest to Top Distance (m) -0.0123118 0.89382763
Distance to City Roads (m) Stand Diameter (cm) 0.0137053 0.88189328 Roads 1000m Distance to Bog (m) -0.014569 0.87450946
Distance to Grassland (m) Tree DBH (cm) 0.01708529 0.85306084 Roads 1000m Stand Diameter (cm) -0.0186535 0.83974683
Distance to Bog (m) Distance to Cultivation (m) -0.0190542 0.83635181 Tree DBH (cm) Nest Height (m) -0.0203732 0.82519808
Stand Height (m) Nest to Top Distance (m) 0.02186671 0.81261106 Distance to Brushland (m) Stand Height (m) -0.0237421 0.79687334
Stand Height (m) Tree DBH (cm) -0.0246381 0.78938243 Distance to Forest (m) Tree DBH (cm) 0.02557963 0.78153195
Distance to Water (m) Distance to Nearest House (m) -0.0260671 0.7774761
Distance to Terrestrial Edge (m) Stand Diameter (cm) -0.0262091 0.77629533
Distance to Grassland (m) Stand Diameter (cm) 0.02652957 0.77363331

127
VARIABLE BY VARIABLE CORRELATION SIGN. PROB. Distance to Railroad (m) Stand Diameter (cm) 0.02672998 0.77196986
Stand Diameter (cm) Stand Height (m) -0.0286276 0.75627153 Distance to Forest (m) Nest to Top Distance (m) -0.0286399 0.75616998
Houses 1000m Distance to Bog (m) -0.0289115 0.75393124 Distance to Brushland (m) Distance to Railroad (m) -0.0307009 0.73923281
Distance to Terrestrial Edge (m) Stand Height (m) 0.0313119 0.73423482
Distance to Water (m) Distance to Cultivation (m) 0.03139749 0.73353562 Distance to Cultivation (m) Stand Height (m) 0.0317796 0.73041669 Distance to Brushland (m) Distance to Grassland (m) -0.0322028 0.72696727
Houses 1000m Landuse 1000m 0.03359121 0.71569038 Distance to Nearest Roads
(m) Tree Height (m) -0.0344158 0.70902151
Distance to Brushland (m) Stand Diameter (cm) 0.03472921 0.70649239 Distance to Grassland (m) Stand Height (m) 0.03479954 0.70592532
Houses 1000m Distance to Railroad (m) -0.0385206 0.67615867 Distance to Railroad (m) Tree DBH (cm) 0.03867684 0.67491956
Landuse 1000m Distance to Railroad (m) -0.0408882 0.65747291 Roads 1000m Nest to Top Distance (m) -0.0418776 0.64972535 Houses 1000m Nest to Top Distance (m) -0.0425151 0.64475335
Stand Diameter (cm) Tree Height (m) 0.04256551 0.64436059 Distance to Cultivation (m) Nest to Top Distance (m) 0.04417577 0.6318745
Distance to Nearest Nest (m) Stand Diameter (cm) 0.0447598 0.62737112 Houses 1000m Distance to Forest (m) -0.0448978 0.62630893 Houses 1000m Stand Height (m) -0.0451411 0.62443801 Houses 1000m Distance to Nearest Nest (m) -0.0463847 0.61491431
Distance to Railroad (m) Distance to Nearest Roads (m) 0.0469031 0.61096254
Distance to Cultivation (m) Tree DBH (cm) -0.0474963 0.60645458 Distance to Nearest House
(m) Stand Height (m) -0.048411 0.5995326
Houses 1000m Distance to Cultivation (m) -0.0494461 0.5917416 Distance to Water (m) Nest Height (m) 0.04945014 0.59171149
Distance to Nearest House (m) Stand Diameter (cm) -0.0505202 0.58370688
Houses 1000m Distance to Grassland (m) -0.0511501 0.5790176 Distance to Brushland (m) Distance to Cultivation (m) -0.0511913 0.57871201
Distance to Water (m) Tree Height (m) -0.0512027 0.578627 Distance to Forest (m) Stand Diameter (cm) 0.05328359 0.56326828
Distance to Forest (m) Distance to Nearest Roads (m) -0.0534258 0.56222574
Distance to Bog (m) Tree DBH (cm) 0.05448019 0.55452509 Roads 1000m Stand Height (m) 0.05472116 0.55277232
Distance to Terrestrial Edge (m)
Distance to Nearest House (m) 0.05474319 0.55261221
Houses 1000m Nest Height (m) -0.0555856 0.54650704
Distance to Bog (m) Distance to Terrestrial Edge (m) -0.0578571 0.53021042
Distance to Forest (m) Distance to Grassland (m) -0.0582798 0.52720448 Landuse 1000m Distance to Forest (m) 0.05977179 0.51666552
Distance to Nearest Roads (m) Nest to Top Distance (m) 0.06007818 0.51451467
Distance to Nearest Roads (m) Nest Height (m) -0.0603392 0.51268569
Distance to Nearest Nest (m) Distance to Forest (m) -0.060488 0.51164519
Table 18. (continued)

128
VARIABLE BY VARIABLE CORRELATION SIGN. PROB. Distance to Water (m) Distance to Grassland (m) -0.061277 0.50614317 Stand Diameter (cm) Nest Height (m) 0.06283013 0.49540366
Houses 1000m Tree Height (m) -0.0655807 0.47668304 Distance to City Roads (m) Nest to Top Distance (m) 0.06632541 0.47168099 Distance to Nearest House
(m) Tree DBH (cm) -0.0671919 0.46589718
Distance to Water (m) Distance to Terrestrial Edge (m) 0.06724759 0.46552681
Distance to Bog (m) Distance to Nearest House (m) -0.0674464 0.46420557
Distance to Terrestrial Edge (m) Distance to Brushland (m) 0.06751625 0.46374223
Distance to Forest (m) Distance to Nearest House (m) -0.0677242 0.46236356
Nest to Top Distance (m) Nest Height (m) -0.0689634 0.4541943 Distance to Water (m) Distance to Nearest Nest (m) -0.0701137 0.44668407
Distance to Brushland (m) Nest Height (m) -0.0727205 0.42992437
Houses 1000m Distance to Nearest Roads (m) -0.0751966 0.41434435
Roads 1000m Distance to Water (m) -0.0755848 0.41193238
Distance to Water (m) Distance to Nearest Roads (m) -0.0769349 0.40360653
Distance to Forest (m) Distance to Cultivation (m) -0.0777685 0.39851614 Distance to Terrestrial Edge
(m) Tree DBH (cm) -0.0777998 0.39832604
Distance to Nearest Nest (m) Nest to Top Distance (m) -0.0778868 0.39779733 Landuse 1000m Distance to Brushland (m) -0.0819514 0.37355511
Distance to Nearest Roads (m) Stand Height (m) 0.08275549 0.3688685
Distance to Nearest Roads (m) Tree DBH (cm) 0.08281136 0.36854419
Distance to Nearest Nest (m) Distance to Brushland (m) -0.0851022 0.35539856 Distance to Nearest Roads
(m) Stand Diameter (cm) 0.08726288 0.34327159
Distance to Railroad (m) Nest to Top Distance (m) 0.08804952 0.33892203 Distance to Nearest Nest (m) Distance to City Roads (m) -0.089932 0.32865579 Distance to City Roads (m) Stand Height (m) 0.09009633 0.32776906 Distance to Nearest House
(m) Nest to Top Distance (m) -0.0901989 0.32721658
Distance to Railroad (m) Nest Height (m) 0.09084674 0.32373966 Distance to Bog (m) Nest Height (m) -0.0918641 0.31832786
Distance to Grassland (m) Nest to Top Distance (m) 0.09382914 0.30804198
Distance to Bog (m) Distance to Nearest Roads (m) 0.09457595 0.30419034
Distance to Brushland (m) Distance to Nearest House (m) -0.0947716 0.30318644
Distance to Water (m) Distance to Forest (m) -0.0958437 0.29772473
Distance to Cultivation (m) Distance to Nearest House (m) 0.10012039 0.27658599
Distance to Forest (m) Distance to Terrestrial Edge (m) -0.1004525 0.27498759
Distance to Railroad (m) Tree Height (m) 0.10508924 0.25332451
Houses 1000m Distance to Terrestrial Edge (m) 0.10686055 0.24536715
Distance to Terrestrial Edge Tree Height (m) 0.10782897 0.24109067
Table 18. (continued)

129
VARIABLE BY VARIABLE CORRELATION SIGN. PROB. (m)
Landuse 1000m Tree Height (m) -0.1090549 0.23575175 Houses 1000m Distance to Water (m) -0.1107704 0.22842028 Landuse 1000m Nest to Top Distance (m) 0.11090387 0.22785653
Distance to Bog (m) Tree Height (m) -0.1111681 0.22674351 Distance to City Roads (m) Distance to Railroad (m) 0.11144269 0.22559113
Distance to Nearest Nest (m) Distance to Nearest Roads (m) -0.1118877 0.22373226
Distance to Brushland (m) Tree Height (m) -0.1119676 0.22339943 Distance to Nearest Nest (m) Distance to Railroad (m) -0.1128114 0.21990824
Landuse 1000m Distance to Bog (m) -0.1133251 0.21780156 Roads 1000m Distance to Forest (m) -0.1154849 0.20910176
Distance to Grassland (m) Distance to Nearest House (m) 0.11690843 0.20350516
Distance to Forest (m) Nest Height (m) -0.1179483 0.19948564 Distance to Terrestrial Edge
(m) Distance to Railroad (m) 0.12076276 0.18889425
Roads 1000m Distance to Nearest Nest (m) 0.12291706 0.18106825 Distance to Terrestrial Edge
(m) Nest to Top Distance (m) -0.1250203 0.17365947
Distance to Water (m) Distance to City Roads (m) 0.12621971 0.16953607 Distance to Brushland (m) Nest to Top Distance (m) -0.1285161 0.16184403 Distance to Grassland (m) Distance to Railroad (m) 0.12966174 0.15810542
Distance to Bog (m) Distance to City Roads (m) -0.1305538 0.15523938 Distance to City Roads (m) Tree Height (m) 0.13155051 0.15208309
Distance to Forest (m) Tree Height (m) -0.1315688 0.15202573 Tree DBH (cm) Tree Height (m) 0.13168456 0.1516623
Distance to Water (m) Tree DBH (cm) -0.1392101 0.12941769
Houses 1000m Distance to Nearest House (m) -0.1417504 0.12250265
Distance to Water (m) Distance to Bog (m) -0.1465035 0.1103336 Distance to Nearest House
(m) Nest Height (m) -0.1467126 0.10982082
Stand Height (m) Tree Height (m) 0.14682774 0.10953918 Distance to Cultivation (m) Distance to Railroad (m) 0.15523488 0.09045681 Distance to Railroad (m) Stand Height (m) -0.1582849 0.08422555 Distance to Water (m) Nest to Top Distance (m) -0.1589029 0.08300576
Roads 1000m Distance to Railroad (m) -0.1631126 0.07506806 Distance to Water (m) Stand Diameter (cm) -0.1637381 0.07394278 Distance to Bog (m) Stand Height (m) -0.1638151 0.07380515
Distance to Grassland (m) Nest Height (m) 0.16932463 0.06448419 Distance to Cultivation (m) Tree Height (m) 0.17183817 0.06056269
Landuse 1000m Distance to Nearest Nest (m) 0.17289267 0.05897666 Distance to Nearest Nest (m) Distance to Grassland (m) -0.1730614 0.05872609
Distance to Cultivation (m) Nest Height (m) 0.17313743 0.05861344 Landuse 1000m Stand Diameter (cm) 0.17429549 0.05691969
Distance to Water (m) Stand Height (m) 0.17690757 0.05324661 Distance to Terrestrial Edge
(m) Nest Height (m) 0.17845582 0.05116329
Distance to Brushland (m) Tree DBH (cm) 0.17984422 0.04935282 Roads 1000m Distance to Brushland (m) 0.18220134 0.04640077
Distance to Nearest Nest (m) Distance to Cultivation (m) -0.1829651 0.04547628 Distance to City Roads (m) Nest Height (m) 0.1856596 0.04233643
Landuse 1000m Tree DBH (cm) 0.18607906 0.04186431 Distance to Nearest Nest (m) Nest Height (m) -0.1866403 0.04123945
Table 18. (continued)

130
VARIABLE BY VARIABLE CORRELATION SIGN. PROB. Distance to Grassland (m) Tree Height (m) 0.19773176 0.0304036
Distance to Nearest Nest (m) Tree Height (m) -0.198618 0.02965314 Roads 1000m Distance to Grassland (m) -0.1995912 0.02884731
Landuse 1000m Nest Height (m) -0.2022657 0.02672781 Stand Height (m) Nest Height (m) 0.20579384 0.02413609 Houses 1000m Distance to Brushland (m) 0.20835715 0.02239081
Roads 1000m Distance to Terrestrial Edge (m) -0.2101941 0.02120772
Distance to Brushland (m) Distance to City Roads (m) -0.210268 0.02116128 Distance to Nearest House
(m) Distance to Nearest Roads
(m) 0.21338094 0.01928257
Distance to Nearest Nest (m) Distance to Bog (m) 0.21499168 0.01836825 Roads 1000m Distance to Cultivation (m) -0.2165158 0.01753784
Landuse 1000m Distance to Water (m) -0.218557 0.01647675 Distance to Nearest House
(m) Tree Height (m) -0.2218511 0.0148816
Distance to Bog (m) Distance to Brushland (m) 0.22687136 0.01270904 Houses 1000m Distance to City Roads (m) -0.2303066 0.01138708
Distance to Nearest Nest (m) Distance to Terrestrial Edge (m) -0.2315045 0.01095531
Distance to Forest (m) Distance to City Roads (m) -0.2335803 0.01024102
Distance to City Roads (m) Distance to Nearest House (m) 0.2348364 0.00982898
Roads 1000m Distance to Nearest Roads (m) -0.2350226 0.00976916
Tree DBH (cm) Nest to Top Distance (m) 0.23540046 0.00964874 Distance to Nearest Nest (m) Tree DBH (cm) 0.24195997 0.00775674
Landuse 1000m Distance to Nearest House (m) -0.2595127 0.00420616
Distance to Forest (m) Stand Height (m) -0.2608776 0.00400372
Landuse 1000m Distance to Nearest Roads (m) -0.2649712 0.00344791
Distance to Forest (m) Distance to Brushland (m) 0.28458368 0.00163141
Roads 1000m Distance to Nearest House (m) -0.2852348 0.0015899
Distance to Terrestrial Edge (m) Distance to City Roads (m) 0.32605144 0.00027888
Landuse 1000m Distance to Grassland (m) -0.3469261 0.00010365 Roads 1000m Landuse 1000m 0.34714009 0.00010257
Tree Height (m) Nest to Top Distance (m) 0.36522813 0.00004103 Distance to Forest (m) Distance to Railroad (m) 0.36582574 0.00003977
Roads 1000m Distance to City Roads (m) -0.3662319 0.00003893 Distance to Bog (m) Distance to Forest (m) 0.37446845 0.00002514 Stand Diameter (cm) Tree DBH (cm) 0.37874304 0.00001994
Landuse 1000m Distance to City Roads (m) -0.3799085 0.00001871 Landuse 1000m Distance to Cultivation (m) -0.3889118 0.00001134
Distance to City Roads (m) Distance to Nearest Roads (m) 0.4048958 0.0000045
Distance to Terrestrial Edge (m) Distance to Grassland (m) 0.41147525 0.00000303
Distance to Bog (m) Distance to Railroad (m) 0.43336684 7.65003e-7 Distance to Terrestrial Edge
(m) Distance to Nearest Roads
(m) 0.474579 4.34958e-8
Distance to Grassland (m) Distance to Nearest Roads (m) 0.4771449 3.59226e-8
Table 18. (continued)

131
VARIABLE BY VARIABLE CORRELATION SIGN. PROB. Distance to Cultivation (m) Distance to Nearest Roads
(m) 0.49375211 1.00195e-8
Distance to Terrestrial Edge (m) Distance to Cultivation (m) 0.50759048 3.27847e-9
Distance to Grassland (m) Distance to City Roads (m) 0.53084511 4.4661e-10
Landuse 1000m Distance to Terrestrial Edge (m) -0.5474971 9.7372e-11
Distance to Cultivation (m) Distance to City Roads (m) 0.59484374 7.8415e-13 Houses 1000m Roads 1000m 0.65605059 4.1879e-16
Distance to Grassland (m) Distance to Cultivation (m) 0.67127979 4.8588e-17 Tree Height (m) Nest Height (m) 0.83226499 5.1563e-32
Table 18. (continued)

132
APPENDIX H. RANGE DISTRIBUTION SCREENING OF VARIABLES FOR DISCRIMINANT ANALYSIS
___
Tree Height (m)
10
20
30
40
Moments Mean 20.103747Std Dev 5.9830181Std Err Mean 0.3562835upper 95% Mean 20.805071lower 95% Mean 19.402424N 282
Tree DBH (cm)
100
200
300
Moments Mean 39.360993Std Dev 24.884621Std Err Mean 1.4818576upper 95% Mean 42.277944lower 95% Mean 36.444042N 282
Stand Height (m)
10
20
30
Moments Mean 17.069318Std Dev 4.1179685Std Err Mean 0.2452215upper 95% Mean 17.552022lower 95% Mean 16.586613N 282
Stand Diameter (cm)
20
30
40
50
60
70
80
Moments Mean 29.046908Std Dev 8.2624525Std Err Mean 0.4920219upper 95% Mean 30.015424lower 95% Mean 28.078391N 282

133
Distance to Nearest Roads (m)
0
10000
Moments Mean 605.26596Std Dev 1656.9403Std Err Mean 98.66936upper 95% Mean 799.49088lower 95% Mean 411.04104N 282
Distance to Nearest House (m)
0100002000030000400005000060000700008000090000
Moments Mean 3669.727Std Dev 11196.513Std Err Mean 666.74266upper 95% Mean 4982.1713lower 95% Mean 2357.2826N 282
Distance to Cultivation (m)
0100002000030000400005000060000700008000090000
Moments Mean 8952.3262Std Dev 19123.976Std Err Mean 1138.8162upper 95% Mean 11194.02lower 95% Mean 6710.6325N 282
Distance to Grassland (m)
0100002000030000400005000060000700008000090000
100000
Moments Mean 2793.5638Std Dev 10021.132Std Err Mean 596.74975upper 95% Mean 3968.2312lower 95% Mean 1618.8965N 282

134
Distance to Brushland (m)
0
10000
20000
30000
40000
50000
Moments Mean 2164.523Std Dev 4887.1576Std Err Mean 291.026upper 95% Mean 2737.3909lower 95% Mean 1591.6552N 282
Distance to Terrestrial Edge (m)
0
2000
4000
6000
8000
10000
12000
14000
Moments Mean 590.80319Std Dev 1849.0335Std Err Mean 110.10834upper 95% Mean 807.54508lower 95% Mean 374.0613N 282
Distance to Bog (m)
0
2000
4000
6000
8000
10000
12000
Moments Mean 602.68794Std Dev 1295.7565Std Err Mean 77.161175upper 95% Mean 754.57525lower 95% Mean 450.80064N 282
Distance to Nearest Nest (m)
0100002000030000400005000060000700008000090000
100000110000
Moments Mean 13478.358Std Dev 15867.122Std Err Mean 944.87338upper 95% Mean 15338.287lower 95% Mean 11618.43N 282

135
Distance to Water (m)
0
1000
2000
Moments Mean 361.89007Std Dev 342.49871Std Err Mean 20.395501upper 95% Mean 402.03743lower 95% Mean 321.74271N 282
lnNHeight
2
2.2
2.4
2.6
2.8
3
3.2
3.4
3.6
Moments Mean 2.9455912Std Dev 0.290279Std Err Mean 0.0264987upper 95% Mean 2.9980613lower 95% Mean 2.8931211N 120
lnNtoTop Distance
-1
0
1
2
3
Moments Mean 1.162809Std Dev 0.6574738Std Err Mean 0.0600189upper 95% Mean 1.2816523lower 95% Mean 1.0439656N 120
lnHeight
2
3
Moments Mean 2.9562357Std Dev 0.3033146Std Err Mean 0.0180621upper 95% Mean 2.9917899lower 95% Mean 2.9206814N 282

136
lnDBH
3
4
5
Moments Mean 3.5683717Std Dev 0.411253Std Err Mean 0.0244898upper 95% Mean 3.6165784lower 95% Mean 3.520165N 282
lnStandHeight
2
3
Moments Mean 2.8070422Std Dev 0.2516086Std Err Mean 0.0149831upper 95% Mean 2.8365355lower 95% Mean 2.7775489N 282
lnStandDBH
3
3.2
3.4
3.6
3.8
4
4.2
4.4
Moments Mean 3.3391921Std Dev 0.2299294Std Err Mean 0.0136921upper 95% Mean 3.3661442lower 95% Mean 3.31224N 282
lnDRoads
-10123456789
10
Moments Mean 5.4571842Std Dev 1.3663616Std Err Mean 0.0813657upper 95% Mean 5.6173478lower 95% Mean 5.2970206N 282

137
lnDHouse
4
5
6
7
8
9
10
11
Moments Mean 6.6253605Std Dev 1.4557696Std Err Mean 0.0866898upper 95% Mean 6.7960043lower 95% Mean 6.4547166N 282
lnDRail
3456789
10111213
Moments Mean 8.9613801Std Dev 1.4276742Std Err Mean 0.0850168upper 95% Mean 9.1287307lower 95% Mean 8.7940296N 282
lnDCityRoad
3
4
5
6
7
8
9
10
11
Moments Mean 8.8292097Std Dev 1.1924385Std Err Mean 0.0710087upper 95% Mean 8.9689862lower 95% Mean 8.6894332N 282
lnDCultv
01
3
5
7
9
11
Moments Mean 5.7266527Std Dev 3.6336186Std Err Mean 0.2163788upper 95% Mean 6.1525819lower 95% Mean 5.3007235N 282

138
lnDGrass
-1
1
3
5
7
9
11
Moments Mean 5.3555778Std Dev 2.6230645Std Err Mean 0.1562012upper 95% Mean 5.6630509lower 95% Mean 5.0481048N 282
lnDBrush
-10
2
4
6
8
10
Moments Mean 6.4094786Std Dev 2.0141247Std Err Mean 0.1199394upper 95% Mean 6.6455723lower 95% Mean 6.1733848N 282
lnDBog
-10123456789
Moments Mean 4.6443191Std Dev 2.5647087Std Err Mean 0.1527262upper 95% Mean 4.9449517lower 95% Mean 4.3436864N 282
lnDNest
5
6
7
8
9
10
11
Moments Mean 9.0008826Std Dev 1.0404972Std Err Mean 0.0619607upper 95% Mean 9.1228487lower 95% Mean 8.8789165N 282

139
lnDWater
0
1
2
3
4
5
6
7
8
Moments Mean 4.8442697Std Dev 2.0567651Std Err Mean 0.1224786upper 95% Mean 5.0853617lower 95% Mean 4.6031777N 282
Houses 1000m
0
100
200
Moments Mean 10.379433Std Dev 29.04913Std Err Mean 1.7298505upper 95% Mean 13.784543lower 95% Mean 6.974322N 282
Roads 1000m
0
10
20
30
40
50
Moments Mean 5.0567376Std Dev 4.8614586Std Err Mean 0.2894956upper 95% Mean 5.626593lower 95% Mean 4.4868822N 282
Landuse 1000m
2
3
4
5
6
7
8
Moments Mean 5.3156028Std Dev 1.3615348Std Err Mean 0.0810782upper 95% Mean 5.4752006lower 95% Mean 5.1560051N 282

140
APPENDIX I. RANGE DISTRIBUTION SCREENING OF VARIABLES FOR PRODUCTIVITY MODELING
Nest Height (m)
10
20
30
Moments Mean 19.777874Std Dev 5.2878275Std Err Mean 0.4827104upper 95% Mean 20.733689lower 95% Mean 18.82206N 120
Nest to Top Distance (m)
0
10
Moments Mean 3.8976663Std Dev 2.5504142Std Err Mean 0.2328199upper 95% Mean 4.358673lower 95% Mean 3.4366597N 120
Tree Height (m)
20
30
40
Moments Mean 23.994314Std Dev 5.7090758Std Err Mean 0.5211649upper 95% Mean 25.026273lower 95% Mean 22.962356N 120
Tree DBH (cm)
100
200
300
Moments Mean 51.559167Std Dev 32.549095Std Err Mean 2.9713123upper 95% Mean 57.442662lower 95% Mean 45.675672N 120

141
Stand Height (m)
10
20
30
Moments Mean 18.548319Std Dev 4.2348356Std Err Mean 0.3865858upper 95% Mean 19.313797lower 95% Mean 17.78284N 120
Stand Diameter (cm)
20
30
40
50
60
70
Moments Mean 31.411807Std Dev 9.0547656Std Err Mean 0.8265832upper 95% Mean 33.048524lower 95% Mean 29.77509N 120
Distance to Nearest Roads (m)
0
10000
Moments Mean 668.88333Std Dev 1864.4425Std Err Mean 170.19953upper 95% Mean 1005.8954lower 95% Mean 331.87126N 120
Distance to Nearest House (m)
0100002000030000400005000060000700008000090000
Moments Mean 6147.6Std Dev 15949.327Std Err Mean 1455.9677upper 95% Mean 9030.5614lower 95% Mean 3264.6386N 120

142
Distance to Railroad (m)
0
100000
200000
300000
Moments Mean 15521.458Std Dev 31434.982Std Err Mean 2869.6082upper 95% Mean 21203.569lower 95% Mean 9839.3476N 120
Distance to City Roads (m)
0
10000
20000
30000
40000
Moments Mean 9752.025Std Dev 7787.5412Std Err Mean 710.902upper 95% Mean 11159.682lower 95% Mean 8344.368N 120
Distance to Cultivation (m)
0
10000
20000
30000
40000
50000
60000
70000
80000
Moments Mean 6128.9667Std Dev 14522.693Std Err Mean 1325.7344upper 95% Mean 8754.0533lower 95% Mean 3503.8801N 120
Distance to Grassland (m)
0
10000
20000
30000
Moments Mean 1480.4083Std Dev 4369.0082Std Err Mean 398.83405upper 95% Mean 2270.1396lower 95% Mean 690.67707N 120

143
Distance to Brushland (m)
0
10000
20000
30000
40000
50000
Moments Mean 2550.6Std Dev 6345.9534Std Err Mean 579.30364upper 95% Mean 3697.6791lower 95% Mean 1403.5209N 120
Distance to Terrestrial Edge (m)
0
1000
2000
3000
4000
Moments Mean 413.675Std Dev 723.41834Std Err Mean 66.038757upper 95% Mean 544.43833lower 95% Mean 282.91167N 120
Distance to Forest (m)
0100020003000400050006000700080009000
Moments Mean 254.65417Std Dev 1215.2049Std Err Mean 110.93252upper 95% Mean 474.31164lower 95% Mean 34.996693N 120
Distance to Bog (m)
0
1000
2000
3000
4000
5000
6000
7000
8000
Moments Mean 547.67917Std Dev 1189.518Std Err Mean 108.58764upper 95% Mean 762.69354lower 95% Mean 332.66479N 120
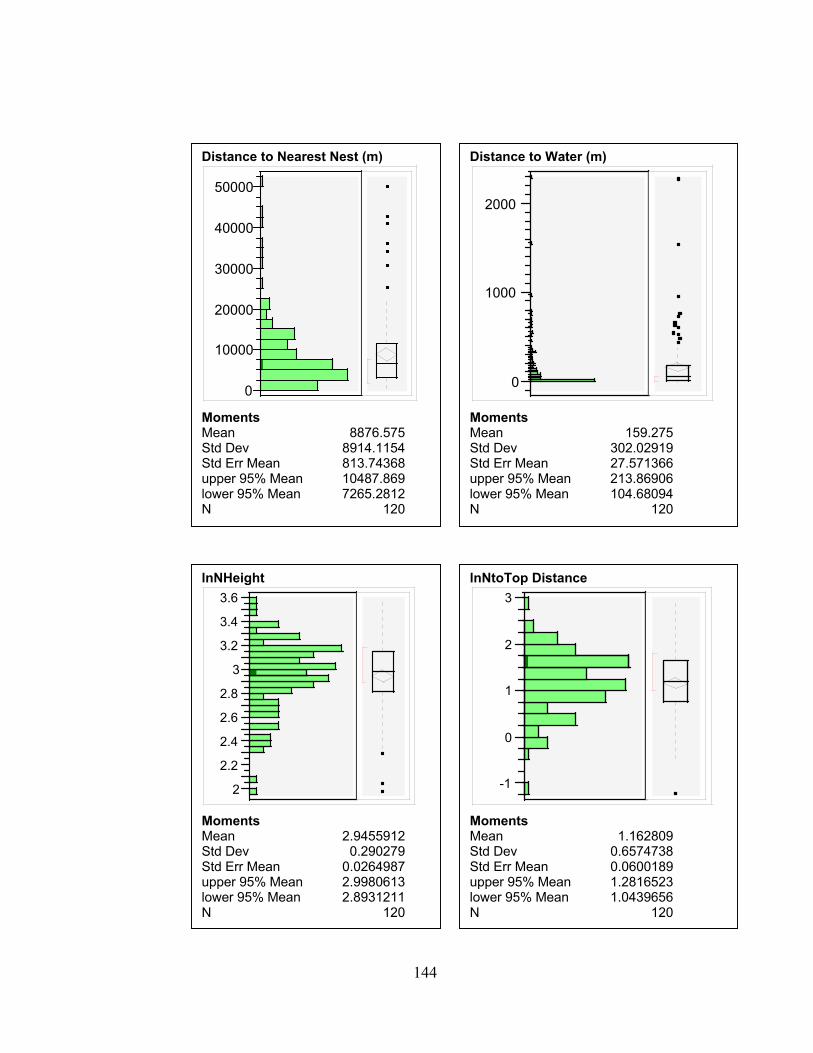
144
Distance to Nearest Nest (m)
0
10000
20000
30000
40000
50000
Moments Mean 8876.575Std Dev 8914.1154Std Err Mean 813.74368upper 95% Mean 10487.869lower 95% Mean 7265.2812N 120
Distance to Water (m)
0
1000
2000
Moments Mean 159.275Std Dev 302.02919Std Err Mean 27.571366upper 95% Mean 213.86906lower 95% Mean 104.68094N 120
lnNHeight
2
2.2
2.4
2.6
2.8
3
3.2
3.4
3.6
Moments Mean 2.9455912Std Dev 0.290279Std Err Mean 0.0264987upper 95% Mean 2.9980613lower 95% Mean 2.8931211N 120
lnNtoTop Distance
-1
0
1
2
3
Moments Mean 1.162809Std Dev 0.6574738Std Err Mean 0.0600189upper 95% Mean 1.2816523lower 95% Mean 1.0439656N 120

145
lnHeight
2.62.72.82.9
33.13.23.33.43.53.63.7
Moments Mean 3.1488688Std Dev 0.2448543Std Err Mean 0.022352upper 95% Mean 3.1931281lower 95% Mean 3.1046096N 120
lnDBH
3
4
5
Moments Mean 3.8326582Std Dev 0.4262665Std Err Mean 0.0389126upper 95% Mean 3.9097091lower 95% Mean 3.7556073N 120
lnStandHeight
2
3
Moments Mean 2.8924871Std Dev 0.2462666Std Err Mean 0.022481upper 95% Mean 2.9370017lower 95% Mean 2.8479726N 120
lnStandDBH
3
3.2
3.4
3.6
3.8
4
4.2
Moments Mean 3.4153208Std Dev 0.2407655Std Err Mean 0.0219788upper 95% Mean 3.458841lower 95% Mean 3.3718006N 120
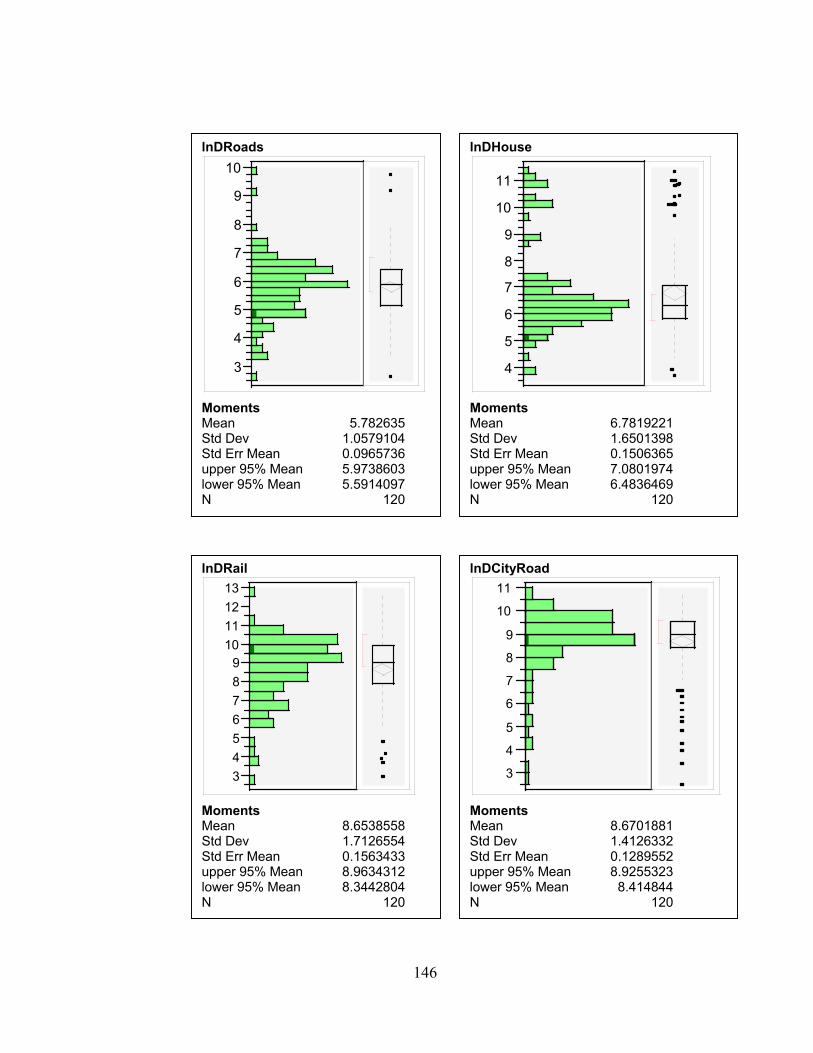
146
lnDRoads
3
4
5
6
7
8
9
10
Moments Mean 5.782635Std Dev 1.0579104Std Err Mean 0.0965736upper 95% Mean 5.9738603lower 95% Mean 5.5914097N 120
lnDHouse
4
5
6
7
8
9
10
11
Moments Mean 6.7819221Std Dev 1.6501398Std Err Mean 0.1506365upper 95% Mean 7.0801974lower 95% Mean 6.4836469N 120
lnDRail
3456789
10111213
Moments Mean 8.6538558Std Dev 1.7126554Std Err Mean 0.1563433upper 95% Mean 8.9634312lower 95% Mean 8.3442804N 120
lnDCityRoad
3
4
5
6
7
8
9
10
11
Moments Mean 8.6701881Std Dev 1.4126332Std Err Mean 0.1289552upper 95% Mean 8.9255323lower 95% Mean 8.414844N 120

147
lnDCultv
01
3
5
7
9
11
Moments Mean 6.6366913Std Dev 2.3666509Std Err Mean 0.2160447upper 95% Mean 7.0644813lower 95% Mean 6.2089012N 120
lnDEdge
-1012345678
Moments Mean 4.3505765Std Dev 2.4633822Std Err Mean 0.224875upper 95% Mean 4.7958514lower 95% Mean 3.9053015N 120
lnDBrush
-10
2
4
6
8
10
Moments Mean 6.3503903Std Dev 2.1976921Std Err Mean 0.2006209upper 95% Mean 6.7476397lower 95% Mean 5.9531408N 120
lnDGrass
-10123456789
10
Moments Mean 5.2181792Std Dev 2.3598521Std Err Mean 0.215424upper 95% Mean 5.6447403lower 95% Mean 4.7916181N 120

148
lnDBog
-10123456789
Moments Mean 4.4751395Std Dev 2.539028Std Err Mean 0.2317805upper 95% Mean 4.9340881lower 95% Mean 4.016191N 120
lnDForest
-10123456789
Moments Mean 1.1750718Std Dev 2.7279994Std Err Mean 0.2490311upper 95% Mean 1.6681783lower 95% Mean 0.6819653N 120
lnDNest
7
8
9
10
11
Moments Mean 8.6698254Std Dev 0.9697258Std Err Mean 0.0885235upper 95% Mean 8.8451107lower 95% Mean 8.4945401N 120
lnDWater
0
1
2
3
4
5
6
7
8
Moments Mean 3.537652Std Dev 2.0773397Std Err Mean 0.1896343upper 95% Mean 3.9131469lower 95% Mean 3.1621572N 120

149
Roads 1000m
0
10
20
Moments Mean 4.5833333 Std Dev 3.7429673 Std Err Mean 0.3416846 upper 95% Mean 5.259903 lower 95% Mean 3.9067637 N 120
Houses 1000m
0
100
200
Moments Mean 12.416667Std Dev 32.047911Std Err Mean 2.9255607upper 95% Mean 18.209569lower 95% Mean 6.6237643N 120
Distributions Landuse 1000m
2
3
4
5
6
7
8
Moments Mean 5.4666667Std Dev 1.2697736Std Err Mean 0.1159139upper 95% Mean 5.6961878lower 95% Mean 5.2371455N 120

150
APPENDIX J. DISTRIBUTION AND CORRELATIONS OF EACH VARIABLE MEASURED FOR DISCRIMINANT ANALYSIS
Species Distribution: N/A
Correlations: Tightly correlated to ecoregion. Ecoregion predicts species
present. Nest Tree Height Distribution: Normal
Correlations: Stand Diameter (0.013) Nest to Top Distance (0.0004) Distance to Nearest Active Nest (0.000015) Tree Diameter (<0.0000001) Distance to Water (<0.0000001) Stand Height (<0.00000001) Nest Height (<0.00000001)
Nest Tree Diameter Distribution: Right Skewed; After Log Transformation: Near Normal
Correlations: Density of Land-use Types (0.016) Distance to Brushland (0.0099) Nest to Top Distance (0.0096) Distance to Water (<0.0000001) Tree Height (<0.00000001) Stand Diameter (<0.00000001)
Canopy Elevation Difficult to measure in the field, thus eliminated from list. Stand Diameter Distribution: Near Normal
Correlations: Tree Height (0.010) Density of Land-use Types (0.0094) Distance to Water (0.00037) Tree Diameter (<0.00000001)
Stand Height Distribution: Normal
Correlations: Nest Height (0.024) Distance to City Roads (0.0056)

151
Distance to Cultivation (0.0040) Distance to Forest (0.00043) Distance to Nearest Active Nest (0.00004) Tree Height (<0.0000001)
Distance to Active Nest Distribution: Near Normal; After Log Transformation: Normal
Correlations: Distance to Forest (0.0444) Nest Height (0.04123) Distance to Water (0.0047) Distance to Bog (0.0032) Distance to Cultivation (0.0015) Stand Height (0.000042) Tree Height (0.000014)
Distance to Water Distribution: Right Skewed; After Log Transformation: Near Normal
Correlations: Distance to Nearest House (0.0356) Distance to Nearest Active Nest (0.0047) Density of Land-use Types (0.00048) Stand Diameter (0.00037) Tree Diameter (<0.00000001) Tree Height (<0.000000001)
Distance to Nearest Road Distribution: Right Skewed; After Log Transformation: Normal
Correlations: Stand Height (0.01396) Distance to Nearest House (0.00043) Density of Roads (0.000089) Density of Land-use Types (0.0000028) Distance to Terrestrial Edge (<0.000000001) Distance to Cultivation (<0.000000001) Distance to Urban (<0.000000001) Distance to Grassland (<0.00000001)
Distance to House Distribution: Right Skewed; After Log Transformation: Near Normal
Correlations: Distance to Water (0.03556) Distance to Cultivation (0.00669) Density of Roads (0.00075) Distance to Nearest Road (0.00043) Density of Land-use Types (0.00235)

152
Distance to Grassland (0.000082) Distance to Urban (0.000040)
Density of Houses Distribution: Right Skewed
Correlations: Distance to Urban (0.000467) Density of Roads (<0.000000001)
Distance to Urban Distribution: Right Skewed; After Log Transformation: Normal
Correlations: Distance to Forest (0.04234) Nest Height (0.04233) Stand Height (0.00558) Distance to Bog (0.001997) Density of Houses (0.000467) Distance to Nearest House (0.0000404)
Density of Roads ((<0.0000001) Density of Land-use Types (<0.0000001) Distance to Terrestrial Edge (<0.0000001) Distance to Grassland (<0.00000001) Distance to Cultivation (<0.00000001)
Distance to Forest Distribution: Right Skewed; After Log Transformation: Right Skewed
Correlations: Distance to Nearest Nest (0.0445)
Distance to City Roads (0.4234) Stand Height (0.00043) Distance to Bog (0.0002) Distance to Railroad (0.000045) Distance to Grassland Distribution: Right Skewed; After Log Transformation: Near Normal
Correlations: Density of Roads (0.01187) Distance to Railroad (0.000096) Distance to Nearest House (0.000082) Density of Land-use Types (<0.00000001) Distance to Terrestrial Edge (<0.00000001) Distance to Cultivation (<0.00000001) Distance to Nearest Roads (<0.00000001) Distance to Urban Area (<0.00000001)

153
Distance to Bog Distribution: Right Skewed; After Log Transformation: Near Normal
Correlations: Density of Land-use Types (0.04919) Distance to Cultivation (0.047558) Distance to Railroad (0.02613) Distance to Brushland (0.01710) Distance to Nearest Nest (0.0032) Distance to Urban Area (0.001997) Distance to Forest (0.00024)
Distance to Brushland Distribution: Right Skewed; After Log Transformation: Normal
Correlations: Distance to Bog (0.01710) Land-use Density (0.000372) Distance to Forest (0.000104) Distance to Terrestrial Edge (<0.00000001)
Distance to Cultivation Distribution: Right Skewed; After Log Transformation: Near Normal
Correlations: Distance to Bog (0.047557) Distance to Nearest House (0.006688) Stand Height (0.00399) Distance to Nearest Active Nest (0.001522) Density of Roads (0.000577) Distance to Railroad (0.00006445) Distance to Nearest Road (<0.000000001) Land-use Density (<0.00000001) Distance to Grassland (<0.00000001) Distance to Terrestrial Edge (<0.0000001) Distance to Urban (<0.00000001)
Density of Land-use Types Distribution: Normal
Correlations: Distance to Bog (0.049188)
Distance to Railroad (0.045584) Nest Height (0.026728) Tree Diameter (0.016012) Stand Diameter (0.00936) Distance to Water (0.000483) Distance to Brushland (0.0003824) Distance to Nearest House (0.0002448) Density of Roads (0.00006529)

154
Distance to Nearest Road (0.0000028) Distance to Grassland (<0.000000001) Distance to Urban (<0.0000000001) Distance to Cultivation (<0.000000001) Distance to Terrestrial Edge (<0.000000001) Distance to Terrestrial Edge Distribution: Right Skewed; After Log Transformation: Normal
Correlations: Density of Roads (0.002794) Distance to Grassland (<0.0000000001) Distance to Nearest Road (<0.000000001) Distance to Brushland (<0.0000000001) Density of Land-use (<0.000000001) Distance to Urban (<0.0000000001) Distance to Cultivation (0.0000000001) Density of Roads: Distribution: Near Normal
Correlations: Distance to Grassland (0.011867) Distance to Terrestrial Edge (0.00279) Distance to Nearest House (0.000753) Distance to Cultivation (0.0005773) Distance to Nearest Road (0.0000888) Density of Land-use (0.000065) Distance to Urban (<0.000000001) Density of Houses (<0.000000001)

155
APPENDIX K. DISTRIBUTION AND CORRELATIONS OF EACH VARIABLE MEASURED FOR PRODUCTIVITY MODELING
Ground to nest Distribution: Normal Correlations: Distance to Urban (0.042336) Distance to Nearest Active Nest (0.0412395) Density of Land-use (0.0257278) Stand Height (0.0241361) Tree Height (<0.000000001) Nest to top Distribution: Normal Correlations: Tree Diameter (0.009649) Tree Height (0.00004103) Species Distribution: N/A
Correlations: Tightly correlated to ecoregion. Ecoregion predicts species
present. Nest Tree Height Distribution: Normal
Correlations: Distance to Grassland (0.0304) Distance to Nearest Active Nest (0.02965) Distance to Nearest House (0.01488) Nest to Top Distance (0.00004103) Nest Height (<0.00000001)
Nest Tree Diameter Distribution: Right Skewed; After Log Transformation: Normal
Correlations: Distance to Brushland (0.046408) Density of Land-use (0.04186) Nest to Top Distance (0.009649) Distance to Nearest Active Nest (0.007757) Stand Diameter (0.00001994)
Canopy Elevation Difficult to measure in the field, thus eliminated from list.

156
Stand Diameter Distribution: Normal
Correlations: Tree DBH (0.00001994)
Stand Height Distribution: Normal
Correlations: Nest Height (0.02414) Distance to Forest (0.0016314)
Distance to Active Nest Distribution: Near Normal
Correlations: Distance to Cultivation (0.045476) Tree Height (0.029653)
Distance to Bog (0.018368) Distance to Terrestrial Edge (0.010955) Tree DBH (0.0077567)
Distance to Water Distribution: Right Skewed; After Log Transformation: Normal
Correlations: Density of Land-use (0.016477)
Distance to Nearest Road Distribution: Right Skewed; After Log Transformation: Normal
Correlations: Density of Roads (0.009748) Density of Land-use (0.003448) Distance to Urban (0.0000045) Distance to Terrestrial Edge (<0.000000001) Distance to Grassland (<0.000000001) Distance to Cultivation (<0.000000001)
Distance to House Distribution: Right Skewed; After Log Transformation: Normal
Correlations: Distance to Nearest Road (0.01928) Tree Height (0.01488) Distance to Urban (0.009829) Density of Land-use (0.004206) Density of Roads (0.001590)
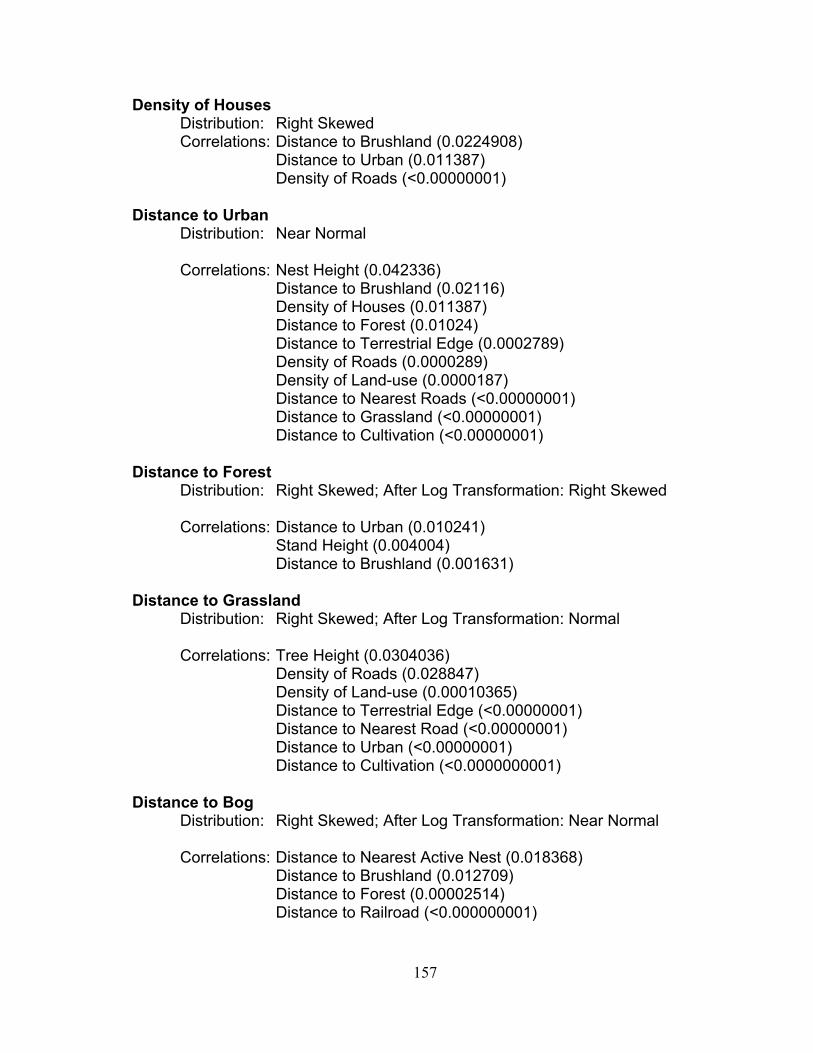
157
Density of Houses Distribution: Right Skewed
Correlations: Distance to Brushland (0.0224908) Distance to Urban (0.011387) Density of Roads (<0.00000001)
Distance to Urban Distribution: Near Normal
Correlations: Nest Height (0.042336) Distance to Brushland (0.02116) Density of Houses (0.011387) Distance to Forest (0.01024) Distance to Terrestrial Edge (0.0002789) Density of Roads (0.0000289) Density of Land-use (0.0000187) Distance to Nearest Roads (<0.00000001) Distance to Grassland (<0.00000001) Distance to Cultivation (<0.00000001)
Distance to Forest Distribution: Right Skewed; After Log Transformation: Right Skewed
Correlations: Distance to Urban (0.010241) Stand Height (0.004004) Distance to Brushland (0.001631)
Distance to Grassland Distribution: Right Skewed; After Log Transformation: Normal
Correlations: Tree Height (0.0304036) Density of Roads (0.028847) Density of Land-use (0.00010365) Distance to Terrestrial Edge (<0.00000001) Distance to Nearest Road (<0.00000001) Distance to Urban (<0.00000001) Distance to Cultivation (<0.0000000001)
Distance to Bog Distribution: Right Skewed; After Log Transformation: Near Normal
Correlations: Distance to Nearest Active Nest (0.018368) Distance to Brushland (0.012709) Distance to Forest (0.00002514) Distance to Railroad (<0.000000001)
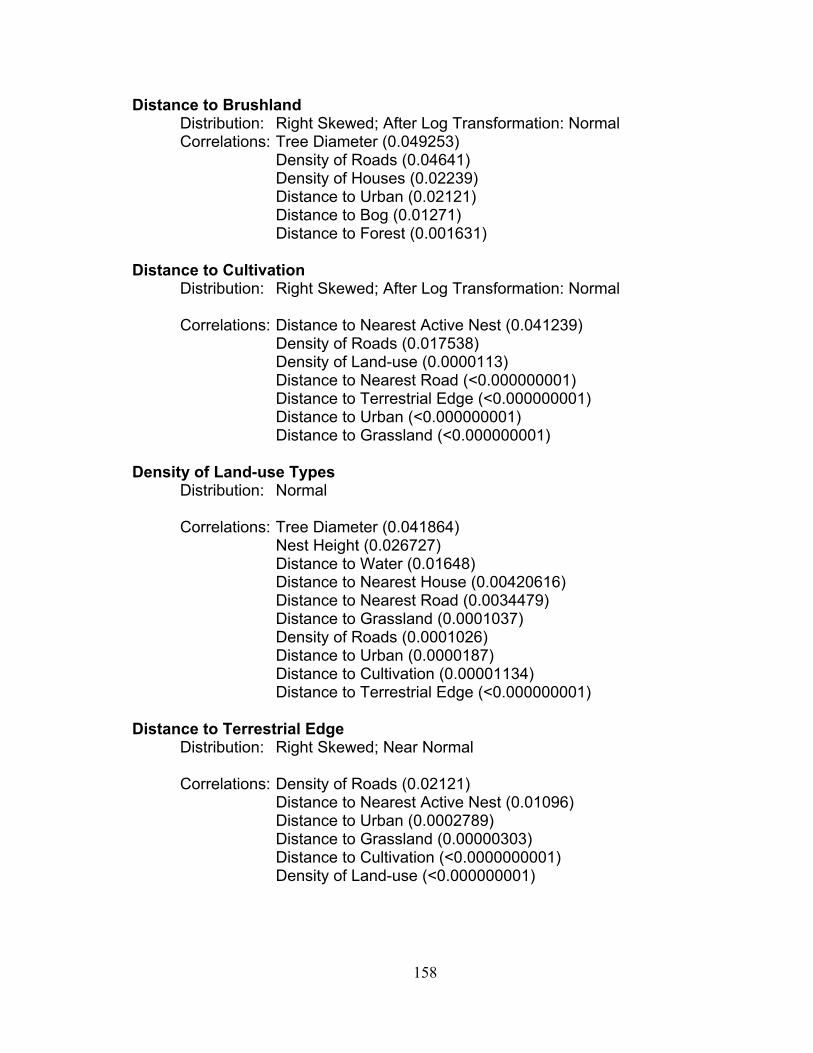
158
Distance to Brushland Distribution: Right Skewed; After Log Transformation: Normal
Correlations: Tree Diameter (0.049253) Density of Roads (0.04641) Density of Houses (0.02239) Distance to Urban (0.02121) Distance to Bog (0.01271) Distance to Forest (0.001631)
Distance to Cultivation Distribution: Right Skewed; After Log Transformation: Normal
Correlations: Distance to Nearest Active Nest (0.041239) Density of Roads (0.017538) Density of Land-use (0.0000113) Distance to Nearest Road (<0.000000001) Distance to Terrestrial Edge (<0.000000001) Distance to Urban (<0.000000001) Distance to Grassland (<0.000000001)
Density of Land-use Types Distribution: Normal
Correlations: Tree Diameter (0.041864) Nest Height (0.026727) Distance to Water (0.01648) Distance to Nearest House (0.00420616) Distance to Nearest Road (0.0034479) Distance to Grassland (0.0001037) Density of Roads (0.0001026) Distance to Urban (0.0000187) Distance to Cultivation (0.00001134) Distance to Terrestrial Edge (<0.000000001)
Distance to Terrestrial Edge Distribution: Right Skewed; Near Normal
Correlations: Density of Roads (0.02121) Distance to Nearest Active Nest (0.01096) Distance to Urban (0.0002789) Distance to Grassland (0.00000303) Distance to Cultivation (<0.0000000001) Density of Land-use (<0.000000001)

159
Density of Roads Distribution: Normal
Correlations: Distance to Brushland (0.046401) Distance to Grassland (0.028847) Distance to Terrestrial Edge (0.02121) Distance to Cultivation (0.01754) Distance to Nearest Roads (0.00977) Distance to Nearest House (0.00159) Density of Land-use (0.000103) Distance to Urban (0.0000389) Density of Houses (<0.0000000001)