Balancing the global oceanic neodymium budget - Tulane University
15
This article was originally published in a journal published by Elsevier, and the attached copy is provided by Elsevier for the author’s benefit and for the benefit of the author’s institution, for non-commercial research and educational use including without limitation use in instruction at your institution, sending it to specific colleagues that you know, and providing a copy to your institution’s administrator. All other uses, reproduction and distribution, including without limitation commercial reprints, selling or licensing copies or access, or posting on open internet sites, your personal or institution’s website or repository, are prohibited. For exceptions, permission may be sought for such use through Elsevier’s permissions site at: http://www.elsevier.com/locate/permissionusematerial
Transcript of Balancing the global oceanic neodymium budget - Tulane University

This article was originally published in a journal published byElsevier, and the attached copy is provided by Elsevier for the
author’s benefit and for the benefit of the author’s institution, fornon-commercial research and educational use including without
limitation use in instruction at your institution, sending it to specificcolleagues that you know, and providing a copy to your institution’s
administrator.
All other uses, reproduction and distribution, including withoutlimitation commercial reprints, selling or licensing copies or access,
or posting on open internet sites, your personal or institution’swebsite or repository, are prohibited. For exceptions, permission
may be sought for such use through Elsevier’s permissions site at:
http://www.elsevier.com/locate/permissionusematerial

Autho
r's
pers
onal
co
py
Balancing the global oceanic neodymium budget:Evaluating the role of groundwater
Karen H. Johannesson a,⁎, David J. Burdige b
a Department of Earth and Environmental Sciences, The University of Texas at Arlington, Arlington, TX 76019-0049, USAb Department of Ocean, Earth, and Atmospheric Sciences, Old Dominion University, Norfolk, VA 23529-0276, USA
Received 15 June 2006; received in revised form 10 October 2006; accepted 11 October 2006Available online 22 November 2006
Editor: H. Elderfield
Abstract
The distinctly different, εNd(0) values of the Atlantic, Indian, and Pacific Oceans requires that the residence time of Nd in theocean (i.e., τNd) be on the order of, or less than, the ocean mixing time of ∼500–1500 yr. However, estimates of τNd, based onriver influxes, range from 4000 to 15,000 yr, thus exceeding the ocean mixing time. In order to reconcile the oceanic Nd budget andlower the residence time by roughly a factor of 10, an additional, as yet unidentified, and hence “missing Nd flux” to the ocean isnecessary. Dissolution of materials deposited on continental margins has previously been proposed as a source of the missing flux.In this contribution, submarine groundwater discharge (SGD) is examined as a possible source of the missing Nd flux. Neodymiumconcentrations (n=730) and εNd(0) values (n=58) for groundwaters were obtained from the literature in order to establishrepresentative groundwater values. Mean groundwater Nd concentrations and εNd(0) values were used along with recent estimatesof the terrestrial (freshwater) component of SGD (6% of river discharge on a global basis) to test whether groundwater discharge tothe coastal oceans could account for the missing flux. Employing mean Nd concentrations of the compiled data base (i.e.,31.8 nmol/kg for all 730 analyses and 11.3 nmol/kg for 141 groundwater samples from a coastal aquifer), the global, terrestrial-derived SGD flux of Nd is estimated to range between 2.9×10⁷ and 8.1×10⁷ mol/yr. These estimates are of the same order ofmagnitude, and within a factor of 2, of the missing Nd flux (i.e., 5.4×10⁷ mol/yr). Applying the SGD Nd flux estimates, the globalaverage εNd(0) of SGD is predicted to be −9.1, which is similar to our estimate for the missing Nd flux (−9.2), and in agreementwith the mean (±S.D.) εNd(0) measured in groundwaters (i.e., εNd(0)=−8.9±4.2). The similarities in the estimated SGD Nd fluxand corresponding εNd(0) values to the magnitude and isotope composition of the missing Nd flux are compelling, and suggest thatdischarge of groundwater to the oceans could account for the missing Nd flux. Future investigations should focus on quantifyingthe Nd concentrations and isotope compositions of groundwater from coastal aquifers from a variety of coastal settings, as well asthe important geochemical reactions that effect Nd concentrations in subterranean estuaries in order to better constraincontributions of SGD to the oceanic Nd budget.© 2006 Elsevier B.V. All rights reserved.
Keywords: Nd; isotopes; seawater geochemistry; submarine groundwater discharge; rare earth elements
1. Introduction
The neodymium (Nd) isotope composition ofseawater varies between ocean basins (e.g., Atlantic,Indian, Pacific), in accord with the age and composition
Earth and Planetary Science Letters 253 (2007) 129–142www.elsevier.com/locate/epsl
⁎ Corresponding author. Tel.: +1 817 272 2980.E-mail address: [email protected] (K.H. Johannesson).
0012-821X/$ - see front matter © 2006 Elsevier B.V. All rights reserved.doi:10.1016/j.epsl.2006.10.021

Autho
r's
pers
onal
co
py
of surrounding continental land masses, the chief sourceof Nd to the ocean [1–3]. As a consequence, Nd isotopeshave been used to trace the circulation and mixing ofoceanic water masses, to identify sources of rare earthelements (REE) to the ocean, and to investigatebiogeochemical exchange of REEs between seawaterand particulate matter [4–9]. Furthermore, becauseauthigenic and biogenic minerals inherit 143Nd/144Ndratios that reflect the isotopic composition of theseawater within which they form [e.g., 10], Nd isotopesare extensively employed for paleoceanographic inves-tigations [11,12]. Neodymium isotope ratios are com-monly expressed in epsilon notation, εNd(0), such that:
eNdð0Þ ¼ ½ ð143Nd=144NdÞmeasuredð143Nd=144NdÞCHUR� 1� � 104 ð1Þ
where (143Nd/144Nd)measured is the isotope ratiomeasured in the sample and (143Nd/144Nd)CHUR isthe present day Nd isotope ratio (0.512638) forCHUR (Chondritic Uniform Reservoir) [13]. Follow-ing common practice, epsilon notation is used in thiscontribution.
A number of unresolved questions remain concer-ning the oceanic Nd budget, which consequently limitsour ability to confidently interpret the geochemistry ofNd in the modern oceans and, perhaps more importantly,read the paleoceanographic Nd isotope record [14].These unresolved questions chiefly reflect the poorconstraint that currently exists with regard to the mag-nitude and isotopic composition of Nd fluxes to thesurface oceans. In particular, the combination of at-mospheric and riverine fluxes of Nd to the oceansappear to be insufficient, by roughly a factor of 10, tobalance the oceanic Nd budget, and preserve the ob-served inter- and intra-oceanic 143Nd/144Nd ratios [15–19]. The difference between the combined river andatmospheric Nd fluxes and the flux required to balancethe ocean Nd budget is referred to as the “missing Ndflux”, and it is estimated to be on the order of5.4×107 mol of Nd/yr [14].
The origin of the missing Nd flux has attracted theattention of numerous investigators who have proposeda wide variety of possible explanations including, butnot limited to, greater atmospheric fluxes of Nd,diffusive pore water fluxes enriched in REEs, releaseof REEs from mid-to high-salinity regions of estuaries,remineralization, and/or rapid adsorption/desorptionreactions with particles [3,8,9,14,17]. However, untilrecently [14] the possible contribution from submarinegroundwater discharge (SGD) to the missing flux wasoverlooked. In this contribution we demonstrate that, to
a first approximation, SGD to the oceans can account forthe “missing Nd flux”, and as a consequence, is likely animportant component of the global oceanic Nd budget.
2. Background
2.1. Oceanic Nd enigma
The εNd(0) values of seawater (e.g., mean εNd(0)values range from −12.8 to −4.2; Table 1) aresubstantially less radiogenic than oceanic basalts (i.e.,εNd(0)=+7 to +13 for mid-ocean ridge basalts) anddeep-sea hydrothermal fluxes (εNd(0) =+5.2±1.5)[1,2,16]. These observations, along with the fact thatsurface waters are more radiogenic than correspondingdeep waters, indicates that hydrothermal inputs from themid-ocean ridges, and/or other deep-sea sources, areinsignificant compared to continental sources of Nd tothe oceans [e.g., 3,16, and references therein]. Indeed,the inter-oceanic variation in Nd isotope ratios (Table 1)chiefly reflects the composition and age of rocks thatcomprise the surrounding continents. Thus, for example,rivers draining Precambrian shield rocks and Paleozoicorogenic belts on either side of the Atlantic contributerelatively non-radiogenic Nd to the Atlantic Ocean,whereas the more radiogenic Nd signatures of PacificOcean waters reflect rivers draining the young,Cenozoic volcanic rocks that characterize the Pacificmargin [4–7]. There is a general increase in oceanic εNd(0) values in the direction of deep water circulation asprogressively more radiogenic Nd is added to the oceanas deep water flows from the Atlantic to the Pacific [3].The progressive increase in εNd(0) values in thedirection of deep water flow, along with the distinct
Table 1Arithmetic mean (±S.D.) Nd isotope compositions, reported as εNd(0),and Nd concentrations (in pmol/kg) including number of analyses forthe World's oceans a
Ocean εNd(0)(±S.D.) b
n pmol/kg(±S.D.)
n
Atlantic −12.8±3.8 162 20.5±9.8 227IndianWestern and eastern basins −6.6±2.5 71 17.7±8.1 118Western basins c −8.1±1 26 18.3±8.6 24
Pacific −4.2±1.9 75 18.8±11.4 252Arctic −9.1 d 1 23.3±5.9 80Global Ocean −9.3±5 306 19.7±9.9 680
a Calculated using previous published data [1–9,15,19–26], andreferences in [27].b Present day 143Nd/144Nd ratio of CHUR is 0.512638 [13].c Data from Bertram and Elderfield [3].d Jones Sound water, Canadian archipelago [7].
130 K.H. Johannesson, D.J. Burdige / Earth and Planetary Science Letters 253 (2007) 129–142
Autho
r's
pers
onal
co
py
εNd(0) values of different water masses within individ-ual oceans indicate that advective processes are alsoimportant in controlling the distribution of Nd in theoceans [3,5,6].
The distinctly different εNd(0) values of the Atlantic,Indian, and Pacific Oceans (Table 1) suggest that theoceanic residence time of Nd (i.e., τNd) must be similarto, or less than, the mixing time of the oceans (∼500–1500 yr) in order to preserve these distinct inter-oceandifferences [9]. However, the residence time for Nd,calculated based on river fluxes, ranges from 4000 to15,000 yr [3,15,17,18]. These estimated Nd residencetimes are therefore too long to preserve the inter-oceanvariation in εNd(0), and should instead producerelatively homogeneous εNd(0) values for the globalocean. To reconcile this oceanic Nd enigma, an as yetunidentified additional source of Nd to the ocean isnecessary [14,16,17]. The so-called “missing Nd flux”would: (1) need to be sufficient to lower the calculatedresidence time of Nd by approximately an order of mag-nitude; and (2) possess distinctly different 143Nd/144Ndratios, on a regional scale, which are similar to localriver waters draining into each ocean basin [14,18]. Inorder to balance the oceanic Nd budget and preservethe inter-oceanic variations in εNd(0) values, Tachi-kawa et al. [14] estimated the annual missing Nd fluxto the surface oceans to be on the order of 5.4×10⁷ molof Nd/yr.
As mentioned above, sources of the missing Nd fluxhave been the subject of substantial speculation[3,9,16,17,24,28–35]. Considering atmospheric fluxesfirst, Greaves et al. [28] estimated an atmospheric flux of4.4×106 mol of Nd/yr, which is similar to the value(2.8×10⁶ mol Nd/yr) suggested by Tachikawa et al.[14]. In contrast, Jones et al. [36] argue that eoliansources of Nd to the oceans are insignificant. Theseauthors demonstrate that the chief source of dust thatsettles onto the Pacific Ocean originates from Chineseloess and other continental (Asia) sources. These eoliansilicates exhibit a mean (±S.D.) εNd(0)=−10.2±0.5,which differs substantially from the more radiogenicεNd(0) values of Pacific Ocean waters (i.e., εNd(0)=−4.2±1.9; Table 1). Moreover, they argue that leachingof Nd from settling particles must also be insignificantas Pacific surface waters are more radiogenic than deepwaters [36]. After ruling out atmospheric deposition,volcanic ash, and hemipelagic sediments, Jones et al.[36] settle on near-shore river derived particulates as thechief source of particle delivered REEs to the oceans.Studies employing Nd isotopes [9,24,29] suggest,however, that the fraction of Nd in atmospheric particlesthat is solubilized in seawater may be greater than the
estimate determined previously [28] by measuring Ndconcentrations (e.g., as much as 50% vs. ∼2%,respectively). Tachikawa et al. [14] argue that if 30%of the atmospheric dust associated Nd dissolved inseawater, the flux of Nd to the surface oceans(∼4.2×10⁷ mol/yr) would almost be sufficient toaccount for the missing Nd (∼5.4×10⁷ mol/yr).However, their estimated εNd(0) values for the postulatedlarger atmospheric Nd flux are too radiogenic for theNorth Atlantic Ocean (i.e., εNd(0)=−15 vs.−20) and notradiogenic enough for the Pacific Ocean (εNd(0)=−7 to−5 vs. −4), indicating that an increased atmospheric fluxcannot account for the observed regional differences inNd isotope sources to the oceans [14].
Bertram and Elderfield [3] constructed a multi-box,mass balance model to investigate Nd concentrationsand isotopic compositions in the oceans. These authorsset out to test whether the model could resolve thedifference in measured εNd(0) values of the ocean withthe distribution of Nd concentrations. The model wasable to satisfactorily address Nd concentrations viaadvective fluxes, however, it was necessary to invokecomplex solution-particle exchange to attain reasonableagreement between the calculated and measured inter-ocean εNd(0) variations [3]. Other researchers [9] havemade similar arguments involving complex solution-particle exchange to explain the εNd(0) values. Bertramand Elderfield [3] also point out that larger Nd fluxes tothe surface ocean could reconcile the Nd enigma whilepreserving the inter-ocean εNd(0) values; however, theyargue against larger influxes based on the relatively wellconstrained river inputs [16] and difficulties in quanti-fying the atmospheric flux [14,24,28]. Although it iswell known that estuaries act as sinks for riverine REEs,thus limiting riverine inputs of Nd to the ocean [e.g.,16,17], more recent studies [30–33] suggest thatredissolution of particulate- or sediment-associated Ndin mid- to high-salinity regions of estuaries mayrepresent an additional source of Nd to the oceans notaccounted for in previous models. However, if the 70%of the dissolved riverine Nd flux that is estimated to beremoved in estuaries were to be redissolved back intoestuarine water in the mid- to high-salinity reaches ofestuaries, this additional flux (∼6.9×10⁶ mol/yr) wouldonly account for ∼13% of the missing Nd flux to theoceans [14], and thus could not explain the vast majorityof the missing flux.
Interaction of seawater with continental marginsediments/pore waters has also been advanced as a pos-sible additional source of REEs to the oceans. Studieshave shown that early diagenesis of shelf sedimentsleads to elevated pore water REE concentrations and
131K.H. Johannesson, D.J. Burdige / Earth and Planetary Science Letters 253 (2007) 129–142

Autho
r's
pers
onal
co
py
subsequent diffusive fluxes of REEs to the overlyingwater column that are comparable to local river fluxes[34,37,38]. However, even if diffusive pore water fluxesof REEs were equivalent to the effective riverine flux ona global basis, the combination of riverine and diffusivepore water fluxes would also only amount to ∼13% ofthe missing Nd flux. Other processes occurring alongcontinental margins such as dissolution and resuspen-sion of continental shelf and/or slope sediments mayplay a role in maintaining the inter- and intra-ocean εNd(0) variations [14,35]. Lacan and Jeandel [35] presentdata that supports remobilization (i.e., dissolution/resuspension) of continental margin sediments asbeing important towards the development of local andregional εNd(0) differences in the oceans. Thesearguments are further supported by studies of Ndconcentrations and isotope systematics in the northeastAtlantic Ocean, the eastern Indian Ocean, and the watersof the Indonesian archipelago [14,23–26].
2.2. Submarine groundwater discharge
One aspect of the global biogeochemical cycle of theREEs that is poorly understood, and is generally absentfrom most discussions of the missing Nd flux, is theimpact that SGD may have on the oceanic REE budget[e.g., 14]. Studies involving radium isotopes and othertracers (222Rn, CH4) indicate that groundwater dis-charge to the ocean is significant, and in some cases, onthe order of riverine inputs [40–42]. Furthermore, in thecase of some trace elements (e.g., Ba, Sr, REE), thechemical fluxes to the oceans via SGDmay even surpassthat of riverine fluxes [41,43–45]. Although there issome debate as to what constitutes SGD, a recent study[40] defines SGD to include all flow of water from theseafloor into the overlying marine water column withincontinental margin settings notwithstanding the physicaldriving mechanism and the chemical composition.Consequently, SGD can range in composition fromfresh to brackish to saline and be driven by numerousprocesses including, but not limited to, terrestrialhydraulic gradients, tidal pumping and/or wave set-up,geothermal and/or density gradients, highly pressurizedgroundwater flow from deep, confined aquifers, and/orevaporative/reflux cycling [40,42]. By this definition thediffusive pore water fluxes discussed above would alsoqualify as SGD.
Global estimates of SGD vary greatly depending on anumber of factors including whether the estimates onlyaccount for freshwater of terrestrial origin or alsoinclude landward cycling of marine water (i.e., recycledseawater). Global SGD estimates of fresh, terrestrial
groundwaters are reported to range between ∼5 to 10%of the annual global river water discharge to the ocean,with values towards the lower end of the range (i.e., 6%)generally considered to be more reasonable [40,42].Using a total river discharge value of 42,439 km3/yr [16],annual terrestrial-derived fresh SGD values are estimat-ed to range from 2122 to 4244 km3 (2546 km3/yr for6%). It is important to note that estimates of the annualinput of river water to the oceans reported in the literaturevary between ∼35,000 to 43,000 km3/yr [40, andreferences therein]. We chose the estimate reported byGoldstein and Jacobsen [16] in order to be consistentwith earlier investigations of global REE budgets. Whenbrackish and saline waters are included (i.e., the“intertidal and subtidal pumps” of [40]), global estimatesof SGD increase to as much as 100,000 km3/yr, or morethan double the river water inflow.
The remarkably high global SGD estimate of Burnettet al. [40] demonstrates the important role that mixingof freshwater of terrestrial origin with recycled sea-water within coastal aquifers is thought to play in go-verning the amount of SGD to the coastal oceans.Chemical reactions that occur during sub-surfacemixing of fresh (terrestrial) groundwater and seawater,as well as chemical reactions between these fluids andaquifer surfaces dramatically impact the chemicalcomposition of the fluids eventually discharged to thecoastal oceans [43–47]. Biogeochemical reactionslikely to be important include, among others, carbonatemineral dissolution/precipitation resulting fromchanges in mineral saturation states, oxidation-reduc-tion of Fe–Mn oxides/oxyhydroxides and subsequenttrace element scavenging and/or release to solution(e.g., via reductive dissolution), ion exchange, andcomplexation with dissolved ligands [43–47]. As a
Table 2Estimated atmospheric fluxes of Nd (mol/yr) and εNd(0) values to thesurface ocean
% Surface area a JNdAtm
(mol/yr) bεNd(0)
Atm (n)
Atlantic 25.03 7×10⁵ −12.2±1.8 (26)Indian 21.85 6.1×10⁵ −13.8 c (1)Pacific 49.47 1.2×10⁶ −10.1±0.5 (3)Arctic 3.65 1×10⁵ −9.1 d
Global 100 2.8×10⁶, b −12.3±1.6 e (43)a Percent of global ocean surface area [48].b Global flux value is from [14] and fluxes for each ocean are
product of the global flux and % surface area.c One analysis [49].d Jones Sound water, Canadian archipelago [7].e Estimated from εNd(0) data for aerosols from Atlantic, Indian, and
Pacific Oceans, and Mediterranean Sea [9,19,24,29,39,49].
132 K.H. Johannesson, D.J. Burdige / Earth and Planetary Science Letters 253 (2007) 129–142

Autho
r's
pers
onal
co
py
consequence, the effect of such mixing and surfacereactions on the loading of some trace elements (e.g.,Ba, Sr, REEs) to the coastal oceans is suspected to besubstantial [43–47].
3. Methods
3.1. Data acquisition and analytical techniques
Neodymium concentrations and isotope data forseawater, river waters, groundwaters, aerosols, andmarine particulate matter were obtained from theliterature or from previous investigations by one of theauthors (i.e, KHJ). Descriptions of the analyticaltechniques employed to measure Nd concentrationsand isotope ratios can be found in the publishedliterature from which these data were obtained (seeTables 1–3). It should be noted that the majority ofstudies (∼80%) from which the groundwater Nd datawere extracted represent samples filtered through0.45 μm pore-size filters, with the remaining ∼20%filtered through 0.1, 0.2, or 0.22 μm pore-size filters. AllεNd(0) values obtained from the literature that wereoriginally calculated relative to present day 143Nd/144Ndvalues for CHUR of 0.511847 or 0.512636 were re-calculated to a present day value of 0.512638 [13]. AllNd concentration data generated by the authors (i.e.,KHJ) were quantified on filtered (Gelman Sciences,0.45 μm, polyether sulfone membrane) and acidified(ultrapure HNO3; Seastar Chemicals) groundwatersamples using inductively coupled plasma mass spec-trometry (ICP-MS) by monitoring 143Nd, 145Nd, and146Nd, and using 115In as an internal standard (see [27]for details). Calibration of the ICP-MS was achievedand Nd concentrations verified using a series of REEcalibration standards of known concentrations (e.g., 0.1,2, 10, 100, 250, 500, 1000 ng/kg) prepared from NISTtraceable High Purity Standards (Charleston, SC).Check standards were prepared from Perkin–Elmer
multi-element solutions and were routinely monitoredduring analysis.
3.2. Model calculations
Because fluxes of REEs to the ocean from SGD havenot been measured, and hence are not known on either aglobal or local basis, constructing a detailed quantitativemodel that can address SGD of Nd to the oceans isconsidered premature at the present time. Nevertheless,the possibility that groundwater plays an important rolein the oceanic budget of Nd can be addressed, to a firstapproximation, by comparing the missing Nd flux withestimates of the SGD Nd flux to the ocean calculatedusing Nd data from the groundwater literature andestimates of global SGD. There are a number ofimportant caveats to consider when estimating theSGD flux of Nd to the coastal oceans in this mannerincluding the effects of colloids, redox reactions, and thefact that the flux of salty groundwater (i.e., recycledseawater) is likely considerably greater than the fresh,terrestrial SGD flux [40,45–47]. The combined effect ofthese processes on the global SGD flux of Nd is,however, difficult to constrain owing to insufficientdata. Nonetheless, we show here that, at least to a firstapproximation, SGD is a likely source of the missing Ndflux to the oceans. In the simplified approachedfollowed in this exercise, we treat each ocean basin(i.e., Atlantic, Indian, Pacific, and Arctic) as a separate,well-mixed reservoir of uniform Nd concentration andisotope composition. We employ the effective dischargeweighted mean riverine flux and εNd(0) values ofGoldstein and Jacobsen [16], and use mean Ndconcentrations and εNd(0) values for groundwaterscalculated from data compiled from the literature toestimate SGD Nd fluxes to the ocean.
Table 1 presents average εNd(0) values and Ndconcentrations for the four major ocean basins (i.e.,Atlantic, Indian, Pacific, and Arctic) obtained from the
Table 3Summary of weighted average Nd concentrations (pmol/kg), river Nd fluxes (mol/yr), and εNd(0) of rivers draining to each ocean, as well as theglobal averaged from [16]
Q(km3/yr)
Nd(pmol/kg)
JNdRW JNd
RW-eff, a εNd(0)RW εNd(0)
RW-eff, a
Atlantic 20,323 386 7.8×10⁶ 2.3×10⁶ −12.65 −10.9Indian 4878 184 9×10⁵ 2.7×10⁵ −8.8 −9.7Pacific 13,123 198 2.6×10⁶ 7.8×10⁵ −2.95 −3.6Arctic 4115 150 6.2×10⁶ 1.9×10⁵ −10.4 −10.5Global 42,349 281 1.2×10⁷ 3.6×10⁶ −10.2 −9 (−8.5) b
a Assuming 70% removal in estuaries.b Estimate from [16].
133K.H. Johannesson, D.J. Burdige / Earth and Planetary Science Letters 253 (2007) 129–142

Autho
r's
pers
onal
co
py
literature. To the best of our knowledge, Nd isotope datafor the Arctic Ocean have not been published. Stordaland Wasserburg [7] pointed out, however, that the εNd(0) value of Jones Sound water (−9.1) in the Canadianarchipelago is substantially more radiogenic thanproximal Baffin Bay water, and thus, may be charac-teristic of Arctic Ocean water. Consequently, we employthe εNd(0) value of Jones Sound water as a surrogate forthe Arctic Ocean in our calculations. It should be noted
that the Arctic Ocean does not play a prominent role inour calculations.
Atmospheric fluxes of Nd and the correspondingεNd(0) values used in the model calculations arepresented in Table 2. The global atmospheric Nd fluxto the ocean (2.8×10⁶ mol/yr) was estimated byTachikawa et al. [14] assuming a total aerosol input of9.1×1014 g/yr, a Nd concentration of 20 ppm for theaerosols [39,49], and dissolution of 2% of the aerosol
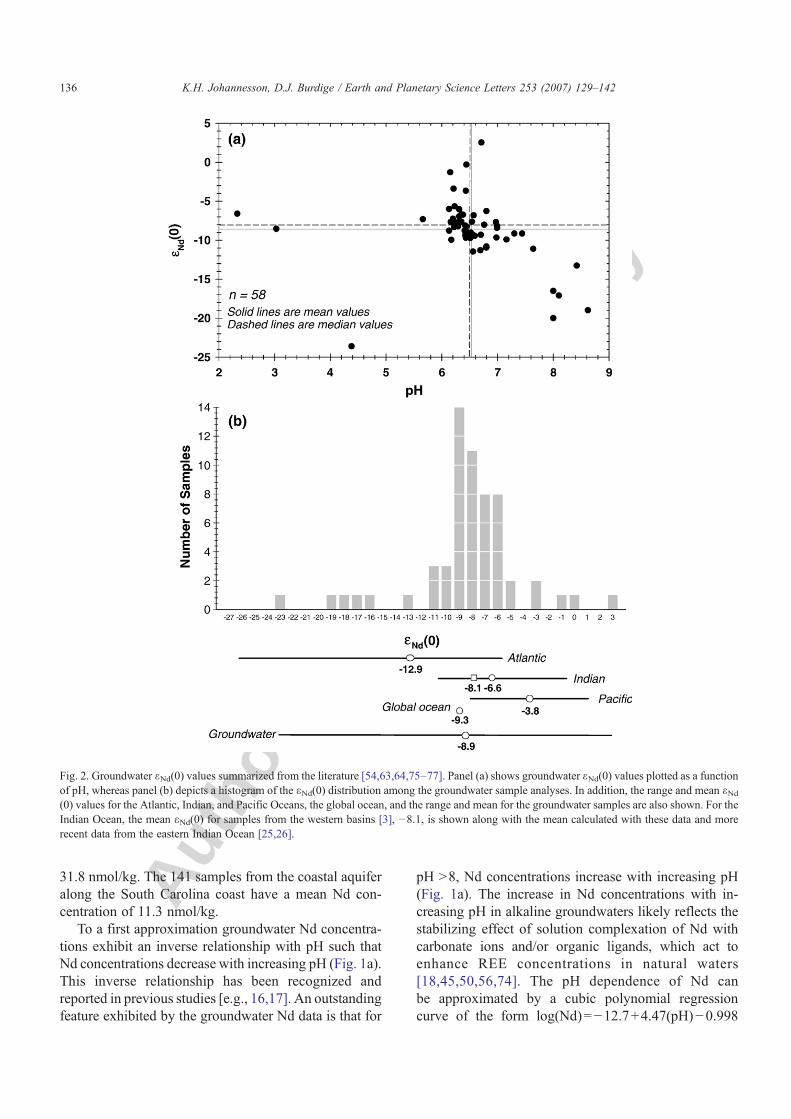
Fig. 1. Concentrations of Nd in groundwater samples as (a) function of pH and (b) histogram showing numbers of analyses within specifiedconcentration ranges. Data are summarized from the literature [27,45,50–73]. The pH functionality of Nd concentrations can be approximated with acubic polynomial regression equation (blue dashed line) of the form: log(Nd)=−12.7+4.47pH−0.998(pH)2+0.059(pH)3. Approximately 80% of thestudies from which these REE data were obtained employed 0.45 μm pore-size filters during sample processing prior to acidification and subsequentanalysis. The remaining 20% of the studies used 0.1 μm, 0.2 μm, or 0.22 μm pore-size filters.
134 K.H. Johannesson, D.J. Burdige / Earth and Planetary Science Letters 253 (2007) 129–142

Autho
r's
pers
onal
co
py
associated Nd upon contact with seawater [28]. Wesubsequently estimate the atmospheric Nd flux, JNd
Atm, i,to each ocean (i=Atlantic, Indian, Pacific, Arctic) bymultiplying the global flux by the relative surface areaof the global ocean occupied by each individual ocean[48]. This approach only provides a first approxima-tion as atmospheric deposition can vary substantially,for example, as a function of distance from continentalland masses [36]. The estimated εNd(0)
Atm, i values forthe atmospheric Nd flux to each ocean basin are themean of published values of aerosols for each ocean(Table 2).
Riverine Nd fluxes and εNd(0) values used in ourmodel calculations are presented in Table 3, and aresummarized from Goldstein and Jacobsen [16]. Thecritical values in Table 3 are the discharge-weighted,effective Nd flux, JNd
RW-eff, and the associated Nd isotopecomposition, εNd(0)
RW-eff, entering the ocean. Theeffective river flux of Nd is determined by assumingthat 70% of the riverine Nd is removed from solution inestuaries [3,16]. The global εNd(0)
RW-eff value (i.e.,−8.5) is weighted to the discharge of all rivers studiedby Goldstein and Jacobsen [16], whereas our estimate(−9) is weighted to the effective river water fluxes of Ndcontributing to each ocean (Table 3).
Using the data presented in Tables 1–3, Nd fluxes arecalculated as:
J iNd ¼X
i
QiCiNd ð2Þ
where Qi is the volumetric discharge or flux, CNd is theNd concentration, and i refers to specific reservoirs suchas individual ocean basins, the global ocean, theatmosphere, rivers, or groundwater. The Nd isotopecomposition of these fluxes is determined by:
eNdð0Þi ¼
X
jpi
J jYiNd d eNdð0Þ j
Pjpi
J jYiNd
ð3Þ
where the numerator is the sum of all Nd fluxes andcorresponding Nd isotope compositions contributing Ndto reservoir i, and the denominator is the Nd flux intothe reservoir [14,16].
We compare our model calculations to the calculatedinfluxes from external sources to the surface ocean deter-mined by Tachikawa et al. [14]. Using a 10-box model forthe global ocean, a global ocean Nd inventory of3×1010 mol, and the assumption that the oceanicresidence time of Nd is less than the ocean mixing time,these researcher determined that an annual global external
flux (i.e., Fiext) of ∼6×10⁷ mol of Nd was required to
balance the ocean Nd budget. The difference between thetotal external flux and the sum of the effective riverine andatmospheric Nd fluxes provides an estimate of themissingglobal Nd flux (i.e., 5.4×10⁷ mol/yr). Here, we compareour estimates of the SGDNd flux to themissingNd flux inorder to evaluate whether SGD can account for themissing flux. As an exercise, we also approximate missingNd fluxes to each ocean basin (i.e., Atlantic, Indian, Paci-fic, and Arctic) using the same approach. It is critical tostress, however, that although we provide estimates foreach ocean basin, we focus here on the global Nd fluxesand corresponding εNd(0) values in evaluating the signi-ficance of SGD as a source of the missing Nd.
To estimate the flux of Nd to the oceans resultingfrom SGD, we use a conservative approach employingan estimate of the terrestrial, “freshwater” component ofSGD (i.e., 6% of river discharge [40]) in combinationwith published Nd data for groundwaters. As mentionedabove, we compiled a data base of Nd concentrations(n=730) and εNd(0) values (n=58) for groundwatersfrom the published literature (Figs. 1 and 2). These datawere subsequently employed to estimate representativeNd concentrations and isotope compositions for modelgroundwaters discharging to the ocean. As a firstapproximation, we use the mean Nd concentration andεNd(0) value of the entire data set. In addition, weseparately employ the mean Nd concentration of 141analyses of groundwaters from a coastal aquifer in SouthCarolina, USA [45,67]. To the best of our knowledge,these are the only published REE data for an aquifer indirect hydraulic contact with the ocean. We recognizethat actual SGD will likely exhibit a range of Nd con-centrations and εNd(0) values owing to complex biogeo-chemical reactions occurring in subterranean estuaries(e.g., colloid coagulation, scavenging by Fe/Mn oxides)and seawater cycling through coastal aquifers [45].
4. Results and discussion
4.1. Groundwater Nd concentrations and εNd(0) values
Neodymium concentrations for groundwater samplesobtained from the literature are plotted in Fig. 1 as afunction of pH and as a histogram showing the totalnumbers of samples within specific concentrationranges. Because a number of analyses (141 samples)did not include accompanying pH data, the total numberof samples plotted on panels a and b of Fig. 1 differ bythis value. For the Nd data plotted in Fig. 1a, the mean ofthese 589 analyses is 33.5 nmol/kg, whereas the meanfor all 730 groundwater analyses (589+141; Fig. 1b) is
135K.H. Johannesson, D.J. Burdige / Earth and Planetary Science Letters 253 (2007) 129–142
Autho
r's
pers
onal
co
py
31.8 nmol/kg. The 141 samples from the coastal aquiferalong the South Carolina coast have a mean Nd con-centration of 11.3 nmol/kg.
To a first approximation groundwater Nd concentra-tions exhibit an inverse relationship with pH such thatNd concentrations decrease with increasing pH (Fig. 1a).This inverse relationship has been recognized andreported in previous studies [e.g., 16,17]. An outstandingfeature exhibited by the groundwater Nd data is that for
pH N8, Nd concentrations increase with increasing pH(Fig. 1a). The increase in Nd concentrations with in-creasing pH in alkaline groundwaters likely reflects thestabilizing effect of solution complexation of Nd withcarbonate ions and/or organic ligands, which act toenhance REE concentrations in natural waters[18,45,50,56,74]. The pH dependence of Nd canbe approximated by a cubic polynomial regressioncurve of the form log(Nd)=−12.7+4.47(pH)−0.998
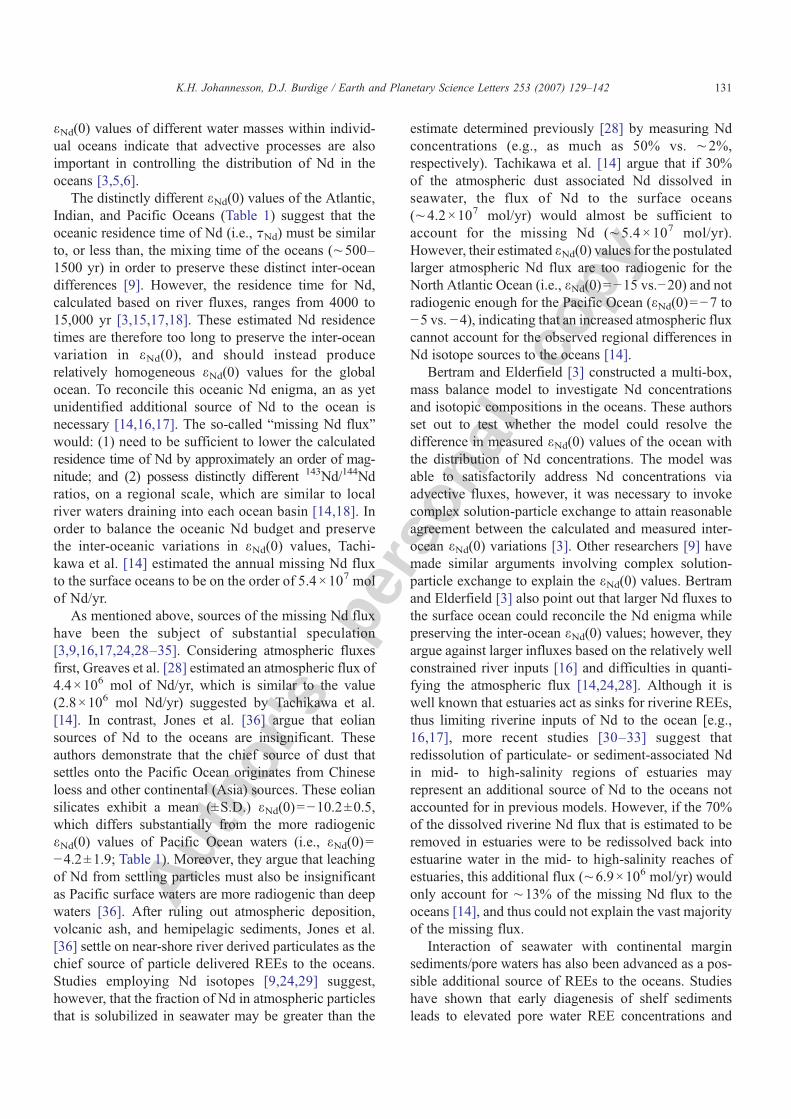
Fig. 2. Groundwater εNd(0) values summarized from the literature [54,63,64,75–77]. Panel (a) shows groundwater εNd(0) values plotted as a functionof pH, whereas panel (b) depicts a histogram of the εNd(0) distribution among the groundwater sample analyses. In addition, the range and mean εNd(0) values for the Atlantic, Indian, and Pacific Oceans, the global ocean, and the range and mean for the groundwater samples are also shown. For theIndian Ocean, the mean εNd(0) for samples from the western basins [3], −8.1, is shown along with the mean calculated with these data and morerecent data from the eastern Indian Ocean [25,26].
136 K.H. Johannesson, D.J. Burdige / Earth and Planetary Science Letters 253 (2007) 129–142

Autho
r's
pers
onal
co
py
(pH)2 +0.059(pH)3, where (Nd) is the concentration(Fig. 1a).
Fig. 2 presents Nd isotope data for groundwatersobtained from the literature plotted as a function of pHand as a histogram that shows the frequency of sampleanalyses with specific εNd(0) values. The εNd(0) valuesrange from −23.6 to+2.5, and exhibit a mean (±S.D.) of−8.9±4.2. The range and mean εNd(0) values for thegroundwater samples are compared to the range andmean values of the Atlantic, Indian, and Pacific Oceans,and the global ocean in Fig. 2b. The range in εNd(0)values for the groundwater samples is similar to that ofthe global ocean, albeit, shifted to slightly moreradiogenic values. The small shift in εNd(0) values ofgroundwaters compared to the global ocean may reflectthe fact that many of the groundwater samples are fromaquifers composed of Phanerozoic rocks [63].
An interesting feature of the εNd(0) data is that thebulk of the analyses for circumneutral to alkaline pHgroundwaters appear to exhibit a relationship with pH(Fig. 2a). Specifically, as pH increases from 6 to 9, theεNd(0) values become progressively less radiogenic(Fig. 2a). As is the case with other natural waters, theεNd(0) of groundwaters should reflect the age andisotopic composition of the chief source of Nd to thewater, which in the case of groundwaters are aquiferrocks, minerals, and/or organic matter [1,7,16,63]. Thus,to a first approximation, changes in water chemistry(i.e., pH) and other biogeochemical reactions are notexpected to affect the Nd isotope composition ofgroundwater [16]. Closer inspection of the εNd(0) datain Fig. 2 reveals that the majority of the more radiogenic
groundwaters with pH values between 6 and ∼7.5 arefrom aquifers composed of Phanerozoic rocks of theMassif Central in France, whereas the non-radiogenicgroundwaters with pH N8 are from fractured Proterozoicrocks in Finland [63,64]. The groundwater sample withthe lowest εNd(0) value (−23.6), and which is relativelyacidic (pH ∼4.4), is from a region of central Africanunderlain by the late Archean Congo Craton [76].Hence, although sparse, the available groundwater datado not support a pH functionality for εNd(0).
In summary, the data in Figs. 1 and 2 demonstratethat concentrations of REEs in groundwaters arecontrolled to a large degree by solution composition[e.g., 16–18,50,56], whereas the Nd isotope composi-tion reflects the composition, and in particular, the ageof the aquifer rocks/minerals [63,64]. Hence, εNd(0)values should prove to be more powerful tracers ofgroundwater flow, mixing, and water-rock reactionsthan input-normalized REE fractionation patterns.
4.2. Groundwater Nd fluxes to the ocean
The results of the model calculations described inSection 3.2 are reported in Table 4. Using the overallmean Nd concentration of 31.8 nmol/kg from thecompiled groundwater Nd data base (n=730) as anestimate of the global average Nd concentration ofgroundwater, and assuming that SGD amounts to 6% ofriver discharge to the ocean on a global basis [40], aglobal SGD Nd flux of 8.1×10⁷ mol/yr is estimated. Bycomparison, when the mean Nd concentration of thecoastal groundwaters from South Carolina (i.e.,
Table 4Comparison of estimated groundwater (GW) Nd fluxes and Nd isotope compositions to the ocean and the missing Nd flux [14]
JNdext,a JNd
RW-eff+JNdAtm JNd
missing,b εNd(0)missing,c JNd
GW-all,d εNd(0)GW-all,e JNd
GW-coast,d,f εNd(0)GW-coast,e Nd g (nmol/kg)
Atlantic 1.5×10⁷ 3×10⁶ 1.2×10⁷ −13.2 3.9×10⁷ −12.9 1.4×10⁷ −13.2 9.8Indian 1.3×10⁷ 8.8×10⁵ 1.2×10⁷ −6.6 (−7.9) h 9.3×10⁶ −6.3 (−7.9) h 3.3×10⁶ −5.8 (−7.5) h 41Pacific 3×10⁷ 2.2×10⁶ 2.8×10⁷ −3.9 2.5×10⁷ −4 8.9×10⁶ −3.7 35.6Arctic 2.2×10⁶ 2.9×10⁵ 1.9×10⁶ −9 7.8×10⁶ −9.1 2.8×10⁶ −9 7.7Global 6×10⁷, a 6.4×10⁶ 5.4×10⁷, b −9.2 8.1×10⁷ −9.2 2.9×10⁷ −9.0 21.2a Model estimate for global external Nd flux (mol/yr) to surface ocean from [14]. Values for each ocean estimated based on the percentage of global
ocean surface area occupied by each [48].b JNd
missing=JNdext− (JNdRW-eff+JNd
Atm). All fluxes in mol/yr.c εNd(0)
missing, i=(εNd(0)i·JNd
ext,i−εNd(0)RW-eff, i·JNdRW-eff, i−εNd(0)Atm,i ·JNd
Atm,i) /JNdmissing, i, where i=Atlantic, Indian, Pacific, Arctic, or the Global
ocean.d SGD assumed to be 6% of river discharge [40] to each ocean basin (i.e., Atlantic, Indian, Pacific, Arctic) and the global ocean (Table 3), and using
a Nd concentration of 31.8 nmol/kg, which is the mean Nd concentration determined from the groundwater (GW) data displayed in Fig. 1.e εNd(0)
GW, i=(εNd(0)i·∑JNd
i −εNd(0)RW-eff, i·JNdRW-eff, i−εNd(0)Atm,i ·JNd
Atm,i) /JNdGW, i, where i is the same as for c, and Σ JNd
i =JNdRW-eff, i+JNd
Atm,i+JNdGW, i.
f SGD assumed to be 6% of river discharge [40] to each ocean basin (i.e., Atlantic, Indian, Pacific, Arctic) and the global ocean (Table 3), and usinga Nd concentration of 11.3 nmol/kg, which is the mean Nd concentration of groundwaters from a coastal aquifer from the South Carolina coast[45,67].g Nd concentration required for SGD of 6% river discharge to account for the missing Nd flux.h Using εNd(0)
Indian=−8.1 [3].
137K.H. Johannesson, D.J. Burdige / Earth and Planetary Science Letters 253 (2007) 129–142

Autho
r's
pers
onal
co
py
11.3 nmol/kg, n=141) is used in the calculation, anestimate of 2.9×10⁷ mol/yr of Nd delivered to the oceanon a global scale is obtained (Table 4). These estimatesof the SGD Nd flux are of the same order of magnitudeas the missing global Nd flux (5.4×10⁷ mol/yr). Theglobal SGD Nd flux estimated using the mean Ndconcentration of the entire groundwater data base(8.1×10⁷ mol/yr) is a factor of 1.5 larger than themissing Nd flux, whereas the SGD Nd flux estimatedusing the coastal groundwaters (2.9×10⁷ mol/yr) is lessthan a factor of 2 lower than the missing Nd flux. Thus,our first approximations of the global SGD Nd fluxbracket the missing Nd flux, differing from the missingflux by less than a factor of 2.
Because the majority of REE data for groundwaterreported in the literature and used in our calculationswere filtered through 0.45 μm pore-size filters, thepossibility that colloids account for substantial fractionsof Nd cannot be ruled out. In seawater, the bulk of theNd inventory is thought to be in solution (i.e.,b0.45 μm) and not colloidal [3,15,18]. Althoughimportant, in the absence of high organic matterconcentrations the effects of colloids on REEs in riverwaters is likely minimal compared to groundwaterswhere colloids can account for substantial fractions ofaqueous REEs [45,60]. Nevertheless, studies clearlydemonstrate that, on average, ∼70% of the river borneREE load is removed in estuaries owing to colloidcoagulation processes [16,30,31]. The “effective riverflux” employed in our model calculations takes intoconsideration estuarine removal by colloid coagulation[16]. If we similarly assume that ∼70% of Nd in SGD isremoved within subterranean estuaries by colloidcoagulation and/or other processes (e.g., adsorption,scavenging by metal oxides), we arrive at SGD Ndfluxes of 8.7×10⁶ to 2.4×10⁷ mol/yr. These SGD Ndflux estimates are a factor of 6 and 2 lower, respectively,than the missing Nd flux. Thus, even accounting forsimilar amounts of REE removal within subterraneanestuaries as reported for surface estuaries results inSGD Nd fluxes that can account for at least 20% ormore of the missing Nd flux.
As alluded to above, redox reactions involving Feand/or Mn oxides/oxyhydroxides also likely exertimportant controls on the SGD flux of Nd to coastaloceans. Charette and Sholkovitz [47], for example,show that substantial removal of dissolved Fe occurs ina subterranean estuary beneath Cape Cod, Massachu-setts, as reducing, terrestrial groundwaters encounteroxidizing, recycled seawater. The oxidation and removalof Fe in the subterranean estuary is expected to scavengeREEs from solution, possibly decreasing the SGD flux
of Nd to the coastal oceans. It is important to note,however, that Duncan and Shaw [45] present evidenceof a significant REE source in the subterranean estuary,which they attribute to oxidation of organic matter andregeneration of a solid, REE-enriched phase in theaquifer sediments as seawater is recycled through thecoastal aquifer. These observations suggest that recy-cling of seawater through coastal aquifers may diminishthe net removal of REEs as terrestrial groundwatersmove to the coastal ocean, and potentially may enhancethe SGD flux of Nd to the coastal oceans over thatoriginating from the fresh, terrestrial groundwatercomponent. Hence, our results may underestimate theSGD flux of Nd to the oceans, especially in thoseestimates that assume 70% removal of Nd in subterra-nean estuaries. Without additional data it is difficult toevaluate the importance of Nd removal from SGDowing to colloid coagulation and redox-related scav-enging versus that remobilized from aquifer sedimentsas seawater is recycled through coastal aquifers.Consequently, we are somewhat limited to a simplifiedapproach that does not explicitly address these process-es. In addition to measuring SGD fluxes, and the Ndconcentrations and isotopic compositions of thesefluxes, future investigations should establish whetherNd removal in subterranean estuaries via colloidcoagulation and scavenging by precipitating Fe/Mnoxides/oxyhydroxides is balanced or exceeded byremobilization of Nd from aquifer sediments by saltygroundwaters of marine origin.
Given the range of Nd concentrations reported forgroundwaters (Fig. 1), and our conservative choice toemploy the global estimate of freshwater SGD (6% ofriver discharge), the similarities in the missing Nd fluxand our estimated SGD Nd fluxes are nonethelesscompelling. These estimates of the SGD Nd flux to theglobal ocean strongly suggest that groundwater dis-charge to the coastal ocean could account for themissing Nd flux. The agreement also indicates thatTachikawa et al.'s [14] estimate of the missing Nd fluxis reasonable.
Table 4 also provides estimates of the Nd isotopecomposition of the missing Nd flux and that of SGD,again assuming that SGD amounts to 6% of the riverdischarge to the ocean. Our estimates of the εNd(0) valueof the global SGD Nd flux (i.e., −9.2 to −9) are similarto our estimate of the εNd(0) composition of the missingNd flux (−9.2). In addition, the εNd(0) values of themissing Nd flux and the estimated SGD Nd flux areidentical, within error, to the mean groundwater εNd(0)value calculated from the compiled data base (−8.9±4.2; Fig. 2). Moreover, the estimate of εNd(0) for the
138 K.H. Johannesson, D.J. Burdige / Earth and Planetary Science Letters 253 (2007) 129–142

Autho
r's
pers
onal
co
py
missing Nd flux determined by Tachikawa et al. [14],i.e., −8.6, is also identical, within error, to the mean εNd(0) value for groundwaters from the compiled data base(Fig. 2). It should be noted that our estimate of εNd(0)for the missing Nd flux differs slightly (i.e., 6.5%) fromthat of Tachikawa et al. [14] owing to differences in howwe partitioned the global ocean (i.e., Atlantic, Indian,Pacific, Arctic vs. the 10 box model of [14]).Nevertheless, the similarities in the εNd(0) values ofthe missing Nd flux, the predicted εNd(0) values of theglobal SGD Nd fluxes, and the actual Nd isotopecomposition of groundwaters reported in the literaturestrongly points towards SGD as the source of themissing Nd flux, and hence, as an important componentof the global oceanic Nd budget.
The last column of Table 4 presents the Ndconcentration that would be required for SGD amountingto 6% of the global river discharge to account for themissing Nd flux. The required Nd concentration (i.e.,21.2 nmol/kg) is intermediate between the mean Ndconcentration calculated using the entire groundwater Nddata base (31.8 nmol/kg), and that of the coastalgroundwaters (11.3 nmol/kg). If, on the other hand,∼70% ofNd is removed in subterranean aquifers, the pre-removal Nd concentration in the terrestrial component ofSGD required to balance the oceanic Nd budget would be71 nmol/kg, which exceeds Nd concentrations reportedfor terrestrial groundwaters from a coastal aquifer [67].However, accounting for recycling of seawater in coastalaquifers, Burnett et al. [40] suggest that global SGD maybe as much as 100,000 km3/yr, which is more than doublethe global river discharge. A flux of this magnitude wouldonly require a Nd concentration of 0.54 nmol/kg toaccount for the missing Nd flux. Clearly, more data arerequired to better constrain the importance of SGD to theoverall oceanic Nd budget.
Table 5 presents oceanic Nd residence times, τNd,calculated based on the flux estimates in Table 4.Specifically, the Nd residence times are calculatedassuming a global oceanic Nd inventory of 3×10¹⁰ mol[16] and the sum of effective riverine Nd flux,atmospheric Nd flux, and the estimated SGD Nd fluxes.The oceanic residence time for Nd using the estimates ofthe SGD Nd flux range from 340 to 850 yr (averageτNd=600 yr; Table 5), which are shorter than, or similarto, the oceanic mixing time, and hence, are of the rightmagnitude to preserve the inter-ocean variation of εNd(0) values. The oceanic residence time of Nd calculatedusing the estimated SGD Nd fluxes agree well withthose of recent investigations [14,20,24].
To summarize, the results of our analysis of theavailable groundwater Nd concentration and isotope
data, in conjunction with the estimates of global SGDNd fluxes and corresponding εNd(0) values, stronglysuggest that groundwater discharge to the coastal oceanis the source of the missing Nd flux. Moreover, theoceanic residence time of Nd calculated using ourestimates of the SGD Nd flux to the ocean alsodemonstrate that SGD of Nd to the oceans is, to a firstapproximation, of the right order of magnitude to lowerprevious estimates of the oceanic residence time of Ndby roughly an order of magnitude, thus preserving thevariations in ocean Nd isotope composition. Conse-quently, our initial analysis of the available groundwaterNd concentration and isotope composition data indi-cates that future studies directed at resolving the oceanicNd enigma should focus on quantifying the contribu-tions from SGD.
4.3. Implications for paleoceanography
An underlying assumption in our Nd flux and oceanicresidence time calculations is that the global hydrologiccycle is at steady-state [78]. Although this assumption isapproximately valid for the short-term, it is clearlyuntenable over geologic time scales. As a consequenceof plate tectonics, the shifting of continents and oceanbasins throughout Earth history has demonstrativelyaltered ocean circulation patterns, and hence globalclimate, which in turn impacts the global hydrologiccycle [79]. A severe example of the plate tectonics-global climate link is the series of Neoproterozoicglaciation events (i.e., the so-called Snowball Earth) thataccompanied the break-up of the supercontinent Rodinia[80]. The application of Nd isotopes in the study ofpaleoceanography/paleogeography assumes that thebulk of the Nd delivered to the oceans occurs via rivers
Table 5Oceanic residence times for Nd estimated assuming SGD amounts to6% of river discharge to the oceans
Volume Nd inventory τNda
(km3) (moles) (years)
Atlantic 3.4×10⁸ b 7×10⁹ c 170–410Indian 3×10⁸ b 5.3×10⁹ c 290–440Pacific 7.3×10⁸ b 1.4×10¹⁰ c 520–1260Arctic 1.4×10⁷ b 3.4×10⁸ c 30–60Global 13.9×10⁸ d 3×10¹⁰ d 340–850a Range calculated based on estimates of SGDNd fluxes from Table 4
(i.e., 2.9×10⁷ or 8.1×10⁷ mol/yr) and the sum of the effective riverineand atmospheric fluxes.b Based on volume percent of each ocean [48].c Using mean Nd concentrations for each ocean and the global ocean
from Table 1.d Goldstein and Jacobsen [16].
139K.H. Johannesson, D.J. Burdige / Earth and Planetary Science Letters 253 (2007) 129–142

Autho
r's
pers
onal
co
py
draining the continents [16,17]. However, the oceanicNd enigma indicates that the effective riverine flux of Ndto the modern oceans is insufficient to account for theinter-ocean variations in reported εNd(0) values. Fur-thermore, our preliminary analysis suggests that SGDmay be the chief source of Nd to the modern ocean,exceeding the effective riverine flux by as much as 2 to23 times. As the relative amounts of groundwater andriver water discharging to the oceans can fluctuate withchanging climate [78], it is reasonable to expect that theproportions of groundwater-to river-derived Nd dischar-ging to paleo-oceans varied throughout geologic time.Consequently, although the Nd isotope signature ofauthigenic and biogenic minerals likely record the143Nd/144Nd ratios of the paleo-seawater within whichthey formed, the Nd isotope composition of the paleo-seawater reflects the relative importance of groundwater-derived versus river-derived Nd to the surface ocean atthat specific point in the geologic record [14]. Without abetter understanding of how SGD effects the Nd isotopecomposition of the modern ocean, it is difficult toascertain its impact on paleo-ocean εNd(0) values.Consequently, evaluating the effect that varying propor-tions of groundwater-versus river-derived Nd may haveon interpreting paleo-ocean circulation patterns and/orpaleo-geography from the geologic record will requiredetailed investigations of the Nd concentrations, isotopecompositions, and magnitudes of SGD Nd fluxes to themodern ocean.
5. Conclusions
Groundwater Nd concentration and εNd(0) data areemployed to test whether submarine groundwater dis-charge (SGD) to the ocean can account for the missing Ndflux, and therefore, balance the oceanic Nd budget. Thenecessity of an additional Nd flux (i.e., in addition to riverinfluxes) to the ocean stems from the fact that calculatedoceanic residence times for Nd exceed the mixing time ofthe ocean.We show that to a first approximation, SGD canaccount for the missing Nd flux. Using average Ndconcentrations of published groundwater data (31.8 nmol/kg for 730 analyses; 11.3 nmol/kg for 141 groundwatersamples from a coastal aquifer) and a conservativeestimate of the global SGD to the ocean (6% of riverdischarge), we demonstrate that the resulting SGD Ndfluxes (2.9×10⁷ to 8.1×10⁷ mol/yr) are within a factor of2 of the estimated missing Nd flux (5.4×10⁷ mol/yr).Furthermore, using the flux estimates we calculate an εNd(0) value of−9.1 for the SGDNd flux, which is consistentwith the predicted values for the missing Nd flux, andidentical to the mean (±S.D.) εNd(0) value of groundwater
samples reported in the literature (i.e., εNd(0)=−8.9±4.2). Applying the estimated SGD Nd fluxes, an averageoceanic residence time of 600 yr is determined for Nd.
Acknowledgments
This work was supported by NSF Grants INT-9912159, EAR-0001086, and EAR-0303761 to KHJ.We thank D. L. Hawkins Jr. for assistance with theregression curve for the Nd vs. pH data. Helpful reviewsbyE. R. Sholkovitz and two anonymous reviewers greatlyimproved the manuscript, as did the points raised by theeditor, H. Elderfield. This contribution also benefitedfrom discussions withW. S.Moore, T. J. Shaw, A. Paytan,M. A. Charette, and C. E. Oldham.
References
[1] D.J. Piepgras, G.J. Wasserburg, E.J. Dash, The isotopiccomposition of Nd in different ocean masses, Earth Planet. Sci.Lett. 45 (1979) 223–236.
[2] D.J. Piepgras, G.J. Wasserburg, Neodymium isotopic variationsin seawater, Earth Planet. Sci. Lett. 50 (1980) 128–138.
[3] C.J. Bertram, H. Elderfield, The geochemical balance of the rareearth elements and neodymium isotopes in the oceans, Geochim.Cosmochim. Acta 57 (1993) 1957–1986.
[4] D.J. Piepgras, G.J. Wasserburg, Isotopic composition of neo-dymium in waters from the Drake Passage, Science 217 (1982)207–214.
[5] D.J. Piepgras, G.J. Wasserburg, Rare earth element transport inthe western North Atlantic inferred from Nd isotopic observa-tions, Geochim. Cosmochim. Acta 51 (1987) 1257–1271.
[6] D.J. Piepgras, S.B. Jacobsen, The isotopic composition ofneodymium in the North Pacific, Geochim. Cosmochim. Acta52 (1988) 1373–1381.
[7] M.C. Stordal, G.J. Wasserburg, Neodymium isotopic study ofBaffin Bay water: sources of REE from very old terranes, EarthPlanet. Sci. Lett. 77 (1986) 259–272.
[8] A.J. Spivack, G.J. Wasserburg, Neodymium isotopic composi-tion of Mediterranean outflow and eastern North Atlantic,Geochim. Cosmochim. Acta 52 (1988) 2767–2773.
[9] C. Jeandel, J.K. Bishop, A. Zindler, Exchange of neodymium andits isotopes between seawater and small and large particles in theSargasso Sea, Geochim. Cosmochim. Acta 59 (1995) 535–547.
[10] F. Albarède, S.L. Goldstein, World map of Nd isotopes in sea-floor ferromanganese deposits, Geology 20 (1992) 761–763.
[11] F. Albarède, S.L. Goldstein, D. Dautel, The neodymium isotopiccomposition of manganese nodules from the Southern and Indianoceans, the global oceanic neodymium budget, and their bearingon deep ocean circulation, Geochim. Cosmochim. Acta 61(1997) 1277–1291.
[12] H.D. Scher, E.E. Martin, Circulation in the Southern Oceanduring the Paleogene inferred from neodymium isotopes, EarthPlanet. Sci. Lett. 228 (2004) 391–405.
[13] G.J. Wasserburg, S.B. Jacobsen, D.J. DePaolo, M.T. McCulloch,T. Wen, Precise determination of Sm/Nd ratios, Sm and Ndisotopic abundances in standard solutions, Geochim. Cosmo-chim. Acta 45 (1981) 2311–2323.
140 K.H. Johannesson, D.J. Burdige / Earth and Planetary Science Letters 253 (2007) 129–142

Autho
r's
pers
onal
co
py
[14] K. Tachikawa, V. Athias, C. Jeandel, Neodymium budget in themodern ocean and paleo-oceanographic implications, J. Geo-phys. Res. 108 (2003) 3254, doi:10.1029/1999JC000285.
[15] H. Elderfield, M.J. Greaves, The rare earth elements in seawater,Nature 296 (1982) 214–219.
[16] S.J. Goldstein, S.B. Jacobsen, The Nd and Sr isotopic systematicsof river-water dissolved material: implications for the sources andNd and Sr in seawater, Chem. Geol. 66 (1987) 245–272.
[17] S.J. Goldstein, S.B. Jacobsen, Rare earth elements in riverwaters, Earth Planet. Sci. Lett. 89 (1988) 35–47.
[18] R.H. Byrne, E.R. Sholkovitz, The marine chemistry andgeochemistry of the lanthanides, in: K.A. Gschneidner, L.Eyring (Eds.), The Handbook of the Physics and Chemistry ofRare Earths, vol. 23, Elsevier, 1996, pp. 407–593.
[19] K. Tachikawa, C. Jeandel, B. Dupré, Distribution of rare earthelements and neodymium isotopes in settling particulate materialof the tropical Atlantic Ocean (EUMELI site), Deep-Sea Res., I44 (1997) 1769–1792.
[20] D.J. Piepgras, G.J. Wasserburg, Influence of the Mediterraneanoutflow in the isotopic composition of neodymium in waters ofthe North Atlantic, J. Geophys. Res. 88 (1983) 5997–6006.
[21] C. Jeandel, Concentration and isotopic composition of Nd in theSouth Atlantic Ocean, Earth Planet. Sci. Lett. 117 (1993) 581–591.
[22] H. Shimizu, K. Tachikawa, A. Masuda, Y. Nozaki, Cerium andneodymium isotope ratios and REE patterns in seawater from theNorth Pacific Ocean, Geochim. Cosmochim. Acta 58 (1994)323–333.
[23] C. Jeandel, D. Thouron, M. Fieux, Concentrations and isotopiccompositions of neodymium in the eastern Indian Ocean andIndonesian Straits, Geochim. Cosmochim. Acta 62 (1998)2597–2607.
[24] K. Tachikawa, C. Jeandel, M. Roy-Barman, A new approach toNd residence time: The role of atmospheric inputs, Earth Planet.Sci. Lett. 170 (1999) 433–446.
[25] H. Amakawa, D.S. Alibo, Y. Nozaki, Nd isotopic compositionand REE pattern in the surface waters of the eastern Indian Oceanand its adjacent seas, Geochim. Cosmochim. Acta 64 (2000)1715–1727.
[26] F. Lacan, C. Jeandel, Tracing Papua New Guinea imprint on thecentral Equatorial Pacific Ocean using neodymium isotopiccompositions and rare earth element patterns, Earth Planet. Sci.Lett. 186 (2001) 497–512.
[27] K.H. Johannesson, D.L. Hawkins Jr., A. Cortés, Do Archeanchemical sediments record ancient seawater rare earth elementpatterns? Geochim. Cosmochim. Acta 70 (2006) 871–890.
[28] M.J. Greaves, P.J. Statham, H. Elderfield, Rare earth elementmobilization from marine atmospheric dust into seawater, Mar.Chem. 46 (1994) 255–260.
[29] F. Henry, C. Jeandel, J.-F. Minster, Particulate and dissolved Ndin the western Mediterranean Sea: sources, fates and budgets,Mar. Chem. 45 (1994) 283–305.
[30] E.R. Sholkovitz, The geochemistry of rare earth elements in theAmazon River estuary, Geochim. Cosmochim. Acta 57 (1993)2181–2190.
[31] E.R. Sholkovitz, The aquatic chemistry of rare earth elements inrivers and estuaries, Aquat. Geochem. 1 (1995) 1–34.
[32] E.R. Sholkovitz, H. Elderfield, R. Szymczak, K. Casey, Islandweathering: river sources of rare earth elements to the WesternPacific Ocean, Mar. Chem. 68 (1999) 39–57.
[33] E.R. Sholkovitz, R. Szymczak, The estuarine chemistry of rareearth elements: comparison of the Amazon, Fly, Sepik and the Gulfof Papua systems, Earth Planet. Sci. Lett. 179 (2000) 299–309.
[34] B.A. Haley, G.P. Klinkhammer, Complete separation of rare earthelements from small volume seawater samples by automated ionchromatography: method development and application to bethicflux, Mar. Chem. 82 (2003) 197–220.
[35] F. Lacan, C. Jeandel, Neodymium isotopes as a new tool forquantifying exchange fluxes at the continent-ocean interface,Earth Planet. Sci. Lett. 232 (2005) 245–257.
[36] C.E. Jones, A.N. Halliday, D.K. Rea, R.M. Owen, Neodymiumisotopic variations in North Pacific modern silicate sediment andthe insignificance of detrital REE contributions to seawater, EarthPlanet. Sci. Lett. 127 (1994) 55–66.
[37] H. Elderfield, E.R. Sholkovitz, Rare earth elements in the porewaters of reducing nearshore sediments, Earth Planet. Sci. Lett.82 (1987) 280–288.
[38] E.R. Sholkovitz, D.J. Piepgras, S.B. Jacobsen, The pore waterchemistry of rare earth elements in Buzzards Bay sediment,Geochim. Cosmochim. Acta 53 (1989) 2847–2856.
[39] F.E. Grousset, P.E. Biscaye, A. Zindler, J. Prospero, R. Chester,Neodymium isotopes as tracers in marine sediments as aerosols:North Atlantic, Earth Planet. Sci. Lett. 87 (1988) 367–378.
[40] W.C. Burnett, H. Bokuniewicz, M. Huettel, W.S. Moore, M.Taniguchi, Groundwater and pore water inputs to the coastalzone, Biogeochemistry 66 (2003) 3–33.
[41] W.S. Moore, Large groundwater inputs to coastal waters revealedby 226Ra enrichments, Nature 380 (1996) 612–614.
[42] W.S. Moore, The subterranean estuary: a reaction zone of groundwater and sea water, Mar. Chem. 64 (1999) 111–125.
[43] T.J. Shaw, W.S. Moore, J. Kloepfer, M.A. Sochaski, The flux ofbarium to the coastal waters of the southeastern USA: theimportance of submarine groundwater discharge, Geochim.Cosmochim. Acta 62 (1998) 3047–3054.
[44] A.R. Basu, S.B. Jacobsen, R.J. Poreda, C.B. Dowling, P.K.Aggarwal, Large groundwater strontium flux to the oceans fromthe Bengal Basin and the marine strontium isotope record,Science 293 (2001) 1470–1473.
[45] T.Duncan, T.J. Shaw, Themobility of rare earth elements and redoxsensitive elements in the groundwater/seawater mixing zone of ashallow coastal aquifer, Aquat. Geochem. 9 (2003) 233–255.
[46] M.A. Charette, E.R. Sholkovitz, C.M. Hansel, Trace elementcycling in a subterranean estuary: Part 1. Geochemistry of thepermeable sediments, Geochim. Cosmochim. Acta 69 (2005)2095–2109.
[47] M.A. Charette, E.R. Sholkovitz, Trace element cycling in asubterranean estuary: Part 2. Geochemistry of the pore water,Geochim. Cosmochim. Acta 70 (2006) 811–826.
[48] F.J. Millero, Chemical Oceanography, CRC Press, Boca Raton,Florida, 1996.
[49] S.L. Goldstein, R.K. O'Nions, P.J. Hamilton, A Sm–Nd isotopicstudy of atmospheric dusts and particulates from major riversystems, Earth Planet. Sci. Lett. 70 (1984) 221–236.
[50] K.H. Johannesson, M.J. Hendry, Rare earth element geochem-istry of groundwaters from a thick till and clay-rich aquitardsequence, Saskatchewan, Canada, Geochim. Cosmochim. Acta64 (2000) 1493–1509.
[51] A. Michard, F. Albarède, The REE contents of some hydrother-mal fluids, Chem. Geol. 55 (1986) 51–60.
[52] A. Michard, C. Beaucaire, G. Michard, Uranium and rare earthelements in CO2-rich waters from Vals-les-Baines (France),Geochim. Cosmochim. Acta 51 (1987) 901–909.
[53] B. Sanjuan, A.Michard, G.Michard, Influence of the temperatureof CO2-rich springs on their aluminium and rare-earth elementcontents, Chem. Geol. 68 (1988) 57–67.
141K.H. Johannesson, D.J. Burdige / Earth and Planetary Science Letters 253 (2007) 129–142

Autho
r's
pers
onal
co
py
[54] J.L. Banner, G.J. Wasserburg, P.F. Dobson, A.B. Carpenter, C.H.Moore, Isotopic and trace element constraints on the origin andevolution of saline groundwaters from central Missouri,Geochim. Cosmochim. Acta 53 (1989) 383–398.
[55] A. Michard, Rare earth element systematics in hydrothermalfluids, Geochim. Cosmochim. Acta 53 (1989) 745–750.
[56] K.H. Johannesson, K.J. Stetzenbach, V.F. Hodge, W.B. Lyons,Rare earth element complexation behavior in circumneutral pHgroundwaters: Assessing the role of carbonate and phosphateions, Earth Planet. Sci. Lett. 139 (1996) 305–319.
[57] A.J. Lewis, M.R. Palmer, N.C. Sturchio, A.J. Kemp, The rareearth element geochemistry of acid-sulphate and acid-sulphate-chloride geothermal systems from Yellowstone National Park,Wyoming, USA, Geochim. Cosmochim. Acta 61 (1997)695–706.
[58] P.E. van Middlesworth, S.A. Wood, The aqueous geochemistryof the rare earth elements and yttrium. Part 7. REE, Th, and Ucontents in thermal springs associated with the Idaho batholith,Appl. Geochem. 13 (1998) 861–884.
[59] K.H. Johannesson, I.M. Farnham, C. Guo, K.J. Stetzenbach,Rare earth element fractionation and concentration variationsalong a groundwater flow path within a shallow, basin-fillaquifer, southern Nevada, USA, Geochim. Cosmochim. Acta 63(1999) 2697–2708.
[60] A. Dia, G. Gruau, G. Olivié-Lauquent, C. Riou, J. Molénat, P.Curmi, The distribution of rare earth elements in groundwaters:assessing the role of source-rock composition, redox changes andcolloidal particles, Geochim. Cosmochim. Acta 64 (2000)4131–4151.
[61] M.I. Leybourne, W.D. Goodfellow, D.R. Boyle, G.M. Hall,Rapid development of negative Ce anomalies in surface watersand contrasting REE patterns in groundwaters associated withZn–Pb massive sulphide deposits, Appl. Geochem. 15 (2000)695–723.
[62] P. Möller, Rare earth elements and yttrium as geochemicalindicators of the source of mineral and thermal waters, in: I.Stober, K. Bucher (Eds.), Hydrogeology of Crystalline Rocks,Kluwer, Dordrecht, The Netherlands, 2000, pp. 227–246.
[63] Ph. Négrel, C. Guerrot, A. Cocherie, M. Azaroual, M. Brach, Ch.Fouillac, Rare earth elements, neodymium and strontium isotopicsystematics in mineral waters: evidence from the Massif Central,France, Appl. Geochem. 15 (2000) 1345–1367.
[64] Ph. Négrel, J. Casanova, R. Blomqvist, Nd isotopes and watermixing phenomena in groundwaters from Palmottu (Finland),Water Res. 35 (2001) 1617–1623.
[65] F. Worrall, D.G. Pearson, The development of acidic ground-waters in coal-bearing strata: Part I. Rare earth elementfingerprinting, Appl. Geochem. 16 (2001) 1465–1480.
[66] X.-P. Yan, R. Kerrich, M.J. Hendry, Distribution of the rare earthelements in porewaters from a clay-rich aquitard sequence,Saskatchewan, Canada, Chem. Geol. 176 (2001) 151–172.
[67] T.M. Duncan, Rare earth elements as tracers of coastal processes,PhD dissertation, Univ. South Carolina (2002) 103 pp.
[68] R.P.T. Janssen, W. Verweij, Geochemistry of some rare earthelements in groundwater, Vierlingsbeek, The Netherlands, WaterRes. 37 (2003) 1320–1350.
[69] P. Möller, E. Rosenthal, P. Dulski, S. Geyer, Y. Guttman, Rareearths and yttrium hydrostratigraphy along the Lake Kinneret–Dead Sea–Arava transform fault, Israel and adjoining territories,Appl. Geochem. 18 (2003) 1613–1628.
[70] G. Gruau, A. Dia, G. Olivié-Lauquet, M. Davranche, G. Pinay,Controls on the distribution of rare earth elements in shallowgroundwaters, Water Res. 38 (2004) 3576–3586.
[71] K.H. Johannesson, A. Cortés, J.A. Ramos Leal, A.G. Ramírez, J.Durazo, Geochemistry of rare earth elements in groundwatersfrom a rhyolite aquifer, central México, in: K.H. Johannesson(Ed.), Rare Earth Elements in Groundwater Flow Systems,Springer, Dordrecht, The Netherlands, 2005, pp. 187–222.
[72] P. Shand, K.H. Johannesson, O. Chudaev, V. Chudaeva, W.M.Edmunds, Rare earth element contents of high pCO2 ground-waters of Primorye, Russia: mineral stability and complexationcontrols, in: K.H. Johannesson (Ed.), Rare Earth Elements inGroundwater Flow Systems, Springer, Dordrecht, The Nether-lands, 2005, pp. 161–186.
[73] J. Tang, K.H. Johannesson, Rare earth element concentrations,speciation, and fractionation along groundwater flow paths: theCarrizo Sand (Texas) and Upper Floridan aquifers, in: K.H.Johannesson (Ed.), Rare Earth Elements in Groundwater FlowSystems, Springer, Dordrecht, The Netherlands, 2005, pp. 223–251.
[74] J. Tang, K.H. Johannesson, Speciation of rare earth elements innatural terrestrial waters: assessing the role of dissolved organicmatter from the modeling approach, Geochim. Cosmochim. Acta67 (2003) 2321–2339.
[75] A. Tricca, P. Stille, M. Steinmann, B. Kiefel, J. Samuel, J.Eikenberg, Rare earth elements and Sr and Nd isotopecompositions of dissolved and suspended loads of small riversystems in the Vosges mountains (France), the river Rhine andgroundwater, Chem. Geol. 160 (1999) 139–158.
[76] J. Viers, G.J. Wasserburg, Behavior of Sm and Nd in a lateriticsoil profile, Geochim. Cosmochim. Acta 68 (2004) 2043–2054.
[77] M.I. Leybourne, B.L. Cousens, Rare earth elements (REE) andNd and Sr isotopes in groundwater and suspended sedimentsfrom the Bathurst Mining Camp, New Brunswick: water-rockreactions and elemental fractionation, in: K.H. Johannesson(Ed.), Rare Earth Elements in Groundwater Flow Systems,Springer, Dordrecht, The Netherlands, 2005, pp. 253–293.
[78] I.S. Zektser, H.A. Loaiciga, Groundwater fluxes in the globalhydrologic cycle: past, present and future, J. Hydrol. 144 (1993)405–427.
[79] W.T. Hyde, E.L. Grossman, T.J. Crowley, D. Pollard, C.R.Scotese, Siberian glaciation as a constraint on Permian–Carboniferous CO2 levels, Geology 34 (2006) 421–424.
[80] P.F. Hoffman, A.J. Kaufman, G.P. Halverson, D.P. Schrag, ANeoproterozoic snowball Earth, Science 281 (1998) 1342–1346.
142 K.H. Johannesson, D.J. Burdige / Earth and Planetary Science Letters 253 (2007) 129–142