Balanced Score Card Review of July 2016 Data · 2016-08-30 · Balanced Score Card Review of July...
61
Balanced Score Card Review of July 2016 Data 1
Transcript of Balanced Score Card Review of July 2016 Data · 2016-08-30 · Balanced Score Card Review of July...
Balanced Score Card Review of July 2016 Data
1
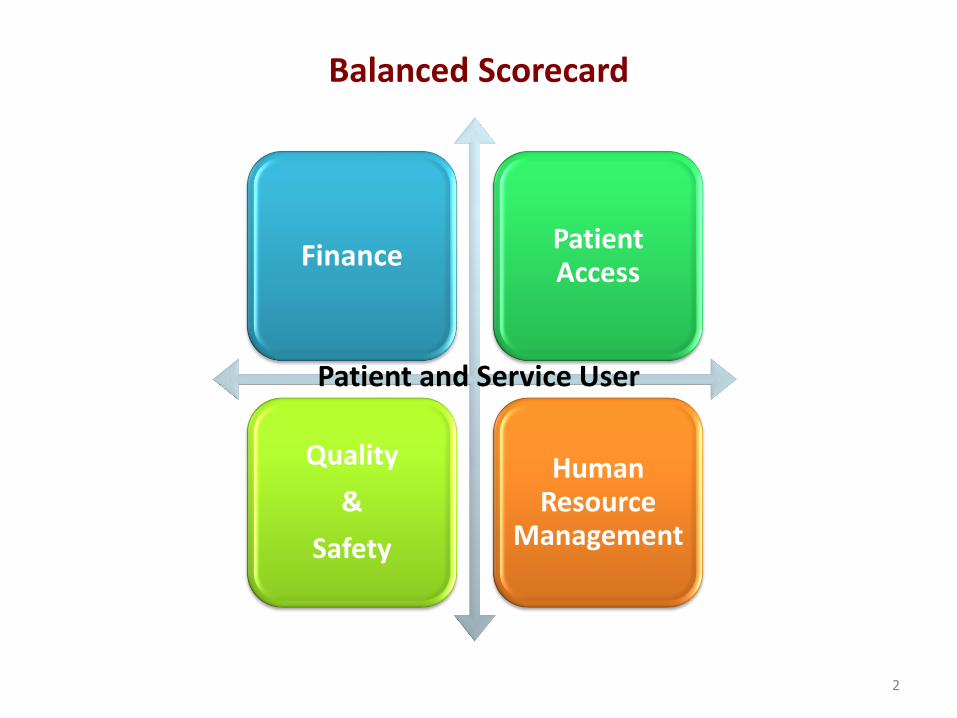
Balanced Scorecard
Finance Patient Access
Quality
&
Safety
Human Resource
Management
Patient and Service User
2

Finance
3
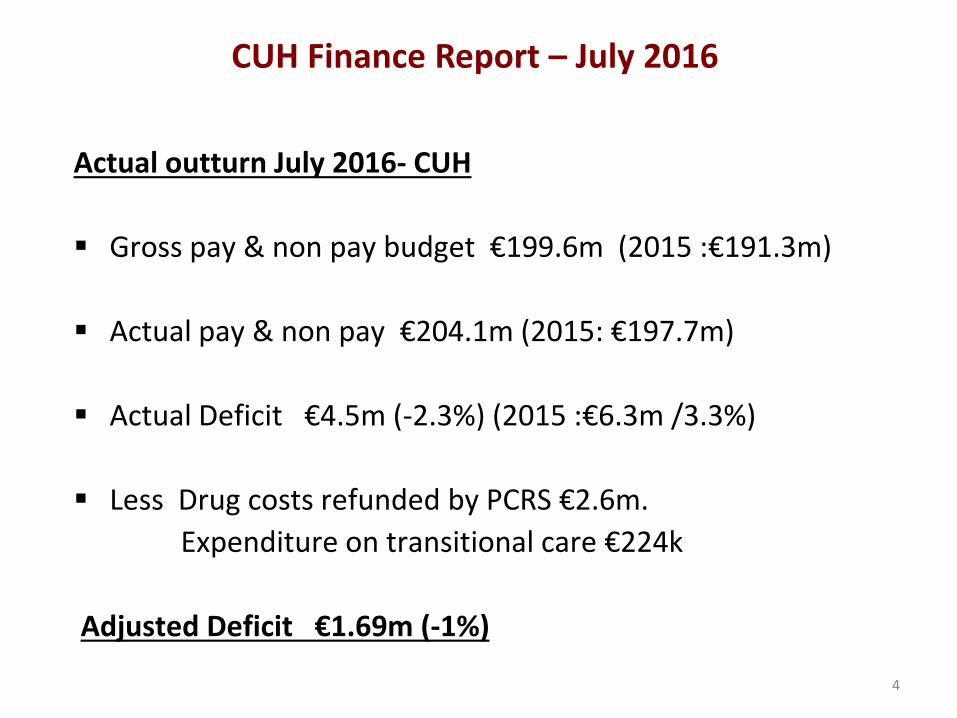
CUH Finance Report – July 2016
Actual outturn July 2016- CUH
Gross pay & non pay budget €199.6m (2015 :€191.3m)
Actual pay & non pay €204.1m (2015: €197.7m)
Actual Deficit €4.5m (-2.3%) (2015 :€6.3m /3.3%)
Less Drug costs refunded by PCRS €2.6m.
Expenditure on transitional care €224k
Adjusted Deficit €1.69m (-1%)
4
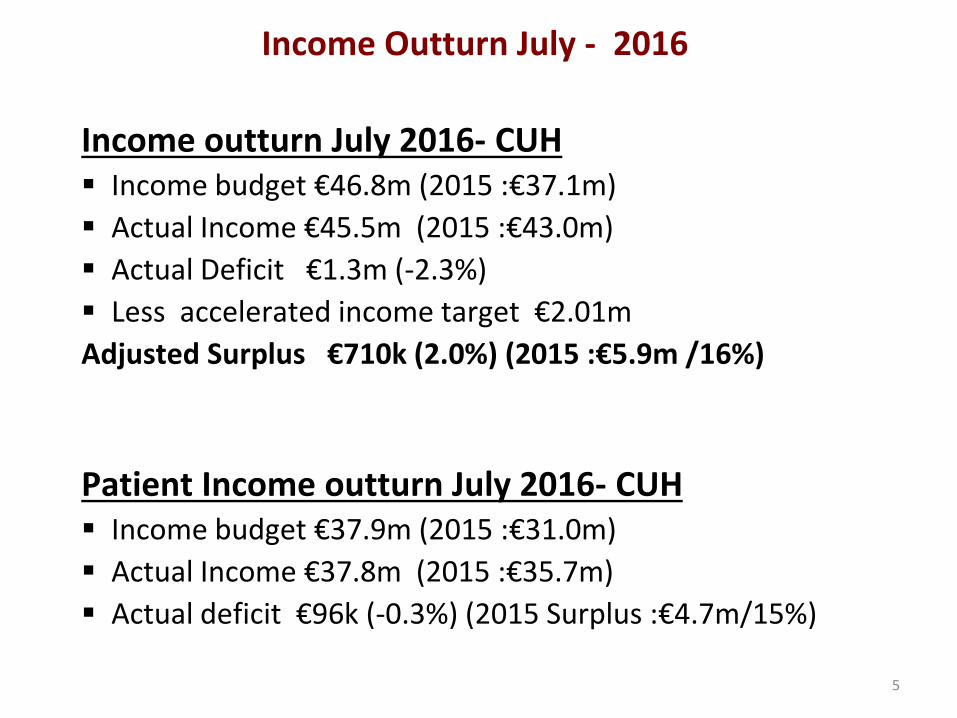
Income Outturn July - 2016
Income outturn July 2016- CUH Income budget €46.8m (2015 :€37.1m)
Actual Income €45.5m (2015 :€43.0m)
Actual Deficit €1.3m (-2.3%)
Less accelerated income target €2.01m
Adjusted Surplus €710k (2.0%) (2015 :€5.9m /16%)
Patient Income outturn July 2016- CUH Income budget €37.9m (2015 :€31.0m)
Actual Income €37.8m (2015 :€35.7m)
Actual deficit €96k (-0.3%) (2015 Surplus :€4.7m/15%)
5

HSE Revised Expenditure limit 2016-CUH
Pay: Adjusted Pay expenditure limit is €236.763m; Increase of €3m on Budget €233.7m Projected pay outturn €236.988m Projected overrun of €225k (1%) on revised pay limit Actual pay expenditure 1H 2016 €117.6m - €1.4m above budget.
Non pay: Adjusted Non pay expenditure limit is €114.3m Increase of €5.4m on Budget €108.9m Projected non pay outturn €115.3m Projected overrun of €1m (1%) on revised pay limit Actual non pay expenditure 1H 2016 €56.8m - €2.5m above budget. Drugs & medicines: Gross spend est €30m partly offset by PCRS /other rebates est €4m Bloods : 22% increase in Haematology patient activity reflected in 9% higher spend Pathology: higher costs due to 15% increase in GP tests requires favourable adjustment Transitional care :€0.9m in forecast to year end. Bad debts provision of €1.3m down on 2015 figure € 2.9m
Project that CUH pay & non-pay spend marginally higher than revised expenditure limit for 2016.
6

CUH Group Summary – Budget v Actual Expenditure July 2016
Pay €k Non-Pay €k
Total Gross Income €k Net €k
CUH (inc SMOH) 1,479 -3,060 -4,539 -1,281 -5,819
Less adj 0 2,842 2,842 2,011 4,853
CUH adj -1,479 -281 -1,697 730 -966
Mallow 43 -110 -67 -82 -149
Total Group adj -1,435 -329 -1,764 648 -1,115
7

CUH –Pay & Nonpay Budget Surplus/(Deficit) %
8
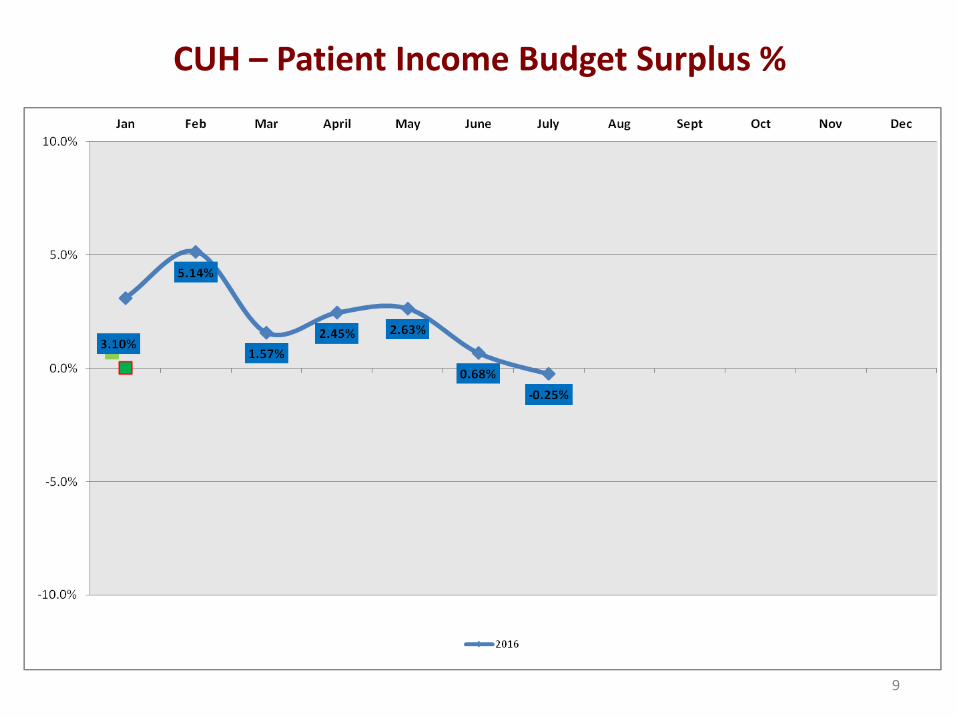
CUH – Patient Income Budget Surplus %
9

CUH Budget v Actual – YTD July 2016
YTD 2016 Budget €k
YTD 2016 Actual €k
Variance €k
% Variance
YTD Actual
€k
Variance 2016-2015
Act €k
Pay 135,960 137,439 -1,479 -1.1% 133,230 4,209
Non Pay 63,602 66,651 -3,049 -4.8% 64,421 2,230
Gross Spend 199,562 204,089 -4,528 -2.3% 197,651 6,438
Income 46,837 45,536 -1,302 2.8% 43,049 2,487
Net 152,725 158,554 -5,829 -3.8% 154,602 3,952 10
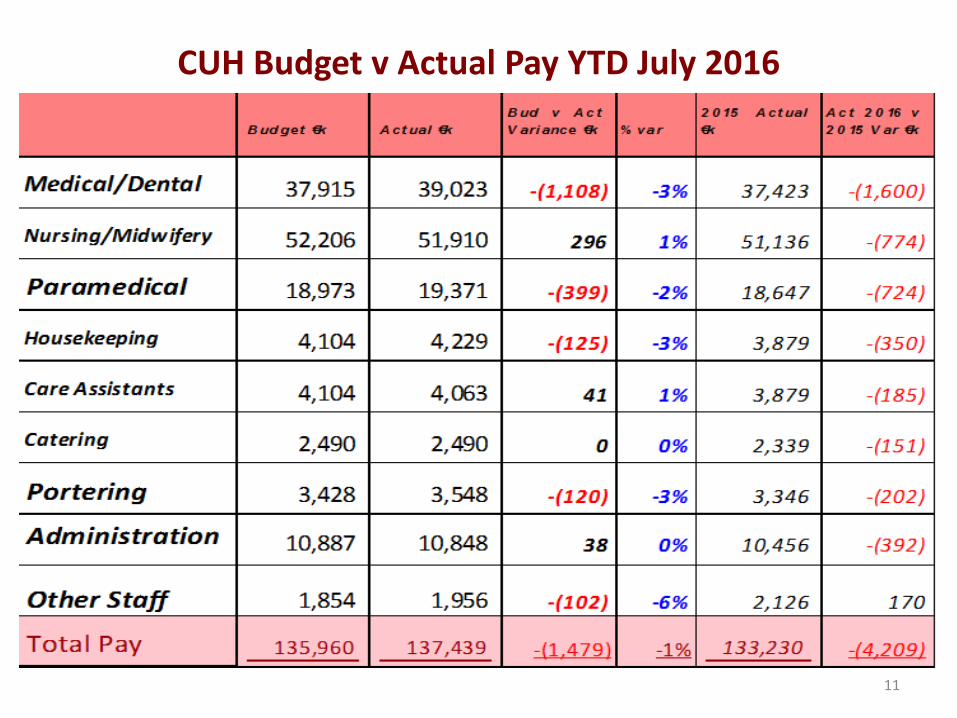
CUH Budget v Actual Pay YTD July 2016
11
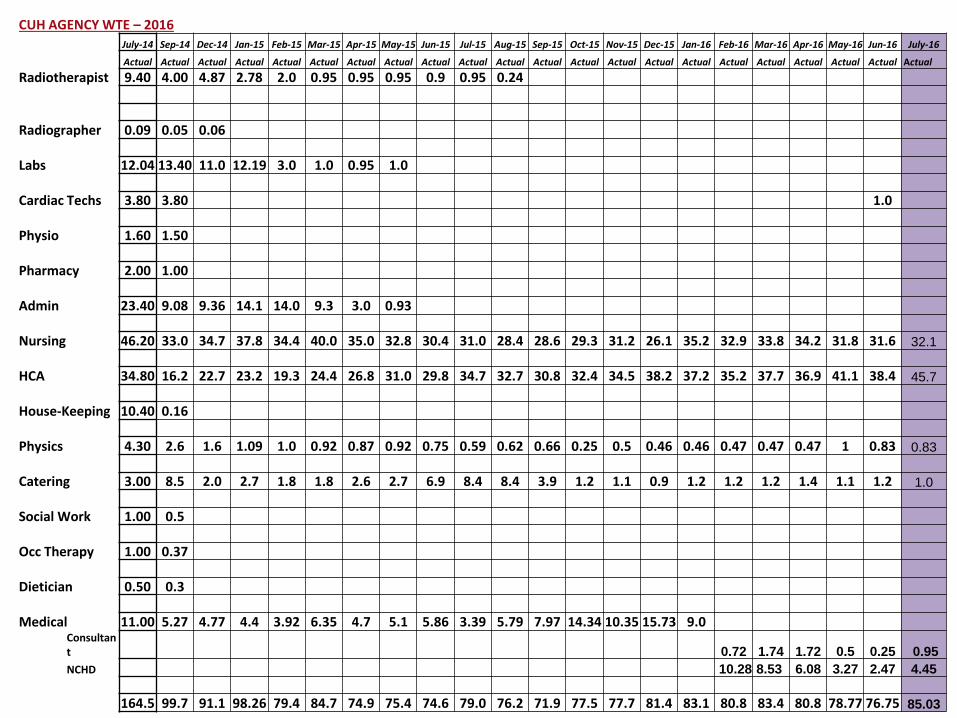
CUH AGENCY WTE – 2016
July-14 Sep-14 Dec-14 Jan-15 Feb-15 Mar-15 Apr-15 May-15 Jun-15 Jul-15 Aug-15 Sep-15 Oct-15 Nov-15 Dec-15 Jan-16 Feb-16 Mar-16 Apr-16 May-16 Jun-16 July-16
Actual Actual Actual Actual Actual Actual Actual Actual Actual Actual Actual Actual Actual Actual Actual Actual Actual Actual Actual Actual Actual Actual
Radiotherapist 9.40 4.00 4.87 2.78 2.0 0.95 0.95 0.95 0.9 0.95 0.24
Radiographer 0.09 0.05 0.06
Labs 12.04 13.40 11.0 12.19 3.0 1.0 0.95 1.0
Cardiac Techs 3.80 3.80 1.0
Physio 1.60 1.50
Pharmacy 2.00 1.00
Admin 23.40 9.08 9.36 14.1 14.0 9.3 3.0 0.93
Nursing 46.20 33.0 34.7 37.8 34.4 40.0 35.0 32.8 30.4 31.0 28.4 28.6 29.3 31.2 26.1 35.2 32.9 33.8 34.2 31.8 31.6 32.1
HCA 34.80 16.2 22.7 23.2 19.3 24.4 26.8 31.0 29.8 34.7 32.7 30.8 32.4 34.5 38.2 37.2 35.2 37.7 36.9 41.1 38.4 45.7
House-Keeping 10.40 0.16
Physics 4.30 2.6 1.6 1.09 1.0 0.92 0.87 0.92 0.75 0.59 0.62 0.66 0.25 0.5 0.46 0.46 0.47 0.47 0.47 1 0.83 0.83
Catering 3.00 8.5 2.0 2.7 1.8 1.8 2.6 2.7 6.9 8.4 8.4 3.9 1.2 1.1 0.9 1.2 1.2 1.2 1.4 1.1 1.2 1.0
Social Work 1.00 0.5
Occ Therapy 1.00 0.37
Dietician 0.50 0.3
Medical 11.00 5.27 4.77 4.4 3.92 6.35 4.7 5.1 5.86 3.39 5.79 7.97 14.34 10.35 15.73 9.0 Consultant 0.72 1.74 1.72 0.5 0.25 0.95
NCHD 10.28 8.53 6.08 3.27 2.47 4.45
164.5 99.7 91.1 98.26 79.4 84.7 74.9 75.4 74.6 79.0 76.2 71.9 77.5 77.7 81.4 83.1 80.8 83.4 80.8 78.77 76.75 85.03
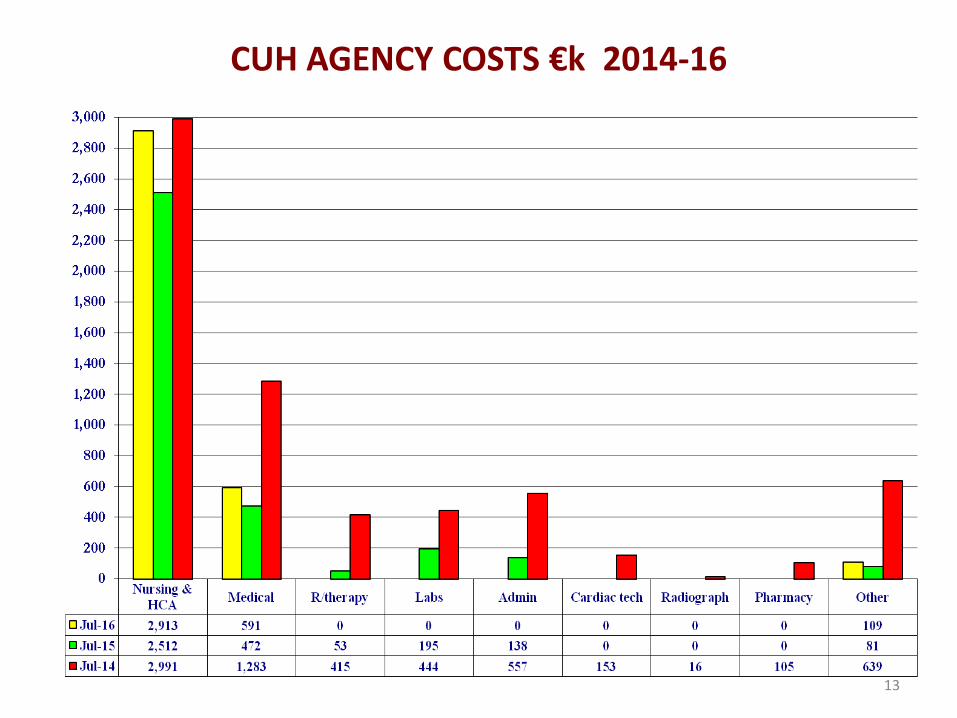
CUH AGENCY COSTS €k 2014-16
13

Acute Nursing Agency WTE 2014 to 2016
Acute HCA Agency WTE 2014 to 2016
14
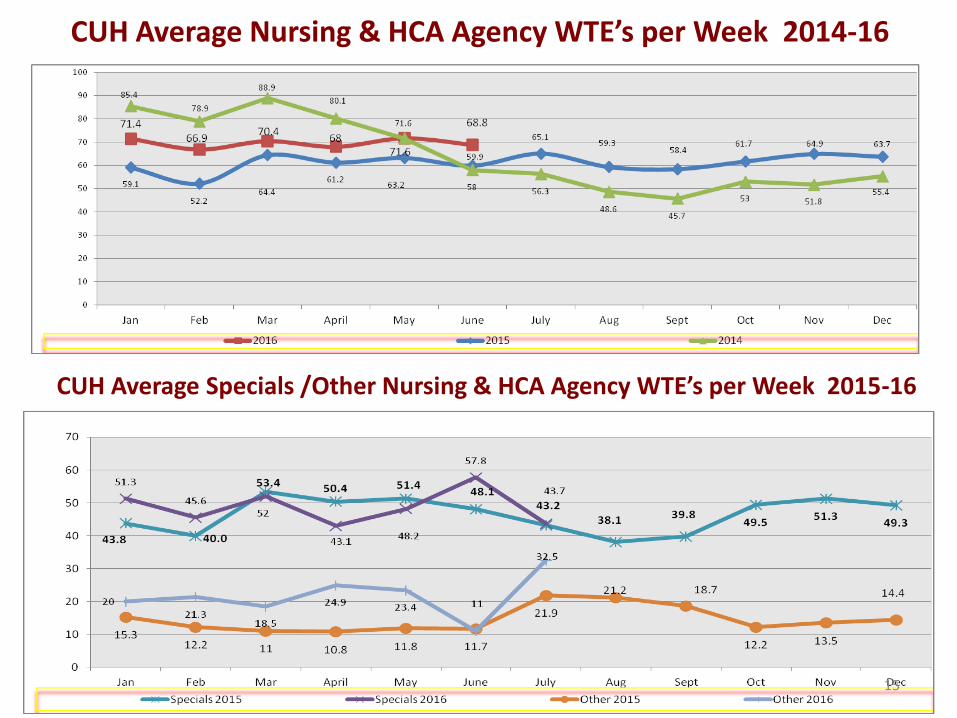
CUH Average Nursing & HCA Agency WTE’s per Week 2014-16
CUH Average Specials /Other Nursing & HCA Agency WTE’s per Week 2015-16
15
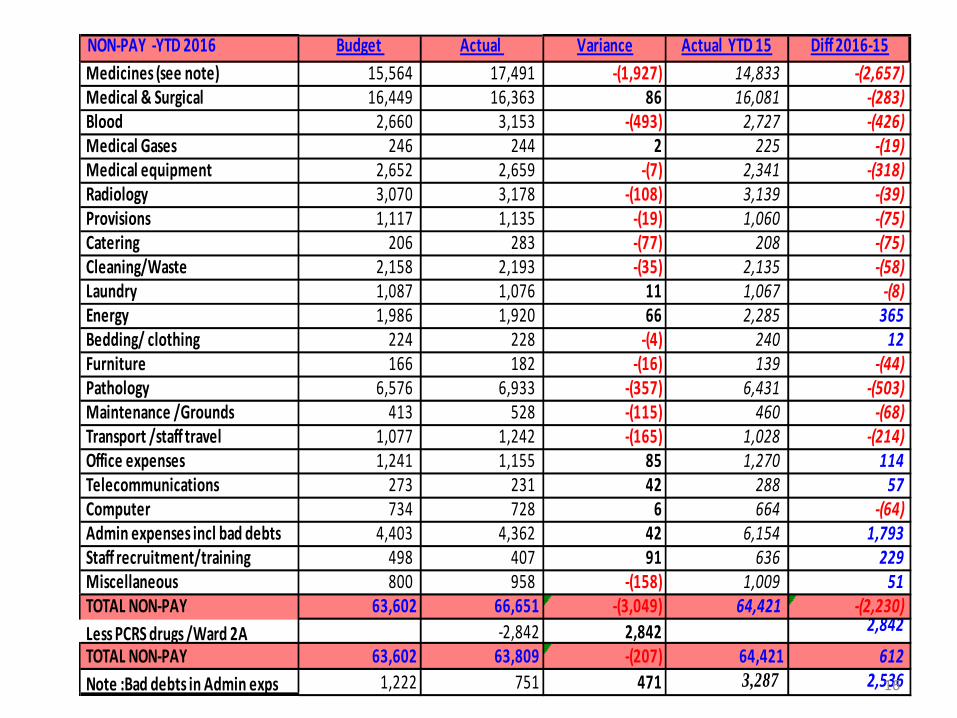
NON-PAY -YTD 2016 Budget Actual Variance Actual YTD 15 Diff 2016-15
Medicines (see note) 15,564 17,491 -(1,927) 14,833 -(2,657) Medical & Surgical 16,449 16,363 86 16,081 -(283) Blood 2,660 3,153 -(493) 2,727 -(426) Medical Gases 246 244 2 225 -(19) Medical equipment 2,652 2,659 -(7) 2,341 -(318) Radiology 3,070 3,178 -(108) 3,139 -(39) Provisions 1,117 1,135 -(19) 1,060 -(75) Catering 206 283 -(77) 208 -(75) Cleaning/Waste 2,158 2,193 -(35) 2,135 -(58) Laundry 1,087 1,076 11 1,067 -(8) Energy 1,986 1,920 66 2,285 365 Bedding/ clothing 224 228 -(4) 240 12 Furniture 166 182 -(16) 139 -(44) Pathology 6,576 6,933 -(357) 6,431 -(503) Maintenance /Grounds 413 528 -(115) 460 -(68) Transport /staff travel 1,077 1,242 -(165) 1,028 -(214) Office expenses 1,241 1,155 85 1,270 114 Telecommunications 273 231 42 288 57 Computer 734 728 6 664 -(64) Admin expenses incl bad debts 4,403 4,362 42 6,154 1,793 Staff recruitment/training 498 407 91 636 229 Miscellaneous 800 958 -(158) 1,009 51 TOTAL NON-PAY 63,602 66,651 -(3,049) 64,421 -(2,230)
Less PCRS drugs /Ward 2A -2,842 2,842 2,842
TOTAL NON-PAY 63,602 63,809 -(207) 64,421 612
Note :Bad debts in Admin exps 1,222 751 471 3,287 2,53616

CUH Actual Non-pay expenditure €k YTD 2016 v 2015
17
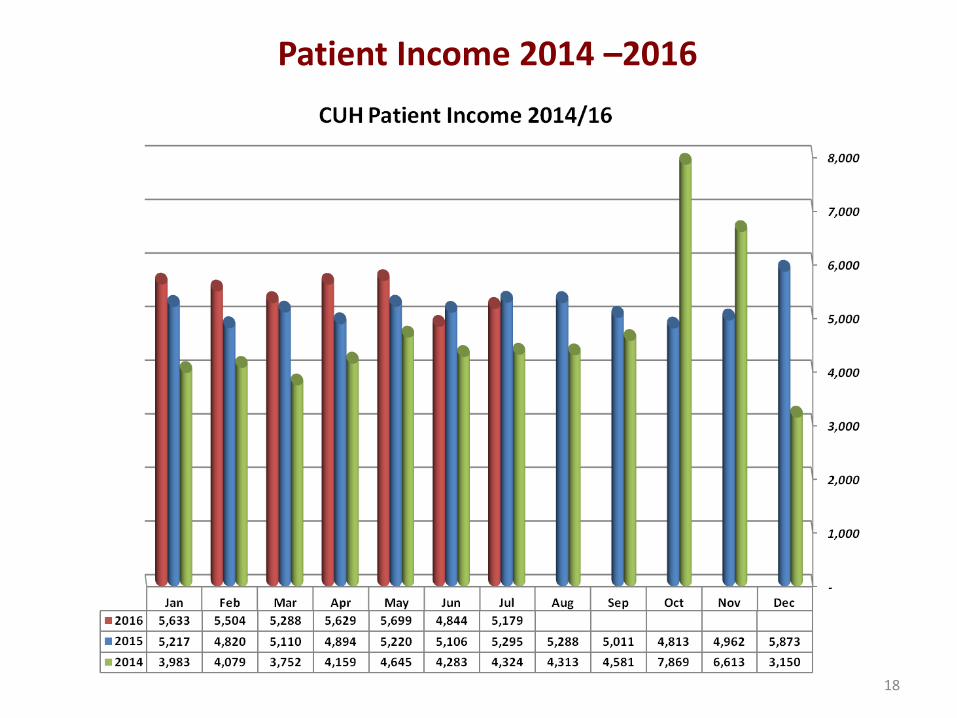
Patient Income 2014 –2016
18
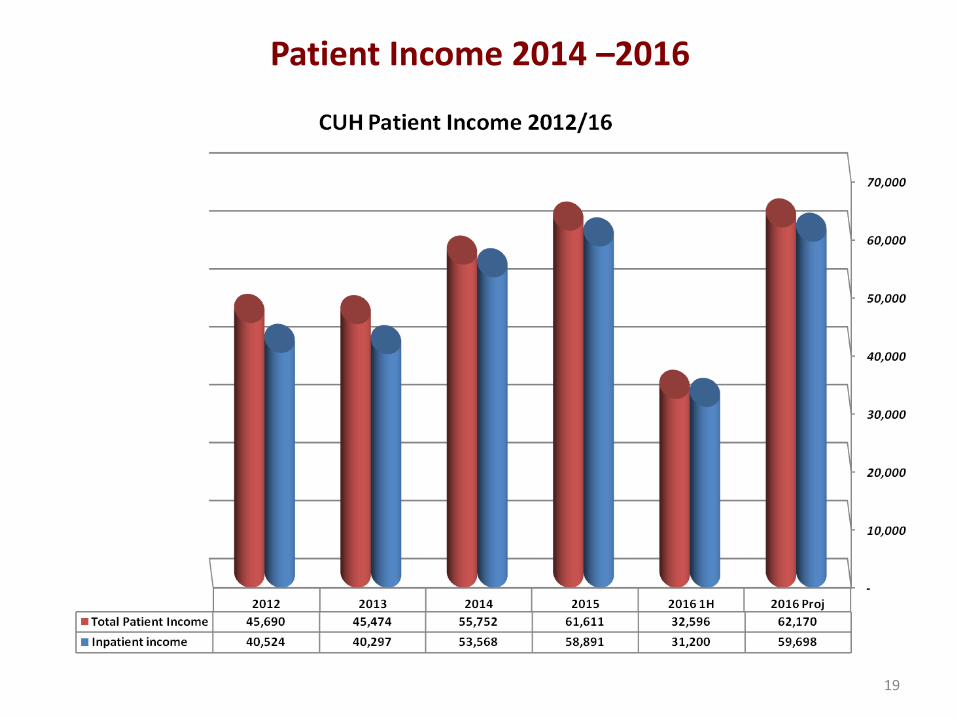
Patient Income 2014 –2016
19
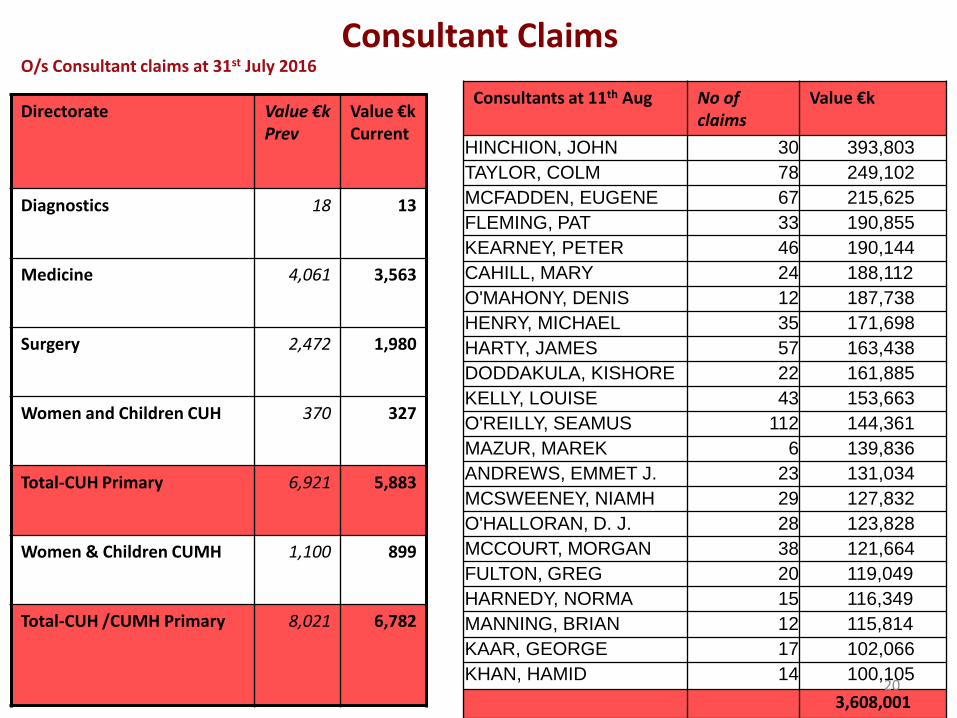
Consultant Claims
Directorate Value €k Prev
Value €k Current
Diagnostics 18 13
Medicine 4,061 3,563
Surgery 2,472 1,980
Women and Children CUH 370 327
Total-CUH Primary 6,921 5,883
Women & Children CUMH 1,100 899
Total-CUH /CUMH Primary
8,021 6,782
O/s Consultant claims at 31st July 2016
Consultants at 11th Aug No of claims
Value €k
HINCHION, JOHN 30 393,803
TAYLOR, COLM 78 249,102
MCFADDEN, EUGENE 67 215,625
FLEMING, PAT 33 190,855
KEARNEY, PETER 46 190,144
CAHILL, MARY 24 188,112
O'MAHONY, DENIS 12 187,738
HENRY, MICHAEL 35 171,698
HARTY, JAMES 57 163,438
DODDAKULA, KISHORE 22 161,885
KELLY, LOUISE 43 153,663
O'REILLY, SEAMUS 112 144,361
MAZUR, MAREK 6 139,836
ANDREWS, EMMET J. 23 131,034
MCSWEENEY, NIAMH 29 127,832
O'HALLORAN, D. J. 28 123,828
MCCOURT, MORGAN 38 121,664
FULTON, GREG 20 119,049
HARNEDY, NORMA 15 116,349
MANNING, BRIAN 12 115,814
KAAR, GEORGE 17 102,066
KHAN, HAMID 14 100,105
3,608,001 20
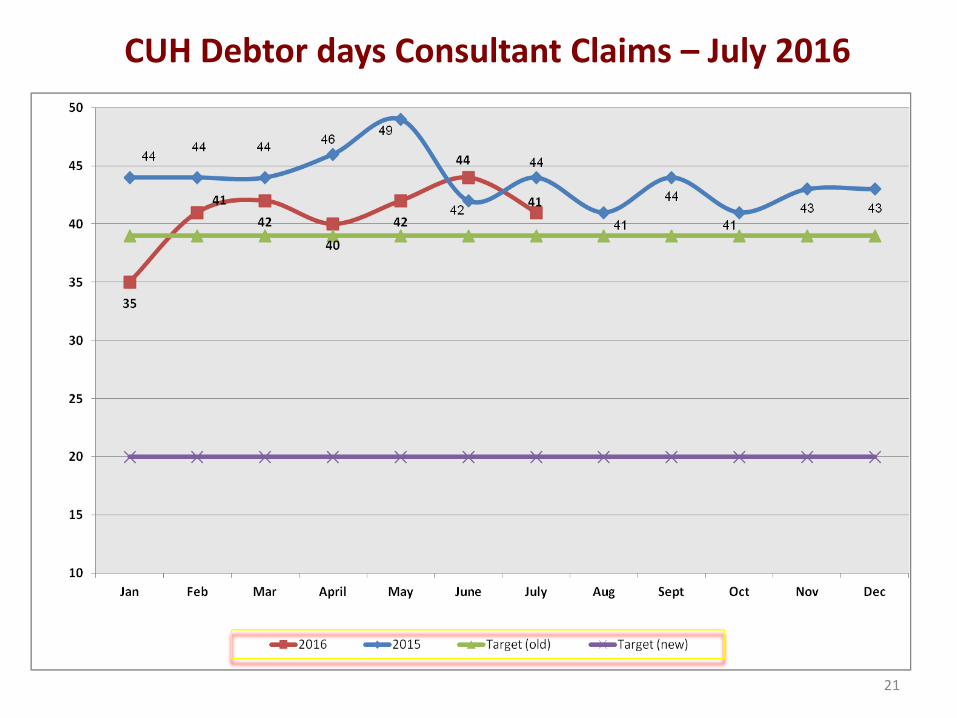
CUH Debtor days Consultant Claims – July 2016
21
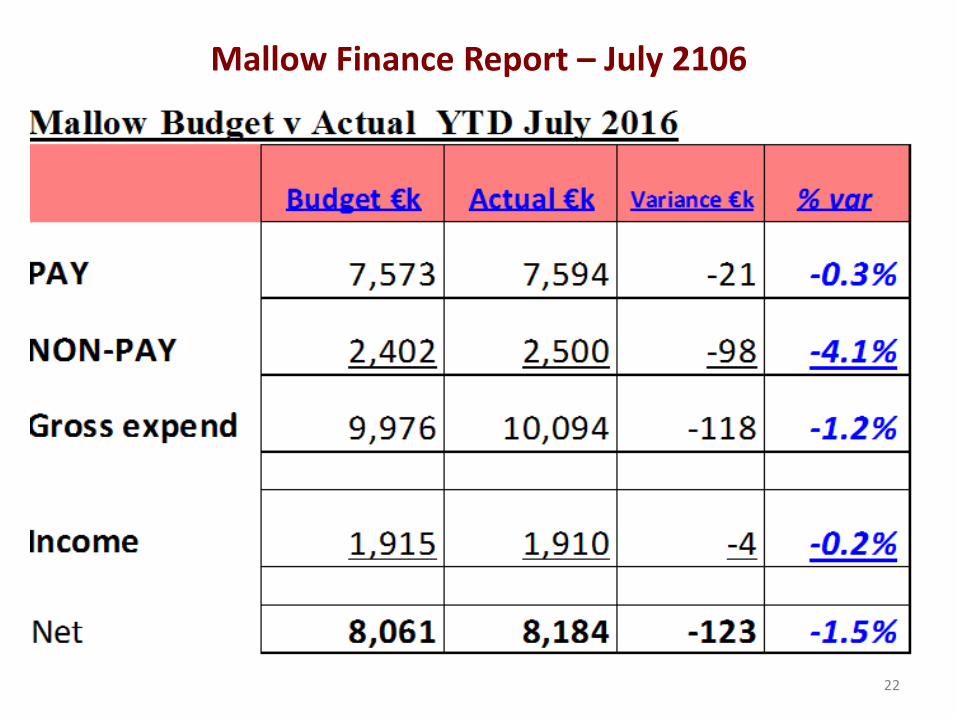
Mallow Finance Report – July 2106
22

Patient Access
23
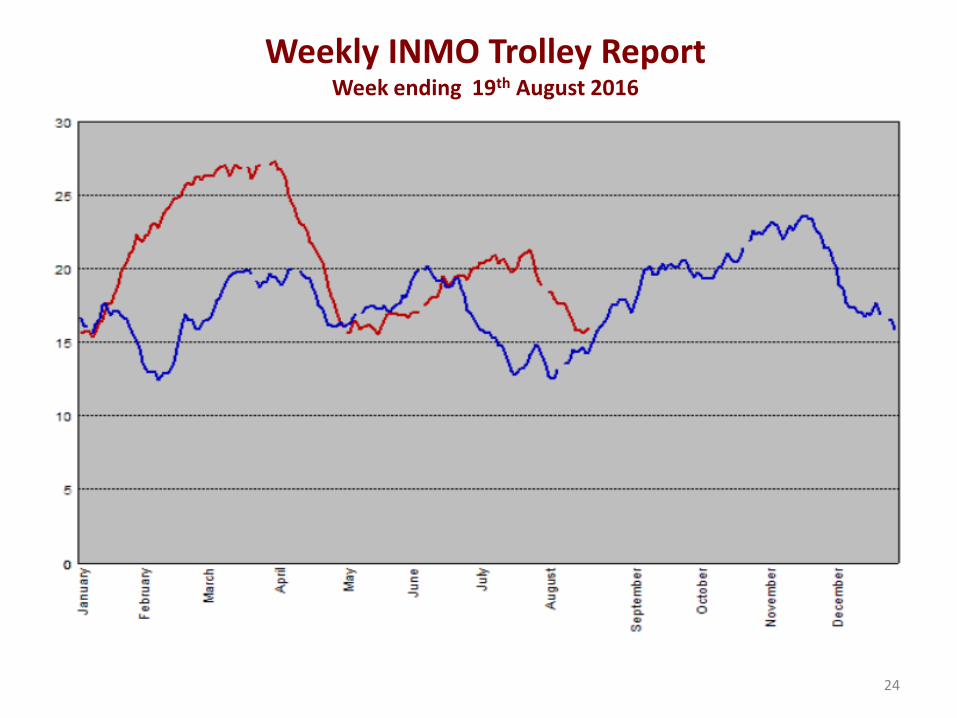
Weekly INMO Trolley Report Week ending 19th August 2016
24
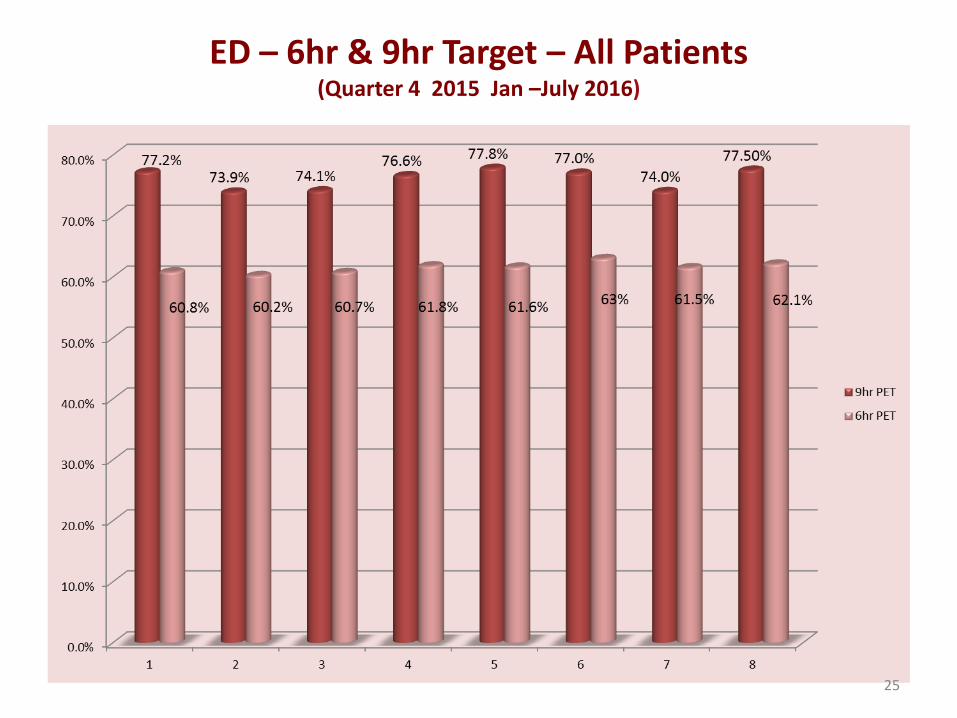
ED – 6hr & 9hr Target – All Patients (Quarter 4 2015 Jan –July 2016)
25
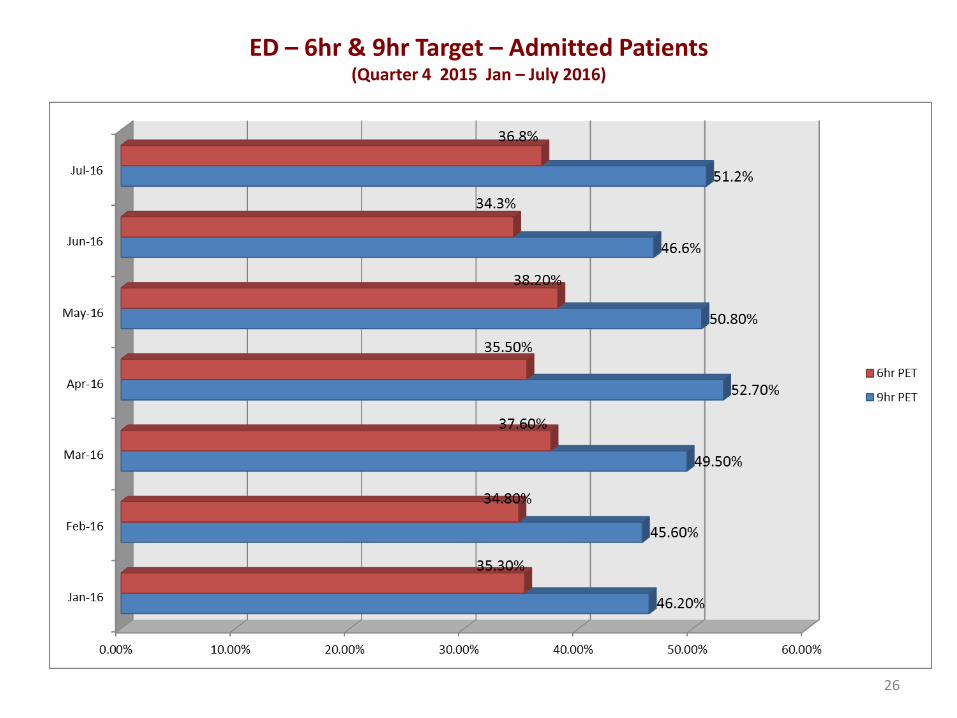
ED – 6hr & 9hr Target – Admitted Patients (Quarter 4 2015 Jan – July 2016)
26
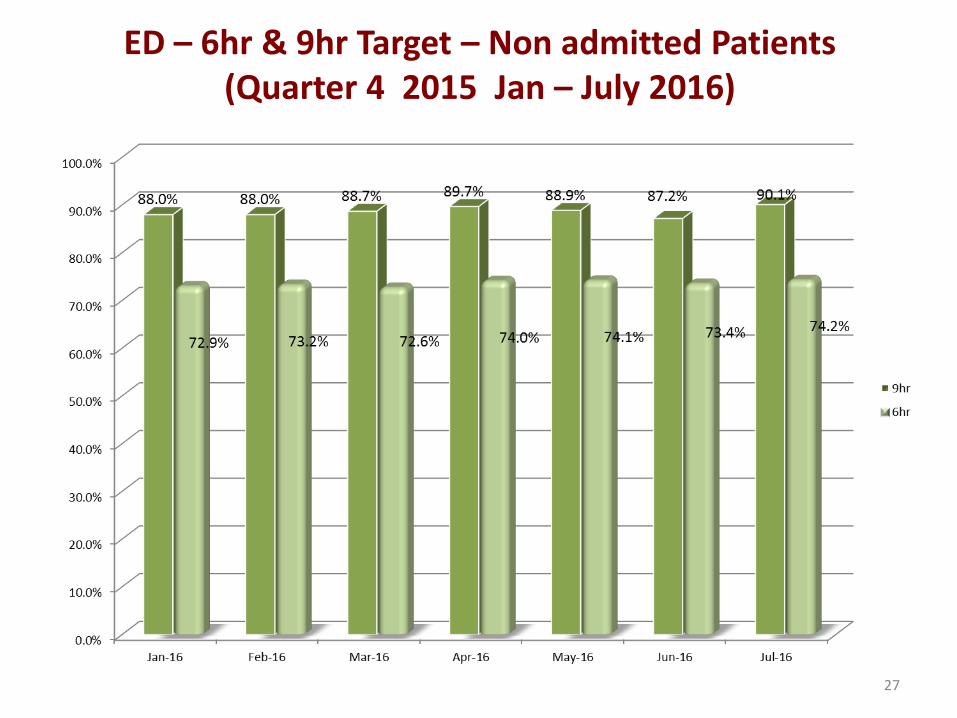
ED – 6hr & 9hr Target – Non admitted Patients (Quarter 4 2015 Jan – July 2016)
27

PET > 24hrs - Weekly – May to July 17th
28

>75 years Bed Wait >9 hours
29

Ambulance Clinical Handover Performance Jan – August
30
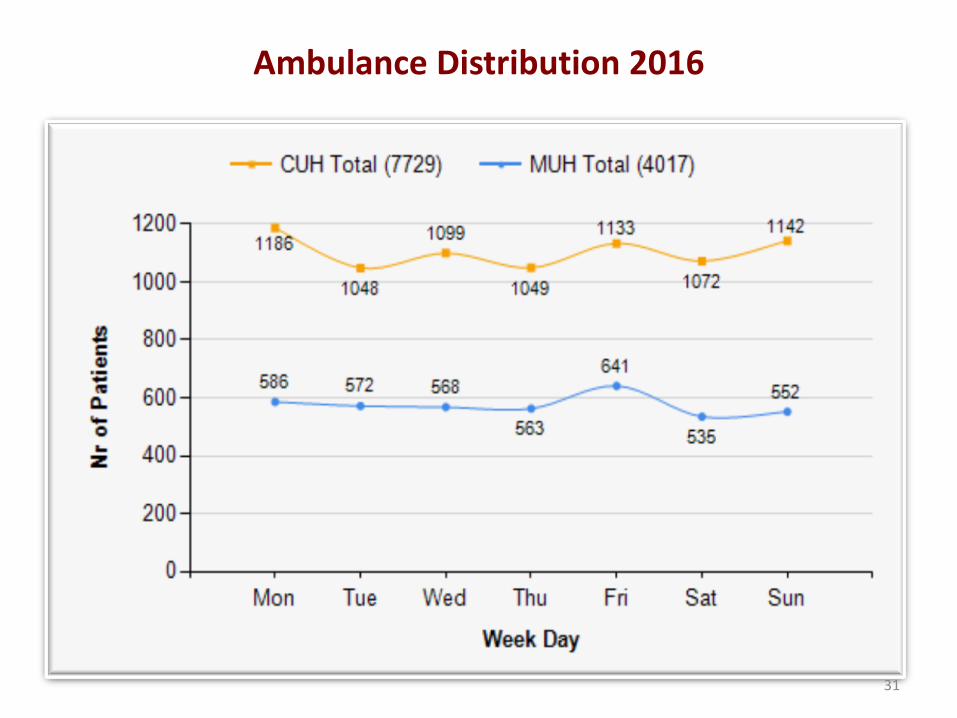
Ambulance Distribution 2016
31
Outpatient Waiting Lists
32
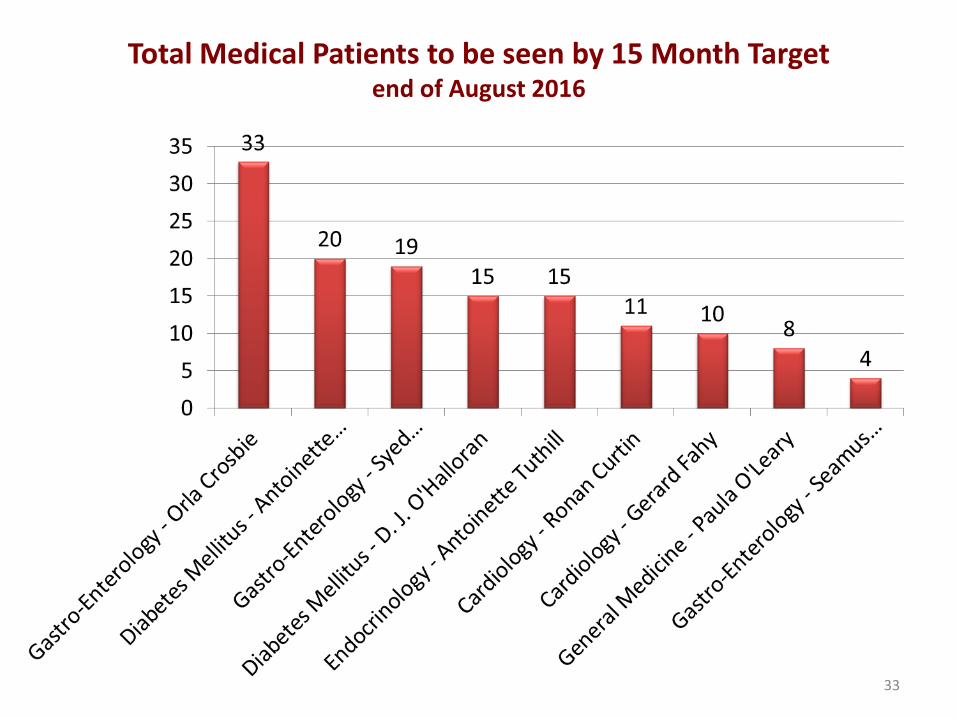
Total Medical Patients to be seen by 15 Month Target
end of August 2016
33

Total Surgical Patients to be seen by 15 Month Timeline end of August 2016
34

Women and Children Patients to be seen by 15 Month Timeline end of August 2016
35
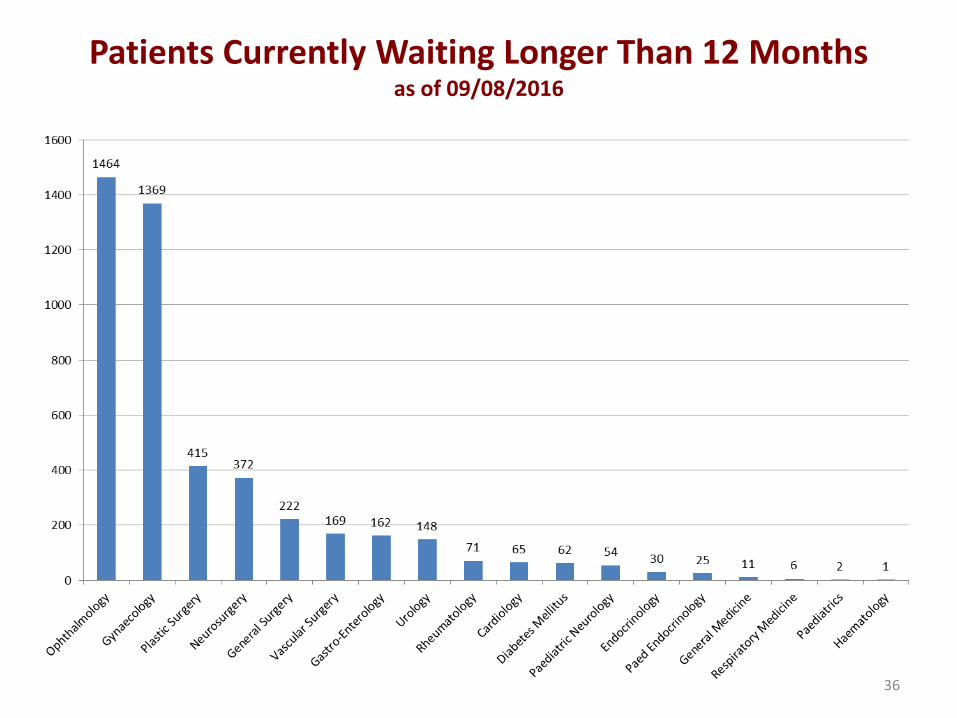
Patients Currently Waiting Longer Than 12 Months as of 09/08/2016
36

New and Return DNA Rate in CUH
37

Scope Waiting List
38
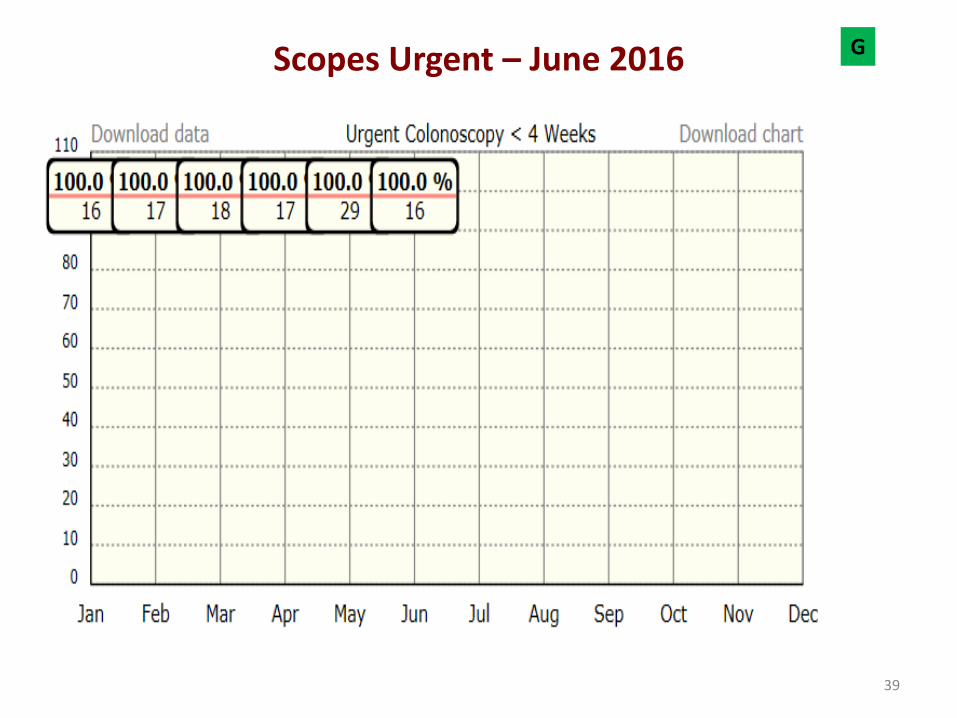
Scopes Urgent – June 2016 G
39
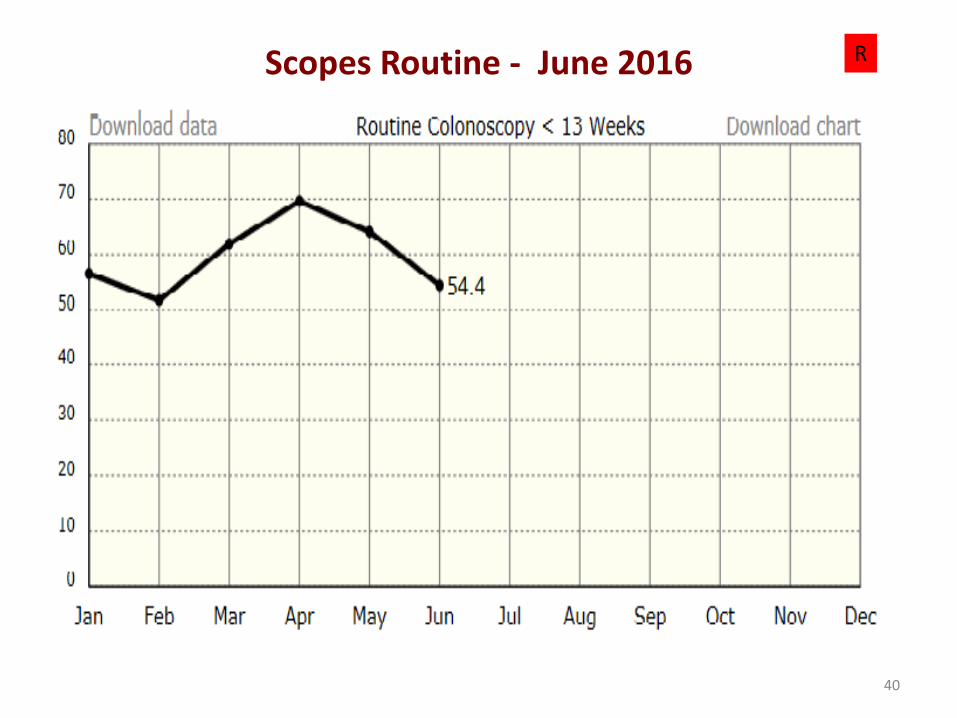
Scopes Routine - June 2016 R
40

Inpatient Waiting List
41
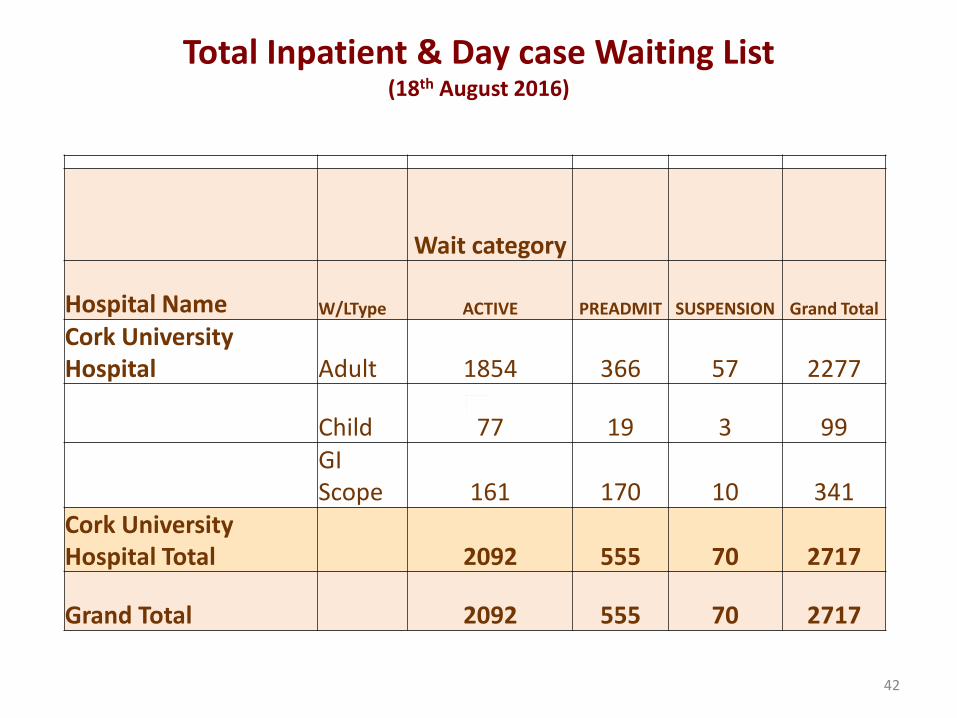
Total Inpatient & Day case Waiting List (18th August 2016)
Wait category
Hospital Name W/LType ACTIVE PREADMIT SUSPENSION Grand Total
Cork University Hospital Adult 1854 366 57 2277
Child 77 19 3 99
GI Scope 161 170 10 341
Cork University Hospital Total 2092 555 70 2717
Grand Total 2092 555 70 2717
42
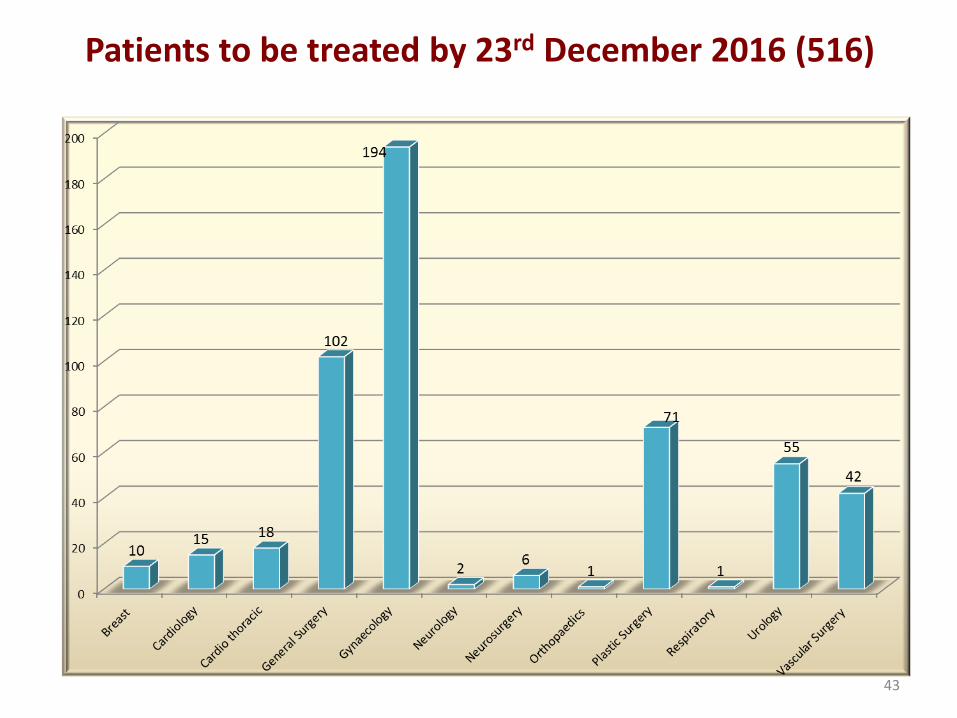
Patients to be treated by 23rd December 2016 (516)
43
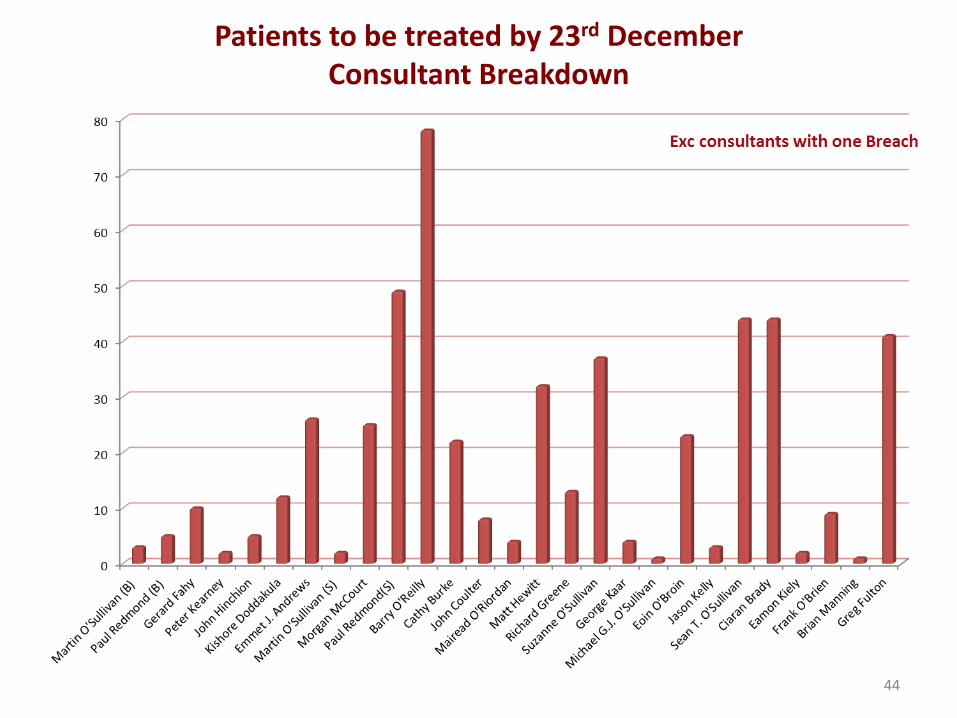
Patients to be treated by 23rd December Consultant Breakdown
44
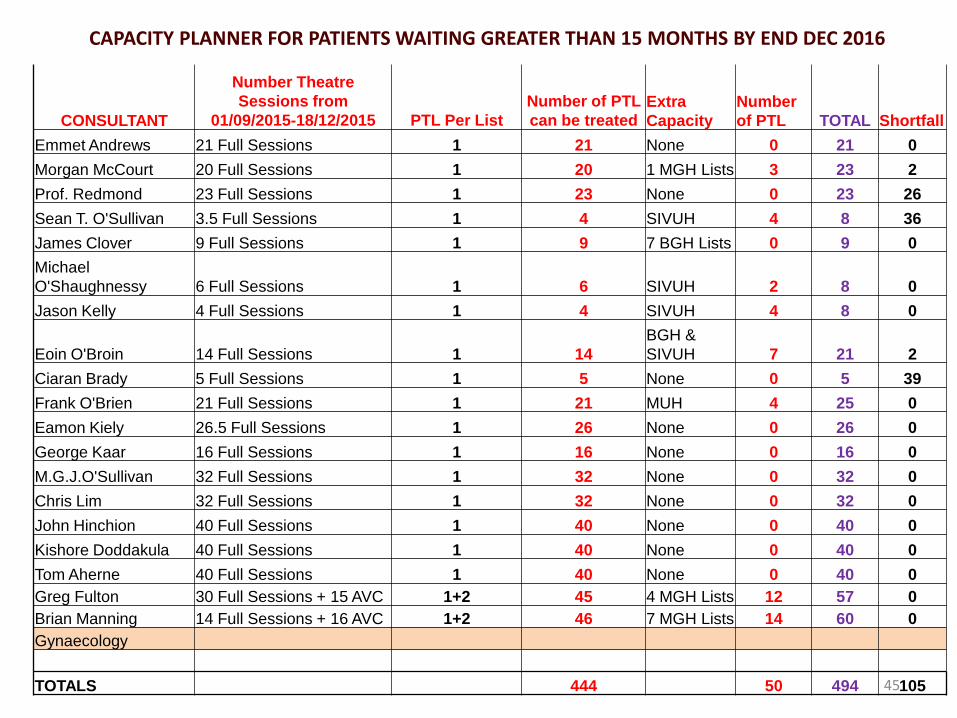
CAPACITY PLANNER FOR PATIENTS WAITING GREATER THAN 15 MONTHS BY END DEC 2016
CONSULTANT
Number Theatre
Sessions from
01/09/2015-18/12/2015 PTL Per List
Number of PTL
can be treated
Extra
Capacity
Number
of PTL TOTAL Shortfall
Emmet Andrews 21 Full Sessions 1 21 None 0 21 0
Morgan McCourt 20 Full Sessions 1 20 1 MGH Lists 3 23 2
Prof. Redmond 23 Full Sessions 1 23 None 0 23 26
Sean T. O'Sullivan 3.5 Full Sessions 1 4 SIVUH 4 8 36
James Clover 9 Full Sessions 1 9 7 BGH Lists 0 9 0
Michael
O'Shaughnessy 6 Full Sessions 1 6 SIVUH 2 8 0
Jason Kelly 4 Full Sessions 1 4 SIVUH 4 8 0
Eoin O'Broin 14 Full Sessions 1 14
BGH &
SIVUH 7 21 2
Ciaran Brady 5 Full Sessions 1 5 None 0 5 39
Frank O'Brien 21 Full Sessions 1 21 MUH 4 25 0
Eamon Kiely 26.5 Full Sessions 1 26 None 0 26 0
George Kaar 16 Full Sessions 1 16 None 0 16 0
M.G.J.O'Sullivan 32 Full Sessions 1 32 None 0 32 0
Chris Lim 32 Full Sessions 1 32 None 0 32 0
John Hinchion 40 Full Sessions 1 40 None 0 40 0
Kishore Doddakula 40 Full Sessions 1 40 None 0 40 0
Tom Aherne 40 Full Sessions 1 40 None 0 40 0
Greg Fulton 30 Full Sessions + 15 AVC 1+2 45 4 MGH Lists 12 57 0
Brian Manning 14 Full Sessions + 16 AVC 1+2 46 7 MGH Lists 14 60 0
Gynaecology
TOTALS 444 50 494 105 45

Quality & Safety
46
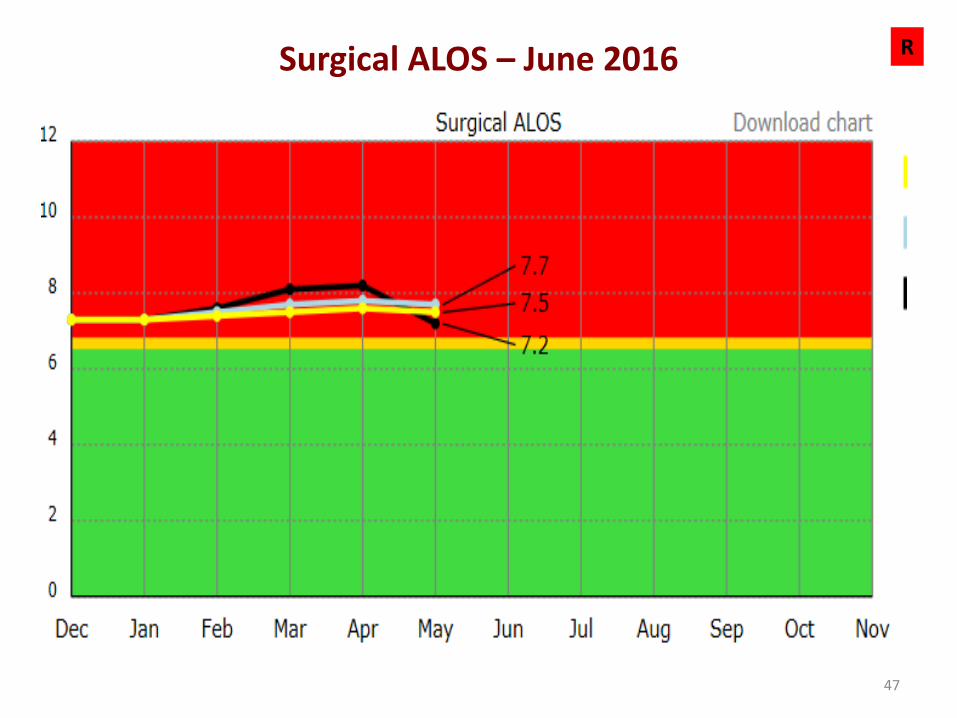
Surgical ALOS – June 2016 R
47
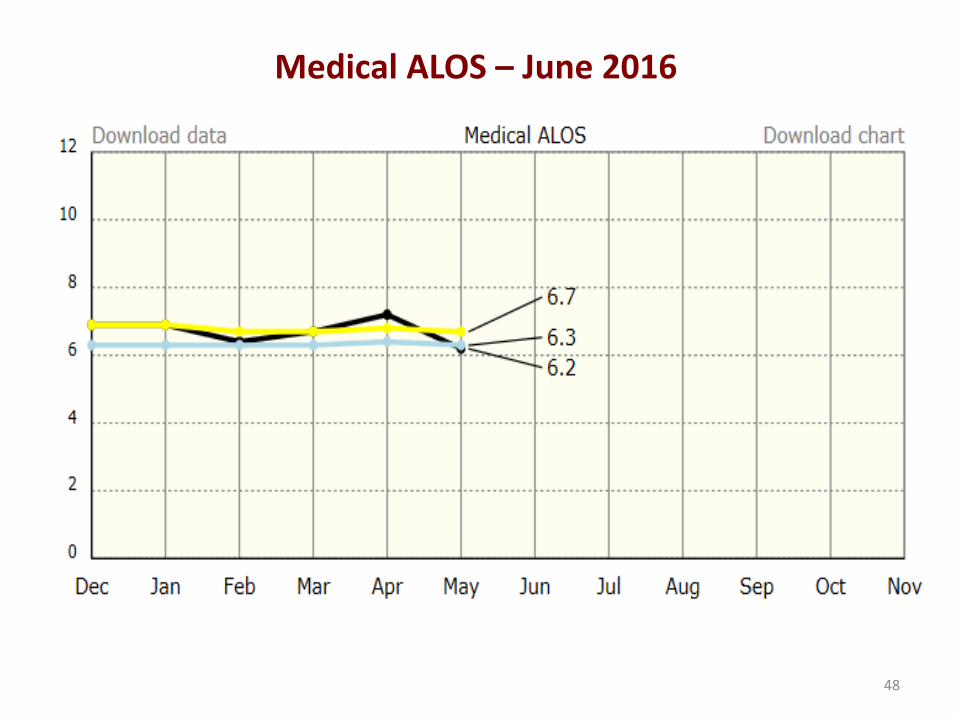
Medical ALOS – June 2016
48
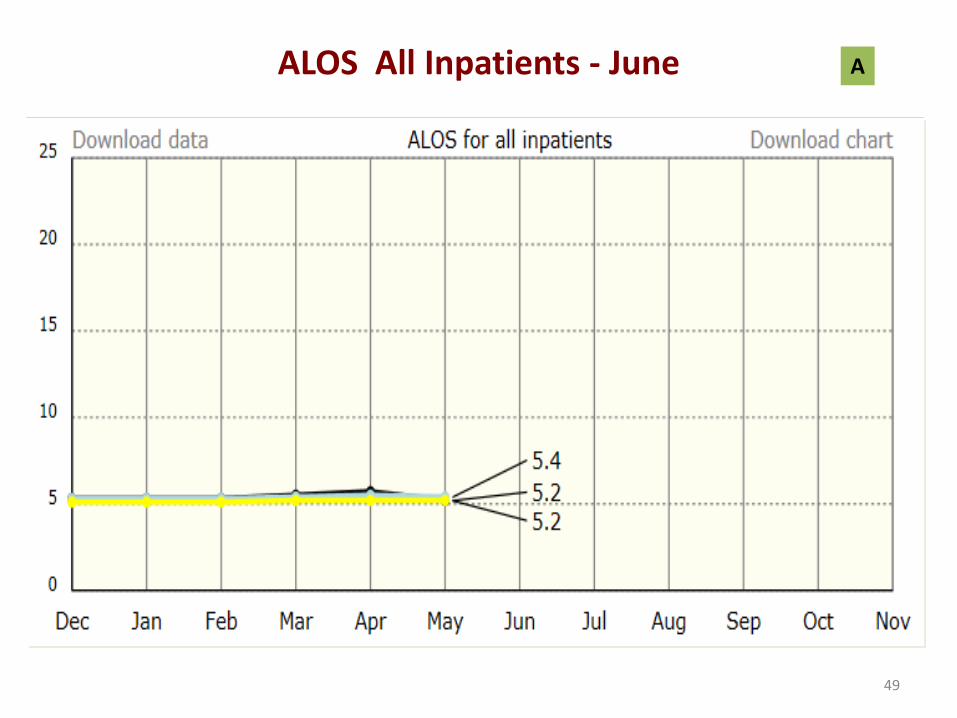
ALOS All Inpatients - June A
49
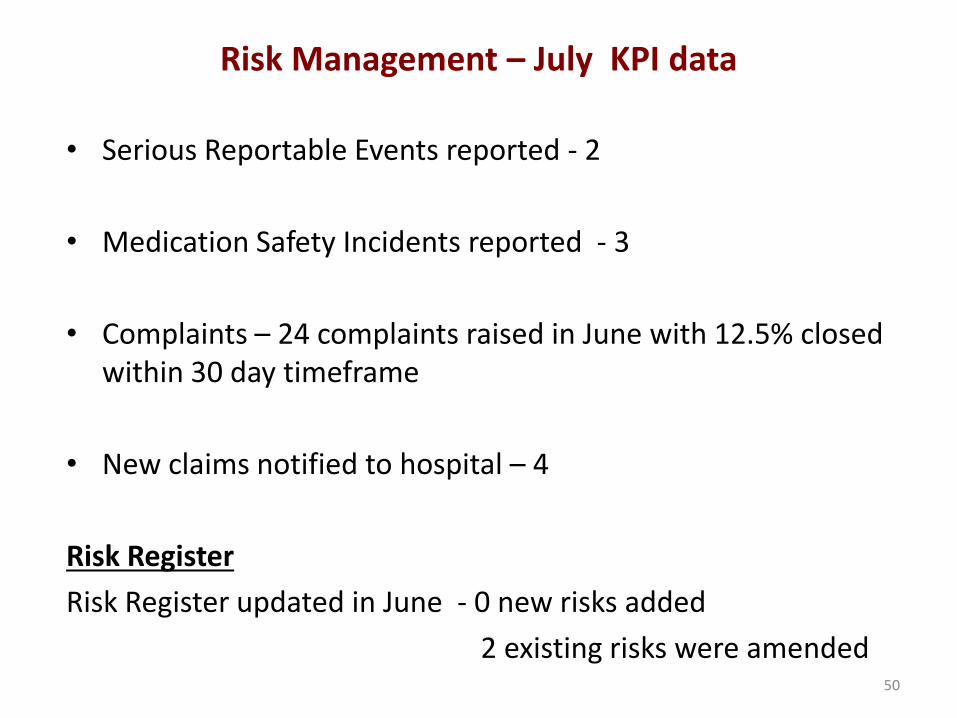
Risk Management – July KPI data
• Serious Reportable Events reported - 2
• Medication Safety Incidents reported - 3
• Complaints – 24 complaints raised in June with 12.5% closed within 30 day timeframe
• New claims notified to hospital – 4
Risk Register
Risk Register updated in June - 0 new risks added
2 existing risks were amended
50
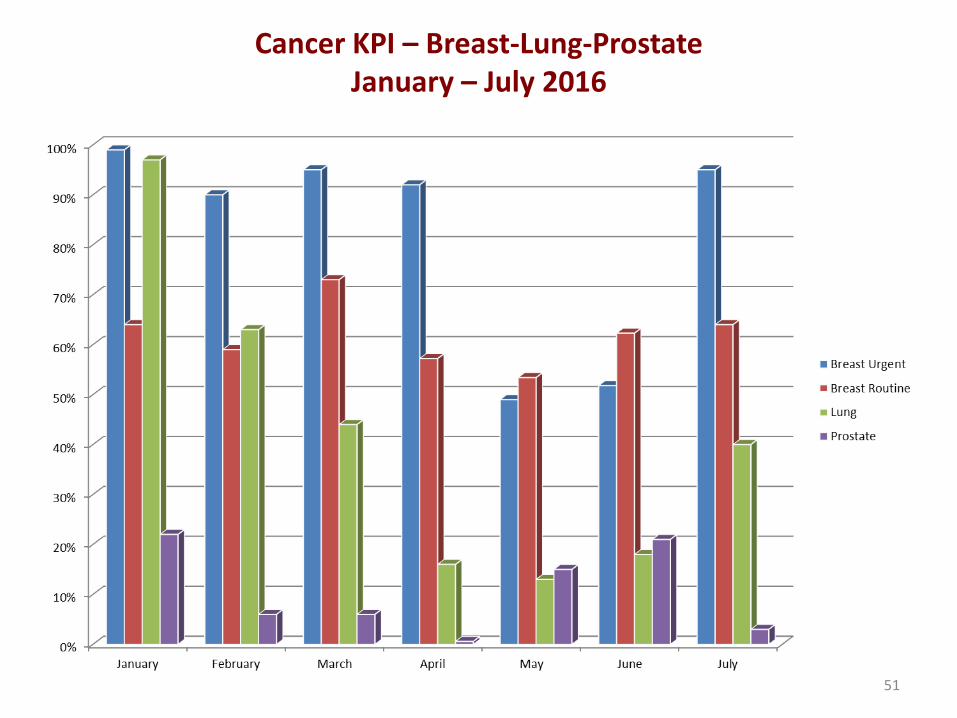
Cancer KPI – Breast-Lung-Prostate January – July 2016
51
Quality and Safety
Lean Review of Endoscopy Service Patient Pathway
Ms. D. Feehely has completed the review and the key findings are to be presented to the EMB
Housekeeping Services Project Group
Post of Health Care Assistant - interviews completed and 25 panelled.
Health Care Assistant Facilitator Work programme agreed
10 places in Dementia Care training assigned to CUH
52
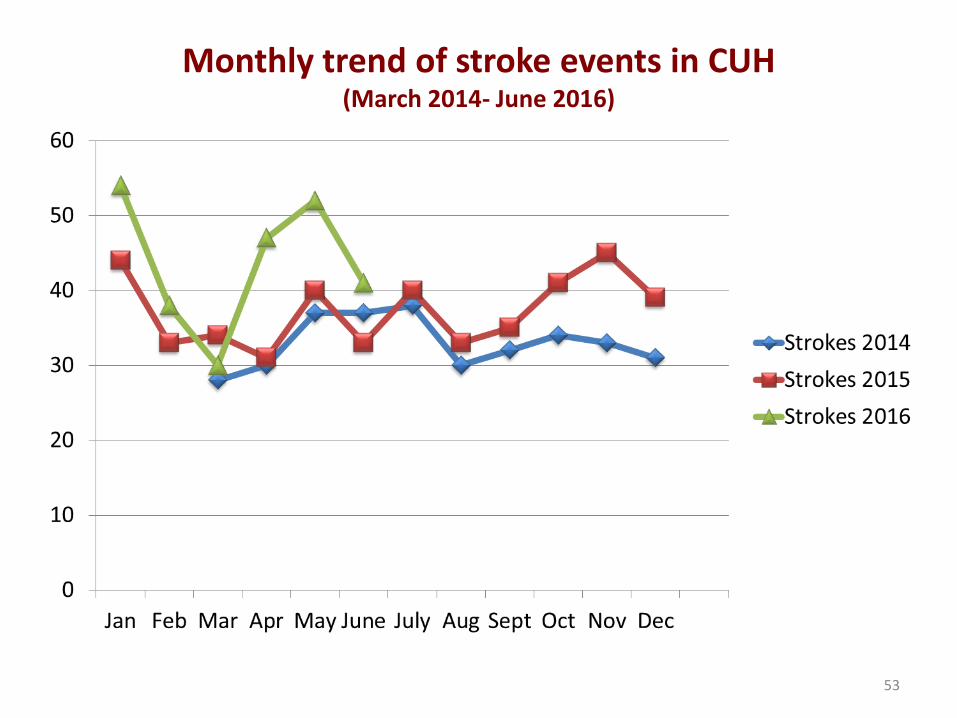
Monthly trend of stroke events in CUH
(March 2014- June 2016)
53

Human Resource Management
54

Medical Sick Leave – June 2106
4.01 3.79
3.74
3.16 3.073.86
3.75 3.91 3.72 3.81 4.084.324.65 4.59 4.53
3.913.39
4.27
0
2
4
6
Jan Feb Mar April May June July August Sept Oct Nov Dec
%
CUH – Total % Sick Leave 2015 v 2016
2015% 2016% % Target
29.95
31.7 29.5
19.03
28.37
28 27.39
34.06
32.07
37.99
28.8924.99
36.59
34.31
27.64
35.52
35.06
0
10
20
30
40
Feb-15
Mar-15
Apr-15
May-15
Jun-15
Jul-15
Aug-15
Sep-15
Oct-15
Nov-15
Dec-15
Jan-16
Feb-16
Mar-16
Apr-16
May-16
Jun-16WTE’s
CUH Long Term Sick Leave – WTE’s
55
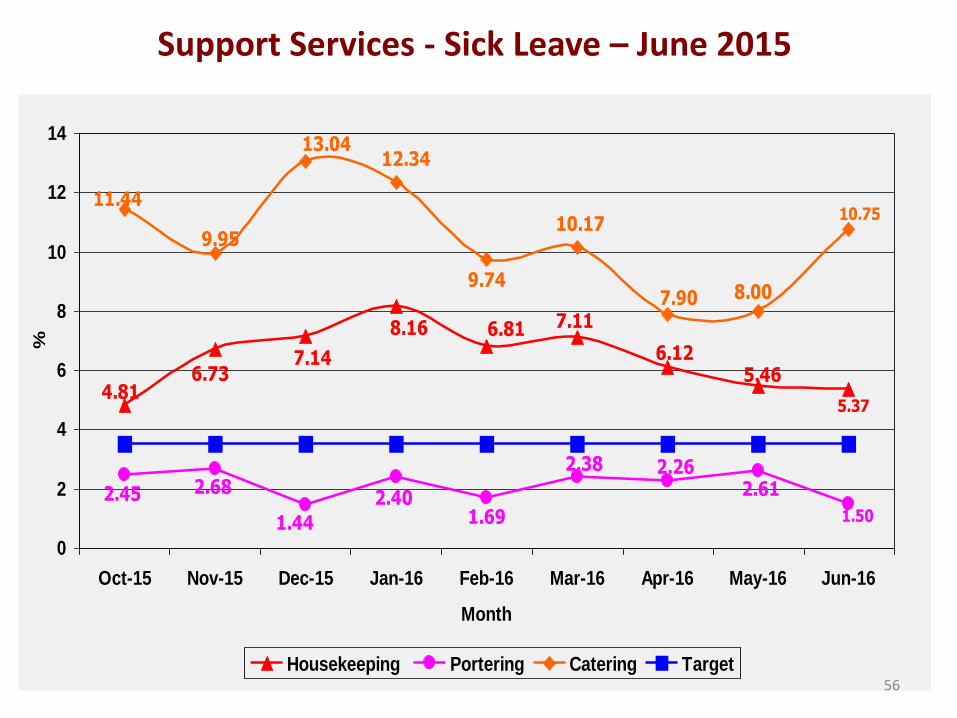
Support Services - Sick Leave – June 2015
7.145.46
5.37
6.12
7.116.818.16
6.734.81
2.38
1.50
2.612.26
1.692.40
1.44
2.45 2.68
10.75
7.90 8.00
10.17
12.34
9.74
13.04
9.95
11.44
0
2
4
6
8
10
12
14
Oct-15 Nov-15 Dec-15 Jan-16 Feb-16 Mar-16 Apr-16 May-16 Jun-16
Month
%
Housekeeping Portering Catering Target56
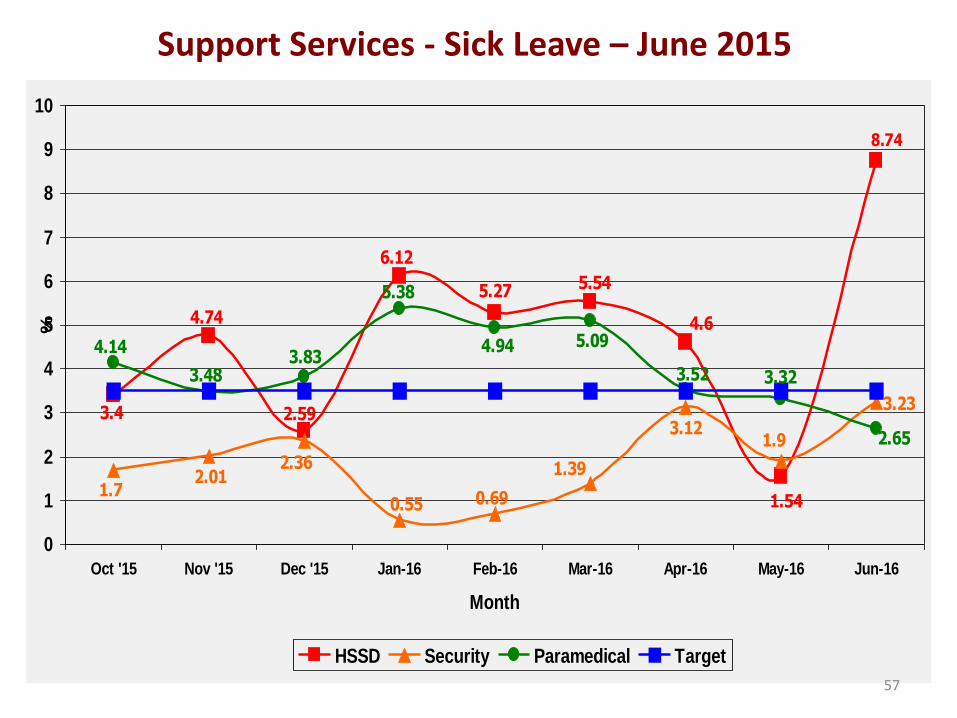
Support Services - Sick Leave – June 2015
5.54
4.74
8.74
1.54
3.4
5.27
6.12
2.59
4.6
2.36
3.23
3.121.9
1.71.392.01
0.55 0.69
3.833.52
2.65
3.32
5.09
3.48
4.14
5.38
4.94
0
1
2
3
4
5
6
7
8
9
10
Oct '15 Nov '15 Dec '15 Jan-16 Feb-16 Mar-16 Apr-16 May-16 Jun-16
Month
%
HSSD Security Paramedical Target
57
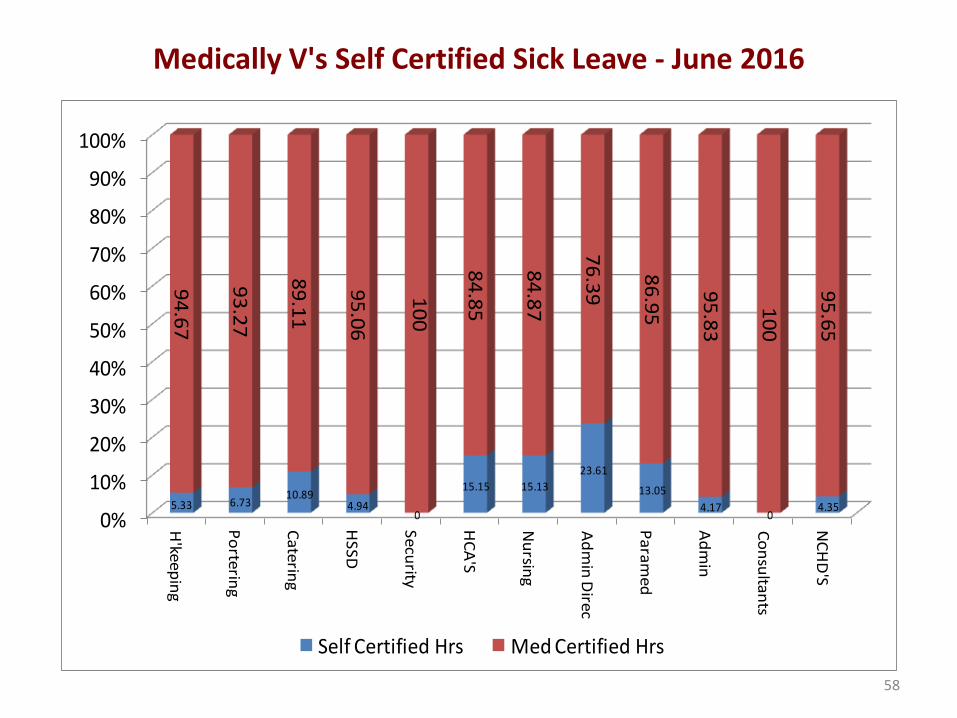
Medically V's Self Certified Sick Leave - June 2016
0%
10%
20%
30%
40%
50%
60%
70%
80%
90%
100%
H'ke
ep
ing
Po
rterin
g
Ca
terin
g
HSSD
Security
HC
A'S
Nu
rsing
Ad
min
Dire
c
Pa
ram
ed
Ad
min
Co
nsu
ltants
NC
HD
'S
5.33 6.7310.89
4.940
15.15 15.13
23.61
13.05
4.170
4.35
94
.67
93
.27
89
.11
95
.06
10
0
84
.85
84
.87
76
.39
86
.95
95
.83
10
0
95
.65
Self Certified Hrs Med Certified Hrs
58

EWTD Compliance –Jan - July 2016
59

Capital Projects Project Status
Paediatric Unit Phase 1 - build programme to be completed by
November 2016
Phase 2 – funding received to progress to Design stage
Radiation Oncology Unit
Planning permission granted
Contractor appointed for enabling work
Funding received for Bracktherapy Equipment
Education and Training Centre Draft Statement of Need completed
Blood Sciences Project
Design Team appointed Funding for interim
infrastructural works approved
Oncology Service
Expansion of Day Unit – plan signed off –
submitted for Philanthropic funding (ACT)
Refurbishment of Ward 2D – capital funding in
place
Medical Oncology Centre – developing Statement
of Need
Ophthalmology Transfer – Phase 2
Project group in place
Application for planning permission submitted
Helipad
Interim helipad in place – contractor to be appointed in
March 2016
Replacement Autoclaves & RO Project Commenced 60
Key Issues
• Retention of 30 inpatient beds (Transitional Care Unit)
• Dependence on patient income
• Potential loss of €300,000 income
• Undergraduate Training costs - €6.5m per annum
• Management of Unscheduled Care/Scheduled Care
• Implementation of Change Programme Initiatives
61


![Balanced Score Card[1]](https://static.fdocuments.net/doc/165x107/577cc7481a28aba711a0873e/balanced-score-card1.jpg)