Balanced Score Card Report Review of September 2017 Data€¦ · Balanced Score Card Report Review...
62
Balanced Score Card Report Review of September 2017 Data
Transcript of Balanced Score Card Report Review of September 2017 Data€¦ · Balanced Score Card Report Review...

Balanced Score Card Report Review of September 2017 Data

Balanced Scorecard
Patient Access
Quality
&
Safety
Human Resource
Management Finance
Patient and Service User

Patient Access – Emergency Department

CUH 30 Day Moving Average 2017 v 2016
5

6 Hour PET & 8AM TrolleyGAR per 100 ED Attends
6

PET Monthly Comparison (Non Admitted)

PET Monthly Comparison (Admitted)

Patient Experience Time >24 Hours
0
50
100
150
200
250
300
350
Jan-17 Feb-17 Mar-17 Apr-17 May-17 Jun-17 Jul-17 Aug-17 Sep-17
320 316
264
328
85 98 68 89
136
PET >24 hours
>75 years >9 hour bed wait
0
50
100
150
200
250
218 199 200 215
129 120
57
108 143
>75yrs Bed Wait >9 hrs (2017)

>14 Day Target Reduction

Project Flow Improving Patient’s Hospital Experience
Project Flow 2017

>14 Day Review
• Weekly Meetings • 193 Patients >14 Days 27th April (9,778 BDs) • 137 Patients >14 days today (7,569 BDs)
– 15 patients >100 Days (3,438 BDs)
• Difficulties with Nursing Home Bed Capacity
• Difficulties with Home Care Provider Capacity
• Plan for increased Transition Care Beds – Clonakilty (16 beds)

Weekend Demand/Capacity
Non Invasive Cardiology
Winter Plan Submission
Report average inpatient waiting time for echo / stress
Potential diagnostics as outpatient
for discussion with Radiology
Communication of bi directional capacity
Bulk text message to Medical Staff
Whiteboard capture
Delegated discharge responsibility (for action)
Friday Specialty Handover (for action)

Resource Dependant Initiatives Transitional Care (50 Beds in
Community)
Acute Beds (Ward 2A)
Operational HUB
Flow Coordinators
Regularisation of extra unstaffed beds
24/7 AMAU Service
ITU & HDU Capacity
Diagnostics
o Point of Care (H1N1, Ketones, Pregnancy testing)
o CT Scanning
o 7 Day Echocardiograph
Bed Management & Acute Floor Information Systems
Ambulatory Care Facilities / Surgical & Cardiac Assessment
Health & Social Care (Rehabilitation)
15

Patient Access - Outpatient Waiting Lists

Total Medical Patients to be seen by 15 Month Target (September) (176) (23/10/2017)
86
27
22
15
8 4 3 2 2 2 2 1 1 1
0
10
20
30
40
50
60
70
80
90
100

Total Surgical Patients to be seen by 15 Month Target (3078) (23/10/2017)
545 527
405
357
293
167 150
121 115 99
77 75 53 48
26 11 3 3 3
0
100
200
300
400
500
600

Patients Currently Waiting Longer Than 12 Months
(5080) (23/10/2017)
2495
838
559
209 194 145 123 121 109 98
51 50 36 23 9 8 6 6 0
500
1000
1500
2000
2500
3000

Ophthalmology Waiting List Validation
Ophthalmology Return Waiting list validation
Consultant G.O.Connor E.O. Connell S.Fenton A.Cullinane Z.Idrees Total
Letters sent out 737 650 444 950 468 3249
Letters left to sent out 520 486 1006
Outcomes
Yes to Stay on w/l 528 230 312 678 319 2067
Request removal 25 14 12 37 11 99
RIP 4 4 8 6 22
Attended TCI 1 1 2
Query 8 2 6 7 4 27
Return Post 2 3 3 2 1 11
Diabetic Screening 16 8 14 24 17 79
No response to date 25/9/17 154 388 97 194 109 942

Patient Access - Inpatient Waiting List

Patients to be Treated by 19th October 2017
Specialty Number of Patients
Breast Surgery 0
Cardiology 0
Cardiothoracic 3
General Surgery 63
Neurology 0
Neurosurgery 0
Orthopaedics 0
Plastic Surgery 69
Respiratory Medicine 0
Urology 43
Vascular 10
Total 188

Urology Waiting List (43)

Plastic Surgery Waiting List
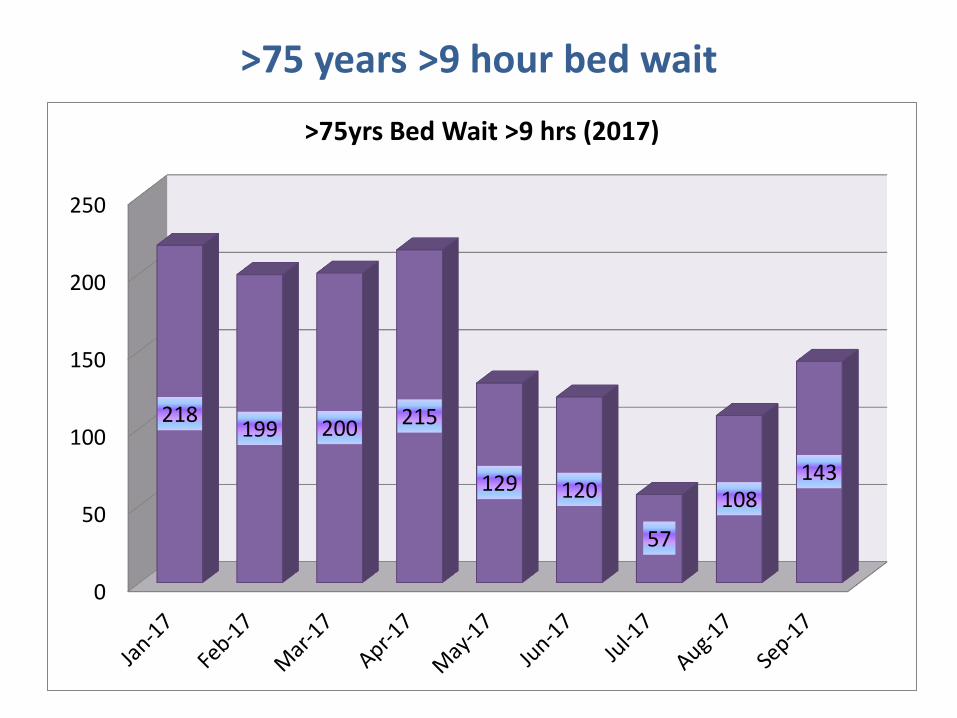
General Surgery Waiting List

Scope Waiting List

Quality & Safety

ALOS All Inpatients – August 2017 G

ALOS Medicine – August 2017
29
A

ALOS Surgery –August 2017
30
R

HIPE Coverage - Prior Month - % of cases entered into HIPE(A38)
G

Cancer KPI – Breast-Lung-Prostate January – September 2017

Chemotherapy Patients In/Out of Target - September
33
In Target, 36, 86%
Outside Target, 6, 14%

Reason for Treatment Delay - September
34
0
0.5
1
1.5
2
2.5
3
3.5
4
4.5
5
PersonalChoice
MedicalReasons
Capacity DataMissing
Other
Total 0 1 5 0 0

Radiotherapy Patients In/Out of Target - September
35
IN TARGET, 39, 52%
OUT OF TARGET, 36,
48% IN TARGET
OUT OF TARGET

Consultants Reasons for Out of Target - September
36
0 1 2 3 4 5 6 7 8 9
Dr Faisal Jamaluddin (Locum RO)
Dr. Aileen Flavin (RO)
Dr. Bolanle Ofi (Locum RO)
Dr. Carol McGibney (RO)
Dr. Frederik Vernimmen (RO)
Dr. Paul Kelly (RO)
1
1
2
3
2
3
1
2
3
6
5
1
3
3
Personal choice
Medical
Capacity
Data Missing
Other

Risk Management – September KPI data
Serious Reportable Events reported CUH -1
Medication Safety Incidents reported - 24
Complaints – 7 complaints raised in July with 42% closed within 30 day timeframe
New claims notified to hospital – 75
Risk Register
Risk Register updated in June– one new risk added

Quality and Safety Pressure Ulcer To Zero
Continue to roll out PUTZ initiative – ward 3B and ICU
SWARTZ Round
2nd round scheduled for 31st October
National Patient Satisfaction Survey
CUH – 55% response rate
Emerging theme is the Discharge Process
Workshop at Group level to review results of the survey
Staff Quality Survey Completed
Vision
Mission Statement

National Patient Survey Key areas for Improvement & Nationally
Discharge Planning
– Need for information on discharge
– Danger signs, what to look out for
– Written information, medication information
Care on the Ward
‾ Nutrition
‾ Worries and Fears
Examinations/diagnosis/Treatment
Need for information
Improved communication

Quality and Safety
Vision
Delivering Safe, Effective, Person-Centred care, Every time
Mission Statement
All CUH staff are committed to delivering the highest level of Quality Care achievable. We will work with you, our service users in enhancing services that are safe, clinically effective and delivered in a clean environment.
40
5 top priorities 20 additional priorities

Human Resource Management

CUH Sick Leave 2016 v 2017- CHANGE
4.65 4.59
4.53
3.913.39
4.27
3.78
3.773.94
4.04
4.08 4.984.77
3.84 3.924.22 4.17 3.9
3.65 3.98
0
2
4
6
Jan Feb Mar April May June July August Sept Oct Nov Dec
%
CUH – Total % Sick Leave 2016 v 2017
2016% 2017% % Target
40.7635.76
38.81
32.49
41.8
43.96 44.55 34.5537.35
31.14
28.89 44.1540.05
0
10
20
30
40
50
Au
g-1
6
Sep
-16
Oct-1
6
No
v-16
De
c-16
Jan
-17
Feb
-17
Ma
r-17
Ap
r-17
Ma
y-17
Jun
-17
Jul-1
7
Au
g-1
7WTE’s
CUH Long Term Sick Leave – WTE’s

EWTD Compliance –January - August 2017

Capital Projects Project Status
Paediatric Unit Phase 1 - build programme completed
Phase 2 – funding received – proceed to Design Stage
Radiation Oncology Unit
Builder commenced on site on Monday 20th February
Education and Training Centre Draft Statement of Need completed and discussion
ongoing with UCC
Meeting held with UCC
Blood Sciences Project
Design Team appointed
Infrastructural works are near completion
Oncology Service
Expansion of Day Unit – plan signed off – submitted
for Philanthropic funding (ACT)
Refurbishment of Ward 2D – capital funding in place
Medical Oncology Centre – developing Statement of
Need
Ophthalmology Transfer – Phase 2
Project group in place
Application for planning permission submitted
Tender Pack being prepared
Helipad
Meeting held with the IAA
Ground Level Helipad the agreed option

Finance

Finance Report – August 2017
CUH Actual outturn YTD 2017
PAY & NONPAY
Gross pay & non pay budget €268.2m (2016 :€256.4m)
Actual pay & non pay €277.8m (2016: €263.9m)
Actual Deficit €9.6m (-3.6%) (2016 :€7.5m/-2.9%)
Less Adjustments €5.4m
Increase in Bad debts provision €2.7m
PCRS Drugs €0.7m
LRA Restoration unfunded €1.7m
Living out allowance €334k
Adjusted Deficit €4.2m(-1.55%) (2016 :€3.5m/-1.4%)

CUH –Pay & Non pay Budget Surplus/(Deficit) %

CUH – Patient Income Budget Surplus/Deficit %

49
CUH AGENCY WTE 2014-7
Jul-14 Sep-14 Dec-14 Jan-15 Mar-15 Jun-15 Sep-15 Dec-15 Jun-16 Sep16 Oct 16 Nov-16 Dec-16 Jan-17 Feb-17 Mar-17 Apr-17 May-17 Jun-17 Jul-17 Aug-17 Sep-17
Actual Actual Actual Actual Actual Actual Actual Actual Actual Actual Actual Actual Actual Actual Actual Actual Actual Actual Actual Actual Actual Actual
Radiotherapist 9.40 4.00 4.87 2.78 0.95 0.9
Radiographer 0.09 0.05 0.06
Labs 12.04 13.40 11.0 12.19 1.0
Cardiac Techs 3.80 3.80 1.0
Physio 1.60 1.50
Pharmacy 2.00 1.00
Admin 23.40 9.08 9.36 14.1 9.3
Nursing 46.20 33.0 34.7 37.8 40.0 30.4 28.6 26.1 31.6 27.6 29.6 31.5 25.5 33.3 33.3 32.7 31.7 34.3 37.3 44.8 41.3 42.0
HCA 34.80 16.2 22.7 23.2 24.4 29.8 30.8 38.2 38.4 52.1 56.9 32.1 17.7 26.1 25.3 34.5 34.5 33.9 36.6 41.6 35.7 39.4
House-Keeping 10.40 0.16
Physics 4.30 2.6 1.6 1.09 0.92 0.75 0.66 0.46 0.83 0.83 0.83 0.83 0.83 0.83 0.83 0.23
Catering 3.00 8.5 2.0 2.7 1.8 6.9 3.9 0.9 1.2
Social Work 1.00 0.5
Occ Therapy 1.00 0.37
Dietician 0.50 0.3 1 1 1 1 1 1 1 1 1 1 1 1 1
Medical 11.00 5.27 4.77 4.4 6.35 5.86 7.97 15.73
Consult 0.25 0 0.38 1.62 0.6 0.34 2.9 3.94 0
NCHD 2.47 6.7 2.99 2.84 1.87 1.82 2.83 2.94 2.15 2.34 1.54 0.8 1.18 3.04
164.5 99.7 91.1 98.26 84.7 74.6 71.9 81.4 76.75 88.23 91.70 69.89 46.9 63.05 63.26 71.37 69.95 71.88 76.4 91.1 83.12 85.44

CUH AGENCY COSTS €k 2015 - 2017
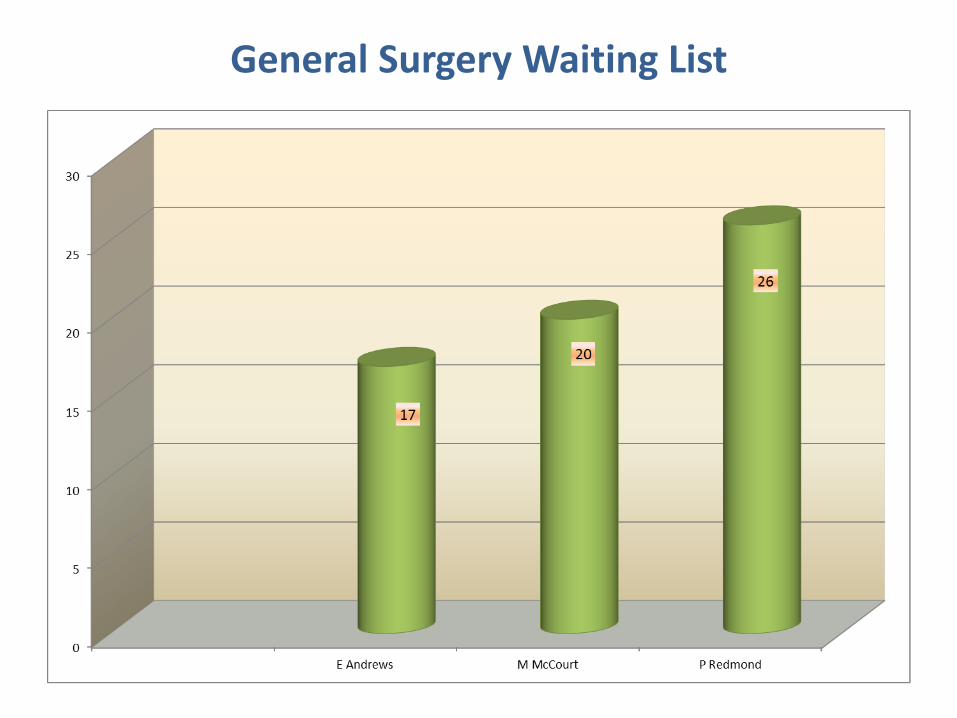
Acute Nursing Agency WTE 2015 to 2017
Acute HCA Agency WTE 2015 to 2017
51

CUH Average Nursing & HCA Agency WTE’s per Week 2015-17
CUH Average Specials /Other Nursing & HCA Agency WTE’s per Week 2016-17

53
CUH Nonpay-Budget v Actual YTD September 2017Budget Actual Variance Actual YTD 2016 Diff 2017-16
Medicines 24,434 25,731 -(1,298) 23,448 -(2,283)
Medical & Surgical 22,174 23,023 -(849) 21,698 -(1,325)
Blood 3,705 4,273 -(568) 3,824 -(449)
Medical Gases 313 338 -(25) 319 -(19)
Medical equipment 3,358 3,703 -(345) 3,513 -(190)
Radiology 4,123 4,497 -(374) 4,008 -(489)
Provisions 1,538 1,600 -(62) 1,493 -(107)
Catering 369 336 33 384 48
Cleaning/Waste 2,847 3,182 -(335) 2,894 -(287)
Laundry 1,370 1,380 -(9) 1,382 2
Energy 2,305 2,353 -(48) 2,400 46
Bedding/ clothing 308 358 -(50) 324 -(33)
Furniture 137 191 -(54) 204 13
Pathology 7,835 7,873 -(38) 8,677 804
Maintenance /Grounds 547 673 -(126) 614 -(59)
Transport /staff travel 1,414 1,436 -(22) 1,517 81
Office expenses 1,473 1,666 -(193) 1,465 -(201)
Telecommunications 350 371 -(20) 354 -(17)
Computer 888 809 78 905 96
Administrative expenses 5,568 8,722 -(3,154) 5,617 -(3,105)
Staff recruitment/training 557 526 31 540 14
Miscellaneous 1,218 944 273 1,290 345
TOTAL NON-PAY 86,830 93,986 -(7,156) 86,871 -(7,115) Less Bad debts -938 -3,455 2,517 -3,511 -(56)
NON-PAY excl Bad Debts 85,892 90,531 -(4,639) 83,359 -(7,172)

CUH Actual Non-pay expenditure €k August
2017 v 2016

CUH Bed Occupancy 2017 v 2016
147 145
139
151
128 130
120 123
125
117 120
108
115 113
111 114
110 111 107
117 119
100
110
120
130
140
150
160
jan feb mar apr may jun jul aug sep oct nov dec
CUH Bed Occupancy 2017 v 2016
2016
2017

Patient Income 2015 –2017

C U H Ot her Income Y TD Sept ember 2 0 17
Income B udget €k A ct ual €k V ariance €k
R ent al income 3 3 5 72 2 3 8 7
B equest s/ D onat ions 117 13 9 2 2
R esearch grant s 2 2 8 16 3 - ( 6 5)
C arpark 1,73 1 2 ,2 13 4 8 2
D rug rebat es / PC R S 7,8 2 1 7,8 9 5 74
M isc 116 10 5 - ( 11)
10 ,3 4 8 11,2 3 7 8 8 9
C U H R ecoupment s and R ef unds Y TD Sept ember 2 0 17
Income B udget €k A ct ual €k V ariance €k
R ecoupment s Pay 6 8 7 79 2 10 5
R ef unds- Pay 13 0 10 6 - ( 2 4 )
R ef unds- Ot her 18 1 8 8 - ( 9 3 )
U nclassif ied 153 14 2 - ( 11)
1,151 1,12 7 - ( 2 4 )

CUH Debtor Days Consultant Claims September 2017

59
Cost Containment Initiatives update at 30/9/17
TARGET JAN/F
EB MAR APR MAY JUN JUL AUG SEP OCT NOV DEC ACTUAL
Unrostered overtime-DIT 250 50 50 50 50 50
2
Reduction in Medical agency
300 30 30 30 30 30 30 30 30 30 30
236 99 53 -43 -45 117 -24 -4 82
3
Drug savings
0
4
Procurement (NDC) one-off & recurring
600 60 120 120 120 180
5
Reduce Waste costs
30 5 5 5 5 5 5
-105 -39 -26 -40
6
Reduce Energy costs
30 5 5 5 5 5 5
8 7 7 -6
7
Reduce Bad debts
0
8
Blood science savings
1,000 100 100 100 100 100 100 100 100 100 100
905 74 70 165 162 40 100 152 142
9
Additional cafe income
330 140 110 10 10 10 10 10 10 10 10
229 4 9 38 0 170 20 7 -18
10
Recode Clinical trials expenditure 100 100
100 100
11
Recode Donated funds expend 200 200
12 Replace pressure relieving mattresses 0
75 75
13 Additional non patient income 0
482 482
TOTAL-Target 2,840 270 240 140 240 150 260 320 320 320 580
TOTAL- Actual 1,930 177 132 160 117 327 164 136 717

MGH - Finance Report – September 2017
Mallow YTD September 2017 outturn
Gross pay & non pay budget €15.16m (2016:€13.4m)
Actual pay & non pay €15.54m (2016:€13.5m)
Actual deficit €389k (-3%)
Less Adjustments €324k
increase in Bad debts provision €223k
LRA Restoration unfunded €85k
living out allowance €16k
Adjusted deficit €65k (-0.4%) (2016:€87k/-0.7%)
Mallow Income outturn
Income budget €2.67m (2016:€2.57m)
Actual Income €2.74m(2016:€2.42m)
Actual surplus €66k (3%) (2016:Deficit €150k/-6%)

BGH - Finance Report – September 2017
Bantry YTD September 2017 outturn
Gross pay & non pay budget €15.57m
Actual pay & non pay €16.11m
Actual deficit €535k (-3.4%)
– Less Adjustments €355k
– Increase in Bad debts provision €92k
– St. Josephs ward €168k
– LRA Restoration unfunded €78k
– Living out allowance €14k
– Waiting list initiative €2k
Adjusted deficit €180k (-1.16%)
Bantry Income outturn
Income budget €2.7m
Actual Income €2.7m
Actual surplus €6k (0.2%)

Capital Projects Project Status
Paediatric Unit Phase 1 - build programme completed
Phase 2 – funding received – proceed to Design Stage
Radiation Oncology Unit
Builder commenced on site on Monday 20th February
Education and Training Centre Draft Statement of Need completed and discussion
ongoing with UCC
Meeting held with UCC
Blood Sciences Project
Design Team appointed
Infrastructural works are near completion
Oncology Service
Expansion of Day Unit – plan signed off – submitted
for Philanthropic funding (ACT)
Refurbishment of Ward 2D – capital funding in place
Medical Oncology Centre – developing Statement of
Need
Ophthalmology Transfer – Phase 2
Project group in place
Application for planning permission submitted
Tender Pack being prepared
Helipad
Meeting held with the IAA
Ground Level Helipad the agreed option

Key Issues
Structured Overtime
Pay controls clearly working
Need for change in accounting for PCRS funded drugs
Bad Debts
PF17 working well
Challenge with complex discharges
Ophthalmology service risk
CAMHS
Pharmacy Review
Quality Strategy
National Quality Survey
Unscheduled Care Process
Day Surgery Unit
INMO relations working well
Implementation of change programme in Catering/Housekeeping
Sick Leave Focus
HR recruitment workload
Grading of staff must be addressed
Finance Patient Access
Quality & Safety
Patient and Service User
Human Resource