
Balance Sheet 10-11
124
MSP STEEL & POWER LIMITED | ANNUAL REPORT, 2010-11 BE BOLD. BE DIFFE RENT.
-
Upload
mayankkhatri2 -
Category
Documents
-
view
39 -
download
4
Transcript of Balance Sheet 10-11

MSP STEEL & POWER LIMITED | ANNUAL REPORT, 2010-11
MSP Group 16/S, Block-A, New Alipore, Kolkata 700 053
Phone: 033 40057777/40145678
Fax: 23982239/40057799
Email: [email protected]
Website: www.mspsteel.com
BEBOLD.BEDIFFERENT.

A PRODUCT
Forward-looking statements In this annual report we have disclosed forward-looking information to enable investors to comprehend our prospects and take informed
investment decisions. This report and other statements – written and oral –that we periodically make contain forward-looking statements
that set out anticipated results based on the management’s plans and assumptions. We have tried wherever possible to identify such
statements by using words such as ‘anticipates’, ‘estimates’, ‘expects’, ‘projects’, ‘intends’, ‘plans’, ‘believes’ and words of similar substance
in connection with any discussion of future performance.
We cannot guarantee that these forward-looking statements will be realised, although we believe we have been prudent in our assumptions.
The achievement of results is subject to risks, uncertainties and even inaccurate assumptions. Should known or unknown risks or
uncertainties materialise, or should underlying assumptions prove inaccurate, actual results could vary materially from those anticipated,
estimated or projected.
We undertake no obligation to publicly update any forward-looking statements, whether as a result of new information, future events or otherwise
Board of DirectorsChairman
Mr. Puranmal Agrawal
Managing Director
Mr. Suresh Kumar Agrawal
Non Executive Directors
Mr. Manish Agrawal
Mr. Saket Agrawal
Independent Directors
Mr. Arvind Kumar Saraf
Mr. Navneet Jagatramka
Mr. Amit Mehta
Mr. Pavan Kumar Gupta
Company SecretaryMiss Pinky Gupta, B.Com (H), ACS
AuditorsM/s. S. R. Batliboi & Co.
Chartered Accountants
BankersState Bank of India
ING Vysya Bank
Andhra Bank
UCO Bank
Indian Overseas Bank
State Bank of Mysore
Allahabad Bank
Axis Bank
State Bank of Bikaner & Jaipur
United Bank of India
Corporation Bank
DBS Bank Limited
ICICI Bank Limited
Union Bank of India
Dena Bank
Oriental Bank of Commerce
Registered Office1, Crooked Lane,
Kolkata - 700 069
Ph. No: (033) 22483795
Fax No: 22484138
Corporate Office16/S, Block-‘A’, New Alipore,
Kolkata - 700 053
Ph No: 40057777/23990038/3940
Fax No: 23982239/40057788
E-mail: [email protected]
Share RegistrarsKarvy Computershare Pvt. Ltd
46, Avenue 4, Street No. 1,
Banjara Hills,
Hyderabad - 500 034
Corporate Information
02Corporate identity
04Growth in our numbers
06Strategic overview by the Chairman
12Answering shareholder questions
16Business segment review
18Exciting industry prospects
20Corporate social responsibility
21Management discussion and analysis report
25Directors’ Report
30Report on Corporate Governance
38CEO & CFO certification
39Auditors’ Report
42Balance sheet
43Profit & loss account
44Cash flow statement
45Schedules and notes
71Balance sheet abstract
72Section 212
73Other financial statements
Contents

BE BOLD.BE DIFFERENT.In a challenging 2010-11, the Indian steelindustry grew 8.80%. MSP Steel & PowerLimited reported a 25.01% increase in itsrevenues to Rs. 517.89 cr and a 56.64%increase in its profit after tax to Rs. 50.21 cr.
In a sluggish 2010-11, there was a generaldecline in steel industry margins; MSP Steel& Power Limited reported a 403.14 bpsincrease in its EBIDTA margin to 21.22%.
This typically contrarian performance wasthe result of a number of proactiveinitiatives by the Company to reduceproduction costs at one end and enhancevalue-addition at the other.

2
WHO WE ARE
VISIONTo unleash the power of our
products to help enhance the
country’s economic growth and the
wellbeing of its citizens
LEGACYFlagship of the MSP Group promoted
by Mr. Puranmal Agrawal (Chairman)
and Mr. Suresh Kumar Agrawal
(Managing Director)
CREDENTIALSOne of India’s fastest-growing industrial
conglomerates, engaged in the production
and distribution of products like sponge
iron, MS billets, TMT bars, structurals
(angles, channels and joists) and power
BRANDThe Company’s TMT bars are
marketed under the popular
‘MSP Gold TMT Bar now with Quadra
Power’ brand
Next-Gen TMT Bar

3
PRESENCEHeadquartered in Kolkata with a
pan-India marketing presence
PEOPLEMore than 1,000 employees
LISTINGThe equity shares of MSP Steel &
Power are listed on the Bombay and
National Stock Exchanges.
PROMOTER
HOLDINGThe promoters hold a 71.80% stake
in the Company’s equity share
capital.
SHAREHOLDER
RECOGNITIONMarket capitalisation increased from
Rs. 224.27 cr as on 31 March 2010 to
Rs. 366.90 cr as on 31 March 2011

4
CHALLENGING YEAR FOR THE INDUSTRY. Revenue(gross)
Operatingprofit
Post-taxprofit
Interestcover
Cash profit
Operatingprofitmargin
2006-07
2007-08
2008-09
2009-10
2010-11
2006-07
2007-08
2008-09
2009-10
2010-11
2006-07
2007-08
2008-09
2009-10
2010-11
2006-07
2007-08
2008-09
2009-10
2010-11
2006-07
2007-08
2008-09
2009-10
2010-11
2006-07
2007-08
2008-09
2009-10
2010-11
Rs. 223.85 cr
Rs. 375.48 cr
Rs. 413.87 cr
Rs. 395.85 cr
Rs. 517.89 cr
Rs. 9.90 cr
Rs. 45.69 cr
Rs. 34.78 cr
Rs. 37.84 cr
Rs. 63.39 cr
4.70%
12.67%
8.72%
9.13%
12.24%
Rs. 34.34 cr
Rs. 54.00 cr
Rs. 47.30 cr
Rs. 44.62 cr
Rs. 69.54 cr
Rs. 20.18 cr
Rs. 46.67 cr
Rs. 39.89 cr
Rs. 32.05 cr
Rs. 50.21 cr
3.15
5.27
3.53
2.86
3.86

5
Debt-equityratio
Gross block
Return oncapitalemployed(average)
Earningsper share(EPS, basic)
Book valueper share
Dividendper share
2006-07
2007-08
2008-09
2009-10
2010-11
2006-07
2007-08
2008-09
2009-10
2010-11
2006-07
2007-08
2008-09
2009-10
2010-11
2006-07
2007-08
2008-09
2009-10
2010-11
2006-07
2007-08
2008-09
2009-10
2010-11
2006-07
2007-08
2008-09
2009-10
2010-11
1.39
1.58
1.61
2.06
2.20
10.72%
18.19%
10.19%
8.09%
6.85%
Rs. 130.68 cr
Rs. 150.39 cr
Rs. 250.89 cr
Rs. 292.22 cr
Rs. 555.27 cr
Rs. 3.47
Rs. 8.03
Rs. 6.87
Rs. 5.52
Rs. 8.62
Rs. 42.10
Rs. 0.50
Rs. 0.50
Rs. 0.00
Rs. 0.00
Rs. 0.00
Rs.34.65
Rs. 29.13
Rs. 22.35
Rs. 14.32
RECORD YEAR FOR THE COMPANY.

6
STEEL REPRESENTSTHE HEART OF THE
MODERN WORLD.
TODAY’S PRODUCERSSEEK TO CREATE
NEW STEELVARIETIES FOR
EMERGINGAPPLICATIONS
THROUGH IMPROVEDMANUFACTURINGPROCESSES WITH
THE OBJECTIVE TOMAKE MORE FROM
LESS, WHILEREDUCING
ENVIRONMENTALIMPACT.
Steel is now a globally-traded product.
Japan has consistently been a major net
exporter, and the USA a major net
importer. However, between 2005 and
2007, China’s exports more than
doubled to 69 million tonnes before
falling 13% in 2008 and almost 60% in
2009. Demand was robust during the
first half of 2010 in the developing
world, aided in part by government
stimulus packages, improving credit
conditions and falling unemployment
(evident in parts of Asia and South
America).
In India, a tightening monetary policy
strengthened interest rates but
impacted steel consumption and
realisations. This reality
notwithstanding, MSP reported a highly
improved performance in 2010-11.
Highest ever turnover of Rs. 517.89 cr
compared with Rs. 414.28 cr in 2009-10
(growth of 25.01%)
Highest ever EBIDTA of Rs. 109.90 cr
compared with Rs. 71.21 cr in 2009-10
(growth of 54.33%)
Highest ever cash profit of Rs. 69.54
cr compared with Rs. 44.62 cr in 2009-
10 (growth of 55.82%)
Highest ever net profit of Rs. 50.21 cr
compared with Rs. 32.05 cr in 2009-10
(growth of 56.64%)
Indian steel industry It was generally believed that India’s
steel industry has a 1.5x multiplier with
the country’s GDP growth – an annual
demand growth of around 12% to keep
the country’s infrastructure engine
running. It will be pertinent to indicate
that India expects to double its
infrastructure outlay to USD 1 trillion in
the Twelfth Plan, which will create a
considerably larger appetite for steel in
India.
Now consider the supply side: A
number of large steel players
announced greenfield steel-making
plans in India over the last five years, of
which, hardly a few materialised on
account of issues related to land
acquisition, livelihood displacement and
environmental clearances. This indicates
that not only is the country unlikely to
commission adequate steel-making
capacity to feed its growing needs, but a
projected shortage is likely to turn India
into a net steel importer.
MSP is attractively placed to capitalise
on this industry scenario: The Company
is proximate to raw material resources,
progressively secured its raw material
requirements, substituted the need to
make large capital investments with
relatively moderate capacities that can
be progressively scaled, commissioned
projects ahead of schedule and created a
business model that represents a balance
of revenues and margins growth.
As a result of this business model, the
Company expects to enhance
stakeholder value in a sustainable way
across the foreseeable future.
STRATEGIC OVERVIEW BY THE CHAIRMAN
7
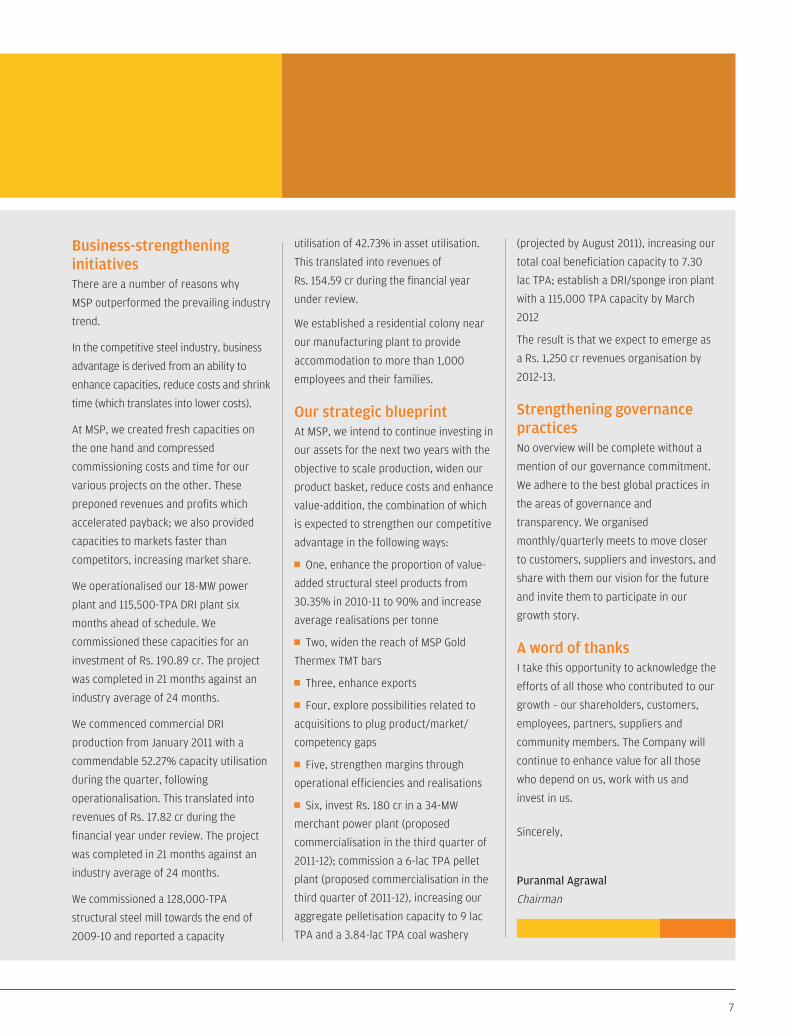
Business-strengtheninginitiatives There are a number of reasons why
MSP outperformed the prevailing industry
trend.
In the competitive steel industry, business
advantage is derived from an ability to
enhance capacities, reduce costs and shrink
time (which translates into lower costs).
At MSP, we created fresh capacities on
the one hand and compressed
commissioning costs and time for our
various projects on the other. These
preponed revenues and profits which
accelerated payback; we also provided
capacities to markets faster than
competitors, increasing market share.
We operationalised our 18-MW power
plant and 115,500-TPA DRI plant six
months ahead of schedule. We
commissioned these capacities for an
investment of Rs. 190.89 cr. The project
was completed in 21 months against an
industry average of 24 months.
We commenced commercial DRI
production from January 2011 with a
commendable 52.27% capacity utilisation
during the quarter, following
operationalisation. This translated into
revenues of Rs. 17.82 cr during the
financial year under review. The project
was completed in 21 months against an
industry average of 24 months.
We commissioned a 128,000-TPA
structural steel mill towards the end of
2009-10 and reported a capacity
utilisation of 42.73% in asset utilisation.
This translated into revenues of
Rs. 154.59 cr during the financial year
under review.
We established a residential colony near
our manufacturing plant to provide
accommodation to more than 1,000
employees and their families.
Our strategic blueprint At MSP, we intend to continue investing in
our assets for the next two years with the
objective to scale production, widen our
product basket, reduce costs and enhance
value-addition, the combination of which
is expected to strengthen our competitive
advantage in the following ways:
One, enhance the proportion of value-
added structural steel products from
30.35% in 2010-11 to 90% and increase
average realisations per tonne
Two, widen the reach of MSP Gold
Thermex TMT bars
Three, enhance exports
Four, explore possibilities related to
acquisitions to plug product/market/
competency gaps
Five, strengthen margins through
operational efficiencies and realisations
Six, invest Rs. 180 cr in a 34-MW
merchant power plant (proposed
commercialisation in the third quarter of
2011-12); commission a 6-lac TPA pellet
plant (proposed commercialisation in the
third quarter of 2011-12), increasing our
aggregate pelletisation capacity to 9 lac
TPA and a 3.84-lac TPA coal washery
(projected by August 2011), increasing our
total coal beneficiation capacity to 7.30
lac TPA; establish a DRI/sponge iron plant
with a 115,000 TPA capacity by March
2012
The result is that we expect to emerge as
a Rs. 1,250 cr revenues organisation by
2012-13.
Strengthening governancepractices No overview will be complete without a
mention of our governance commitment.
We adhere to the best global practices in
the areas of governance and
transparency. We organised
monthly/quarterly meets to move closer
to customers, suppliers and investors, and
share with them our vision for the future
and invite them to participate in our
growth story.
A word of thanks I take this opportunity to acknowledge the
efforts of all those who contributed to our
growth – our shareholders, customers,
employees, partners, suppliers and
community members. The Company will
continue to enhance value for all those
who depend on us, work with us and
invest in us.
Sincerely,
Puranmal Agrawal
Chairman

8
Value-addition
FROM AN AVERAGE RAWMATERIAL COST OF
2,779PER TONNE TO AN AVERAGE END-PRODUCTREALISATION OF
29,012PERTONNE.
RS.
RS.

9
At MSP, the strength of our business strategy is reflected in our
extensive value-addition capabilities that transform commodities
at one end into ready-to-fit structural steel products at the other.
This value chain comprises a product basket wherein one
product becomes the raw material for another product, creating a
captive and growing appetite for products within the Company
This value chain provides us with the flexibility to manufacture
products for captive consumption and external sale; this makes it
possible for us to reduce costs and enhance revenues
This extensive integration strengthens our competitive position
to progressively emerge among the country’s lowest cost steel
producers over the foreseeable future.
The result: The Company enhanced its EBITDA margin from
17.19% in 2009-10 to 21.22% in 2010-11, indicating an attractive
decline in production costs on the one hand and value-addition
on the other.

10
Rich product / customer portfolio
FROM
20:80FOR VALUE-ADDED TO
NON-VALUE-ADDEDPRODUCTS FIVE YEARS AGO
TO
80:20TODAY.
At MSP, we evolved from the manufacture of commoditised to value-added products.
This focus on value-addition helps increase our overall margins, enhancing ourviability, visibility and respect
This focus also helps our business at various levels – the rapid liquidation of finishedproduct inventory during market downturns and attractive realisations during industryuptrends
This preference for value-addition helps us enter enduring customer relationships,graduating us from vendors to partners of choice.
The result: The Company reported its highest ever topline and bottomline at Rs. 517.89
cr and Rs. 50.21 cr respectively in 2010-11, even as the steel industry remained relatively
sluggish.

11
Stakeholder-centricity
FROM A
SHORT-TERMVIEW TO A
LONG-TERMBUSINESS PLAN.
At MSP, our business is steel and our objective is value-enhancement
Over the years, we invested prudently in our business with the result that we expecta projected revenue of Rs. 862 cr in 2011-12, growing faster than the industry average
Besides, Rs. 897.46 cr of fixed asset is supported by Rs. 492.48 cr of long term debt (31 March 2011)
The Company expects to further invest Rs. 339.92 cr to strengthen its business,which should generate revenues of (approx) Rs. 1,250 cr in 2012-13, when these assetsare fully commissioned
The Company expects to graduate to an EBIDTA in excess of 30%, followingcomplete asset commissioning, complementing its volume advantage with value

12
Q&ASuresh Kumar Agrawal, Managing Director, answers questions
Were you happy with theCompany’s working in 2010-11?A: I was pleased with the way we
conducted ourselves during the year under
review for one good reason: The steel
industry passed through a challenging year
marked by declining margins and erratic
realisations; however, at MSP, we
increased EBIDTA margin by 403.14 bps
and revenues by 25.01% during the period
under report. The result was that we
strengthened our cash profit (depreciation
plus post-tax profit) from Rs. 44.62 cr in
2009-10 to Rs. 69.54 cr in 2010-11. This
clearly vindicates the differentiated nature
of our strategy and industry positioning.
What did the Company dodifferently in 2010-11 thattranslated into this industryoutperformance?A: A number of competencies came
together to make even a challenging 2010-
11 a record year for our Company: We
derived the benefit of a full year’s working
of our structural steel plant which was
commissioned in late 2009-10; we
commissioned projects ahead of schedule
or on schedule; we enhanced our asset
utilisation across a number of plants,
enabling us to cover our fixed costs better;
we climbed the value chain in our
structural steel segment. The cumulative
impact of these initiatives translated into a
superior performance.
You indicated a ‘differentiatedindustry positioning’. What doyou mean?A: At MSP, we are not obsessed with
growing revenues merely for the sake of
growth, but to grow profitably as well. The
numbers are our evidence: We grew
EBITDA margin from 17.19% in 2009-10 to
21.22% in 2010-11. This followed a priority
to mitigate our limitations on the one
hand and maximise our strengths on the
other.

13
In what way is MSP differentfrom most steel companies?A: MSP is different on account of its
relatively capital-light strategy in a capital-
intensive industry. For instance, most
companies in our position would have
chosen to own a mine, which is an ideal
situation, but perhaps a time-consuming
one from a regulatory perspective. The
delay in mine ownership would have
entailed a large capital investment at the
outset and quite a few years would have
been spent in obtaining relevant regulatory
approvals. So we did the next best thing to
circumvent this disadvantage: We imported
the Chinese beneficiation technology,
which will make it possible for us to use
low grade iron ore without compromising
on downstream steel-making.
This should be possible formost manufacturers. Whatmade MSP different?A: The technology to beneficiate low-grade
iron ore is challenging. Besides, this is even
more challenging if one uses the Chinese
beneficiation technology that is largely
oriented towards the blast furnace route,
customised to their raw material quality
and generally suited to plants higher than
0.6 mn TPA.
We invested in such a technology, but what
made our achievement particularly
creditable was that we had no Indian
models to follow, we needed to customise
the Chinese technology to suit Indian raw
materials, we started with an ore of 57-
58% Fe content (among the most
challenging beneficiation experiments tried
in the country), we started with a capacity
below 0.6 mn TPA and plant stabilisation
was challenging in the first couple of years.
When one puts all these variables together,
The result is a risk most companies are
unwilling to take especially if their capital
investments are extensively funded by
debt.
One could have graduated tothe use of 63 grade Fe; whydid the Company select towork with 57-58 grade Fe inthe first place?For a good reason: Larger quantities of 63
grade Fe were being exported, resulting in
higher ore procurement costs within India
and a corresponding difficulty in being able
to consistently access this material. On the
other hand, there was a significant
opportunity window in the lower-grade
ores: They were easily available and
considerably cheaper. We took a long-term
call and chose to invest in beneficiation
technology that would consume low-grade
ore, create a cost advantage, generate
attractive profits and provide us with a
cash pool to acquire mines (if needed)
going ahead.
What were the variouschallenges that the Companyfaced as a result of thiscontrarian decision?A: There were a number of challenges that
we encountered in the import and
implementation of this technology:
The Chinese pelletisation technology is
based on the blast furnace route whereas
ours is based on the DRI route, generally
sustained by the use of expensive furnace
oil that is exposed to increasing crude
prices. This made it imperative for us to
combine the DRI process with a coal
gasification plant that would generate
adequate low-cost coal gas to sustain our
pelletisation plant (replacing expensive
furnace oil). This combination proved
challenging.
There was a challenge climbing the
learning curve with speed, which would
establish long-term project viability.
What were the other strategicpriorities that reinforced theCompany’s long-termviability? A: At MSP, we recognised a long-term
skew: most steel industry players preferred
to invest in large downstream assets
without securing their upstream
requirements. In doing so, they are
expected to procure their raw material
requirements from the outside, affecting
viability of their large investments.
At MSP, we reversed this investment
priority: Of all investments we made until
the end of 2010-11, 17.38% was invested in
upstream assets. The result of this is
evident: In 2010-11, even as steel
realisations declined, MSP reported higher
EBITDA margins by 403.14 bps over the
previous year; We are optimistic that this
trend – higher revenues and margins – will
continue into the foreseeable future,
enhancing value for our stakeholders.
What is the rationale forinvesting in upstream first anddownstream assetsthereafter? A: The steel industry is passing through a
‘cascading margins phenomenon’, where
once steel prices rise, the immediately
preceding input (billets) rises in cost as well
and thereafter the next available raw
material (DRI) and finally increases the cost
of ore. At MSP, we recognised that our
competitiveness would be derived from
progressive investments that we made in
ore ownership at one end and supported
by downstream linear (DRI, billets) and
lateral investments (captive power

14
generation). So this is precisely what we
did: We resolved to invest in beneficiation-
cum-pelletisation of low-grade ore,
protecting us from the volatility of the 63-
grade Fe ore on the one hand, providing us
with the advantages of ore security without
having to invest significantly in mine
ownership on the other.
How did the Company leveragethe full impact of this strategicdecision?A: We recognised that as we grew our
steel-making capacity, we would need a
growing pelletisation capacity and in turn
would need to bring in larger quantities of
ore into our plant facility. In view of this
long-term requirement, we invested in a
private 2-km railway siding to bring the ore
into our manufacturing facility; in the
second stage, we are extending this siding
to 6-km and bringing in automated wagon
tipplers and stacker reclaimers to
accelerate ore inflow. This will make it
possible to enhance our asset utilisation
and maximise our cash flow through
investments made currently at a relatively
low-cost; it will also enable us to reduce
our capital investment while expanding our
steel-making capacity when the cost of
capital investments would be higher.
There were a number of such supporting
investments that we made with an eye to
be prepared for tomorrow’s growing
requirements:
We invested in a 24-MW power
generation plant for our captive use and in
18 MW for merchant sale; the former
suffices for 80% of our captive needs; if
realisations decline, we will be inclined to
use merchant generation for captive needs
and vice versa, which represents an
adequate de-risking
We invested in power evacuation
transmission lines to generate attractive
power sales
We invested in 331.55 acres, of which we
only used 119.69 acres
We received the environment clearance
for a one million-TPA steel-making facility,
which will progressively be utilised over the
coming years
You indicated prudentupstream investments incapacity building. What aboutdownstream investments?A: The financial year 2010-11 was the first
full year of our 128,000 TPA structural
steel facility, generating 30.35% of our
total revenues for the year under review.
These were some of our achievements
during 2010-11:
We ran this unit at 42.73% which is a
good index for a plant in its first full
operational year
We branded these structural products
around ‘MSP’ and I am pleased to state
that the brand was well-accepted in a
competitive marketplace
We climbed the value chain, starting with
200-250 MM beam with an average
realisation of Rs. 32 a kg to the 300-400 MM
beam fetching Rs. 38 a kg (with no increase
in raw material cost), with a clear perspective
of graduating to 450-500 MM during the
current financial year. A similar approach
was visible in the channels segment
We are well-placed to widen volumes and
value. We established the integrity of our
products across a larger customer base in
the 200-250 MM range; we will be able to
graduate customers to the value-added
segments and customise input material
from steel melting shop onwards, resulting
in precise end-product properties required
by our customers.
The result was that we successfully
marketed our products to demanding
institutional customers in our first year:
ACC, Ambuja Cement, Essar Heavy
Engineering, Essar Oil, Grasim, JK Cement,
Larsen & Toubro, JSW Cement, JSW Steels
and the Jaypee Group.
What were the otherdevelopments that transpiredin 2010-11?A: We delivered our promises in the
following ways during 2010-11:
We commissioned our 18-MW power
plant (merchant sales) in January 2011, six
months ahead of schedule and within the
overall project cost. We ran this facility at
90% PLF; this year, we expect to enhance
utilisation and generate an average
realisation of Rs. 3-4 per unit.
We invested in a 24-MW powergeneration plant forour captive use andin 18 MW formerchant sale; theformer suffices for80% of our captiveneeds

15
Of the total power that we generated,
17.13% was marketed to external users,
resulting in a rich experience of
commercial power generation, which may
be leveraged in a bigger way in the future.
The merchant and captive generation
models play an important role – 32 MW will
be cogeneration utilising waste gases; 44
MW merchant power generation will utilise
rejects and char from waste. So either way,
we will leverage low-cost inputs for power
generation.
We commissioned our 115,500-TPA DRI
kiln in January 2011 (taking our total
capacity to 307,500 TPA) which was three
months ahead of schedule.
Much of the competitivenessin the steel industry is derivedfrom an ability to reduceoperational costs. Where doesMSP stand in this regard?A: This is precisely where MSP invested
across the last few years:
The Company recovers waste from its
coal washery for onward use in power
generation
The waste gases released from DRI
manufactured is captured by the system to
generate captive power
The Company invested in beneficiation
technology to use iron ore fines with
negligible marketable value and hence
considered waste
The Company invested in coal
gasification to replace the use of expensive
furnace oil
The total impact of these initiatives
translated into a cumulative cost saving of
Rs. 3,500 per tonne of the end product
during 2010-11.
How is the Company’sbusiness model adequatelyrisk-controlled?A: There are a number of initiatives that
secured our business model in an
otherwise volatile steel industry:
We do not use iron ore that is expensive
or difficult to procure in today’s
environment; We use iron ore fines that are
low-cost and generally considered
dispensable by potential users
We do not consume any coking coal,
which is in severe shortage; we use the DRI
route in steel manufacture
We are relatively under-leveraged; we
only had Rs. 250 cr in long-term debt,
gross block of around Rs.550 cr as on 31
March 2011 and a replacement cost of
Rs. 850 cr
We already invested in supporting
infrastructure that will make our revenues
scalable without making large additional
investments
We were allocated coal and iron ore
mines, which will be progressively
commissioned when their regulatory
approvals are received
What can shareholders expectin 2011-12?A: These are some of the business-
strengthening developments that
shareholders can expect during the current
financial year:
Pelletisation: We expect to enhance our
pelletisation capacity from 0.3 mn TPA to
0.9 mn TPA by third quarter of 2011 at a
cost of Rs. 226 cr
Merchant power generation: We expect
to enhance our merchant power capacity
by 34 MW from third quarter of at a cost of
Rs. 180 cr
DRI: We expect to commission our fourth
DRI kiln by 115,000 TPA (taking our total
DRI capacity to 422,500 TPA ) at a cost of
Rs. 90 cr
Coal washery and rail siding: We expect
to commission the former by June 2011 and
the latter by June 2012 at a cumulative
investment of Rs. 120 cr
The result is that we expect to increase our
topline from Rs. 517.89 cr in 2010-11 to
around Rs. 800 cr in 2011-12 and an
estimated Rs. 1,250 cr in 2012-13.
Shareholders will witness the impact of our
investments in our EBITDA margins:
Climbing from 17.19% in 2009-10 to 21.22%
in 2010-11 to an estimated 30% in 2012-13
when these investments start generating
returns.
We expect tocommission ourfourth DRI kiln by115,000 TPA (takingour total DRI capacityto 422,500 TPA) at acost of Rs. 90 cr

16
BUSINESS SEGMENT REVIEW
Business segment 1SPONGE IRON
Percentage contribution to grosssales, 2010-11
Production
Sales23.65%
2008-09
2009-10
2010-11
155,851 MT
158,187 MT
Significant highlights, 2010-11
Achieved the highest levels of production
and sales at 1.58 lac MT and 0.65 lac MT
respectively
Reported a 75.09% capacity utilisation
Achieved one of our highest ever external
sales of 23.65%; of overall sales
124,896 MT
2008-09
2009-10
2010-11
Rs. 74.07 cr
Rs. 109.19 cr
Rs. 51.85 cr
Business segment 2POWER
Percentage contribution to grosssales, 2010-11
Production
Sales3.01%
2008-09
2009-10
2010-11
161.78 mm kwh
193.00 mm kwh
Significant highlights, 2010-11
Reported one of our highest ever PLFs of
90.25%
Under merchant power sales, sold 33.05 mn
power units and achieved sales of Rs. 15.34 cr
Recorded average tariffs ranging between
Rs. 4–5.50 per unit
Achieved external-captive sales of 70:30
137.09 mn kwh
2008-09
2009-10
2010-11
Rs. 6.15 cr
Rs. 15.34 cr
Rs. 0.70 cr

17
Business segment 3MS INGOTS/BILLETS
Percentage contribution to grosssales, 2010-11
Production
Sales5.72%
2008-09
2009-10
2010-11 102,326 MT
Significant highlights, 2010-11
Achieved one of the highest ever production
and sales of MS ingots/ billets at 1.02 lac MT
and 0.10 lac MT respectively
Recorded a 71.01% capacity utilisation
95,078 MT
2008-09
2009-10
2010-11 Rs. 28.36 cr
Rs. 155.66 cr
Business segment 4TMT BARS
Percentage contribution to grosssales, 2010-11
Production
Sales28.25%
2008-09
2009-10
2010-11 49,379 MT
Significant highlights, 2010-11
Achieved one of the highest levels of
production and sales at 0.49 lac MT and 0.47
lac MT respectively, resulting from demand
pick-up from the construction sector
Reported a 61.72% capacity utilisation
2008-09
2009-10
2010-11
Rs. 158.57 cr
Rs. 135.55 cr
Rs. 169.31 cr
Business segment 5STRUCTURAL PRODUCTS
Percentage contribution to grosssales, 2010-11
Production
30.35% Significant highlights, 2010-11
Operationalised greenfield structural rolling mill in April 2010
Achieved production and sales of 53,196 MT and 48,320 MT respectively
53,196 MT
2010-11
Sales
140.18 cr
2010-11
107,579 MT
Rs. 100.25 cr
56,506 MT
64,811 MT

18
Indian economic reviewIndia successfully overcame the global
economic slowdown and GDP grew at 8.6%
in 2010-11 against 8% in 2009-10. Most
economic sectors maintained a constant
growth with the agricultural sector,
recording a strong 5.4% growth in 2010-11
against 0.4% in 2009-10. The economy is
further expected to grow 8.5-9% in 2011-12
(Source: Economy Advisory Council).
Meanwhile, the domestic environment is
conducive for growth, private final
consumption expenditure and gross fixed
capital formation is expected to grow 7.5%
and 14.6% in 2011-12 (Source: Centre for
Monitoring Indian Economy, CMIE).
Global steel industryProduction: The global crude steel
production witnessed a significant growth
of 15% reaching 1,414 million metric
tonnes (mmt) in 2010 against a degrowth
of 8% in 2009 to 1,220 mmt. All major
steel-producing nations witnessed double-
digit growth in 2010. The EU and the USA
witnessed 24.5% and 38.5% growth
respectively, owing to the lower base effect
from 2009 while Asia and the CIS recorded
a relatively lower growth of 11.6% and
11.2% respectively. It is further expected
that in 2011, global steel production will
grow by another 6% to reach 1,441 mmt
(Source: World Steel Association).
Consumption: Global steel consumption
increased 13.2% in 2010 to reach 1,283.29
mmt and is expected to increase 5.9% to
reach 1,359 mmt in 2011. It is anticipated
that in 2012, steel consumption in
developed nations will be 14% below the
2007 level whereas in developing nations it
will be above 38% and will account for 72%
of the global steel demand.
Indian steel industryIndia is the world’s fifth-largest steelmaker
with China as the leader, followed by
Japan, the US and Russia. The country’s
total crude steel production capacity
increased 7.2% from 72.76 mt in 2009-10
to 78 mt in 2010-11. Despite this, the
country’s per capita steel consumption was
only 54 kg (13 kg in rural areas with a
population of 70% of India) compared with
430 kg in China and 187 kg globally. With
favourable regulatory policies, the
government aims to increase disposable
incomes in the hands of the rural masses,
which represents a huge industry
opportunity.
China
430Japan
502US
259Brazil
132Russia
256India
54
Per capita steel consumption in major countries (Kg)
EXCITING INDUSTRYPROSPECTS

19
Production: India’s finished steel
production grew 8.8% to 65.93 million
tonnes (mt) in 2010-11 compared with
60.62 mt in 2009-10, with integrated steel
producers contributing 55% of the total
crude steel production in 2010-11 and
secondary producers 45%. The country
continued to be the world’s largest
producer of direct reduced iron/sponge
iron during January-December 2010. Indian
crude steel production recorded a CAGR of
9.2% with demand elasticity of 1.1 during
2005 and 2009-10.
Consumption: In 2010-11, steel
consumption grew at a healthy 10% from
59.33 mt in 2009-10 to 65.19 mt tonnes in
2010-11, owing to strong demand from the
infrastructure, construction, automobile,
industrial and manufacturing sectors.
Exports: India’s total exports increased
3.3% in 2010-11 to reach 3.35 mt as
compared with 3.25 mt in 2009-10.
Imports: The country’s imports declined
11.4% from 7.38 mt in 2009-10 to 6.54 mt
in 2010-11.
OutlookIt is expected that during January-
December 2011, India’s steel demand will
grow 13.3% to 68.7 mt and by 14.3% to 79
mt in 2012, owing to robust economic
growth, massive infrastructure needs and
industrial production expansion (Source:
World Steel Association). The country
expects to add 30 mt of steel-making
capacity in two years, of which around 10-
15 mt capacity is likely to be added during
2011-12. According to the Ministry of Steel
estimates, India is expected to add around
200 mt of capacity in the next decade,
increasing overall crude steel capacity from
78 mt in 2010-11 to around 280-290 mt by
2020. It is projected that India will emerge
as the world’s second-largest steel
producer by 2015-16.
Growth driversConstruction: India’s construction sector
contributes about 8% to GDP with a
turnover of Rs. 4.4 tn in 2009-10. The
industry grew at an average 9-12% from
2005-06 to 2009-10. The 2010-11 Budget
reduced service tax from 33% of gross sale
value of property to 25% and enhanced
abatement from 67% to 75%, enhancing
industry scope (Source: India Infrastructure
magazine).
Infrastructure: Infrastructure investment is
likely to increase from 5.15% of gross
domestic product (GDP) during the Tenth
Plan (2002-07) to about 7.55% during the
Eleventh Plan (2007-12) and to 9.95% of
GDP in the Twelfth Plan (2012-2017).
Roads and highways: The Twelfth Plan
expects to increase investments in roads
and bridges from USD 70 billion in the
Eleventh Plan to USD 123 billion, with a
private sector contribution of nearly 44%.
Power: The power ministry added 34,462
MW power in the Eleventh Plan and expects
to finish the period with a capacity addition
of 50,000-55,000 MW. The Power Ministry
targets to add 100,000 MW of power
generation capacity in the Twelfth Plan.
Railways: The government expects to
increase the budget outlay from USD 50 bn
in the Eleventh Plan to USD 74 bn in the
Twelfth Plan.
Real estate: According to a report by PwC
and Urban Land Institute, India is the most
viable investment destination in real estate
with residential properties maintaining
their growth momentum. The residential
real estate segment alone accounts for
about 5-6% of the country’s GDP. Despite
this, the country’s housing shortage is
estimated at 26.53 mn homes in the
Eleventh Plan. During 2009-13, the pan-
India demand for office space is estimated
to be 196 million square feet (msf),
retail space – 43 msf and residential
space – 7.5 msf.
Automobile: By 2016, India is likely to
emerge as the world’s seventh-largest car
producer (as compared with the eleventh-
largest currently). The country is also
expected to retain its fourth largest rank in
truck manufacturing. By 2016, the
automotive sector will double its
contribution to the country’s GDP from the
current 5% to 10%. Its contribution to the
manufacturing sector will rise to 30-35%
from the current 17% (Source: SIAM).
20
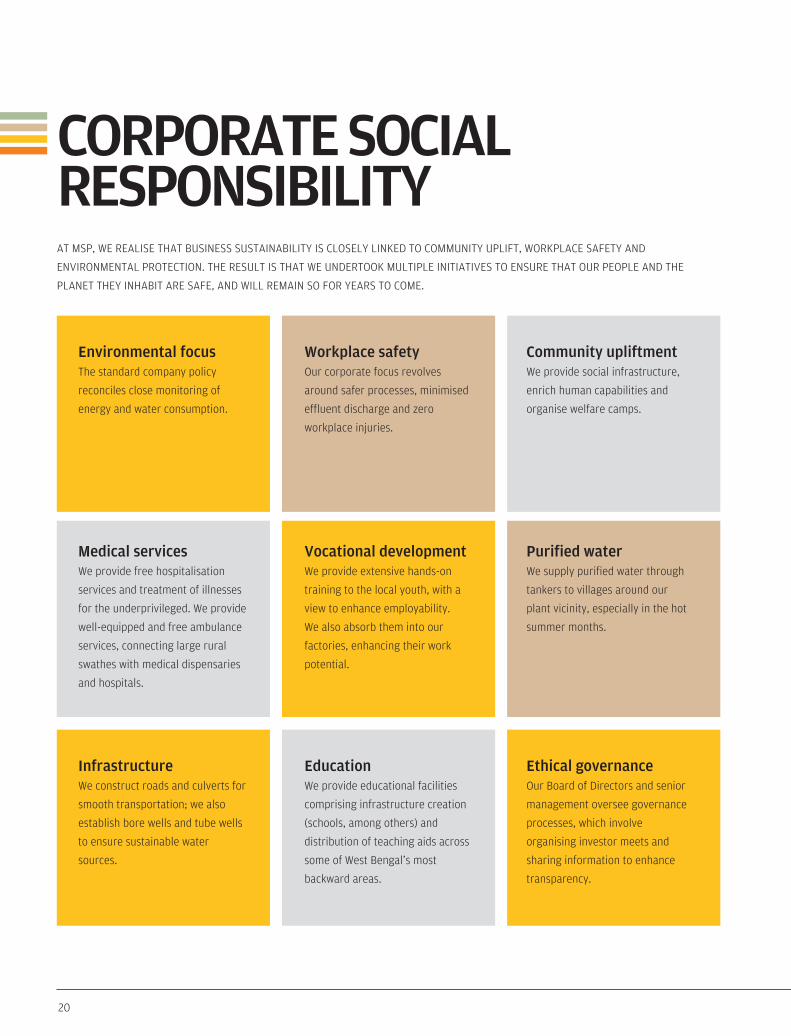
CORPORATE SOCIALRESPONSIBILITY AT MSP, WE REALISE THAT BUSINESS SUSTAINABILITY IS CLOSELY LINKED TO COMMUNITY UPLIFT, WORKPLACE SAFETY AND
ENVIRONMENTAL PROTECTION. THE RESULT IS THAT WE UNDERTOOK MULTIPLE INITIATIVES TO ENSURE THAT OUR PEOPLE AND THE
PLANET THEY INHABIT ARE SAFE, AND WILL REMAIN SO FOR YEARS TO COME.
Environmental focus The standard company policy
reconciles close monitoring of
energy and water consumption.
Workplace safetyOur corporate focus revolves
around safer processes, minimised
effluent discharge and zero
workplace injuries.
Community upliftmentWe provide social infrastructure,
enrich human capabilities and
organise welfare camps.
Medical servicesWe provide free hospitalisation
services and treatment of illnesses
for the underprivileged. We provide
well-equipped and free ambulance
services, connecting large rural
swathes with medical dispensaries
and hospitals.
Vocational developmentWe provide extensive hands-on
training to the local youth, with a
view to enhance employability.
We also absorb them into our
factories, enhancing their work
potential.
Purified waterWe supply purified water through
tankers to villages around our
plant vicinity, especially in the hot
summer months.
InfrastructureWe construct roads and culverts for
smooth transportation; we also
establish bore wells and tube wells
to ensure sustainable water
sources.
EducationWe provide educational facilities
comprising infrastructure creation
(schools, among others) and
distribution of teaching aids across
some of West Bengal’s most
backward areas.
Ethical governanceOur Board of Directors and senior
management oversee governance
processes, which involve
organising investor meets and
sharing information to enhance
transparency.

21
Annual Report 2010-11
MANAGEMENTDISCUSSION ANDANALYSIS REPORT
Business ReviewSteel industry has a major role to play in
India’s economic growth. With new global
acquisitions by Indian steel giants, setting
up of new state-of-the-art steel mills,
modernisation of existing plants, improving
energy efficiency and backward integration
into global raw material sources, India is
now at the centre of the global steel map.
Consumption of steel in the construction
sector, industrial applications, and
transport sector has been on the rise and
special steel usage in engineering
industries such as power generation,
petrochemicals and fertiliser industry is
also growing.
The steel industry in India successfully
came out of the adverse effects of the
global economic slowdown and registered
a positive growth during the previous year.
The National Steel Policy fixed a target of
taking steel production upto 110 MT by
2019-20. Nonetheless, with the current rate
of ongoing green-field and brown-field
projects, the Ministry of Steel has projected
India’s steel capacity to touch 124.06 MT by
2011-12
Road ahead The global steel industry is on recourse to
identify a definite plan to navigate the
current volatility to attain sustained
growth. The Indian steel industry is
whizzing by new milestones every year.
In 2011, global steel makers are hoping for
a more stable rate of recovery in demand.
This will be dependent on whether there is
an increase in consumer spending and
business investment, to compensate for the
potential lessening of government fiscal
stimuli. The future of both the developed
and the developing world will be governed
by different sets of factors. The emerging
markets of China and India will continue to
witness strong growth in their steel
industries owing to robust demand for
construction and civil engineering,
automotive and mechanical engineering.
The growth of developed markets, however
will be more dependent on supply-side
response, innovative product offerings and
substitutions. The key driving factor for the
profitability of all steel players will
ultimately depend on more tightly
managed operating expenses and capital
expenditure.
Performance Review of theCompanyAt MSP Steel, our ability to provide value-
added steel products at competitive prices
helps in incrementally boosting our
revenues on a year-on-year basis. Here's a
brief outline of the product wise
performance:
i) Pellet plant
Pellet production was 1,85,219 MT as
compared with 1,44,643 MT during the
previous year
ii) Sponge Iron plant
The production of sponge iron increased to
1,58,187 MT as compared with 1, 55,851 MT
in the last year.
iii) Power generation
The total power generation is 1,92,995,100
KWH as compared with 1,61,783,321 KWH
during the last year.
iv) Billets
The production of billets is 1,02,326 MT
as against last year’s production of
1,07,579 MT.
v) TMT Bars
The production of TMT Bar was 49,379 MT
as compared with 68,385 MT during
last year.
vi) Structural Rolling Mill
The production of structural steel is
53,196 MT
Opportunities and ThreatsSteel industry plays an important role in
the development of a country. India, a
developing nation, requires huge
contribution from this industry, to expedite
its run to reach new heights in the world
economy. India has large reserves of
22
MSP STEEL & POWER LIMITED
mineral resources, such as, coal, iron ore,
among others and is in a strong position
to mobilise these resources into
productive use. Vast market potential
provides assured market to the industry.
Recovery in Indian economy during 2010-11
gave rise to new investment opportunities
which will increase demand for steel
products.
Last year the Company undertook
comprehensive exercise on reducing costs
and improving quality of the products
which provided a strong edge to the
Company in the market. Steel demand is
increasing and prices also firmed up during
the year under report. The increase in steel
making capacity by the Company will be
absorbed by the increasing demand for
steel products.
Power, iron ore and coal are the three key
raw materials for steel production. The
Company is making all efforts to ensure
their availability considering the proposed
enhancement in the production capacity of
steel.
The Company is increasing captive power
generation capacity for meeting power
requirement of steel plants.
Your Company has, over the years, built a
strong technical and managerial team
who possesses sufficient experience in
setting up big projects and manage them
efficiently. This team is competent enough
to set up steel projects in Raigarh. The
Company is therefore well poised for
further growth and sustainable
development.
There are, however cost factors of
financing which the Company have to
consider while taking strategic decisions.
The upward pressure on inflation
prompted RBI to increase its benchmark
rates. This increased the cost of financing
for working capital requirement.
Additionally, it is also putting pressure on
all the expansion projects. Already the
interest rates for the short-term and
medium-term loans have gone up by 25-50
basis points in the last few months.
Cheaper imports from countries like China
and the Ukraine will make the steel
industry vulnerable. Further lowering of
customs duty on steel products which is
5% at present or further increasing of
excise duty on production of steel products
which was raised from 8% to 10% in the
union budget 2010 could adversely impact
the revenue and profitability of the steel
industry.
OutlookIn 2011, global steelmakers are hoping for
a more stable rate of recovery in demand.
This will be dependent on whether there is
an increase in consumer spending and
business investment, to compensate for
the potential lessening of government
fiscal stimuli.
Owing to the sovereign debt crisis of many
developed countries, there has been a
marked shift from stimuli to austerity.
In addition, the massive rise in oil prices
inspired by political turmoil in the Middle
East, coupled with the recent catastrophic
events in Japan, increases the risks of a
slowdown in growth during 2011.
Global trade is estimated to grow by 5.7%
Power, iron ore andcoal are the three keyraw materials for steelproduction. TheCompany is making allefforts to ensure theiravailabilityconsidering theproposedenhancement in theproduction capacity ofsteel

23
Annual Report 2010-11
The National SteelPolicy fixed a target oftaking steelproduction upto 110MT by 2019-20.Nonetheless, with thecurrent rate ofongoing green-fieldand brown-fieldprojects, the Ministryof Steel has projectedIndia’s steel capacityto touch 124.06 MT by2011-12
in 2011, which is a significant softening
from 2010 when global restocking fuelled
an 11.5 % increase.
The future of both the developed and the
developing world will be governed by
different sets of challenges and issues.
The emerging markets of China and India
will continue to witness strong growth in
their steel industries owing to robust
demand for construction and civil
engineering, automotive and mechanical
engineering. The growth of developed
markets however will be more dependent
on supply-side response, innovative
product offerings and substitutions.
The key driving factor for the profitability
of all steel players will ultimately depend
on more tightly-managed operating
expenses and capital expenditure.
Risk Management andConcernsMSP Steel possesses a comprehensive risk
management system, enabling it to protect
downsides and maximise upturns. The
domestic steel industry carrying inherent
risk in respect of imbalance in
supply/demand apart from price sensitivity
and demand volatility. Slowdown in
implementation of the Greenfield Steel
projects by major steel producers owing to
non-availability of sufficient iron ore, coal
and land, may increase the prevailing
supply demand gap in coming years.
Besides the above, the global market
turmoil, which dented the growth curve of
user industry, may affect the progress of
the steel industry. The Company has been
taking part in continuous modernisation
programmes to maintain efficient
operation of its steel and engineering
activities.
IT security, market risks, financial reporting
risks, exchange risks, contractual
compliance risks, and compliance risks are
the Board Risks under which risks are
monitored and mitigated.
Internal Controls and SystemsThe Company has a proper and adequate
system of internal control commensurate
with the size and nature of its business.
Internal control systems are integral to the
Company’s corporate governance
initiatives.
There is adequate documentation of
policies, guidelines, authorities and
approval procedures covering all important
functions of the Company.
Some of the key features of the internal
control system are as under:
Deployment of an ERP system which
covers most of its operations and is
supported by a defined on-line
authorisation protocol
Ensuring complete compliance with laws,
regulations, standards and internal
procedures and systems
De-risking the Company’s assets/
resources and protecting them from any
loss
Ensuring the integrity of the accounting
system; the proper and authorised
recording and reporting of all transactions
Preparation and monitoring of annual
budgets for all operating and service
functions

24
MSP STEEL & POWER LIMITED
Ensuring reliability of all financial and
operational information
Audit Committee of Board of Directors,
comprising Independent Directors,
regularly reviews audit plans, significant
audit findings, adequacy of internal
controls, and compliance with Accounting
Standards, among others.
A comprehensive Information Security
Policy and continuous update of IT Systems
Financial Management Capital budgeting and subsequent progress
of the projects under implementation are
monitored on a periodic basis by senior
management personnel. Financial funding
for the same is achieved by borrowing from
a consortium of banks at competitive rates
and balance is covered by internal
accruals. During the year, the Company
issued 75,40,000 numbers of 6% non
cumulative non convertible redeemable
preference shares of Rs.10 each with a
premium of Rs.90 per share on private
placement basis.
Trained, experienced and qualified
personnel are manning the Accounts and
Finance department at Kolkata & Factory
establishment of the Company. They
ensure that the established organisational
procedures laid down by the senior
management are followed while recording
the financial transactions and while
presenting the periodic management
reports. Regular audits are conducted to
ensure that the proper controls are in
place.
Financial PerformanceThe Company’s performance during the
year 2010-2011 can be described as one of
consolidation after recovery from the
global economic crisis. This year we got the
benefit of a full year’s working of our
1,28,000 MTPA structural steel plant which
helped in boosting the the Company’s
revenues. The year saw the Company
commissioning two new projects namely 18
MW power plant and 1,15,500 MTPA sponge
iron plant in the second half of the year.
Going forward, the Company expects that
revenues from the newly-commissioned
projects and incremental capacity
utilisations from other existing projects will
improve the revenues and EBITDA margins
in the years to come.
Statutory ComplianceOn obtaining confirmation from the various
units of the Company of having complied
with all the statutory requirements, a
declaration regarding compliance with the
provisions of the various statutes is made
by the Managing Director at each Board
Meeting. The Company Secretary, as
Compliance Officer, ensures compliance
with the SEBI regulations and provisions of
the listing agreements.
Industrial Relations andHuman Management Your Company fully values the human
capital; it deploys and credits its success to
them. It has been the consistent endeavour
of the Company to create a congenial and
challenging workplace atmosphere
wherein every employee can develop his
own strength and deliver to his best.
Industrial relations during the year under
review were cordial and peaceful. Your
Directors wish to place on record the
excellent co-operation and contribution
made by employees at all levels for the
growth and development of the Company.
Cautionary StatementThe Management Discussions and Analysis
describe Company’s projections,
expectations or predictions and are
forward-looking statements within the
meaning of applicable laws and
regulations. Actual results could differ
materially from those expressed or
implied. Important factors that could make
a difference to the Company’s operations
include economic conditions affecting
demand and supply and price conditions in
domestic and international market,
changes in government regulations, tax
regimes, economic developments and
other related and incidental factors.
For and on behalf of the Board
Sd/-
Puranmal Agrawal
Chairman
Place: Kolkata
Date: 30th May, 2011
25
Annual Report 2010-11
DIRECTORS’ REPORT
We are delighted to present the report on our business & operations for the year ended 31st March, 2011
Financial Results(Rs. in lacs)
2010-11 2009-10
Sales (Net of excise) & other income 51,345.03 39,585.38
Profit before depreciation and tax 8,642.90 5,080.26
Less: Depreciation 1,932.90 1,257.35
Profit before tax 6,710.00 3,822.91
Less: Fringe Benefit Tax -- --
Provision for Income Tax (Including earlier years) 337.36 214.65
Provision for Deferred Tax 1,351.54 402.84
Net Profit 5,021.10 3,205.42
Add: Balance brought forward 1,4263.21 11,057.79
Less: Appropriations 691.27 –
Surplus carried to Balance Sheet 18,593.04 14,263.21
Dividend(i) 6% Non-Cumulative redeemable
preference shares: The Board
recommended a proportionate dividend of
sixty paisa per share on 75,40,000 shares.
(ii) Ordinary shares: The Board
recommended a final dividend of fifty paisa
per equity share. The dividend will be
distributed to the members whose names
appear on the register of members as on
the date of Annual General Meeting. The
dividends on preference and ordinary
shares are subject to shareholders’
approval at the Annual General Meeting.
Operational ReviewThe year 2010-11 saw the Company
consolidate its position after a challenging
recovery from the global economic crisis in
the previous year. Increased capacity
utilisation along with better product
realisations ensured that the operating
profit and EBITDA margins witnessed a
remarkable improvement of 311 bps and
403 bps respectively over the previous
year. This upward trend is expected to
continue in 2011-12 and beyond, on account
of incremental revenues kicking in from the
newly commissioned projects in the fourth
quarter of the financial year.

26
MSP STEEL & POWER LIMITED
During the year 2010-11, the Company
commissioned its 18 MW power plant and
1,15,500 MTPA sponge iron plant in January
2011. The Company achieved a net turnover
of Rs. 47,746.94 lacs and profit before tax
of Rs. 6,710.00 lacs. Your Company
recorded net profit after taxes of
Rs. 5,021.10 lacs
The Statutory auditors in their report for
the year ended 31st March 2011, had
considered the income from commodity
transactions as speculative in nature and
have expressed their inability to ascertain
the impact of the same on the tax expense
and networth of the company. On the basis
of expert opinion obtained, your company
has considered the income from
commodity transactions as business
income. The management does not see any
impact of these transactions on the tax
expense and net worth of the company.
The Statutory auditors in the annexure to
the auditors report for the year ended 31st
March 2011, had reported that short term
funds amounting to Rs 2,757.95 lacs in the
form of project creditors have been used
for long term investment towards
acquisition of fixed assets. In this regard,
the management would like to inform that
the company had purchased the fixed
assets on credit basis from the supplier
which could have been paid by way of
taking disbursement of term loan from
banks. Your company has saved interest by
purchasing capital goods on credit basis
hence no short term loan has been utilised
for long term investments.
Projects & Expansion PlansProject commissioned during FY 2010-11
The Company successfully commissioned
its 18 MW-power plant and 115,500-MTPA
sponge iron plant
Project under progress
The Company has enlisted a number of
business-strengthening initiatives
for 2010-11:
We expect to commission the second phase
of 115,000 tonnes Sponge Iron Plant by
April 2012 (financial closure achieved). This
expansion will enhance our total sponge
iron capacity to 4.22 lacs TPA
We expect to commission another 34 MW
(thermal) Power Plant during the financial
year at our Raigarh unit for merchant sales
(financial closure in process).
We expect to commission our coal washery,
to raise our overall capacity by 3,83,625
TPA during the financial year 2011-12.
Further the construction of a 4-km railway
siding reduced transportation costs on
the one hand and eased logistics on the
other.
We expect to commission a 6 lac MTPA
pelletisation plant during the financial year,
which will take our pellet capacity to 9 lac
MTPA from the existing 3 lac MTPA.
Credit RatingThe Company’s rating improved to “BBB+”
for long-term/medium-term debt and
various bank facilities sanctioned and/or
availed by the Company. Facilities with
“CARE BBB+” rating are considered to offer
moderate safety for timely servicing of
debt obligation. Such facilities carry
moderate credit risk.
The Rating Committee reaffirmed the 'PR2'
(PR Two) rating for short-term
debt/facilities sanctioned and/or availed by
the Company. Facilities with this rating will
have an adequate capacity for timely
payment of short- term debt obligation and
carry higher credit risk.
The above rating continues to draw
strength from promoters’ experience,
operational efficiency by virtue of having
an integrated plant, production of value-
added products fetching higher margins,
increasing profit levels and moderate its
financial position.
Corporate GovernanceThe Company complied with Corporate
Governance requirements as stipulated
under Clause 49 of the Equity Listing
Agreement of Stock Exchange and
accordingly, the report on Corporate
Governance forms part of the annual
report. The requisite Certificate from a
Company Secretary in practice regarding
compliance with the conditions of
Corporate Governance as stipulated in
Clause 49 is annexed to this report as also
the Management Discussion and Analysis
which is given as an Annexure to this
report.
Social ObligationYour Company believes that after
customers, human resource is its most
important capital and requires the same
need to be empowered for achieving
objectives from time to time. In this regard,
employees are subjected to periodical
training for skills upliftment and
familiarisation with the latest techniques
and practices, provided with a conducive
working environment and motivated by
extending compensation packages and
benefits, which is the most competitive in
India’s steel industry.
The Company's plants comply with all
norms for a clean and better environment
by the competent authorities. The
Company undertakes regular
checks/inspections including certification

27
Annual Report 2010-11
for the maintenance of the environment,
health and safety. The Company values
environmental protection and safety as a
major consideration in its functioning. The
Company has adequate effluent treatment
plants to prevent pollution. The Company
continuously endeavours to improve the
quality of life in communities surrounding
its industrial complex.
Directors’ ResponsibilityStatement Pursuant to the requirements of Section
217(2AA) of the Companies Act, 1956 your
Directors hereby confirm that:
i) In the preparation of the annual
accounts for the year ended 31st March,
2011, the applicable accounting standards
were followed and no material departures
were made from the same;
ii) The Directors selected such accounting
policies and applied them consistently and
made judgments and estimates that are
reasonable and prudent so as to give a true
and fair view of the Company’s state of the
affairs at the end of the financial year
ended 31st March, 2011 and the Company’s
profits for that period;
iii) The Directors took proper and
sufficient care for the maintenance of
adequate accounting records in accordance
with the provisions of the Companies Act,
1956, for safeguarding the Company’s
assets and for preventing and detecting
frauds and other irregularities;
iv) The Directors prepared the annual
accounts on a going concern basis.
Conservation of Energy,Technology Absorption andForeign Exchange Earningsand OutgoInformation pursuant to Section 217(1)(e) of
the Companies Act, 1956 read with
Companies (Disclosure of Particulars in the
Report of the Board of Directors) Rules,
1988 is annexed and forms a part of this
report.
Particulars of Employees Particulars of remuneration paid in excess
of limits as prescribed under Section
217(2A) of the Companies Act, 1956 read
with Companies (Particulars of Employees)
Rules, 1975 during the year under review is
as follows.
Statement of the employees pursuant to Section 217(2A) of the Companies Act, 1956
Name & Qualification Age in Designation Date of Gross Remuneration Experience Previous
years Employment (Rs. in lacs) (Yrs) Employment
Mr. Puranmal Agrawal 61 Chairman cum 7th June, 2007 36.00 22 –
B. Com- Whole time Director
Mr. Suresh Kumar Agrawal 58 Managing Director 7th June, 2007 30.00 17 –
B.E Mechanical
AuditorsM/s. S.R Batliboi & Co., Chartered
Accountants, retire at the ensuing Annual
General Meeting, and expressed their
willingness to be reappointed.
DirectorsIn accordance with the provisions of the
Companies Act, 1956 and the Company’s
Articles of Association, Mr. Arvind Kumar
Saraf and Mr. Navneet Jagatramka,
Directors of the Company will retire by
rotation at the ensuing AGM and being
eligible, offer themselves for reappointment.
Mr. Debabrata Mukherjee resigned from
Directorship on 3rd May, 2010 and in his
place Mr. Pavan Kumar Gupta has been
appointed as a Director of the Company.
Mr. Niranjan Dash is no longer Director on
the Board of the Company.
AcknowledgementsYour Directors would like to acknowledge
and place on record their sincere
appreciation of all stakeholders,
shareholders, banks, dealers, vendors and
other business partners for the excellent
support received from them during the
year. Your Directors recognise and
appreciate the efforts and hard work of all
the employees of the Company and their
continued contribution to its progress.
For and on behalf of the Board
Sd/-
Puranmal Agrawal
Chairman
Place: Kolkata
Date: 30th May, 2011

28
MSP STEEL & POWER LIMITED
A. Conservation of Energy(a) Energy conservation measures
The Company is always conscious about the
need for energy conservation. continuous
monitoring/optimisation of energy
conservation are undertaken at the plant
level. Main areas of work during the year
included installation of electrical energy
efficient motors for prevention of wastage
of energy, energy savers for lighting and
capacitors.
(b) Additional investments and proposals, if
any, being implemented for reduction of
consumption of energy: Improvement in
the productivity of the induction furnace,
thereby reducing the specific energy
consumption. Waste Heat recovery boilers
are installed for utilising the waste heat
generated from sponge iron kiln to
produce power. Fluidised based boilers
have been installed for utilising coal
rejects/middlings to produce power.
(c) Impact of the measures at (a) and (b)
above have resulted in conservation of
energy.
(d) Total energy consumption and energy
consumption per unit of production as per
Form A of the Annexure is annexed
Technology AbsorptionEfforts made in technology absorption as
per Form B of the Annexure is annexed.
DIRECTORS’ REPORTANNEXURE TO THE
Statement containing particulars pursuant to the Companies (Disclosure of Particulars in the Report of the Board
of Directors) Rules, 1988 and forming part of Directors’ Report for the year ended 31st March, 2011.
Foreign Exchange Earnings and Outgo:Activities relating to exports; initiatives taken to increase exports; development of new export markets for products and services; and export plans–
Total Foreign Exchange used and earned: (Rs. in lacs)
2010-11 2009-10
Foreign Exchange earnings
Export sales 2,022.08 3,142.35
Foreign Exchange Outgo
Import – consumables - (stores) 36.43 11.67
– Capital goods 2,542.19 79.51
– Raw materials 526.89 711.79
Travelling and others 16.15 1.16
Commission – 4.72
Professional fees 12.58 –
FORM ADisclosures Of Particulars With Respect To Conservation Of Energy:
(Rs. in lacs)
2010-11 2009-10
Power and fuel consumption
Purchased
Units in KWH 4,762,500 5,254,500
Total amount (In lacs) 341.63 314.26
Rate/unit (Rs.) 7.17 5.98

29
Annual Report 2010-11
(Rs. in lacs)
2010-11 2009-10
Electricity – own generation
Through Diesel Generator
Units generated (KWH) 15,780 49,521
Total cost (Rs. in lacs) 4.62 11.19
Unit/Ltrs of Diesel (units) 1.43 1.60
Cost/Unit (Rs. in lacs) 29.28 22.60
Through steam turbine generator:
Units generated (KWH) 1,92,995,100 1,61,733,800
Cost/unit (Rs.) 1.95 1.51
Coal and coke :
Quantity (MT) 3,94,556 3,74,310
Total cost (Rs. in lacs) 8,262.21 7,352.84
Cost/unit (Rs.) 2,094.05 1,964.00
[Coal is used in the manufacturing process as reductant]
Consumption per unit (MT) of production
Particulars Unit
a) Electricity
For sponge iron KWH 116 102
For billets/ ingot KWH 921 923
For TMT KWH 101 97
For Pellet KWH 83 72
b) Coal
For sponge iron (MT/KWH) 1.59 1.66
FORM BForm for Disclosure of Particulars with respect to Absorption:
Research and Development
The Company so far not carried out any
major Research & Development work. The
Company shall however undertake R & D
work as and when required to improve the
quality of its products. The Company has
not incurred any expenditure on this
account so far. The Company, however, has
a full-fledged laboratory at its integrated
steel plant for testing the quality of raw
materials and also of the finished products.
Technology Absorption, Adaptation and
Innovation
The Company implemented at its plant in
Raigarh –
Gasifier for structural Rolling Mill and
pellet plant to reduce fuel cost
Dust Injection in ABC kiln to increase
steam generation
For and on behalf of the Board
Sd/-
Puranmal Agrawal
Place: Kolkata Chairman
Date: 30th May, 2011

30
MSP STEEL & POWER LIMITED
CORPORATE GOVERNANCEREPORT ON
[Pursuant to Clause 49 of the Listing Agreement with the Stock Exchanges]
Company’s Philosophy onCorporate GovernanceThe basic philosophy of Corporate
Governance in the Company is to achieve
business excellence and dedication to
increase long term shareholder value,
keeping in view the Company’s
stakeholders’ interest.
The Company is fully committed to the
adoption of best Corporate Governance
practices in the organisation. The Company
firmly believes in the values of trusteeship,
transparency, professionalism and
accountability in all its dealings with
customers, dealers, employees and
shareholders.
Board of DirectorsCompositionThe composition of the Board confirms to
the requirements of the Corporate
Governance code under the Listing
Agreement with the Stock Exchanges.
Fifteen Board Meetings were held during
the financial year 2010-2011 and the gap
between two Board Meetings did not
exceed 4 months. The dates on which
Board Meetings were held : 08th April,
2010, 3rd May, 2010, 29th May, 2010, 28th
June, 2010, 13th August, 2010, 14th
September, 2010, 12th October, 2010, 3rd
November, 2010, 15th November, 2010,
14th December, 2010, 28th December,
2010, 29th December, 2010, 18th January,
2011, 14th February, 2011, 9th March, 2011
The composition of the Board of Directors
as on 31st March, 2011, attendance of Each
Director at board Meeting, Last AGM &
Directorship/Chairmanship of Committee of
each Directors in other Companies are as
under.
Name of Director Category Attendance Directorships in Committee Positions No. of
other Companies in other Companies As shares
Board Meeting Last AGM Chairman Member held
Mr. Puranmal Agrawal C(ED) 15 Yes 13 – – 1,17,000
Mr. Suresh Kumar Agrawal MD(ED) 13 Yes 10 – – 94,000
Mr. Manish Agrawal NED 12 Yes 12 – – 3,04,000
Mr. Saket Agrawal NED 13 No 14 – – 2,04,000
Mr. Amit Mehta NEID 10 No 3 – – –
Mr. Navneet Jagatramka NEID 10 No – – – –
Mr. Arvind Kumar Saraf NEID 13 Yes – – – –
Mr. Debabrata Mukherjee* NEID 1 No – – – –
Mr. Niranjan Dash* NEID 4 No – – – –
Mr. Pavan Kumar Gupta NEID 4 No 5 – – –
Notes:
1. Other directorships include directorships in public companies only.
2. Committee positions in other companies relate to Chairmanships/ Memberships of Audit and Shareholders’ Grievance Committees/Share TransferCommittee only.
3. Mr. Puranmal Agrawal is brother of Mr. Suresh Kumar Agrawal (MD of the Company). Mr. Manish Agrawal is son of Mr. Puranmal Agrawal and Mr. SaketAgrawal is son of Mr. Suresh Kumar Agrawal.
* No longer Directors on the Board of the Company

31
Annual Report 2010-11
C: Chairman, NED: Non-Executive Director,
NEID: Non- Executive Independent Director,
MD: Managing Director
Committees of Directors1) Audit Committee
The scope of the activities of the Audit
Committee is as set out in Clause 49 of the
Listing Agreement with the Stock
Exchanges read with the provision of
Section 292A of the Companies Act, 1956.
The Audit Committee consists of two
Independent Directors and one Non-
Executive Director, having considerable
financial experience and expertise. The
Chairman of the Committee also has
professional accounting qualification.
The brief terms of reference of the Audit
Committee are broadly as follows:
i. To review compliance with internal
control systems
ii. To review the findings of the Internal
Auditor relating to various functions of the
Company.
iii. To hold periodic discussions with the
Statutory Auditors and Internal Auditors of
the Company concerning the accounts of
the Company, internal control systems,
scope of audit and observations of the
Auditors /Internal Auditors
iv. To review the quarterly, half yearly and
annual financial results of the Company
before submission to the Board:
v. To make recommendations to the Board
any matter relating to the financial
management of the Company, including
the Statutory & Internal Audit Reports.
vi. Recommending the appointment of
statutory auditor and the internal auditor
and also fixation of their remuneration.
The Audit Committee met five times during the year i-e on 7th April, 2010, 29th May, 2010, 13th August, 2010, 15th November, 2010 and
14th February, 2011 .The composition and attendance of the members at the Audit Committee Meeting are as follows:
Name Position Held No. of Audit Committee Meetings
Held Attended
Mr. Arvind Kumar Saraf Chairman 5 5
Mr. Navneet Jagatramka Member 5 5
Mr. Saket Agrawal Member 5 5
The Company Secretary acts as the Secretary to the Committee. Statutory Auditors are permanent invitees along-with the Executive Director
who is also invited to join the meeting. The representative of Internal Auditors also attends the meeting.
The Audit Committee reviewed the unaudited quarterly results during the year under review and the annual accounts for the year-ended
31st March 2011 before recommendation of the same to the Board for their approval and adoption.
2) Remuneration Committee
The terms of reference of the Remuneration Committee are as follows:
a) Any fixation/change in remuneration of Whole time Directors/Managing Directors.
b) Any fixation/change in sitting fees payable to Board/Committee members for attending meeting
c) To review the existing remuneration to the executives (GM level and above) and to approve any changes thereof.
d) To approve, in the event of loss or inadequate profit in any year, the minimum remuneration payable to the Managing Director and Whole
time Directors within the limits and subject to the parameters prescribed in schedule XIII of the Companies Act, 1956.
The composition & attendance of the remuneration Committee is
Name Position Held Category No. of Committee Meetings
Held Attended
Mr. Arvind Kumar Saraf Chairman Independent 1 1
Mr.Navneet Jagatramka Member Independent 1 1
Mr. Saket Agrawal Member Non Executive 1 1
Dates on which meeting was held – 20.08.2010

32
MSP STEEL & POWER LIMITED
The attendance of the shareholders’/Investors Grievance Committee is
Name Position Held Category No. of Committee Meetings
Held Attended
Mr. Arvind Kumar Saraf Chairman Independent 1 1
Mr.Manish Agrawal Member Non Executive 1 1
Mr. Saket Agrawal Member Non Executive 1 1
Remuneration to Directors
The Company paid remuneration by way of salary to its Managing Director and Executive Director within the limit specified under Schedule
XIII and approved by the Board and Shareholders of the Company. The remuneration paid to executive Directors during the year-ended 31st
March, 2011.
Name Salary (Rs.) Period of Contract
From To
Mr. Puranmal Agrawal (Chairman) 3,00,000/-per month 09.07.2007 08.07.2012
Mr. Suresh Kumar Agrawal (Managing Director) 2,50,000/-per month 09.07.2007 08.07.2012
During the year no sitting fee is paid to any Non- Executive Director for attending the meeting of the Board of Directors or a Committee thereof.
3) Shareholder & Investors Grievance Committee cum Share Transfer Committee
The shareholders’/Investors Grievance Committee consists of Mr. Arvind Kumar Saraf (Independent Director), Mr. Manish Agrawal and Mr.
Saket Agrawal (Non Executive directors)
The Committee has been constituted to approve transfer of shares, non-receipt of Balance sheet, non-receipt of declared dividends etc.
One meeting of the said Committee held during the year on 12th June, 2010
Miss Pinky Gupta, Company Secretary, is the Compliance Officer of the Company.
The details of complaints received and attended to during the year are given below:
a. No. of complaints received from shareholders : 1
b. No. of complaints not resolved / no actions taken : Nil
c. No. of pending Share Transfers as on 31st March, 2011 : 00
No investor grievance remained unattended/ pending for more than 30 days and no request for share transfers and dematerialization
received during the financial year was pending for more than two weeks.
Details of Previous Annual General Meetings
Sl.No Annual General Meeting Date Venue No. of Special
Resolutions
1 39th Annual General Meeting 24.09.2008 Rotary Sadan, 94/2 Chowringhee Road, 2
Kolkata - 700020
2. 40th Annual General Meeting 24.09.2009 Rotary Sadan, 94/2 Chowringhee Road, 2
Kolkata - 700020
3. 41st Annual General Meeting 29.09.2010 Rotary Sadan, 94/2 Chowringhee Road, –
Kolkata - 700020

33
Annual Report 2010-11
Any special resolution passed during the
last year through postal ballot - details of
voting pattern
Yes
Resolutions passed vide notice dated
November 03, 2010
U/s 81(1A) of the Companies Act, 1956,
for issue of securities to QIB
Raising of funds by issue of preference
share
Increase in authorised share capital of
the company.
All the resolutions were passed with
requisite majority.
Person who conducted the postal ballot
exercise
The Board appointed Ms Swati Bajaj,
Practising Company Secretary, as the
scrutinizer to conduct postal ballot voting
process.
Are votes proposed to be conducted
through postal ballot this year
No such proposal as yet.
Procedure for postal ballotThe Company adheres to the procedure for
postal ballot in accordance with the
provisions of Section 192A of the
Companies Act, 1956 read with the
Companies (Passing of the Resolution by
Postal Ballot) Rules 2001. The Postal Ballot
Notice & accompanying documents were
dispatched to shareholders under
certificate of posting. A calendar of events
along with Board resolution was submitted
to the Registrar of Companies, Kolkata.
DisclosureRelated Party Transactions
The Company has not entered into any
materially significant transactions with its
promoters, Directors or their relatives that
may have conflict with the interests of the
Company at large. The register of contracts
containing the transactions in which the
Directors are interested is placed before
the Board regularly for its approval. The
list of related party transactions as
required to be disclosed is done under
AS-18 and disclosed in Note 18 of Schedule
22 to the Accounts. The Audit Committee
reviews the related party transactions.
Compliances by the Company
No penalties or strictures have been
imposed on the Company by the Stock
Exchanges, SEBI or any statutory authority
on matter related to capital markets,
during the last three years.
Code of ConductA Code of Conduct, as adopted by the
Board of Directors, is applicable to all
directors and Senior Management
Personnel of the Company. This code is
derived from three interlinked fundamental
principles, viz. good corporate governance,
good corporate citizenship and exemplary
personal conduct. A copy of the same is
available on the Company’s website
www.mspsteel.com. All the members of the
Board and Senior Management Personnel
have affirmed compliances of the Code of
Conduct.
Code of Conduct forPrevention of Insider TradingAs per SEBI (prohibition of Insider Trading)
Regulations, 1992, the Company has a code
of conduct for prevention of Insider trading
in the shares of the Company. The Code
inter alia, prohibits purchase/sale of shares
of the Company by employees while in
possession of unpublished price sensitive
information in relation to Company.
Subsidiary CompaniesThe Company has one foreign wholly-
owned subsidiary namely MSP Group
International Singapore (PTE) Limited.
The Management Audit Report of the
subsidiary companies are placed before
and reviewed by the Audit Committee.
Whistle Blower PolicyTransparency forms an integral part of the
Company’s corporate philosophy and
employees are encouraged to be guardians
of the Code of Conduct and Ethics and to
report any variance.
Means of Communication withShareholdersIn compliance with the requirement of the
Listing Agreement the Company published,
quarterly results in the newspapers are
submitted to the Stock Exchanges
immediately after they are taken on record
by the Board and are not sent to individual
shareholders.
The quarterly unaudited results are
generally published in ‘Economic Times,
The Business Standard and Economic
Times’ in English and ‘Kalantar’ in Bengali.
General Shareholder’sInformation1. 42nd Annual General Meeting (AGM)
i. Day, Date and Time:
Monday, 19th September, 2011 at 3 .30 PM
ii. Venue:
Rotary Sadan , 94/2 Chowringhee Road,
Kolkata – 700 020
2. Date of Book Closure:
10th September, 2011 to 19th September,
2011 (both days inclusive)
3. Financial Calendar for 2011-12 :
Financial results for:
First Quarter:
On or before 15th August, 2011
Second Quarter:
On or before 15th November, 2011
Third Quarter:
On or before 15th February, 2012

34
MSP STEEL & POWER LIMITED
Annual Results:
On or before 30th May,2012
4. Dividend Payment:
On or after 19th September 2011, but
within statutory time limit of 30 days
5. Profile of Director seeking
Appointment/Re-Appointment
Details of Director seeking re-appointment
at the ensuing General Meeting as required
under Clause-49 of the Listing Agreement
is given in the Explanatory Statement to
the Notice of the ensuing Annual General
Meeting.
6. Management Discussion & Analysis
Report
A Management Discussion and Analysis
Report are given separately and forms a
part of the Annual report.
7. Listings
The equity shares continue to be listed on
The Bombay Stock Exchange Ltd.(BSE) and
The National Stock Exchange of India Ltd
(NSE). The Company’s code is
NSE- MSPL
BSE- 532650
The Company paid annual listing fee for
2011-12 to The Bombay Stock Exchange
Ltd., Mumbai and the National Stock
Exchange of India Ltd. and annual custody
fee to National Securities Depository Ltd.
and Central Depository Services (India) Ltd.
8. Share Transfer System
Karvy Computer Share Pvt. Ltd, the
Registrars of the Company register the
transfers after the Share Transfer
Committee approves the transfer and
transmission of shares, issue of duplicate
share certificates and allied matters,
subject to the transfer instrument being
valid and complete in all respects. In
compliance with the Listing Agreement, a
Company Secretary in practice audits the
system of share transfer every six months
and a Certificate to that effect is issued.
Payment of dividend throughElectronic Clearing ServiceThe Securities and Exchange Board of India
(SEBI) has made it mandatory for all
companies to use the bank account details
furnished by the depositories for
depositing dividends. As per the recent RBI
guidelines, effective from September 30,
2009, ECS credit will be moved completely
on to the National Electronic Clearance
System (NECS) platform, through the core
banking system. Accordingly, dividend will
be credited to the Members' bank account
through NECS, wherever complete core
banking details are available with the
company. In the event, any branch of a
bank has not migrated to the core banking
system, or where the core banking account
number is not furnished by the Members to
its Depository Participant wherever shares
are held in electronic form or to the
company in case of physical shareholding,
the Company will print the details available
in its records on the dividend warrants to
be issued to the Members. The Company is
in compliance with SEBI's directive in this
regard.
Unclaimed DividendThe Company is required to transfer
dividends which have remained unpaid/
unclaimed for a period of seven years to
the Investor Education & Protection Fund
established by the Government.
The Company will send intimation to
shareholders whose dividend warrants
have not been encashed. Shareholders are
requested to revert to the company if they
have not received/encashed their dividend
warrants.
8. Distribution of Shareholding as on 31st March, 2011
Category No. of shareholders % of holders Shares % of shares
1 - 5000 13069 98.09% 47,09,415 8.11%
5001 - 10000 104 0.78% 7,52,413 1.30%
10001 - 20000 50 0.38% 7,07,016 1.22%
20001 - 30000 23 0.17% 5,78,062 0.99%
30001 - 40000 12 0.09% 4,36,773 0.75%
40001 - 50000 8 0.06% 3,60,363 0.62%
50001 - 100000 14 0.11% 10,20,904 1.76%
100001 and above 43 0.32% 4,95,35,054 85.26%
Total 13323 100.00% 5,81,00,000 100.00%

35
Annual Report 2010-11
9. Shareholding Pattern for the year ended 31st March, 2011
Category Category Wise Total Holding
No. of Shares Held % Of Holding
A Promoters Holding
1 Promoters
- Indian Promoters 4,17,13,500 71.80%
Sub Total: 4,17,13,500 71.80%
B Non-Promoters Holding
2 Institutional Investors
a. Mutual Funds and UTI 0 0.00%
b. Banks, Financial Institutions, Insurance Companies 3,12,470 0.54%
(Central/State Govt. Institutions/ Non-Govt. Institutions)
c. FIIs 3,70,128 0.64%
Sub Total: 6,82,598 1.17%
3 Others
a. Bodies Corporate 90,05,880 15.50%
b. Indian Public 65,02,554 11.19%
c. NRI’s/OCBs 1,40,504 0.24%
d. Any other
- Clearing Members 54,964 0.09%
Sub total: 1,63,86,500 28.20%
Grand Total: 5,81,00,000 100.00%
10. Stock Price Data
Bombay Stock Exchange National Stock Exchange
Month High Price Low Price High Price Low Price(Rs.) (Rs.) (Rs.) (Rs.)
Apr-2010 44.50 36.50 44.55 36.50
May-2010 46.35 33.35 46.25 33.50
Jun-2010 46.15 33.75 46.00 34.00
Jul-2010 45.10 37.15 45.00 38.85
Aug-2010 60.00 39.00 56.00 38.90
Sep-2010 73.95 51.35 80.00 51.45
Oct-2010 74.00 66.90 75.40 67.00
Nov-2010 71.30 50.00 71.90 50.00
Dec-2010 70.00 52.10 69.50 47.10
Jan-2011 70.90 56.05 70.40 56.30
Feb-2011 70.00 54.50 68.45 54.50
Mar-2011 65.95 55.55 66.00 56.15

36
MSP STEEL & POWER LIMITED
11. Depository Registrar and Share Transfer Agent:
M/s, Karvy Computershare Pvt. Ltd
46, Avenue 4, Street No. 1, Banjara Hills, Hyderabad- 500 034
Ph. No.(040) -23312454, 23320251-53, Fax No. (040)-23311968, E-mail: [email protected]
12. Dematerialization of shares
As per SEBI requirement, the Company enlisted its shares with National Securities Depository Limited (NSDL) and Central Depository
Services Limited (CDSL). The Company’s ISIN No. is INE 752G01015
Details of shares held in dematerialized and physical form as on 31st March 2011.
Description No. of share holders No. of shares % of total shares
Shares held in dematerialized form- NSDL 8893 3,31,61,751 57.08
Shares held in dematerialized form- CSDL 4386 24,04,166 4.14
Shares held in physical form 44 2,25,34,083 38.78
Total 13,323 5,81,00,000 100.00
13. Outstanding GDRs/ADRs /Warrants
or any convertible instruments, among
others
The Company has not issued any GDR or
ADR.
14. Plant Location
Village & PO: Jamgaon, Dist: - Raigarh,
Chhattisgarh,
15. Address for Correspondence:
Corporate Office:
16/S Block- A, New Alipore, Kolkata-
700053
Ph No. 23990038/3940/40057777
Fax No. 23982239/40057788
Registered Office:
1, Crooked Lane, Kolkata – 700 069
Ph. No. 22483795, Fax No. 22484138
16. E-mail id for Investor Grievances
Non Mandatory RequirementsChairman of the Board:
During the year under review, no expenses
were incurred in connection with the office
of the chairman.
Remuneration Committee
The Company formed a Remuneration
Committee comprising 2 Independent Non
– Executive Directors and Non Executive
Director as stated in Item No. 2 of
Committees of Directors in this Report.
Audit Qualification
The Auditors observation on the financial
statement is suitably explained in the
report of the Board of Directors.
Other Items
The rest of the non mandatory
requirements such as shareholder’s rights,
training of Board Members, mechanism for
evaluation of Non – Executive Board
Members and Whistle Blower Policy will be
implemented by the Company as and when
required.
For and on behalf of the Board
Chairman
Place: Kolkata
Date: 30th May 2011

37
Annual Report 2010-11
Company Secretary Certificate on Corporate Governance
Declaration on Compliance of the Company’s Code of Conduct
To The Members of
MSP Steel & Power Limited
We have examined the compliance of conditions of Corporate Governance by MSP Steel & Power Limited for the year ended 31st March 2011
as stipulated in Clause 49 of the listing agreement of the said Company with the Stock Exchanges.
The compliance of conditions of Corporate Governance is the responsibility of the management. Our examination was limited to procedures
and implementation thereof adopted by the Company for ensuring the compliance of the conditions of Corporate Governance. It is neither
an audit nor an expression of opinion on the financial statements of the Company.
In our opinion and to the best of our information and according to the explanations given to us, and the representations made by the
directors, and the management, we certify that the Company has complied with the conditions of Corporate Governance as stipulated in the
above-mentioned Listing Agreement.
We further state that such compliance is neither an assurance as to the future viability of the Company nor the efficiency or effectiveness
with which the Management has conducted the affairs of the Company.
For PS Associates
Practising Company Secretaries
(Swati Bajaj)
Place: Kolkata (Partner)
Dated: 30th May 2011 CP No. 3502
All the members of the Board & Senior Management personnel of the Company have affirmed due observance of the code of conduct, framed
pursuant to Clause 49 of the Listing Agreement with Stock Exchanges, in so far as it is applicable to them and there is no non compliance thereof
during the year ended 31.03.2011.
Place: Kolkata Suresh Kr. Agrawal
Dated: 30th May 2011 Managing Director
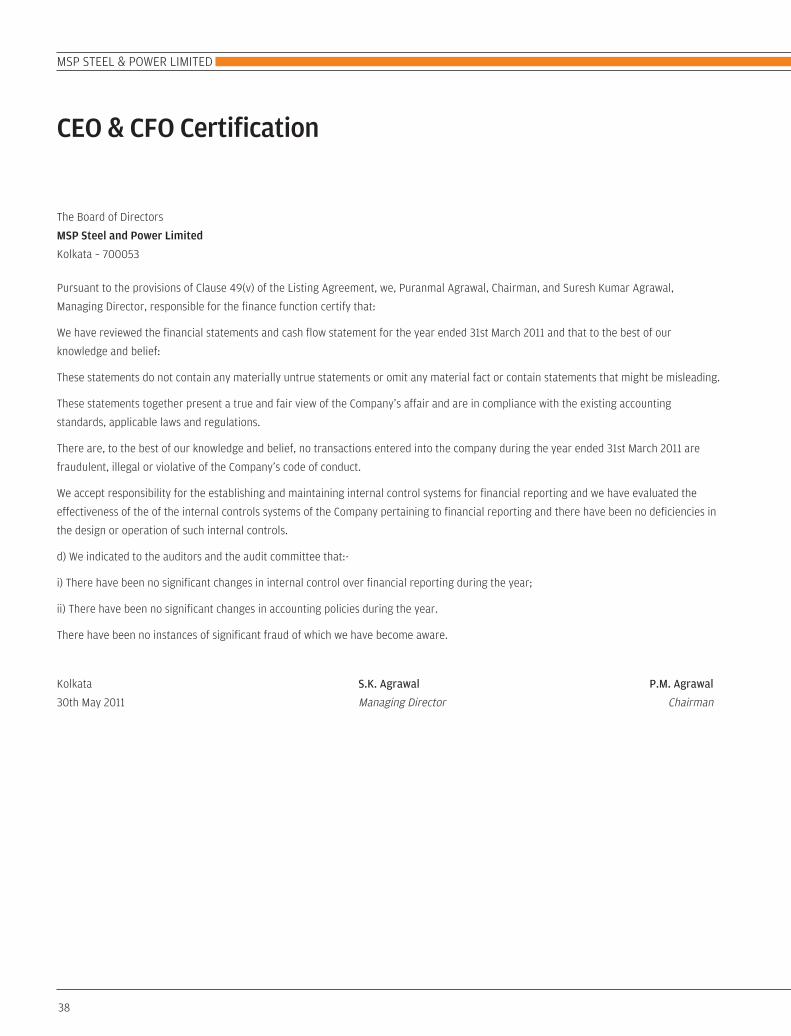
38
MSP STEEL & POWER LIMITED
CEO & CFO Certification
The Board of Directors
MSP Steel and Power Limited
Kolkata – 700053
Pursuant to the provisions of Clause 49(v) of the Listing Agreement, we, Puranmal Agrawal, Chairman, and Suresh Kumar Agrawal,
Managing Director, responsible for the finance function certify that:
We have reviewed the financial statements and cash flow statement for the year ended 31st March 2011 and that to the best of our
knowledge and belief:
These statements do not contain any materially untrue statements or omit any material fact or contain statements that might be misleading.
These statements together present a true and fair view of the Company’s affair and are in compliance with the existing accounting
standards, applicable laws and regulations.
There are, to the best of our knowledge and belief, no transactions entered into the company during the year ended 31st March 2011 are
fraudulent, illegal or violative of the Company’s code of conduct.
We accept responsibility for the establishing and maintaining internal control systems for financial reporting and we have evaluated the
effectiveness of the of the internal controls systems of the Company pertaining to financial reporting and there have been no deficiencies in
the design or operation of such internal controls.
d) We indicated to the auditors and the audit committee that:-
i) There have been no significant changes in internal control over financial reporting during the year;
ii) There have been no significant changes in accounting policies during the year.
There have been no instances of significant fraud of which we have become aware.
Kolkata S.K. Agrawal P.M. Agrawal
30th May 2011 Managing Director Chairman

39
Annual Report 2010-11
Auditors’ Report
To
The Members of
MSP Steel & Power Limited
1. We have audited the attached Balance Sheet of MSP Steel &
Power Limited (‘the Company’) as at 31st March, 2011 and also
the Profit and Loss account and the Cash Flow Statement for the
year ended on that date annexed thereto. These financial
statements are the responsibility of the Company’s management.
Our responsibility is to express an opinion on these financial
statements based on our audit.
2. We conducted our audit in accordance with auditing standards
generally accepted in India. Those Standards require that we plan
and perform the audit to obtain reasonable assurance about
whether the financial statements are free of material
misstatement. An audit includes examining, on a test basis,
evidence supporting the amounts and disclosures in the financial
statements. An audit also includes assessing the accounting
principles used and significant estimates made by the
management, as well as evaluating the overall financial statement
presentation. We believe that our audit provides a reasonable
basis for our opinion.
3. As required by the Companies (Auditor’s Report) Order, 2003
(as amended) issued by the Central Government of India in terms
of sub-section (4A) of Section 227 of the Companies Act, 1956,
we enclose in the Annexure a statement on the matters specified
in paragraphs 4 and 5 of the said Order.
4. Attention is drawn on note 23 on schedule 22 regarding
accounting of gain of Rs. 3,025 lakhs arisen on settlement of
commodity transactions, settled otherwise than through actual
delivery, which is in the nature of speculative income. However
based on a legal opinion obtained, the same has been treated as
income from normal business by the Company. Consequently, we
are unable to comment on the impact of these transactions on the
tax expense and Company’s net worth.
5. Further to our comments in the Annexure referred to above, we
report that :
i. We have obtained all the information and explanations, which
to the best of our knowledge and belief were necessary for
the purposes of our audit;
ii. In our opinion, proper books of account as required by law
have been kept by the Company so far as appears from our
examination of those books;
iii. The Balance Sheet, Profit and Loss Account and Cash Flow
Statement dealt with by this report are in agreement with the
books of account;
iv. Subject to the matter stated in para 4 above, in our opinion,
the Balance Sheet, Profit and Loss Account and Cash Flow
Statement dealt with by this report comply with the
accounting standards referred to in sub-section (3C) of
section 211 of the Companies Act, 1956;
v. On the basis of the written representations received from the
directors, as on 31st March, 2011, and taken on record by the
Board of Directors, we report that none of the directors is
disqualified as on 31st March, 2011 from being appointed as
a director in terms of clause (g) of sub-section (1) of section
274 of the Companies Act, 1956;
vi. Subject to the matter stated in para 4 above the effect of
which is currently not ascertainable, in our opinion and to the
best of our information and according to the explanations
given to us, the said accounts give the information required
by the Companies Act, 1956, in the manner so required and
give a true and fair view in conformity with the accounting
principles generally accepted in India :
a) in the case of Balance Sheet, of the state of affairs of the
Company as at 31st March, 2011;
b) in the case of Profit and Loss Account, of the profit for
the year ended on that date; and
c) in the case of Cash Flow Statement, of the cash flows for
the year ended on that date.
For S.R. Batliboi & Co.
Firm Registration Number : 301003E
Chartered Accountants
per Sanjoy K Gupta
Place : Kolkata Partner
Date : 30th May, 2011 Membership No. 54968

40
MSP STEEL & POWER LIMITED
Annexure to the Auditors’ Report(Referred to in Our report of even date to the members of MSP Steel & Power Limited as at and for the year ended 31st March, 2011)
(i) (a) The Company has maintained proper records showing fullparticulars, including quantitative details and situation offixed assets.
(b) All fixed assets have not been physically verified by themanagement during the year but there is a regularprogramme of verification in a phased manner to coverall the items over a period of three years which, in ouropinion, is reasonable having regard to the size of theCompany and the nature of its assets. As informed, nomaterial discrepancies were noticed on such verification.
(c) There was no substantial disposal of fixed assets duringthe year.
(ii) (a) The management has conducted physical verification ofinventory at reasonable intervals during the year.
(b) The procedures of physical verification of inventoryfollowed by the management are reasonable andadequate in relation to the size of the Company and thenature of its business.
(c) The Company is maintaining proper records of inventoryand as informed, no material discrepancies were noticedon physical verification.
(iii) (a) The Company has granted loans to three companiescovered in the register maintained under section 301 ofthe Companies Act, 1956. The maximum amount involvedduring the year was Rs.8,151.30 lakhs and the year-endbalance of loans granted to such parties was Rs. 231.79lakhs.
(b) In our opinion and according to the information andexplanations given to us, the rate of interest and otherterms and conditions for such loans are not prima facieprejudicial to the interest of the Company.
(c) The above loans are stated to be repayable on demand. Asinformed, the repayment of above loans, to the extentdemanded from the borrowers, during the year had beenreceived by the Company and thus, there has been nodefault on the part of the borrower. The payment ofinterest with respect to such loans is stated to have beenregular.
(d) In view of the above loans being repayable by the partieson demand, there is no overdue amount of loans grantedto such parties.
(e) According to information and explanations given to us,the Company has not taken any loans, secured orunsecured, from companies, firms or other partiescovered in the register maintained under section 301 ofthe Companies Act, 1956. Accordingly, the provisions ofclause 4(iii)(e) to (g) of the Order are not applicable to theCompany and hence not commented upon.
(iv) In our opinion and according to the information andexplanations given to us, there is an adequate internal control
system commensurate with the size of the Company and thenature of its business, for the purchase of inventory and fixedassets and for the sale of goods and services. During the courseof our audit, no major weakness has been noticed in the internalcontrol system in respect of these areas. During the course ofour audit, we have not observed any continuing failure tocorrect major weakness in internal control system of thecompany.
(v) (a) According to the information and explanations providedby the management, we are of the opinion that theparticulars of contracts or arrangements referred to inSection 301 of the Companies Act, 1956 that need to beentered in the register maintained under that section,have been so entered.
(b) In our opinion and according to the information andexplanations given to us, the transactions made inpursuance of such contracts or arrangements exceedingthe value of Rupees five lakhs during the year have beenentered into at prices which are reasonable having regardto the prevailing market prices at the relevant time.
(vi) The Company has not accepted any deposits from the publicwithin the purview of Section 58A and 58AA of the CompaniesAct, 1956 and the rules framed thereunder.
(vii) In our opinion, the Company has an internal audit systemcommensurate with the size and nature of its business.
(viii) We have broadly reviewed the books of account maintained bythe Company pursuant to the rules made by the CentralGovernment for the maintenance of cost records in respect ofthe company’s products under section 209(1)(d) of theCompanies Act, 1956, and are of the opinion that prima facie,the prescribed accounts and records have been maintained.
(ix) (a) The Company has been generally regular in depositingundisputed statutory dues including provident fund,investor education and protection fund, income-tax, sales-tax, service tax, customs duty, excise duty, cess and otherstatutory dues with the appropriate authorities thoughthere has been slight delay in some cases. The provisionsrelating to employees state insurance are not applicableto the Company. During the year, there was no duespayable by the Company in respect of wealth tax.
Further, since the Central Government has till date notprescribed the amount of cess payable under section 441A of the Companies Act, 1956, we are not in a position tocomment upon the regularity or otherwise of the companyin depositing the same.
(b) According to the information and explanations given tous, the Company did not have any undisputed dues inrespect of provident fund, investor education andprotection fund, employees’ state insurance, income-tax,wealth-tax, service tax, sales-tax, customs duty, exciseduty, cess and other statutory dues which were

41
Annual Report 2010-11
(x) The Company has no accumulated losses at the end of the financialyear and it has not incurred cash losses in the current andimmediately preceeding financial year.
(xi) Based on our audit procedures and as per the information andexplanations given by the management, we are of the opinion thatthe Company has not defaulted in repayment of dues to financialinstitutions or banks. The Company did not have any outstandingdebentures during the year.
(xii) According to the information and explanations given to us and basedon the documents and records produced to us, the Company has notgranted loans and advances on the basis of security by way of pledgeof shares, debentures and other securities.
(xiii) In our opinion, the Company is not a chit fund or a nidhi / mutualbenefit fund / society and therefore, the provisions of clause 4(xiii)of the Order are not applicable.
(xiv) In our opinion, the Company is not dealing or trading in shares,securities, debentures and other investments. Accordingly, theprovisions of clause 4(xiv) of the Order are not applicable.
(xv) According to the information and explanations given to us, theCompany has given guarantee of Rs.660.75.lakhs for loans taken / tobe taken by another Company from banks or financial institutions,the terms and conditions whereof, in our opinion, based on themanagement representation and considering the joint venturerelation with such party, are not prima-facie prejudicial to the interestof the Company.
(xvi) Based on the information and explanations given to us by the
management, term loans were applied for the purpose for whichthese were obtained
(xvii) According to the information and explanations given to us and on anoverall examination of the Balance Sheet of the Company, we reportthat short term funds amounting to Rs 2,757.95 lakhs in the form ofproject creditors have been used for long term investment towardsacquisition of fixed assets
(xviii) The Company has not made any preferential allotment of sharesduring the year to parties or companies covered in the registermaintained under section 301 of the Companies Act, 1956.
(xix) The company did not have any outstanding debentures during theyear.
(xx) The Company has not raised any money through a public issue duringthe year.
(xxi) Based upon the audit procedures performed for the purpose ofreporting the true and fair view of the financial statements and asper the information and explanations given by the management, wereport that no fraud on or by the Company has been noticed orreported during the course of our audit.
For S.R. Batliboi & Co. Firm Registration Number : 301003E
Chartered Accountants
per Sanjoy K GuptaPlace : Kolkata Partner Date : 30th May, 2011 Membership No. 54968
outstanding, at the year end for a period of more than six months from the date they became payable except as follows:-
Name of the statute Nature of the dues Amount Period to which Due Date Date of (Rs. in lacs) the amount relates Payment
Entry Tax Act Entry tax on 277.52 April’09-September’10 At the end of respective Not Yet(Chhattisgarh), 1976 purchase of materials subsequent month Paid
(c) According to the records of the Company, dues outstanding in respect of income tax, sales tax, wealth-tax, service tax, custom duty,
excise duty, cess etc. which has not been deposited on account of any dispute are as follows :
Name of the statute Nature of the dues Amount Period to which Forum where (Rs. in lacs) the amount relates dispute is pending
Central Sales Tax Non Collection of 61.28 2004-05, 2005-06 Appellate Deputy Commissioner, Act, 1956 “C” Form 2006-07 Commercial Tax
West Bengal value Disallowance of VAT 10.39 2007-08 Joint Commissioner Added Tax Act, 2003 credit of Sales Tax, Kolkata
Central Excise Disputed Duty on 147.44 2009-11 Commissioner, Act, 1944 Finished Goods Central Excise & Customs
Central Excise Disputed disallowances of 22.08 2006-07 CESTAT, New DelhiAct, 1944 CENVAT credit and service tax
Central Excise Disputed disallowances of 723.14 2008-11 Commissioner CentralAct, 1944 CENVAT credit and service tax Excise & Customs
Central Excise Act, 1944 Removal of Finished Goods 56.19 2006-07 CESTAT, New Delhiwithout payment of duty
Central Excise Act, 1944 Sale of Electricity without 131.90 2010-11 Commissioner Central Excise & Customspayment of duty
Central Excise Act, 1944 Sale of iron ore & coal fines 310.60 2004-11 Commissioner Central Excise & Customswithout payment of duty
Income tax Act, 1961 Tax on disputed disallowances 3.23 2005-06 Income Tax Appellate Tribunal

42
MSP STEEL & POWER LIMITED
Balance Sheet As at 31st March, 2011
The schedules referred to above form an integral part of the Balance Sheet.
As per our Report of even date
For S. R. Batliboi & Co. For and on behalf of Board of DirectorsFirm Registration No.- 301003EChartered Accountants
per Sanjoy K. Gupta Puranmal Agrawal Suresh Kumar AgrawalPartner Chairman Managing DirectorMembership No 54968
22, Camac Street, Block C, 3rd FloorKolkata -700 016 Pinky GuptaDate : 30th May, 2011 Company Secretary
(Rs. in lacs)
Schedules As at As at31st March, 2011 31st March, 2010
SOURCES OF FUNDSShareholders' FundShare Capital 1 6,564.00 5,810.00 Preference Share Application Money [Pending allotment] – 2,220.00 (Refer Note No. 4 on Schedule 22)Reserves & Surplus 2 25,434.63 14,318.80
31,998.63 22,348.80Loan FundsSecured Loans 3 64,048.35 42,474.42 Unsecured Loans 4 6,499.37 3,632.71
70,547.72 46,107.13 Deferred Tax Liability (Net) (Refer Note No. 11 on Schedule 22 ) 3,337.34 1,985.79 Total 105,883.69 70,441.72 APPLICATION OF FUNDSFixed AssetsGross Block 5 55,557.28 29,222.25 Less : Accumulated Depreciation 5,566.52 3,633.62 Net Block 49,990.76 25,588.63 Capital work in Progress 6 31,091.43 22,217.42 Pre-operative and Trial Run Expenses (pending allocation) 7 3,097.36 2,323.55
84,179.55 50,129.60 Investments 8 695.01 4,495.42 Current Assets, Loans and Advances Inventories 9 12,085.47 6,834.01 Sundry Debtors 10 4,040.40 6,683.72 Cash and Bank Balances 11 1,033.49 3,787.00 Loans and Advances 12 11,736.39 5,413.54 Other Current Assets 13 9.67 6.39
(A) 28,905.42 22,724.66Less:Current Liabilities and Provisions 14Current Liabilities 6,702.86 6,423.32 Provisions 1,193.43 484.64
(B) 7,896.29 6,907.96 Net Current Assets (A-B) 21,009.13 15,816.70 Total 105,883.69 70,441.72 Significant Accounting Policies and Notes on Accounts 22

43
Annual Report 2010-11
The schedules referred to above form an integral part of the Profit and Loss Account.
As per our Report of even date
For S. R. Batliboi & Co. For and on behalf of Board of DirectorsFirm Registration No.- 301003EChartered Accountants
per Sanjoy K. Gupta Puranmal Agrawal Suresh Kumar AgrawalPartner Chairman Managing DirectorMembership No 54968
22, Camac Street, Block C, 3rd FloorKolkata -700 016 Pinky GuptaDate : 30th May, 2011 Company Secretary
(Rs. in lacs)
Schedules 2010-11 2009-10
INCOMETurnover (Gross) 15 51,789.50 41,427.80 Less: Excise Duty 4,042.56 2,553.32 Net Sales 47,746.94 38,874.48 Other Income 16 3,598.09 710.90
51,345.03 39,585.38 EXPENDITURE(Increase)/Decrease in Inventories 17 (3,835.57) (794.52)Excise Duty and Cess on Inventories 207.46 80.24 (Refer Note No. 15 on Schedule 22)Raw Materials Consumed 18 31,657.18 23,091.14 Purchase of Trading Goods 3,491.33 3,817.19 Personnel Cost 19 1,533.72 1,193.84 Manufacturing, Selling & Administrative Expenses 20 7,285.67 5,046.17 Prior Period Expenses [Net of Prior Period Income Rs.0.06 lacs (Rs.6.69 lacs)] 15.72 30.63 Interest & Finance Charges 21 2,346.62 2,040.43 Depreciation 1,932.90 1,257.35
44,635.03 35,762.47 Profit before Taxes 6,710.00 3,822.91 Provision For Taxes:– Current Tax [Minimum Alternate Tax (MAT)] 1,392.89 685.13Less: MAT Credit Entitlement (Refer Note No. 10 on Schedule 22) 1,055.53 337.36 472.84 212.29
– Income Tax for earlier years – 2.36 – Deferred Tax charge 1,351.54 402.84 Profit After Taxes 5,021.10 3,205.42 Balance brought forward from previous year 14,263.21 11,057.79 Profit available for appropriation 19,284.31 14,263.21 Appropriations :Dividend Paid for the year 2009-10 (Refer Note no. 24 Schedule 22) 290.50 –Dividend distribution tax on above 49.37 –Proposed Dividend for the year 2010-11– On equity shares 290.50 –– On 6% non cumulative preference shares 10.85 –Dividend distribution tax on above 50.05 –Balance carried to the Balance Sheet 18,593.04 14,263.21 Earnings per equity share [Nominal value of shares - Rs 10/-]– Basic and Diluted (Rs) (Refer Note No. 13 on Schedule 22) 8.62 5.52 Significant Accounting Policies and Notes on Accounts 22
Profit and Loss Account For the year ended 31st March, 2011

44
MSP STEEL & POWER LIMITED
As per our Report of even date
For S. R. Batliboi & Co. For and on behalf of Board of DirectorsFirm Registration No.- 301003EChartered Accountants
per Sanjoy K. Gupta Puranmal Agrawal Suresh Kumar AgrawalPartner Chairman Managing DirectorMembership No 54968
22, Camac Street, Block C, 3rd FloorKolkata -700 016 Pinky GuptaDate : 30th May, 2011 Company Secretary
(Rs. in lacs)2010-11 2009-10
A. CASH FLOW FROM OPERATING ACTIVITIES:Net Profit before taxes 6,710.00 3,822.91 Adjustments for :Depreciation 1,932.90 1,257.35 Unrealised Loss on Foreign Exchange Fluctuation/Forward 23.72 8.90 Irrecoverable Debts, Deposits and Advances written off 46.72 74.08 Provision for bad & doubtful debts/advances 49.80 98.74 Liabilities no longer required written back (81.74) (61.18)Loss on sale of fixed assets – 0.90 Interest on loans, deposits etc. (383.68) (68.57)Interest Expenses 2,260.43 1,945.57 Dividend Income (2.27) (1.06)Operating Profit before working capital changes 3,845.88 3,254.73 Movement in Working Capital for:(Increase)/Decrease in Sundry Debtors 2,546.80 (2,611.11)(Increase)/Decrease in Loans & Advances (4,968.89) (782.83)(Increase)/Decrease in Inventories (5,251.47) (2,900.25)Increase/(Decrease) in Current Liabilities & Provisions (1,512.56) 4,339.09 Cash generated from Operations (5,340.24) 1,299.63 Direct Taxes Paid 1,113.55 525.92 Net Cash generated from Operating Activities 256.21 4,596.62
B. CASH FLOW FROM INVESTING ACTIVITIESPurchase of Fixed Assets [including Pre-Operative and Trial Run Expenses (Pending allocation)] (34,112.74) (16,415.17)Investment in Joint venture (42.52) 1.80 Purchase of Investments – (7,523.55)Sale of Investments 3,800.41 3,700.92 Fixed Deposits (with maturity period of more than three months) (146.74) – Interest received 124.49 67.18 Dividends received 2.27 1.06 Net cash used in investing activities (30,374.83) (20,167.76)
C. CASH FLOW FROM FINANCING ACTIVITIESApplication money towards preference Shares – 2,220.00 Dividend and dividend distribution tax paid (339.87) – Proceeds from issue of Preference Shares 5,320.00 – Deferred payment credit received 4,014.23 Long Term Borrowings Received 22,850.05 16,488.80 Long Term Borrowings Repaid (4,049.05) (7,636.92)Short Term Borrowings Received / (paid) (Net) (3,573.94) 6,798.80 Cash credit and working capital received (Net) 5,199.29 3,187.20 Interest Paid (2,202.34) (3,664.78)Net cash generated in financing activities 27,218.37 – 17,393.10 Net (Decrease)/Increase in Cash & Cash equivalents (A+B+C) (2,900.25) 1,821.96 Cash & Cash equivalents as at the beginning of the year 3,704.12 1,882.16 Cash & Cash equivalents as at the end of the year * 803.87 3,704.12 * Components of Cash & Cash equivalents Cash-on-hand 473.95 313.51 With Scheduled Banks on Current Account 317.76 3,390.61 Fixed Deposits with original maturity period being three months or less) 12.16 –
803.87 3,704.12Cash and Bank balances as per schedule - 11 1,033.49 3787.00Less : Fixed Deposits not considered as cash equivalent 229.62 82.88Cash & Cash equivalents in cash flow statement 803.87 3,704.12
Cash Flow Statement For the year ended 31st March, 2011

45
Annual Report 2010-11
Schedules forming part of the Balance Sheet (Rs. in lacs)
As at As at31st March, 2011 31st March, 2010
Authorised
8,20,00,000 (6,00,00,000) equity shares of Rs. 10/- each (Rs. 10/-) 8,200.00 6,000.00
1,50,00,000 (1,50,00,000) 6% non cumulative redeemable
preference shares of Rs. 10/- each (Rs. 10/-) 1,500.00 1,500.00
9,700.00 7,500.00
Issued, Subscribed & Paid-Up
5,81,00,000 Equity Shares of Rs. 10/- each, fully paid up 5,810.00 5,810.00
Of the Above:
a) 71,800 Equity shares of Rs 10/- each were alloted as fully
paid up for consideration other than cash.
b) 47,54,300 Equity shares of Rs 10/- each were alloted as fully
paid bonus shares by capitalisation of securities premium.
7,540,000 (Nil) 6% non cumulative redeemable preference
shares of Rs 10 each, fully paid up 754.00 –
(Redeemable within 20 years from the date of allotment at a price
to be decided by the Board of Directors at the time of redemption) 6,564.00 5,810.00
Securities Premium Account
As per last Account 55.59 55.59
Add : Received during the year 6,786.00 6,841.59 – 55.59
Profit & Loss Account Balance 18,593.04 14,263.21
25,434.63 14,318.80
SCHEDULE 1 SHARE CAPITAL
SCHEDULE 2 RESERVES & SURPLUS
(Refer Note No. 6 on Schedule 22)
From Scheduled Banks
Term Loans 46,763.03 30,398.82
Cash Credit and Working Capital Facilities 17,179.33 11,980.04
Deferred Payment Credits under Hire Purchase 61.64 63.74
From Bodies Corporate
Deferred Payment Credits under Hire Purchase 44.35 31.82
64,048.35 42,474.42
SCHEDULE 3 SECURED LOANS
Inter corporate deposit from Bodies Corporate 2,485.14 3,632.71
[Due within One Year Rs. 1,385.00 lacs (Rs. 2,022.80 lacs)]
Deferred payment credits [Due within One Year Rs. Nil (Nil)] 4,014.23 –
6,499.37 3,632.71
SCHEDULE 4 UNSECURED LOANS

46
MSP STEEL & POWER LIMITED
Sche
dule
s fo
rmin
g pa
rt o
f the
Bal
ance
She
etSC
HED
ULE
5FI
XED
ASS
ETS
(Rs.
in la
cs)
Des
crip
tion
G
ross
Blo
ck (a
t cos
t)
Dep
reci
atio
n N
et B
lock
As
at
Add
itio
nsD
elet
ion/
As
at
As
at
For
the
Less
: On
As
atA
s at
As
at
1st A
pril
A
djus
tmen
t 31
st M
arch
1s
t Apr
ilye
arD
elet
ion/
31st
Mar
ch31
st M
arch
31st
Mar
ch
2010
2011
2010
A
djus
tmen
t20
11
2011
2010
Free
hold
Lan
d 79
7.35
13
1.83
–
92
9.18
(b
) –
–
–
–
92
9.18
79
7.35
Fact
ory
Build
ing
3,35
3.10
2,
667.
44
–
6,02
0.54
31
1.86
14
5.85
–
45
7.71
5,
562.
83
3,04
1.24
Oth
er B
uild
ing
143.
13
992.
78
–
1,13
5.91
10
.37
6.17
–
16
.54
1,11
9.37
13
2.76
Plan
t & M
achi
nery
24
,435
.53
22,3
85.4
0 –
46
,820
.93
3,14
7.34
1,
730.
62
–
4,87
7.96
41
,942
.97
21,2
88.1
9
Vehi
cles
42
7.18
12
9.10
–
55
6.28
14
8.56
46
.43
–
194.
99
361.
29
278.
62
Furn
iture
& F
ixtu
re
65.9
6 28
.48
–
94.4
4 15
.49
3.83
–
19
.32
75.1
2 50
.47
Tota
l 29
,222
.25
26,3
35.0
3 (c
) –
55
,557
.28
3,63
3.62
1,
932.
90
(a)
–
5,56
6.52
49
,990
.76
25,5
88.6
3
Prev
ious
Yea
r25
,089
.06
4,13
7.44
4.
25
29,2
22.2
5 2,
361.
46
1,27
3.71
1.
55
3,63
3.62
25
,588
.63
22,7
27.6
0
Not
es :
a) I
nclu
des
Rs. N
il (R
s.16
.36
lacs
) tra
nsfe
rred
to P
re-o
pera
tive
& T
rial
Run
Exp
ense
s (p
endi
ng a
lloca
tion)
b) I
nclu
des
Rs. 1
0.86
lacs
(Rs.
10.
86 la
cs),
bein
g th
e co
st o
f lan
d w
hich
is y
et to
be
regi
ster
ed in
the
nam
e of
the
Com
pany
.
c) I
nclu
des
Rs. 4
,356
.74
lacs
(Rs.
499
.72
lacs
) cap
italis
ed fr
om P
re-o
pera
tive
& T
rial
Run
Exp
ense
(pen
ding
allo
catio
n)
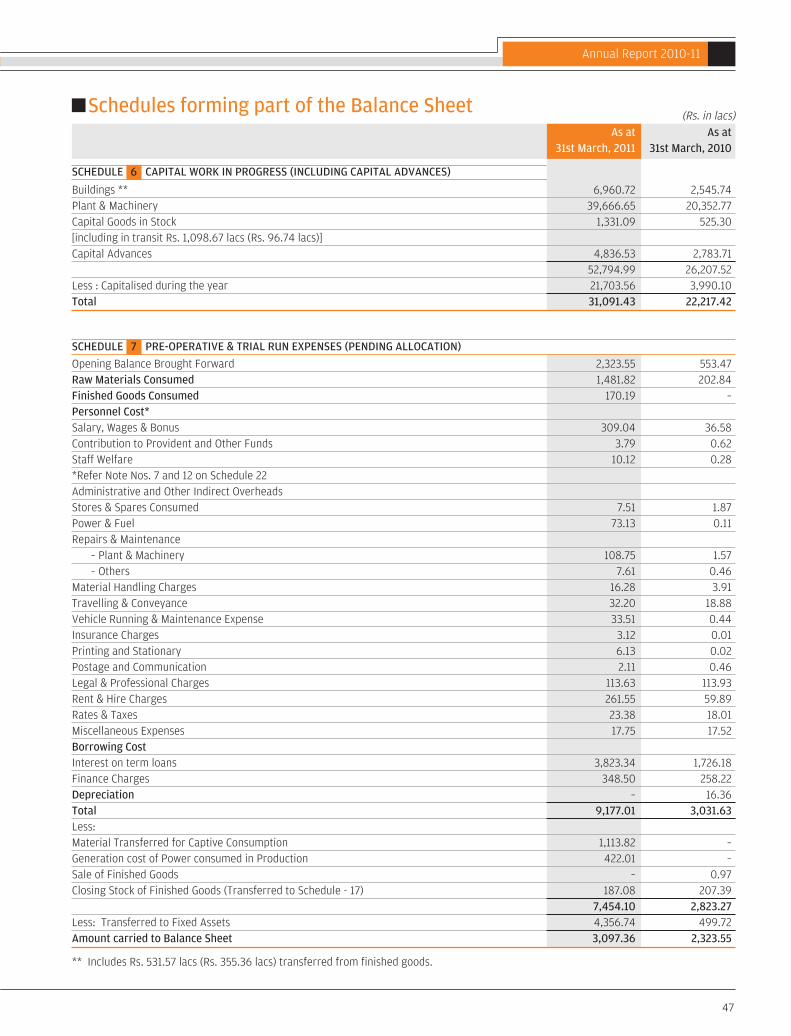
47
Annual Report 2010-11
SCHEDULE 7 PRE-OPERATIVE & TRIAL RUN EXPENSES (PENDING ALLOCATION)
Schedules forming part of the Balance Sheet
SCHEDULE 6 CAPITAL WORK IN PROGRESS (INCLUDING CAPITAL ADVANCES)
As at As at31st March, 2011 31st March, 2010
Buildings ** 6,960.72 2,545.74 Plant & Machinery 39,666.65 20,352.77 Capital Goods in Stock 1,331.09 525.30 [including in transit Rs. 1,098.67 lacs (Rs. 96.74 lacs)]Capital Advances 4,836.53 2,783.71
52,794.99 26,207.52 Less : Capitalised during the year 21,703.56 3,990.10 Total 31,091.43 22,217.42
Opening Balance Brought Forward 2,323.55 553.47 Raw Materials Consumed 1,481.82 202.84 Finished Goods Consumed 170.19 – Personnel Cost*Salary, Wages & Bonus 309.04 36.58 Contribution to Provident and Other Funds 3.79 0.62 Staff Welfare 10.12 0.28 *Refer Note Nos. 7 and 12 on Schedule 22Administrative and Other Indirect OverheadsStores & Spares Consumed 7.51 1.87 Power & Fuel 73.13 0.11 Repairs & Maintenance
– Plant & Machinery 108.75 1.57 – Others 7.61 0.46
Material Handling Charges 16.28 3.91 Travelling & Conveyance 32.20 18.88 Vehicle Running & Maintenance Expense 33.51 0.44 Insurance Charges 3.12 0.01 Printing and Stationary 6.13 0.02 Postage and Communication 2.11 0.46 Legal & Professional Charges 113.63 113.93 Rent & Hire Charges 261.55 59.89 Rates & Taxes 23.38 18.01 Miscellaneous Expenses 17.75 17.52 Borrowing CostInterest on term loans 3,823.34 1,726.18 Finance Charges 348.50 258.22 Depreciation – 16.36 Total 9,177.01 3,031.63 Less:Material Transferred for Captive Consumption 1,113.82 – Generation cost of Power consumed in Production 422.01 – Sale of Finished Goods – 0.97 Closing Stock of Finished Goods (Transferred to Schedule - 17) 187.08 207.39
7,454.10 2,823.27 Less: Transferred to Fixed Assets 4,356.74 499.72 Amount carried to Balance Sheet 3,097.36 2,323.55
** Includes Rs. 531.57 lacs (Rs. 355.36 lacs) transferred from finished goods.
(Rs. in lacs)

48
MSP STEEL & POWER LIMITED
Schedules forming part of the Balance Sheet
SCHEDULE 8 INVESTMENTS
Numbers of Face value per As at As atShares (Units) share (Rs.) 31st March, 2011 31st March, 2010
A. LONG TERM, Equity Shares fully paid up (at Cost)
Trade-unquoted
(i) In Subsidiary Company
MSP Group International (Singapore) Pte. Ltd. 1,000 S$ 1 0.33 0.33
0.33 0.33
(ii) In Joint Venture
Madanpur South Coal Company Limited # 135,874 10 171.59 171.59
Other than trade - 171.59 171.59
Unquoted
(iii) In Others
MSP Metallics Limited 420,000 10 402.00 402.00
MSP Properties (I) Private Limited 7,500 10 0.75 0.75
MSP Sponge Iron Limited 313,000 10 49.50 49.50
MSP Cement Limited 8,000 10 0.80 0.80
MSP Power Limited 8,000 10 0.80 0.80
Shree Sai Sharddha Metallics Private Limited 50,000 10 50.00 50.00
503.85 503.85
Quoted
(iv) In Others
Howrah Gases Limited 93,700 10 15.91 15.91
Ashirwad Steel & Industries Limited 2,500 10 0.25 0.25
Nageshwar Investment Limited 11,000 10 0.61 0.61
Indian Overseas Bank 2,900 10 0.70 0.70
IDFC Limited 5,201 10 1.77 1.77
19.24 19.24
B. CURRENT INVESTMENTS, Units of Mutual Funds
(Quoted, other than trade)
(at lower of cost and market value)
In SBI Magnum Insta Cash Fund Daily Dividend Option – 10 – 3,800.41
(22,688,612)
– 3,800.41
Total 695.01 4,495.42
* Includes 2,000 Shares held in the name of a director on behalf of the Company.
# 66,960 Shares pledged with IDBI Bank Limited for guarantee given on behalf of the investee Company
(Rs. in lacs)
(Rs. in lacs) (Rs. in lacs)As at As at
31st March, 2011 31st March, 2010
Cost Market Cost Market
Value Value
Aggregate Value of investments - – Quoted 19.24 28.65 3819.65 3827.90
– Unquoted 675.77 – 675.77 –
Total 695.01 – 4495.42 –
There are no investments that have been purchased as well as sold during the year.

49
Annual Report 2010-11
SCHEDULE 10 SUNDRY DEBTORS (Unsecured)
Schedules forming part of the Balance Sheet
SCHEDULE 9 INVENTORIES
As at As at31st March, 2011 31st March, 2010
At lower of cost and net realisable valueStores & Spares 906.08 766.21 [including in transit Rs 96.31 lacs (Rs. 23.67 lacs)]Raw Materials 5,224.60 3,433.91[including in transit Rs 733.42 lacs (Rs. 251.74 lacs)] Goods under process 845.16 226.79Finished Goods 3,918.70 1,600.74By Products (at net realisable value) 1,190.93 806.36
12,085.47 6,834.01
Debts outstanding for a period exceeding six monthsConsidered good 720.05 544.68Considered doubtful 164.12 114.32
Other DebtsConsidered good 3,320.35 6,139.04
4,204.52 6,798.04Less: Provision for Doubtful Debts 164.12 114.32
4,040.40 6,683.72
(Refer Note No. 8 on Schedule 22)
(Rs. in lacs)
SCHEDULE 11 CASH AND BANK BALANCES
Cash on Hand 473.95 313.51[including cheques on hand Rs 369.77 (Rs. 100.00 lacs)]Balances with Scheduled Banks on:
Current Accounts 317.76 3,390.61Fixed Deposit Accounts 241.78 82.88 [Receipts for Rs 236.51 lacs (Rs. 79.46 lacs) pledged with banks as margin against loans/guarantee issued by them and Rs 5.27 lacs (Rs. 3.42 lacs) lodged with other parties]
1,033.49 3,787.00
SCHEDULE 12 LOANS & ADVANCES (Unsecured)
Considered Good
Loans
To Subsidiary Company 8.33 4.58
To Others [Including to staff Rs. 18.62 lacs (Rs. 21.30 lacs)] 3,886.00 188.42
Advances recoverable in cash or in kind or for value to be received 3,982.16 2,605.70
[Including to staff Rs. 10.36 lacs (Rs.13.78 lacs)]
57.21 35.92
Balance with Central Excise & Sales Tax Authorities 1,735.30 1,610.38
MAT Credit Entitlement 1,915.88 860.35
Security & Other Deposits 108.99 108.19
Share Application Money 42.52 –
Considered Doubtful
Advances recoverable in cash or in kind or for value to be received 19.40 19.40
11,755.79 5,432.94
Less: Provision for Doubtful Advances (Refer Note No. 9 on Schedule 22) 19.40 19.40
11,736.39 5,413.54
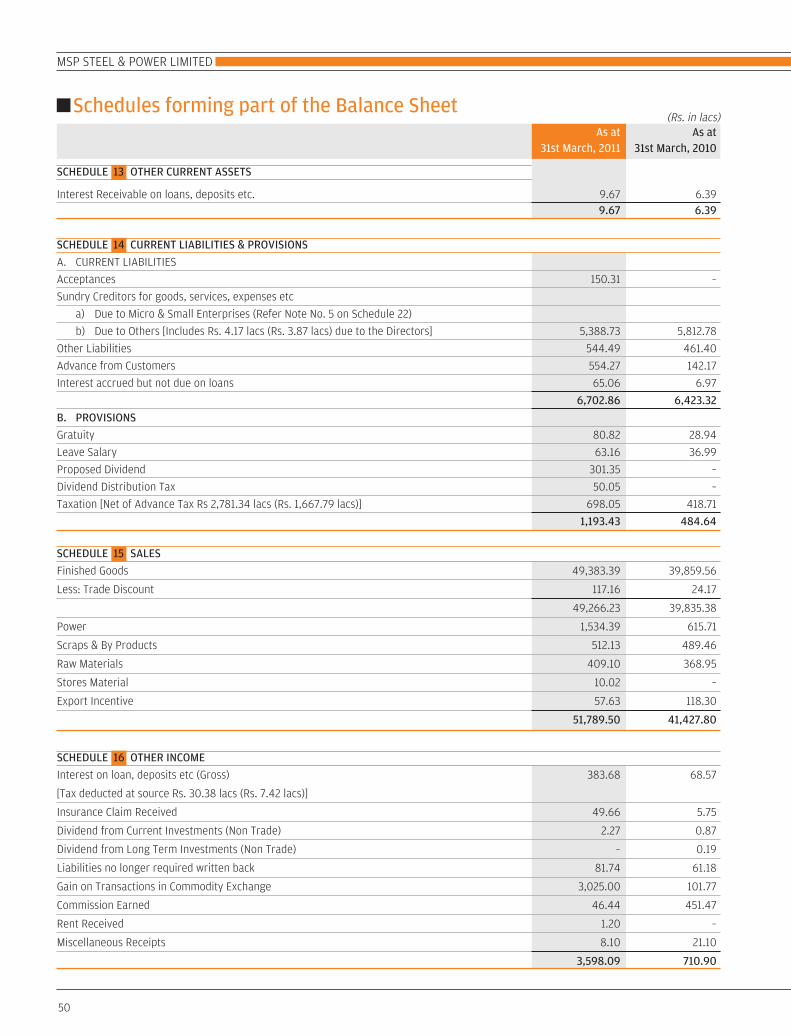
50
MSP STEEL & POWER LIMITED
Schedules forming part of the Balance Sheet
SCHEDULE 13 OTHER CURRENT ASSETS
As at As at31st March, 2011 31st March, 2010
Interest Receivable on loans, deposits etc. 9.67 6.39 9.67 6.39
(Rs. in lacs)
SCHEDULE 14 CURRENT LIABILITIES & PROVISIONS
A. CURRENT LIABILITIES
Acceptances 150.31 –
Sundry Creditors for goods, services, expenses etc
a) Due to Micro & Small Enterprises (Refer Note No. 5 on Schedule 22)
b) Due to Others [Includes Rs. 4.17 lacs (Rs. 3.87 lacs) due to the Directors] 5,388.73 5,812.78
Other Liabilities 544.49 461.40
Advance from Customers 554.27 142.17
Interest accrued but not due on loans 65.06 6.97
6,702.86 6,423.32
B. PROVISIONS
Gratuity 80.82 28.94
Leave Salary 63.16 36.99
Proposed Dividend 301.35 –
Dividend Distribution Tax 50.05 –
Taxation [Net of Advance Tax Rs 2,781.34 lacs (Rs. 1,667.79 lacs)] 698.05 418.71
1,193.43 484.64
SCHEDULE 15 SALES
Finished Goods 49,383.39 39,859.56
Less: Trade Discount 117.16 24.17
49,266.23 39,835.38
Power 1,534.39 615.71
Scraps & By Products 512.13 489.46
Raw Materials 409.10 368.95
Stores Material 10.02 –
Export Incentive 57.63 118.30
51,789.50 41,427.80
SCHEDULE 16 OTHER INCOME
Interest on loan, deposits etc (Gross) 383.68 68.57
[Tax deducted at source Rs. 30.38 lacs (Rs. 7.42 lacs)]
Insurance Claim Received 49.66 5.75
Dividend from Current Investments (Non Trade) 2.27 0.87
Dividend from Long Term Investments (Non Trade) – 0.19
Liabilities no longer required written back 81.74 61.18
Gain on Transactions in Commodity Exchange 3,025.00 101.77
Commission Earned 46.44 451.47
Rent Received 1.20 –
Miscellaneous Receipts 8.10 21.10
3,598.09 710.90

51
Annual Report 2010-11
Schedules forming part of the Balance Sheet
SCHEDULE 17 (INCREASE)/DECREASE IN STOCKS
As at As at31st March, 2011 31st March, 2010
Opening Stock
Finished Goods 1,600.74 882.69
Goods under process 226.79 34.71
By Products 806.36 1,069.94
2,633.89 1,987.34
Add: Transferred from Trial Run Production
Finished Goods 187.08 207.39
2,820.97 2,194.73
Less:
Closing Stock
Finished Goods 3,918.70 1,600.74
Goods under process 845.16 226.79
By Products 1,190.93 806.36
5,954.79 2,633.89
Less : Transfer for Trial Run - Finished Goods 170.19 –
Less : Transfer to CWIP - Finished Goods 531.56 355.36
(3,835.57) (794.52)
(Rs. in lacs)
SCHEDULE 18 RAW MATERIALS CONSUMED
Opening Stock 3,433.90 1,565.05
Add: Purchases 33,447.88 24,960.00
[Includes materials transferred from trial run production Rs. 1,113.82 lacs (Rs. Nil)] 36,881.78 26,525.05
Less : Closing Stock 5,224.60 3,433.91
31,657.18 23,091.14
SCHEDULE 19 PERSONNEL COST
Salary and Wages 1,283.13 997.41
Contribution to Provident and Other Funds 57.18 44.16
Gratuity Expenses 81.13 36.33
Staff Welfare Expenses 46.28 49.94
Managerial Remuneration 66.00 66.00
1,533.72 1,193.84
(Refer Note Nos. 7 & 12 on Schedule 22)

52
MSP STEEL & POWER LIMITED
Schedules forming part of the Balance Sheet(Rs. in lacs)
As at As at31st March, 2011 31st March, 2010
Stores & Spares Consumed 2,504.18 1,857.75
Power & Fuel 1,913.72 1,420.65
Repairs & Maintenance
– Plant & Machinery 243.06 65.36
– Building 8.19 9.95
– Others 56.13 21.65
Material Handling Charges 406.68 406.00
Travelling & Conveyance 29.10 33.63
Vehicle Running Expense 212.49 145.98
Commission on sales 123.29 110.53
Freight Outward [net of recoveries Rs. 55.68 lacs (Rs. 218.32 lacs)] 625.75 154.10
Auditor's Remuneration
– Statutory Audit 8.00 8.00
– Limited Review 4.50 4.50
– Out of pocket expenses 1.44 0.34
Insurance Charges 36.36 11.44
Printing and Stationary 12.23 12.52
Postage and Communication 36.71 29.83
Legal & Professional Charges 72.21 30.86
Rent 35.09 13.19
Rates & Taxes (Including Rs. 9.05 lacs (Rs. 76.06 lacs) for earlier years) 67.49 98.17
Loss on Foreign Exchange Fluctuation 130.60 8.90
Selling & Marketing expenses 267.88 51.89
Charity & Donations 16.25 6.86
Irrecoverable Debts, Deposits and Advances written off 46.72 109.27
Less: Adjusted with provision – 46.72 35.19 74.08
Loss on sale of Fixed Assets – 0.90
Provision for doubtful debts/advances 49.80 98.74
Miscellaneous Expenses 377.80 370.35
7,285.67 5,046.17
SCHEDULE 20 MANUFACTURING, SELLING & ADMINISTRATIVE EXPENSES
Interest
– On Term Loans 1,524.69 1,089.43
– On Working Capital Facilities 695.30 826.25
– On Others 40.44 29.89
Finance Charges 86.19 94.86
2,346.62 2,040.43
SCHEDULE 21 INTEREST & FINANCE CHARGES

53
Annual Report 2010-11
Schedules forming part of the Balance Sheet and Profit and Loss Account
SCHEDULE 22 SIGNIFICANT ACCOUNTING POLICIES AND NOTES TO ACCOUNTS
1. Significant Accounting Policies
Nature of Operations:
MSP Steel & Power Limited is engaged in the manufacture and sale of iron & steel products and generation and sale of power
i) Basis of preparation
The financial statements have been prepared to comply in all material respects with the Accounting Standards notified by the
Companies (Accounting Standards) Rules, 2006 (as amended) and the relevant provisions of the Companies Act, 1956. The financial
statements have been prepared under the historical cost convention on an accrual basis except in respect of insurance and other
claims, which on the ground of prudence or uncertainty in realisation, are accounted for as and when accepted / received. The
accounting policies applied by the Company, are consistent with those used in the previous year.
ii) Use of Estimates
The preparation of financial statements in conformity with generally accepted accounting principles requires management to make
estimates and assumptions that affect the reported amounts of assets and liabilities and disclosure of contingent liabilities at the
date of the financial statements and the results of operations during the reporting period. Although these estimates are based upon
management’s best knowledge of current events and actions, actual results could differ from these estimates.
iii) Fixed Assets
a) Fixed Assets are stated at cost, less accumulated depreciation and impairment if any. The cost of acquisition comprises of
purchase price inclusive of duties (net of Cenvat / VAT), taxes, incidental expenses, erection/commissioning/trial run expenses
and borrowing cost etc, up to the date the assets are ready for intended use. Borrowing costs relating to acquisition of fixed
assets which takes substantial period of time to get ready for its intended use are also included to the extent they relate to the
period till such assets are ready to be put to use.
b) Machinery spares which can be used only in connection with an item of fixed assets and whose use as per technical assessment,
are expected to be irregular, are capitalized and depreciated prospectively over the residual life of the respective assets.
c) All direct expenditure relating to construction of project as well as administrative and in direct cost attributable to the
construction of the project and/or bringing it to the working conditions for intended use, are capitalized as “Pre-operative &
Trial Run Expenses (pending allocation)”.
iv) Impairment
The carrying amounts of assets are reviewed at each balance sheet date to determine if there is any indication of impairment based
on external/internal factors. An impairment loss is recognized wherever the carrying amount of an asset exceeds its recoverable
amount which represents the greater of the net selling price and ‘value in use’ of the assets. The estimated future cash flows
considered for determining the value in use, are discounted to their present value arrived at weighted average cost of capital.
(v) Depreciation
a) The classification of Plant & Machinery into continuous and non-continuous process is done as per the technical evaluation and
depreciation thereon is provided accordingly.
b) Depreciation on fixed assets is provided on straight-line method at the rates and in the manner prescribed in schedule XIV to
the Companies Act, 1956 or at the rates determined based on useful life of the respective asset, as estimated by the management,
whichever is higher.
c) In case of impairment, if any, depreciation is provided on the revised carrying amount of the assets over their remaining useful
life
(vi) Borrowing Cost
Borrowing Costs relating to the acquisition / construction of qualifying assets are capitalized until the time all substantial activities
necessary to prepare the qualifying assets for their intended use are complete.
A qualifying asset is one that necessarily takes substantial period of time to get ready for its intended use. All other borrowing cost
are charged to revenue.

54
MSP STEEL & POWER LIMITED
Schedules forming part of the Balance Sheet and Profit and Loss Account
SCHEDULE 22 SIGNIFICANT ACCOUNTING POLICIES AND NOTES TO ACCOUNTS (Contd.)
(vii) Leases
Leases where the lessor effectively retains substantially all the risks and benefits of ownership of the leased item, are classified as
operating leases. Operating lease payments are recognized as an expense in the Profit and Loss account on a straight-line basis over
the lease term.
(viii) Government Grant and Subsidies
Grants and subsidies from the government are recognized when there is reasonable assurance that the grant/subsidy will be received
and all attaching conditions will be complied with.
When the grant or subsidy relates to an expense item, it is recognized as income over the periods necessary to match them on a
systematic basis to the costs, which it is intended to compensate. Where the grant or subsidy relates to an asset, its value is deducted
from the gross value of the asset concerned in arriving at the carrying amount of the related asset.
(ix) Foreign Currency Transactions
a) Initial Recognition: Foreign currency transactions are recorded in the reporting currency by applying to the foreign currency
amount the exchange rate between the reporting currency and the foreign currency at the date of the transaction.
b) Conversion: Foreign currency monetary items are reported using the closing rate. Non-monetary items which are carried in
terms of historical cost denominated in a foreign currency are reported using the exchange rate at the date of the transaction;
and non-monetary items which are carried at fair value or other similar valuation denominated in a foreign currency are reported
using the exchange rates that existed when the values were determined.
c) Exchange Differences: Exchange differences arising on the settlement or reporting of monetary items at rates different from
those at which they were initially recorded during the period or reported in previous financial statements and / or on conversion
of monetary items, are recognized as income or expenses in the year in which they arise.
d) Forward Exchange Contracts (not intended for trading or speculation purpose): The premium or discount arising at the
inception of forward exchange contracts is amortized as expenses or income over the life of the respective contracts. Exchange
differences on such contracts are recognized in the statement of profit and loss in the period in which the exchange rates
change. Any profit or loss arising on cancellation or renewal of forward exchange contract is recognized as income or expense
for the year.
(x) Investments
Investments that are readily realizable and intended to be held for not more than a year are classified as current investments. All
other investments are classified as long-term investments.
Current investments are carried at lower of cost and fair value determined on an individual investment basis. Long term investments
are carried at cost. However, provision for diminution in value is recognized when there is an ‘other than temporary’ decline in the
value of the investments.
(xi) Inventories
a) Raw materials, stores & spares & finished goods are valued at lower of cost and net realizable value. However, materials and
other items held for use in the production of finished goods are not written down below cost if the finished goods in which they
will be incorporated are expected to be sold at or above cost. Cost is determined on ‘First in First out’ basis.
b) Goods under process and finished goods are valued at lower of cost and net realizable value. Cost includes direct materials,
labour cost and a proportion of manufacturing overheads based on normal operating capacity. Cost of finished goods includes
excise duty. Cost is determined on annual average basis.
c) Saleable scrap and by-products are valued at net realizable value.
d) Net realizable value is the estimated selling price in the ordinary course of business, less estimated costs of completion and
estimated costs necessary to make the sale.
(xii) Retirement and Other Employee Benefits
a) Retirement benefit in the form of Provident Fund is a defined contribution scheme and the contributions are charged to Profit
and Loss Account of the year when the contributions to the fund are due. There is no obligation other than contribution payable
to the respective fund.

55
Annual Report 2010-11
Schedules forming part of the Balance Sheet and Profit and Loss Account
SCHEDULE 22 SIGNIFICANT ACCOUNTING POLICIES AND NOTES TO ACCOUNTS (Contd.)
b) Gratuity liability is a defined benefit obligation and is provided for on the basis of actuarial valuation, as per projected unit
credit method made at the balance sheet date.
c) Short term compensated absences are provided for based on estimates. Long term compensated absences are provided for
based on actuarial valuation, as per projected unit credit method made at the balance sheet date
d) Actuarial gains/losses are taken to profit and loss account and are not deferred.
(xiii) Taxation
Tax expense comprises of current (net of MAT credit entitlement) and deferred tax.
Current income tax is measured at the amount expected to be paid to the tax authorities in accordance with the Indian Income Tax
Act, 1961. Deferred income tax reflects the impact of current year timing differences between taxable income and accounting income
for the year and reversal of timing differences of earlier years.
Deferred tax is measured based on the tax rates and the tax laws enacted or substantively enacted at the balance sheet date.
Deferred tax assets and deferred tax liabilities are offset, if a legally enforceable right exists to set off current tax assets against
current tax liabilities and the deferred tax assets and deferred tax liabilities relate to the taxes on income levied by same governing
taxation laws. Deferred tax assets are recognised only to the extent that there is reasonable certainty that sufficient future taxable
income will be available against which such deferred tax assets can be realised. In situations where the company has unabsorbed
depreciation or carry forward tax losses, all deferred tax assets are recognised only if there is virtual certainty supported by convincing
evidence that they can be realised against future taxable profits.
At each balance sheet date the Company re-assesses unrecognised deferred tax assets. It recognises unrecognised deferred tax
assets to the extent that it has become reasonably certain or virtually certain, as the case may be that sufficient future taxable
income will be available against which such deferred tax assets can be realised.
MAT credit is recognised as an asset only when and to the extent there is convincing evidence that the Company will pay normal
income tax during the specified period. In the year in which the Minimum Alternative tax (MAT) credit becomes eligible to be
recognized as an asset in accordance with the recommendations contained in guidance Note issued by the Institute of Chartered
Accountants of India, the said asset is created by way of a credit to the profit and loss account and shown as MAT Credit Entitlement.
The Company reviews the same at each balance sheet date and writes down the carrying amount of MAT Credit Entitlement to the
extent there is no longer convincing evidence to the effect that Company will pay normal income tax during the specified period.
(xiv) Revenue Recognition
Revenue is recognized to the extent that it is probable that the economic benefits will flow to the Company and the revenue can be
reliably measured.
Sale of Goods
Revenue from sale of goods is recognized when significant risks and rewards of ownership in goods have passed to the buyer, which
generally coincides with delivery. Sales are net of returns, claims, trade discounts, Sales Tax and VAT etc.
Sale of Power
Revenue from sale of power is recognized on transmission of power to the customers from the grid.
Interest
Interest income is recognised on a time proportionate basis taking into account the amount outstanding and the rate applicable.
Commission Income
Revenue is recognised when the services are rendered and there is no significant uncertainty as regards the collection thereof.
Export Incentives
Export Incentives under the Duty Entitlement Pass Book (DEPB) scheme are recognized when such incentive accrues upon export of
goods.
(xv) Segment Reporting Policies
Based on the synergies, risks and return associated with business operations and in terms of Accounting Standard-17, the Company
is predominantly engaged in a single reportable segment of Iron and Steel during the year. The risks and returns of existing captive

56
MSP STEEL & POWER LIMITED
Schedules forming part of the Balance Sheet and Profit and Loss Account
SCHEDULE 22 SIGNIFICANT ACCOUNTING POLICIES AND NOTES TO ACCOUNTS (Contd.)
power plants are directly associated with the manufacturing operations of iron & steel and hence treated as a single reportable
segment as per Accounting Standard-17.
The analysis of geographical segments is based on the area in which the customers of the Company are located.
(xvi) Provision
A provision is recognized when the Company has a present obligation as a result of past event and it is probable that an outflow of
resources will be required to settle the obligation, in respect of which a reliable estimate can be made.
Provisions made in terms of Accounting Standard 29 are not discounted to its present value and are determined based on best
estimate required to settle the obligation at the balance sheet date. These are reviewed at each balance sheet date and adjusted to
reflect the current best estimates.
(xvii) Earnings per Share
Basic earnings per share are calculated by dividing the net profit or loss for the year attributable to equity shareholders by the
weighted average number of equity shares outstanding during the year.
For the purpose of calculating diluted earnings per share, the net profit or loss for the year attributable to equity shareholders and
the weighted average number of shares outstanding during the year are adjusted for the effects of all dilutive potential equity
shares.
(xviii) Excise duty & custom duty
Excise duty is accounted for at the point of manufacture of goods and accordingly is considered for valuation of finished goods stock
lying in the factories as on the balance sheet date. Similarly, customs duty on imported materials in transit / lying in bonded
warehouse is accounted for at the time of import / bonding of materials.
(xix) Cash and Cash equivalents
Cash and cash equivalents as indicated in the Cash Flow Statement comprises of cash on hand, cash at bank and short-term
investments with an original maturity of three months or less.
(xx) Contingencies
Liabilities, which are material and whose future outcome cannot be ascertainable with reasonable certainty, are treated as contingent
and disclosed by way of notes to the accounts.
2. Contingent liabilities not provided for in respect of:
Particulars As at As at31st March, 2011 31st March, 2010
a) Excise Matters under dispute/ appeal 1,391.35 392.96
b) Sales Tax Matters under dispute/ appeal 85.86 34.20
c) Un-expired Bank Guarantees and Letters of Credit 1,200.44 603.74
d) Corporate guarantee given for a joint venture company 660.75 660.75
e) Custom duty on import of equipments and spare parts under EPCG scheme. 2,113.51 1,240.43
f) Claims against the Company not acknowledged as debt 60.67 60.67
In October 2010, search and seizure operations were conducted by the Income Tax authorities under Section 132 of the Income Tax Act,
at various locations of the Company. During the course of the search and seizure operations, the income tax authorities have taken custody
of certain materials such as documents, records, and recorded statements of certain officials of Company. The Company has not received
any communication from the income tax authorities in this regard till the Balance Sheet date. The Company does not expect any liability
arising out of the aforesaid search and seizure. The documents and records seized by the authorities did not impair the Company’s ability
to draw a true and fair financial statement as of and for the year ended March 31, 2011.
(Rs. in lacs)

57
Annual Report 2010-11
Schedules forming part of the Balance Sheet and Profit and Loss Account
SCHEDULE 22 SIGNIFICANT ACCOUNTING POLICIES AND NOTES TO ACCOUNTS (Contd.)
3. Capital Commitments
Particulars As at As at31st March, 2011 31st March, 2010
Estimated amount of contracts remaining to be executed on capital account and 10,237.78 5,973.05
not provided for (net of advances Rs 4,836.53 lacs (Rs 2,783.71 lacs))
(Rs. in lacs)
4. During the year, the Company has issued 75,40,000 numbers of 6% non cumulative non convertible redeemable preference shares of Rs.10
each with a premium of Rs.90 per share on private placement basis.
5. As per information available with the Company, there are no suppliers covered under Micro, Small & Medium Enterprise Development Act,
2006. As a result, no interest provision/payment has been made by the Company to such creditors, if any, and no disclosure thereof is
made in the accounts.
6. Loans are secured as follows:
i) Rupee Term Loans from Banks are secured by way of equitable mortgage of Company’s land and immovable properties at Raigarh
and a first charge by way of hypothecation of the Company's movable assets (save and except book debts) including movable
machinery, machinery spares, tools & accessories, (both present and future), subject to prior charges created in favour of the
Company's bankers on the stock of raw materials, finished goods, process stock, consumable stores and book debts for securing
working capital facilities.
ii) The above term loans are further secured by the personal guarantees of Mr. Puranmal Agrawal (the chairman), Mr. Suresh Kumar
Agrawal, Mr. Saket Agrawal and Mr. Manish Agrawal (directors of the Company).
iii) Cash Credit and other working capital facilities from banks are secured by hypothecation of raw materials, finished goods, goods under
process, stores and spares, book debts etc. (both present and future), second charge over the entire fixed assets of the Company and
personal guarantees of Mr. Puranmal Agrawal (the chairman), Mr. Suresh Kumar Agrawal, Mr. Saket Agrawal & Mr. Manish Agrawal
(directors of the Company).
iv) Hire purchases obligations are secured by hypothecation of vehicles purchased under the respective agreements. All the mortgages
and charges created in favour of the banks rank pari-passu inter se, except where specifically stipulated otherwise.
7. Gratuity and other post retirement benefit plans
The Company provides gratuity benefits which are funded with Life Insurance Corporation of India in the form of qualifying insurance policy.
Leave encashment benefits is an unfunded plan of the Company.
(a) Expenses recognized in the profit and loss account/ Pre-operative & Trial run expenses (Pending allocation) for respective years
are as follows:
2010-11 2009-10 2010-11 2009-10
Current service cost 40.51 15.77 1.53 1. 39
Interest cost 4.98 1.93 3.00 2.59
Expected return on plan assets (3.80) (1.72) – –
Past Service Cost – 25.53 – –
Net actuarial losses/(gains) 39.44 (5.18) 22.81 0.76
Net benefit expense 81.13 36.33 27.34 4.74
Actual return on plan assets 3.80 0.10 N.A. N.A.
Particulars Gratuity Leave(Rs. in lacs)
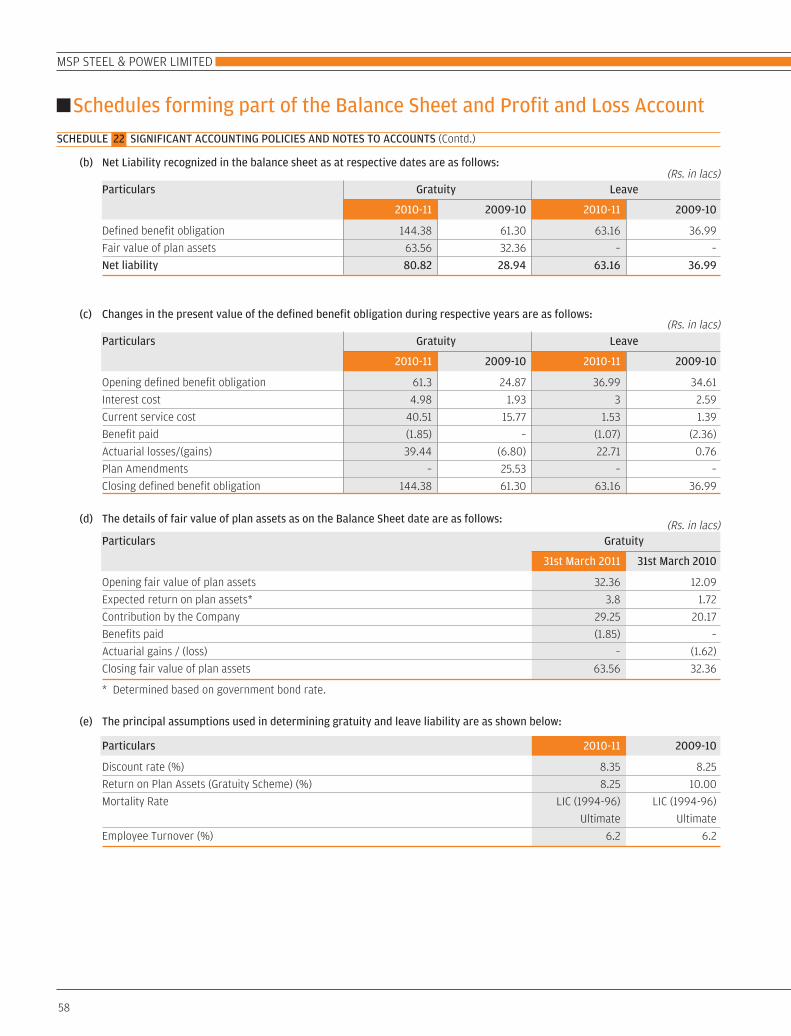
58
MSP STEEL & POWER LIMITED
Schedules forming part of the Balance Sheet and Profit and Loss Account
SCHEDULE 22 SIGNIFICANT ACCOUNTING POLICIES AND NOTES TO ACCOUNTS (Contd.)
(b) Net Liability recognized in the balance sheet as at respective dates are as follows:
2010-11 2009-10 2010-11 2009-10
Defined benefit obligation 144.38 61.30 63.16 36.99
Fair value of plan assets 63.56 32.36 – –
Net liability 80.82 28.94 63.16 36.99
Particulars Gratuity Leave(Rs. in lacs)
(c) Changes in the present value of the defined benefit obligation during respective years are as follows:
2010-11 2009-10 2010-11 2009-10
Opening defined benefit obligation 61.3 24.87 36.99 34.61
Interest cost 4.98 1.93 3 2.59
Current service cost 40.51 15.77 1.53 1.39
Benefit paid (1.85) – (1.07) (2.36)
Actuarial losses/(gains) 39.44 (6.80) 22.71 0.76
Plan Amendments – 25.53 – –
Closing defined benefit obligation 144.38 61.30 63.16 36.99
Particulars Gratuity Leave(Rs. in lacs)
(d) The details of fair value of plan assets as on the Balance Sheet date are as follows:
31st March 2011 31st March 2010
Opening fair value of plan assets 32.36 12.09
Expected return on plan assets* 3.8 1.72
Contribution by the Company 29.25 20.17
Benefits paid (1.85) –
Actuarial gains / (loss) – (1.62)
Closing fair value of plan assets 63.56 32.36
* Determined based on government bond rate.
Particulars Gratuity(Rs. in lacs)
(e) The principal assumptions used in determining gratuity and leave liability are as shown below:
Particulars 2010-11 2009-10
Discount rate (%) 8.35 8.25
Return on Plan Assets (Gratuity Scheme) (%) 8.25 10.00
Mortality Rate LIC (1994-96) LIC (1994-96)
Ultimate Ultimate
Employee Turnover (%) 6.2 6.2
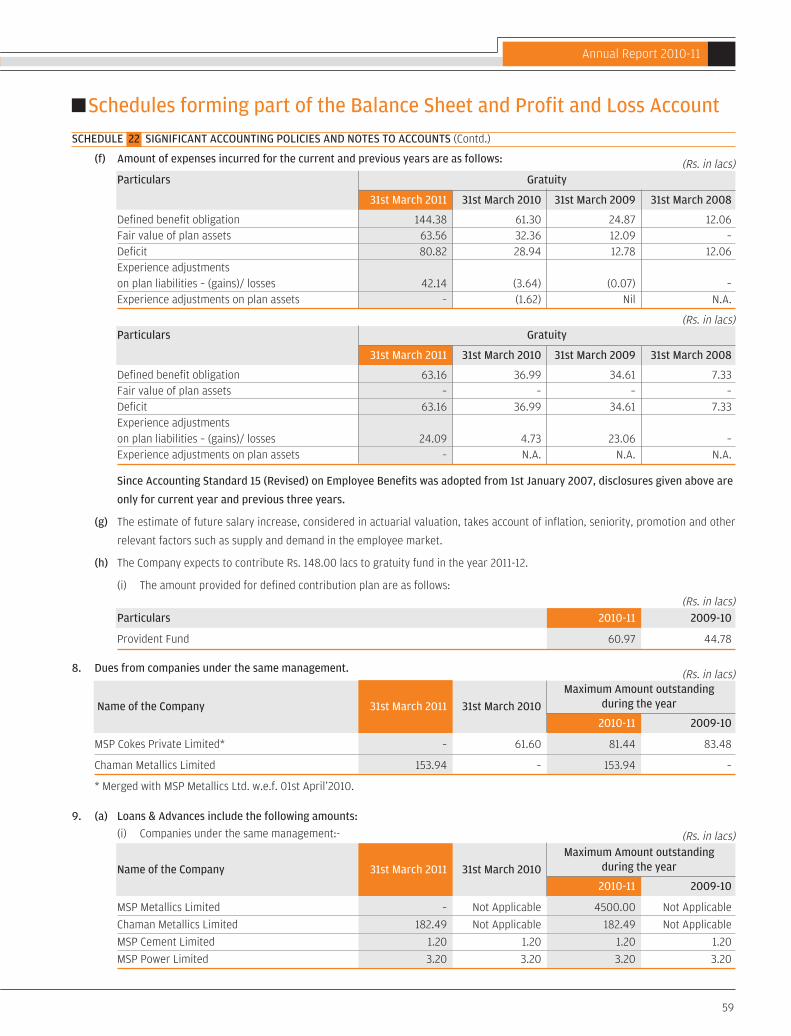
59
Annual Report 2010-11
Schedules forming part of the Balance Sheet and Profit and Loss Account
SCHEDULE 22 SIGNIFICANT ACCOUNTING POLICIES AND NOTES TO ACCOUNTS (Contd.)
(f) Amount of expenses incurred for the current and previous years are as follows:
31st March 2011 31st March 2010 31st March 2009 31st March 2008
Defined benefit obligation 144.38 61.30 24.87 12.06Fair value of plan assets 63.56 32.36 12.09 –Deficit 80.82 28.94 12.78 12.06Experience adjustments on plan liabilities – (gains)/ losses 42.14 (3.64) (0.07) –Experience adjustments on plan assets – (1.62) Nil N.A.
Particulars Gratuity(Rs. in lacs)
31st March 2011 31st March 2010 31st March 2009 31st March 2008
Defined benefit obligation 63.16 36.99 34.61 7.33Fair value of plan assets – – – –Deficit 63.16 36.99 34.61 7.33Experience adjustments on plan liabilities – (gains)/ losses 24.09 4.73 23.06 –Experience adjustments on plan assets – N.A. N.A. N.A.
Particulars Gratuity(Rs. in lacs)
Since Accounting Standard 15 (Revised) on Employee Benefits was adopted from 1st January 2007, disclosures given above are
only for current year and previous three years.
(g) The estimate of future salary increase, considered in actuarial valuation, takes account of inflation, seniority, promotion and other
relevant factors such as supply and demand in the employee market.
(h) The Company expects to contribute Rs. 148.00 lacs to gratuity fund in the year 2011-12.
(i) The amount provided for defined contribution plan are as follows:
Particulars 2010-11 2009-10
Provident Fund 60.97 44.78
(Rs. in lacs)
8. Dues from companies under the same management.
2010-11 2009-10
MSP Cokes Private Limited* – 61.60 81.44 83.48
Chaman Metallics Limited 153.94 – 153.94 –
* Merged with MSP Metallics Ltd. w.e.f. 01st April’2010.
Maximum Amount outstanding
Name of the Company 31st March 2011 31st March 2010 during the year
(Rs. in lacs)
9. (a) Loans & Advances include the following amounts:
(i) Companies under the same management:-
2010-11 2009-10
MSP Metallics Limited – Not Applicable 4500.00 Not Applicable
Chaman Metallics Limited 182.49 Not Applicable 182.49 Not Applicable
MSP Cement Limited 1.20 1.20 1.20 1.20
MSP Power Limited 3.20 3.20 3.20 3.20
Maximum Amount outstanding
Name of the Company 31st March 2011 31st March 2010 during the year
(Rs. in lacs)

60
MSP STEEL & POWER LIMITED
Schedules forming part of the Balance Sheet and Profit and Loss Account
SCHEDULE 22 SIGNIFICANT ACCOUNTING POLICIES AND NOTES TO ACCOUNTS (Contd.)
(ii) Private company in which a director of the Company is a director or a member:-
2010-11 2009-10
Prateek Mines & Minerals Private Ltd. – 41.00 – 41.00
Maximum Amount outstanding
Name of the Company 31st March 2011 31st March 2010 during the year
(Rs. in lacs)
b) Disclosure in terms of clause 32 of the Listing Agreements:
2010-11 2009-10
MSP Group International Subsidiary Loan without fixed 8.33 4.58 8.33 4.58
Singapore (PTE) Limited repayment schedule
MSP Metallics Limited Company in which Loan without fixed – N.A. 4500.00 N.A.
directors are repayment schedule
interested
Chaman Metallics Company in which Loan without fixed 182.49 N.A. 182.49 N.A.
Limited directors are repayment schedule
interested
MSP Cement Limited Company in which Loan without fixed 1.20 1.20 1.20 1.20
directors are repayment schedule
interested
MSP Power Limited Company in which Loan without fixed 3.20 3.20 3.20 3.20
directors are repayment schedule
interested
Maximum Amount
31st March 31st March outstanding
Name of the Company Relation Category 2011 2010 during the year
(Rs. in lacs)
10. During the current year, the Company has recognized MAT credit entitlement of Rs. 1,055.53 Lacs (Rs.472.84) in terms of Section 115JAA
of the Income Tax Act, 1961. Based on future profitability projections, the Company is certain that there would be sufficient taxable income
in the future, to claim the above tax credit.
11. In terms of Accounting Standard 22, net deferred tax liability (DTL) of Rs. 1351.54 lacs (Rs. 402.84 lacs) has been recognized during the
year and consequently the net DTL stands at Rs. 3,337.34 lacs (Rs. 1985.79 lacs).
The break-up of major components of such net DTL is as follows:
Components of Deferred Tax Liability/ (Assets) As at As at31st March, 2011 31st March, 2010
Timing Difference in depreciable assets 3,581.50 2,148.25
Difference on expense allowable in future (244.16) (162.46)
Total 3,337.34 1,985.79
(Rs. in lacs)
12. Details of remuneration paid to the directors:(Rs. in lacs)
Particulars 2010-11 2009-10
Salary & Bonus* 66.00 66.00
* As the liabilities for gratuity and leave encashment are provided on an actuarial basis for the Company as a whole, the amounts pertaining
to the directors are not included above.

61
Annual Report 2010-11
Schedules forming part of the Balance Sheet and Profit and Loss Account
SCHEDULE 22 SIGNIFICANT ACCOUNTING POLICIES AND NOTES TO ACCOUNTS (Contd.)
13. Basis for calculation of Basic and Diluted Earning per Share is as follows:
Particulars 2010-11 2009-10
Present Weighted Average Number of Equity Shares Nos. 58,100,000 58,100,000
Net Profit After Tax available for Equity Shareholders Rs. in lacs 5,021.10 3,205.42
Less : Dividend and dividend distribution tax on Preference Shares Rs. in lacs 12.65 –
Rs. in lacs 5,008.45 3,205.42
Nominal Value of each Shares Rs. 10/- 10/-
Basic & Diluted Earning Per Share Rs. 8.62 5.52
14. Interest in joint venture
The Company has a 14.90 % interest in the assets and liabilities of the Madanpur South Coal Company Limited (Joint Venture Company),
established in India.
The Company’s share of the assets and liabilities of the above jointly controlled entity as at the respective Balance Sheet dates is as
follows:
15. Excise duty & cess on stocks represents differential excise duty and cess on opening and closing stock of finished goods.
16. Segment Information:
The Company is engaged in manufacturing of “Iron & Steel”. Consequently it has one reportable business segment e.g. “Iron & Steel”. The
analysis of geographical segments is based on the area in which the customers of the Company are located.
The amounts of joint venture entity are from the management certified accounts and are not subjected to audit.
The Company’s proportionate share of the capital commitments of the jointly controlled entity amounts to Rs. 5.12 (Rs. 5.16 lacs).
The Company has common fixed assets for producing goods for domestic and overseas markets. Hence, separate figures for fixed assets
/ additions to fixed assets cannot be furnished. Export debtors at the year end amounts to Rs. 306.65 (Rs.Nil).
Particulars As at As at31st March, 2011 31st March, 2010
Reserve & Surplus (0.29) (0.07)
Fixed Assets 134.96 127.35
Deferred Tax Asset 0.17 0.07
Net Current Assets 79.42 44.77
Loan Fund 0.89 0.89
Miscellaneous Expenditure
(To the extent not written off or Adjusted) 0.16 0.21
Other Income 0.14 0.16
Manufacturing, Selling & administrative Expenses 0.14 0.09
Depreciation 0.30 0.21
(Rs. in lacs)
Information for Secondary Geographical Segments (Rs. in lacs)Particulars 2010-11 2009-10
Domestic Revenues (Net of Excise Duty and Trade discount) 45,586.75 35,620.51
Export Revenues (Including Export Benefits) 2,160.19 3,253.57
Total 47,746.94 38,874.48

62
MSP STEEL & POWER LIMITED
Schedules forming part of the Balance Sheet and Profit and Loss Account
SCHEDULE 22 SIGNIFICANT ACCOUNTING POLICIES AND NOTES TO ACCOUNTS (Contd.)
17. The Company has the following un-hedged exposures in US Dollars as at the year end.
Particulars As at As at31st March, 2011 31st March, 2010
Investment in Foreign Subsidiary 0.33 0.33
Sundry Creditors 46.00 –
(Rs. in lacs)
18. Related Party Disclosures
(a) Names of the related parties :
Subsidiary Company : MSP Group International Singapore (PTE) Limited
Jointly Controlled Entity : Madanpur South Coal Company Limited
Key Management Personnel & their Relatives : Mr. Puranmal Agrawal – Chairman
Mr. Suresh Kumar Agrawal – Managing Director
Mr. Manish Agrawal – Non Executive Director
Mr. Saket Agrawal – Non Executive Director
Mrs. Kiran Agrawal (wife of Chairman)
Mrs. Nisha Agrawal (wife of Managing Director)
Mrs. Kisturi Devi Agrawal (mother of Managing Director)
Enterprises over which Key Management Personnel and/ : Howrah Gases Limited
or their Relatives have significant influence MSP Sponge Iron Limited
MSP Metallics Limited
MSP Infotech Private Limited
MSP Properties (India) Private Limited
MSP Cokes Private Limited (Merged with MSP Metallics Limited)
MSP Cement Limited
MSP Power Limited
Chaman Metallics Limited
Shree Khathupati Mercantiles Private Limited
MSP Mines & Minerals Private Limited
High Time Holdings Private Limited
B.S. Confin Private Limited
Prateek Mines & Minerals Private Limited
Adhunik Cement Limited
Danta Vyappar Kendra Limited
Emerald Tradelink Pvt. Ltd.
Ginny Traders Pvt. Ltd.
India Cement And Power Company Limited
Jai K Leasing And Commercial Investment Limited
M.A. Hire Purchase Pvt. Ltd.
Raj Securities Limited
Rajnath Vyapaar Pvt. Ltd.
Shree Saishraddha Cements Pvt. Ltd.
Larigo Investment Pvt. Limited

63
Annual Report 2010-11
Schedules forming part of the Balance Sheet and Profit and Loss Account
SCHEDULE 22 SIGNIFICANT ACCOUNTING POLICIES AND NOTES TO ACCOUNTS (Contd.)
(b) Related Party Disclosures :
Nature of Transactions Subsidiary Jointly Key Management Enterprises over which TotalCompany Controlled Personnel & their Key Management
Entity Relatives Personnel / ShareHolders/Relatives have
significant influence
SalesMSP Sponge Iron Limited 543.22 543.22
(358.19) (358.19)MSP Metallics Limited 534.04 534.04
(607.78) (607.78)Chaman Metallics Limited 150.31 150.31
(8.93) (8.93)MSP Properties (India) Private Limited 22.46 22.46
( – ) ( – )Purchases of GoodsMSP Sponge Iron Limited 2,556.99 2,556.99
(2,745.11) (2,745.11)MSP Metallics Limited 9,029.41 9,029.41
(4,291.79) (4,291.79)Chaman Metallics Limited 46.11 46.11
(122.16) (122.16)Howrah Gases Limited – –
(337.59) (337.59)Managerial RemunerationMr. Puranmal Agrawal 36.00 36.00
(36.00) (36.00)Mr. Suresh Kumar Agrawal 30.00 30.00
(30.00) (30.00)Legal & Professional Charges PaidMSP Mines & Minerals Private Limited 11.64 11.64
(6.97) (6.97)Rent PaidLarigo Investment Private Limited 0.18 0.18
(0.18) (0.18)MSP Infotech Private Limited 3.60 3.60
(3.60) (3.60)Shree Khathupati Mercantiles 3.49 3.49Private Limited (2.43) (2.43)Mrs. Kasturi Devi Agrawal 0.48 0.48
(0.84) (0.84)Mrs. Nisha Agrawal 0.36 0.36
(0.58) (0.58)Mrs. Kiran Agrawal 0.36 0.36
(0.58) (0.58)Mr. Manish Agrawal 0.48 0.48
(0.96) (0.96)Mr. Saket Agrawal 0.48 0.48
(0.96) (0.96)
(Rs. in lacs)

64
MSP STEEL & POWER LIMITED
Schedules forming part of the Balance Sheet and Profit and Loss Account
SCHEDULE 22 SIGNIFICANT ACCOUNTING POLICIES AND NOTES TO ACCOUNTS (Contd.)
(b) Related Party Disclosures (Contd.) :
Nature of Transactions Subsidiary Jointly Key Management Enterprises over which TotalCompany Controlled Personnel & their Key Management
Entity Relatives Personnel / ShareHolders/Relatives have
significant influence
Subscription to Equity Shares
Madanpur South Coal Company Limited – –
(22.35) (22.35)
Loans Taken
MSP Infotech Private Limited – –
(50.00) (50.00)
MSP Properties (India) Private Limited. – –
(50.00) (50.00)
Loans Given
Prateek Mines & – –
Minerals Private Limited (93.50) (93.50)
MSP Group International Singapore 3.75 3.75
(PTE) Limited (4.58) (4.58)
Chaman Metallics Ltd 245.00 245.00
(–) (–)
MSP Metallics Limited 4,585.00 4,585.00
(–) (–)
MSP Sponge Iron Limited 7,850.00 7,850.00
(–) (–)
Adhunik Cement Limited 2780.00 2780.00
(–) (–)
Guarantees Given on behalf of
Madanpur South Coal Company Limited 660.75 660.75
(660.75) (660.75)
Guarantees Obtained
MSP Infotech Private Limited – –
(1,500.00) (1,500.00)
Mr. Puranmal Agrawal 130.00 130.00
(130.00) (130.00)
Mr. Suresh Kumar Agrawal 111.00 111.00
(111.00) (111.00)
Mr. Manish Agrawal 140.00 140.00
(140.00) (140.00)
Mr. Saket Agrawal 131.00 131.00
(131.00) (131.00)
Interest Paid
High Time Holding Private Limited 2.51 2.51
(8.00) (8.00)
B.S. Confin Private Limited 1.90 1.90
(4.00) (4.00)
(Rs. in lacs)

65
Annual Report 2010-11
Schedules forming part of the Balance Sheet and Profit and Loss Account
SCHEDULE 22 SIGNIFICANT ACCOUNTING POLICIES AND NOTES TO ACCOUNTS (Contd.)
(b) Related Party Disclosures (Contd.) :
Nature of Transactions Subsidiary Jointly Key Management Enterprises over which TotalCompany Controlled Personnel & their Key Management
Entity Relatives Personnel / ShareHolders/Relatives have
significant influence
MSP Infotech Private Limited 6.00 6.00
(2.01) (2.01)
MSP Properties (India) Private Limited. 3.00 3.00
(1.49) (1.49)
Ginny Traders Private Limited 2.84 2.84
(6.00) (6.00)
Emerald Tradelink Private Limited 2.46 2.46
(5.20) (5.20)
Rajnath Vyapaar Private Limited 3.79 3.79
(8.00) (8.00)
Raj Securities Limited 3.46 3.46
(10.00) (10.00)
Danta Vyappar Kendra Limited 12.51 12.51
(26.40) (26.40)
Interest Received
Chaman Metallics Limited 4.98 4.98
(–) (–)
MSP Metallics Limited 47.86 47.86
(–) (–)
MSP Sponge Iron Limited 71.75 71.75
(–) (–)
Adhunik Cement Limited 117.09 117.09
(–) (–)
Closing Balance as at the year end–debit
MSP Metallics Limited 287.59 287.59
(61.60) (61.60)
MSP Sponge Iron Limited 197.29 197.29
(361.70) (361.70)
MSP Cement Limited 1.20 1.20
(1.20) (1.20)
MSP Group International Singapore 8.33 8.33
(PTE) Limited (4.58) (4.58)
Madanpur South Coal Company Limited 1.92 1.92
(2.00) (2.00)
MSP Power Limited 3.20 3.20
(3.20) (3.20)
Prateek Mines & Minerals Private Limited – –
(41.00) (41.00)
MSP Mines and Minerals Private Limited 25.87 25.87
(–) (–)
(Rs. in lacs)

66
MSP STEEL & POWER LIMITED
Schedules forming part of the Balance Sheet and Profit and Loss Account
SCHEDULE 22 SIGNIFICANT ACCOUNTING POLICIES AND NOTES TO ACCOUNTS (Contd.)
(b) Related Party Disclosures (Contd.) :
Nature of Transactions Subsidiary Jointly Key Management Enterprises over which TotalCompany Controlled Personnel & their Key Management
Entity Relatives Personnel / ShareHolders/Relatives have
significant influence
Chaman Metallics Ltd 336.43 336.43 (–) (–)
MSP Properties (India) Private Limited 12.15 12.15(–) (–)
MSP Infotech Private Limited 0.03 0.03(0.54) (0.54)
Closing Balance as at the year end – creditMSP Sponge Iron Limited 27.29 27.29
(88.09) (88.09)MSP Metallics Limited 2,729.09 2,729.09
(166.17) (166.17)Shree Khathupati Mercantiles 4.56 4.56Private Limited (1.41) (1.41)MSP Mines & Minerals Private Limited – –
(0.52) (0.52)High Time Holdings Private Limited – –
(100.00) (100.00)B.S Confin Private Limited – –
(50.00) (50.00)MSP Infotech Private Limited 49.56 49.56
(52.34) (52.34)MSP Properties (India) Private Limited 25.00 25.00
(25.00) (25.00)Mr. Puranmal Agrawal 2.27 2.27
(2.10) (2.10)Mr. Suresh Kumar Agrawal 1.90 1.90
(1.77) (1.77)Chaman Metallics Limited – –
(13.72) (13.72)Howrah Gases Limited – –
(35.56) (35.56)Danta Vyappar Kendra Limited – –
(330.00) (330.00)Emerald Trade Link Private Limited – –
(65.00) (65.00)Ginny Traders Private Limited – –
(75.00) (75.00)Rajnath Vyappar Private Limited – –
(100.00) (100.00)Raj Securities Limited – –
(125.00) (125.00)Adhunik Cement Limited 105.38 105.38
(–) (–)
(Rs. in lacs)

67
Annual Report 2010-11
Schedules forming part of the Balance Sheet and Profit and Loss Account
SCHEDULE 22 SIGNIFICANT ACCOUNTING POLICIES AND NOTES TO ACCOUNTS (Contd.)
19. Information pursuant to the provisions of paragraphs 3, 4C and 4D of Part II of Schedule VI to the Companies Act, 1956: (To the extent
applicable)
(i) Installed Capacity and Actual Production
Unit 2010-11 2009-10 2010-11 2009-10
Pellet Plant Mt 300,000 300,000 185,219 144,643
Sponge Iron Mt 307,500 192,000 158,187 155,851
MS Ingot/Billet Mt. 144,109 144,109 102,326 107,579
TMT Bar Mt. 80,000 80,000 49,379 68,385
Structural Rolling Mill Mt. 128,000 1,28,000 53,196 1,099
Captive Power Plant Kwh 332,640,000 190,080,000 192,995,100 161,783,321
Notes: Since the industry in which the Company operates is de-licensed, the requirement
for disclosure of licensed capacity is not applicable.
Class of goods Annual Installed Capacity Production
(ii) Details of Sales
Unit Quantity Rs. in lacs Quantity Rs. in lacs
Sale of Finished Goods
Pellet Mt. 8,412 295.21 – –
Sponge Iron Mt 65,968 10,919.48 55,907 7,406.62
MS Ingot/Billets Mt 10,201 2,836.41 47,227 10,025.44
TMT Bar Mt 46,854 13,555.89 64,811 15,857.71
Structural TMT Mt 48,320 14,018.79 3 0.97
Add : Excise duty 4,042.56 2,553.32
45,668.34 35,844.06
Sale of Trading Goods
G.I.Wire Mt 2,942 1,278.92 – –
MS Channel Mt – – 407 107.73
MS Plate Mt 5,442 1,832.71 – –
Steel Flat Mt 189 61.83 – –
TMT Mt 329 106.84 10,332 3,761.80
Steel Round Mt 960 437.78 474 125.61
3,718.08 3,995.14
Sale of Scrap, Stores & By Products
Iron Ore Fines Mt – – 393 3.40
Coal Fines Mt 39,914 401.09 60,487 445.98
Coal Tar Mt 493 78.96 60 3.63
Fly Ash Mt 4,175 3.00 – –
Soil Mt 433 0.40 – –
Scrap Pcs 8 15.60 5436 33.60
Stores Pcs 28 10.02 – –
509.08 486.61
Sales* 2010-11 2009-10
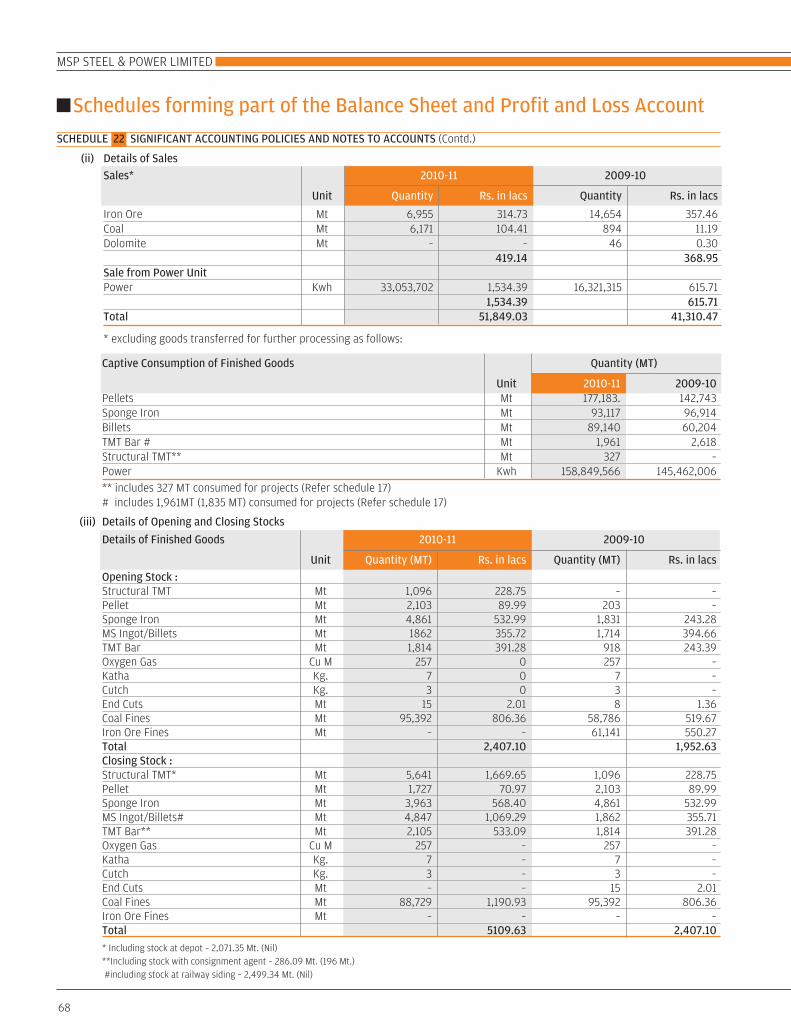
68
MSP STEEL & POWER LIMITED
Schedules forming part of the Balance Sheet and Profit and Loss Account
SCHEDULE 22 SIGNIFICANT ACCOUNTING POLICIES AND NOTES TO ACCOUNTS (Contd.)
(ii) Details of Sales
Unit Quantity Rs. in lacs Quantity Rs. in lacs
Iron Ore Mt 6,955 314.73 14,654 357.46Coal Mt 6,171 104.41 894 11.19Dolomite Mt – – 46 0.30
419.14 368.95Sale from Power UnitPower Kwh 33,053,702 1,534.39 16,321,315 615.71
1,534.39 615.71Total 51,849.03 41,310.47
* excluding goods transferred for further processing as follows:
Sales* 2010-11 2009-10
Unit 2010-11 2009-10Pellets Mt 177,183. 142,743Sponge Iron Mt 93,117 96,914Billets Mt 89,140 60,204TMT Bar # Mt 1,961 2,618Structural TMT** Mt 327 –Power Kwh 158,849,566 145,462,006** includes 327 MT consumed for projects (Refer schedule 17)# includes 1,961MT (1,835 MT) consumed for projects (Refer schedule 17)
Captive Consumption of Finished Goods Quantity (MT)
(iii) Details of Opening and Closing Stocks
Unit Quantity (MT) Rs. in lacs Quantity (MT) Rs. in lacs
Opening Stock :Structural TMT Mt 1,096 228.75 – –Pellet Mt 2,103 89.99 203 –Sponge Iron Mt 4,861 532.99 1,831 243.28 MS Ingot/Billets Mt 1862 355.72 1,714 394.66 TMT Bar Mt 1,814 391.28 918 243.39 Oxygen Gas Cu M 257 0 257 – Katha Kg. 7 0 7 – Cutch Kg. 3 0 3 – End Cuts Mt 15 2.01 8 1.36 Coal Fines Mt 95,392 806.36 58,786 519.67Iron Ore Fines Mt – – 61,141 550.27Total 2,407.10 1,952.63Closing Stock :Structural TMT* Mt 5,641 1,669.65 1,096 228.75Pellet Mt 1,727 70.97 2,103 89.99Sponge Iron Mt 3,963 568.40 4,861 532.99MS Ingot/Billets# Mt 4,847 1,069.29 1,862 355.71TMT Bar** Mt 2,105 533.09 1,814 391.28Oxygen Gas Cu M 257 – 257 –Katha Kg. 7 – 7 –Cutch Kg. 3 – 3 –End Cuts Mt – – 15 2.01Coal Fines Mt 88,729 1,190.93 95,392 806.36Iron Ore Fines Mt – – – –Total 5109.63 2,407.10
* Including stock at depot – 2,071.35 Mt. (Nil)**Including stock with consignment agent – 286.09 Mt. (196 Mt.)#including stock at railway siding – 2,499.34 Mt. (Nil)
Details of Finished Goods 2010-11 2009-10
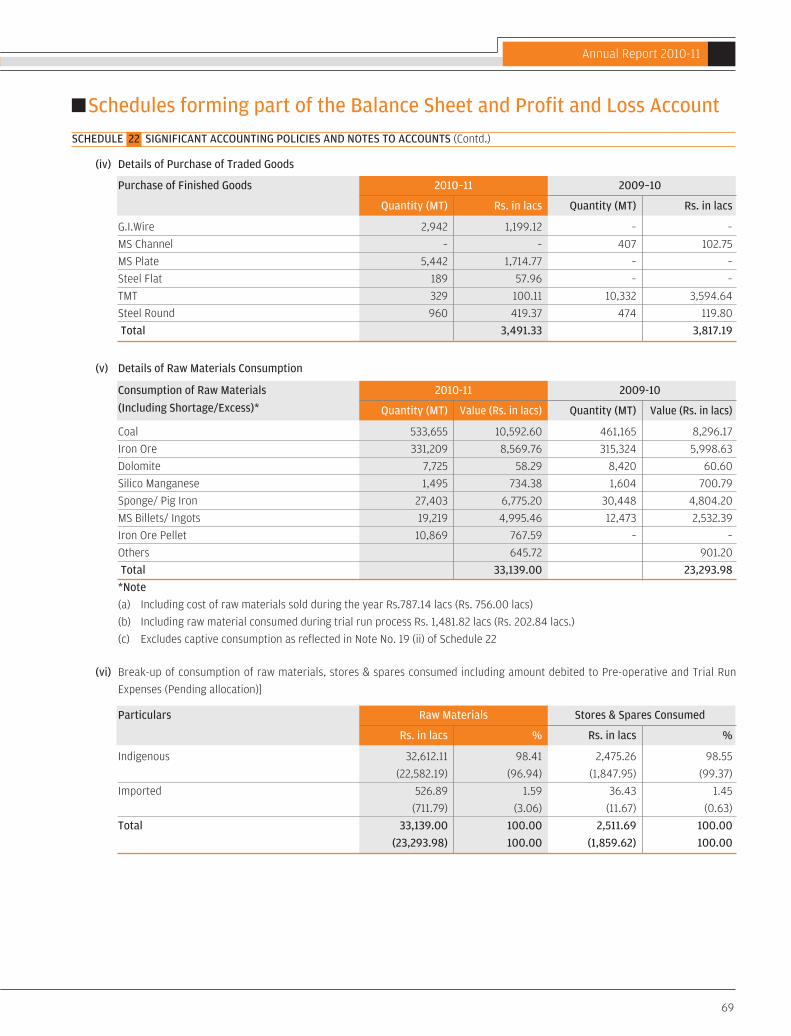
69
Annual Report 2010-11
Schedules forming part of the Balance Sheet and Profit and Loss Account
SCHEDULE 22 SIGNIFICANT ACCOUNTING POLICIES AND NOTES TO ACCOUNTS (Contd.)
(iv) Details of Purchase of Traded Goods
Quantity (MT) Rs. in lacs Quantity (MT) Rs. in lacs
G.I.Wire 2,942 1,199.12 – –
MS Channel – – 407 102.75
MS Plate 5,442 1,714.77 – –
Steel Flat 189 57.96 – –
TMT 329 100.11 10,332 3,594.64
Steel Round 960 419.37 474 119.80
Total 3,491.33 3,817.19
Purchase of Finished Goods 2010–11 2009–10
(v) Details of Raw Materials Consumption
(Including Shortage/Excess)* Quantity (MT) Value (Rs. in lacs) Quantity (MT) Value (Rs. in lacs)
Coal 533,655 10,592.60 461,165 8,296.17
Iron Ore 331,209 8,569.76 315,324 5,998.63
Dolomite 7,725 58.29 8,420 60.60
Silico Manganese 1,495 734.38 1,604 700.79
Sponge/ Pig Iron 27,403 6,775.20 30,448 4,804.20
MS Billets/ Ingots 19,219 4,995.46 12,473 2,532.39
Iron Ore Pellet 10,869 767.59 – –
Others 645.72 901.20
Total 33,139.00 23,293.98
*Note
(a) Including cost of raw materials sold during the year Rs.787.14 lacs (Rs. 756.00 lacs)
(b) Including raw material consumed during trial run process Rs. 1,481.82 lacs (Rs. 202.84 lacs.)
(c) Excludes captive consumption as reflected in Note No. 19 (ii) of Schedule 22
Consumption of Raw Materials 2010-11 2009-10
(vi) Break-up of consumption of raw materials, stores & spares consumed including amount debited to Pre-operative and Trial Run
Expenses (Pending allocation)]
Rs. in lacs % Rs. in lacs %
Indigenous 32,612.11 98.41 2,475.26 98.55
(22,582.19) (96.94) (1,847.95) (99.37)
Imported 526.89 1.59 36.43 1.45
(711.79) (3.06) (11.67) (0.63)
Total 33,139.00 100.00 2,511.69 100.00
(23,293.98) 100.00 (1,859.62) 100.00
Particulars Raw Materials Stores & Spares Consumed

70
MSP STEEL & POWER LIMITED
Schedules forming part of the Balance Sheet and Profit and Loss Account
SCHEDULE 22 SIGNIFICANT ACCOUNTING POLICIES AND NOTES TO ACCOUNTS (Contd.)
20. Value of Imports (calculated on CIF basis)(Rs. in lacs)
Particulars 2010-11 2009-10
Capital Goods 2,542.19 79.51
Stores, Spares & Consumables 36.43 11.67
Raw Materials 526.89 711.79
21. Expenditure in foreign currency (on actual remittance basis)(Rs. in lacs)
Particulars 2010-11 2009-10
Travelling 16.15 1.16
Commission – 4.72
Professional fees 12.58 –
22. Earning in foreign currency (on accrual basis)(Rs. in lacs)
Particulars 2010-11 2009-10
FOB Value of Exports (excluding sales made to Nepal in Indian rupees Rs. Nil (Rs. 73.56 lacs) ) 2,022.08 3,142.35
23. During the year, the Company has hedged its exposure in the iron and steel products by way of entering into certain commodity contracts
through the broker dealer. These contracts were settled, otherwise than through actual delivery, whereby the Company has earned an
amount of Rs. 3, 025.00 lacs on net settlement basis. Based on a legal opinion obtained, the said income has been treated as income from
normal business.
24. The Board of Directors of the Company approved the final audited financial statements for the year 2009-2010 at their meeting dated May
29, 2010. However, dividend for the year 2009-2010 was proposed by the Board of Directors in their meeting dated June 28, 2010 and
accordingly paid and accounted for in the financial statements for the year ended March 31, 2011.
25. Previous year’s figures indicated in brackets have been regrouped / rearranged where necessary to conform to this year’s classification.
Signatories to Schedules 1 to 22
As per our Report of even date
For S. R. Batliboi & Co. For and on behalf of Board of Directors
Firm Registration No.- 301003E
Chartered Accountants
per Sanjoy K. Gupta Puranmal Agrawal Suresh Kumar Agrawal
Partner Chairman Managing Director
Membership No 54968
22, Camac Street, Block C, 3rd Floor
Kolkata -700 016 Pinky Gupta
Date : 30th May, 2011 Company Secretary

71
Annual Report 2010-11
Balance Sheet Abstract and Company’s General Business Profile
For and on behalf of Board of Directors
Puranmal Agrawal Suresh Kumar AgrawalChairman Managing Director
Pinky Gupta
Date : 30th May, 2011 Company Secretary
II. Capital raised during the year (Amount in Rs. Thousands)
I. Registration Details
Balance Sheet Date 3 1 0 3 2 0 1 1
Public Issue N I L
Registration No. 27399 of 1968
Rights Issue N I L
Bonus Issue N I L Private Placement 7 5 4 0 0
III. Position of mobilisation/deployment of funds (Amount in Rs. Thousands)
Total Liabilities 1 1 3 7 7 9 9 8 Total Assets 1 1 3 7 7 9 9 8
Paid up Capital 6 5 6 4 0 0 Secured Loans 6 4 0 4 8 3 5
Reserves & Surplus 2 5 4 3 4 3 6 3
Un-secured Loans 6 4 9 9 3 7
Deferred Tax 3 3 3 7 3 4
IV. Performance of the Company (Amount in Rs. Thousands)
Turnover 5 1 3 4 5 0 3 Total Expenditure 4 4 6 3 5 0 3
Profit/Loss after Tax 5 0 2 1 1 0
Earning per share in Rs. 8 . 6 2
Item Code No. (ITC Code) 7 2 1 4 9 0 0 0
Product Description T M T B A R
Item Code No. (ITC Code) 7 2 0 3 1 0 0 0
Product Description S P O N G E I R O N
Item Code No. (ITC Code) 7 2 2 4 9 0 9 1
Product Description M . S . B I L L E T S
Dividend 5 %
Application of Funds
Sources of Funds :
Net Fixed Assets 4 9 9 9 0 7 6
V. Generic Names of Three Principal Products/Services of the Company (as per monetary terms)
Investments 6 9 5 0 1
Net Current Assets 2 1 0 0 9 1 3 Misc. Expenditure N I L
Capital Work-in-progress 3 4 1 8 8 7 9 Accumulated losses N I L
Profit/Loss before Tax 6 7 1 0 0 0
State Code 2 1
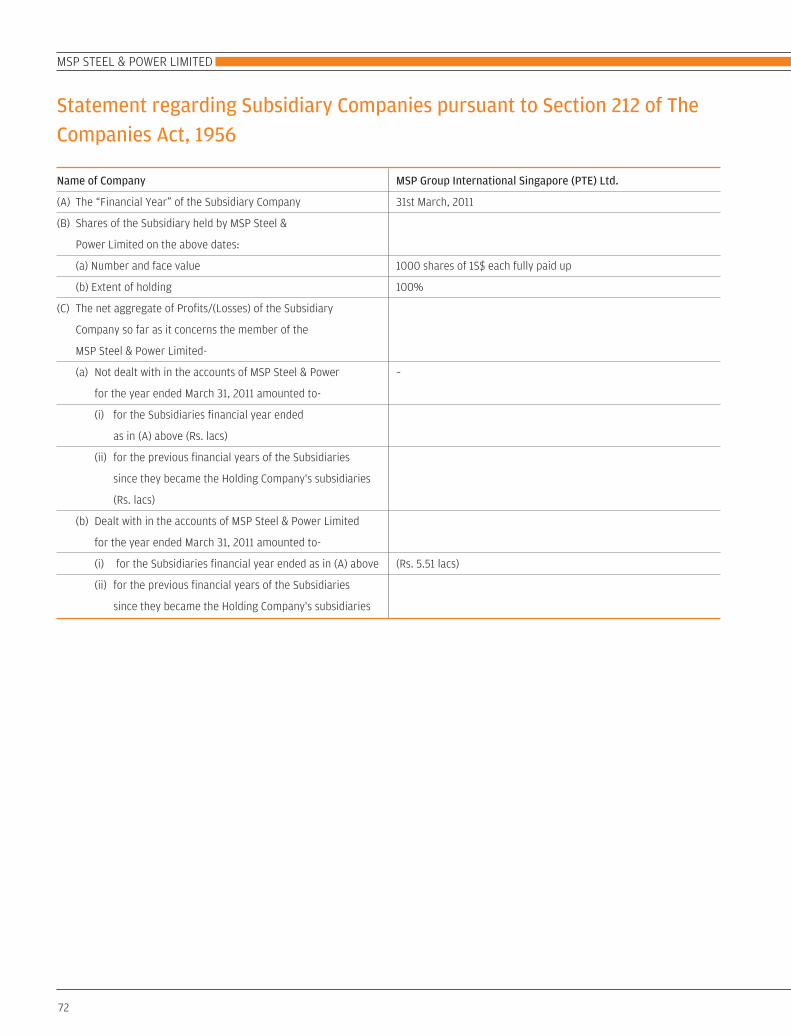
72
MSP STEEL & POWER LIMITED
Name of Company MSP Group International Singapore (PTE) Ltd.
(A) The “Financial Year” of the Subsidiary Company 31st March, 2011
(B) Shares of the Subsidiary held by MSP Steel &
Power Limited on the above dates:
(a) Number and face value 1000 shares of 1S$ each fully paid up
(b) Extent of holding 100%
(C) The net aggregate of Profits/(Losses) of the Subsidiary
Company so far as it concerns the member of the
MSP Steel & Power Limited-
(a) Not dealt with in the accounts of MSP Steel & Power –
for the year ended March 31, 2011 amounted to-
(i) for the Subsidiaries financial year ended
as in (A) above (Rs. lacs)
(ii) for the previous financial years of the Subsidiaries
since they became the Holding Company's subsidiaries
(Rs. lacs)
(b) Dealt with in the accounts of MSP Steel & Power Limited
for the year ended March 31, 2011 amounted to-
(i) for the Subsidiaries financial year ended as in (A) above (Rs. 5.51 lacs)
(ii) for the previous financial years of the Subsidiaries
since they became the Holding Company's subsidiaries
Statement regarding Subsidiary Companies pursuant to Section 212 of TheCompanies Act, 1956

73
Annual Report 2010-11
The Directors are pleased to present their report to the members
together with the financial statements of the Company for the period
ended 31st March, 2011.
1. Directors
The directors of the Company in office at the date of this report
are:
Manish Agrawal
Richa Agrawal
Ragini Dhanvantray
2. Arrangements to Enable Directors to Acquire Shares or
Debentures
Except as described in the financial statements, neither at the
end of nor at any time during the financial period was the
Company a party to any arrangement whose objects are, or one
of whose object is, to enable the Directors of the Company to
acquire benefits by means of the acquisition of shares or
debentures of the company or any other body corporate.
3. Directors’ Interests in Shares or Debentures
None of the Directors holding office at the end of the financial
period had interest in any share capital of the company and
related corporation as recorded in the register of Director's
shareholdings kept by the Company under Section 164 of the
Singapore Companies Act, Cap 50.
4. Directors’ Contractual Benefits
Except as disclosed in the financial statements, since the date
of incorporation, no Director has received or become entitled to
receive a benefit which is required to be disclosed by Section
201(8) of the Companies Act, Capter. 50 by contract made by the
company or related corporation with the Directors, or with a firm
of which the Directors are members, or with a company in which
the Directors have substantial financial interest, except for
benefits as disclosed, in the financial statements.
5. Share Options
During the year, no option to take up unissued shares of the
company was granted.
During the period, no shares of the Company were issued by
virtue of the exercise of an option to take up unissued shares.
At the end of the period, there were no unissued shares of the
Company under option.
6. Auditors
The Company is an exempt Private Company and has met the
requirement for an audit exemption.
On Behalf of the Board of Directors,
Manish Agrawal
Director
Singapore Richa Agrawal
25th May 2011 Director
Report of the Directors
MSP GROUP INTERNATIONAL (SINGAPORE) PTE. LTD. (Incorporated in Singapore)
In the opinion of the directors,
(a) The statement of financial position of the Company are drawn up so as to give a true and fair view of the state of affairs of the company
as at 31st March, 2011, and of the results, changes in equity and cash flows of the company for the financial period then ended; and
(b) At the date of this statement, there are reasonable grounds to believe that the Company will be able to pay its debts as and when they fall
due.
On Behalf of the Board of Directors,
Manish Agrawal
Director
Singapore Richa Agrawal
25th May 2011 Director
Statement by Directors

74
MSP GROUP INTERNATIONAL (SINGAPORE) PTE. LTD.
Statement of Comprehensive Income For the financial year ended 31st March, 2011
The accompanying notes form an integral part of these financial statements.
Notes 2011 2010
S$ S$
Revenue – –
Other items of expenses
Administrative expenses 4 (8,038) (2,273)
(8,038) (2,273)
LOSS BEFORE TAX FROM
CONTINUING OPERATIONS
Income tax expenses 5 – –
LOSS FOR THE YEAR/PERIOD FROM CONTINUING OPERATIONS (8,038) (2,273)
Notes 2011 2010
S$ S$
ASSETS
Current assets
Other receivable 6 3,000 3,000
Cash and cash equivalents 7 7,695 7,695
Total current assets 10,695 10,695
TOTAL ASSETS 10,695 10,695
EQUITY AND LIABILITIES
Equity
Share capital 8 1,000 1,000
Retained earnings (16,515) (8,477)
(15,515) (7,477)
Current liabilities
Other payables 9 3,994 3,994
Amount due to holding company 10 22,216 14,178
Total current liabilities 26,210 18,172
TOTAL EQUITY AND LIABILITIES 10,695 10,695
Statement of Financial Position As at 31st March, 2011
The accompanying notes form an integral part of these financial statements.

75
Annual Report 2010-11
Statement of Changes in Equity For the financial year ended 31st March, 2011
The accompanying notes form an integral part of these financial statements.
Share capital Retained earnings Total Equity
S$ S$ S$
Issuance of share capital at date of incorporation 1,000 1,000
Total comprehensive loss for the period – (8,477) (8,477)
Balance as at 31 March 2010 1,000 (8,477) (7,477)
Balance as at 1 April 2010 1,000 (8,477) (7,477)
Total comprehensive loss for the year – (8,038) (8,038)
Balance as at 31 March 2011 1,000 (16,515) (15,515)
Notes 2011 2010
S$ S$
OPERATING ACTIVITIES
Loss before income tax (8,038) (2,273)
Operating cash flows before movements in working capital (8,038) (2,273)
Changes in other receivable – –
Changes in other payables – 2,273
(8,038) –
Income taxes paid – –
Net cash used in operating activities (8,038) –
INVESTING ACTIVITY – –
FINANCING ACTIVITIES
Changes in amount due to holding company 8,038 –
Net cash generated from financing activities 8,038 –
NET INCREASE IN CASH AND CASH EQUIVALENTS – –
Cash and cash equivalents at the beginning of the year/period 7,695 7,695
CASH AND CASH EQUIVALENTS AT THE BEGINNING OF THE YEAR/PERIOD 7 7,695 7,695
Statement of Cash Flow For the financial year ended 31st March, 2011
The accompanying notes form an integral part of these financial statements.

76
MSP GROUP INTERNATIONAL (SINGAPORE) PTE. LTD.
Notes to the Financial Statements 31st March, 2011
These notes form an integral part of and should be read in conjunction with the accompanying accounts.
1. Domicile and activities
The Company (Registration Number 2008 – 18375 - D) is incorporated and domiciled in Singapore with its principal place of business and
Registered Office at 20, Cecil Street, #14-01, Equity Plaza, Singapore 049705.
The principal activities of the Company are general wholesale trade, including general importers and exporters and other personal service
activities necessary.
The Company is wholly owned by M.S.P. Steel & Power Limited, incorporated in India.
The statement of financial position of the Company for the financial year ended 31st March, 2011 were authorised for issue by the Board
of directors on 25th May, 2011.
2. Summary of significant accounting policies
a) Statement of compliance
In the current financial period, the Company has adopted all the new and revised FRS and INT FRS that are relevant to its operations
and effective for the current financial period. The adoption of these new / revised FRS and INT FRS does not result in changes to the
Company's accounting policies and has no material effect on the amount reported for the current or prior years.
b) Basis of preparation
The financial statements have been drawn up in accordance with the provisions of the Singapore Companies Act, Chapter 50 and
Singapore Financial Reporting Standards (FRS) including related Interpretations of FRS (INT FRS) and are prepared under the historical
cost convention, except as disclosed in the accounting policies below.
The financial statements of the Company are measured and presented in the currency of the primary economic environment in which
the entity operates (its functional currency). The statements of financial position of the Company are presented in Singapore dollar
which is the functional currency of the Company and the presentation currency financial statements.
The preparation of the financial statements in conformity with FRS requires management to make judgments, estimates and
assumptions that affect the Company's application of accounting policies and reported amounts of assets, liabilities, revenue and
expenses. Although these estimates are based on management's best knowledge of current events and actions, actual results may
differ from those estimates.
c) Cash and cash equivalents
Cash and cash equivalents comprise of deposits in the bank.
d) Income tax
Income tax expense represents the sum of the tax currently payable and deferred tax. The tax currently payable is based on taxable
profit for the period. Taxable profit differs from profit as reported profit or loss because it excludes items of income or expense that
are taxable or deductible in other years and it further excludes items that are not taxable or tax deductible.
Deferred tax is recognized on the differences between the carrying amounts of assets and liabilities in the financial statements and
the corresponding tax bases used in the computation of taxable profit, and are accounted for using the balance sheet liability method.
Deferred tax liabilities are generally recognized for all taxable temporary differences and deferred tax assets are recognized to the
extent that it is probable that taxable profits will be available against which deductible temporary differences can be utilised. Such
assets and liabilities are not recognized if the temporary difference arises from goodwill or from the initial recognition (other than
in a business combination) of other assets and liabilities in a transaction that affects neither the taxable profit nor the accounting profit.
The carrying amount of deferred tax assets is reviewed at the end of each financial period and reduced to the extent that it is no longer
probable that sufficient taxable profits will be available to allow all or part of the assets to be recovered.
Deferred tax is calculated at the tax rates that are expected to apply in the year when the liability is settled or the assets realised based
on the tax rates (and tax laws) that have been enacted or substantively enacted by the end of the financial year. Deferred tax is
charged or credited to profit or loss, except when it relates to items charged or credited directly to equity, in which case the deferred
tax is also dealt with in equity.
Deferred tax assets and liabilities are offset when there is a legally enforceable right to set off current tax assets against current tax

77
Annual Report 2010-11
Notes to the Financial Statements 31st March, 2011 (Contd.)
liabilities and when they relate to income taxes levied by the same taxation authority and the Company intends to settle its current
tax assets and liabilities on a net basis.
Current and deferred tax are recognised as an expense or income in profit or loss, except when they relate to items credited or
debited directly to equity, in which case the tax is also recognised directly in equity, or where they arise from the initial accounting
for a business combination. In the case of a business combination, the tax effect is taken into account in calculating goodwill or
determining the excess of the acquirer's interest in the net fair value of the acquiree's identifiable assets, liabilities and contingent
liabilities over cost.
e) Share capital
Proceeds from issuance of ordinary shares are recognized as share capital in equity.
f) Financial instruments
Financial assets and liabilities are recognized on the Company's statement of financial position when the Company becomes a party
to the contractual provisions of the instrument.
Financial assets
All financial assets are recognized on a trade date where the purchase of a financial asset is under a contract whose terms require
delivery of the financial asset within the timeframe established by the market concerned, and are initially measured at fair value, plus
transaction costs, except for those financial assets classified as at fair value through profit or loss, which are initially measured at fair
value.
Financial assets are classified into the following specified categories : financial assets at fair value through profit or loss and loans
and receivable. The classification depends on the nature and purpose for which these financial assets were acquired and is determined
at the time of initial recognition.
Loans and receivables
Trade receivables, loan and other receivables that have fixed or determinable payments that are not quoted in active market are
classified as loans and receivables. Loans and receivables are measured at amortised cost, using the effective interest method less
impairment. Interest is recognized by applying the effective interest rate method, except for short-term receivables when the
recognition of interest would be immaterial.
Impairment of financial assets
Financial assets are assessed for indicators of impairment the end of each financial period. Financial assets are impaired where
there is objective evidence that, as a result of one or more events that occurred after the initial recognition of the financial asset, the
estimated future cash flows of the investment have been impacted.
For financial assets carried, at amortised cost, the amount of the impairment is the difference between the asset's carrying amount
and the present value of estimated future cash flows, discounted at the original effective interest rate.
The carrying amounts of all financial assets are reduced by the impairment loss directly with the exception of trade receivables where
the carrying amount is reduced through the use of an allowance account. Changes in the carrying amount of the allowance account
are recognized in profit or loss.
With the exception of available-for-sale equity instruments, if, in a subsequent year, the amount of the impairment loss decrease can
be related objectively to an event occurring after the impairment loss was recognized, the previously recognized impairment loss is
revered through profit or loss to the extent the carrying amount of the investment at the date the impairment is reversed does not
exceed what the amortised cost would have been had the impairment not been recognized.
Derecognition of financial assets
The Company derecognises a financial asset only when the contractual rights to the cash flows from the asset expire, or it transfers
the financial asset and substantially all the risks and rewards of ownership of the asset to another entity. If the Company neither
transfers nor retains substantially all the risks and rewards of ownership of the financial asset and continues to control the transferred
asset, the Company recognises its retained interest in the asset and an associated liability for amounts it may have to pay. If the
Company retains substantially all the risks and rewards of ownership of a transferred financial asset, the Company continues to
recognise the financial asset and also recognises a collateralised borrowing for the proceeds receivables.

78
MSP GROUP INTERNATIONAL (SINGAPORE) PTE. LTD.
Notes to the Financial Statements 31st March, 2011 (Contd.)
Financial liabilities and equity instruments
Classification as debt or equity
Financial liabilities and equity instruments issued by Company are classified according to the substance of the contractual
arrangements entered into and the definitions of a financial liability and an equity instrument.
Financial liabilities
Financial liabilities are classified as either financial liabilities at fair value through profit or loss or other financial liabilities.
Financial liabilities are classified as at fair value through profit or loss if the financial liability is either held for trading or it is designated
as such upon initial recognition.
Other financial liabilities
Trade and other payables
Trade and other payables are initially measured at fair value, net of transaction costs, and are subsequently measured at amortised
cost, where applicable, using the effective interest rate method, with interest expense recognized on an effective yield basis.
Derecognition of financial liabilities
The Company derecognises financial liabilities when, the Company's obligations are discharged, cancelled or they expire.
g) Provisions
Provisions are recognized when the Company has a present legal or constructive obligation as a result of a past event, it is probable
that the Company will be required to settle the obligation, and a reliable estimate can be made of the amount of the obligation. The
amount recognized as a provision is the best estimate of the consideration required to settle the present obligation at the end of the
financial year, taking into account the risks and uncertainties surrounding the obligation. Where a provision is measured using the
cash flows estimated to settle the present obligation, its carrying amount is the present value of those cash flows.
When some or all of the economic benefits required to settle a provision are expected to be recovered from a third party, the
receivable is recognized as an asset if it is virtually certain that reimbursement will be received and the amount of the receivable can
be measured reliably.
Changes in the estimated timing or amount of the expenditure or discount rate are recognized in profit or loss when the changes arise.
3. Critical accounting judgments and key sources of estimation uncertainly
In the application of the Company's accounting policies, which are described in Note 2, management made judgments, estimates and
assumptions about the carrying amounts of assets and liabilities that were not readily apparent from other sources. The estimates and
associated assumptions were based on historical experience and other factors that were considered to be reasonable under the
circumstances. Actual results may differ from these estimates.
These estimates and underlying assumptions are reviewed on an ongoing basis. Revisions to accounting estimates are recognized in the
period in which the estimate is revised if the revision affects only that period, or in the period of the revision and future years if the
revision affects both current and future periods.
a) Critical judgements in applying the entity’s accounting policies
Management is of the opinion that there is no critical judgement (other than those involving estimates) that has a significant effect
on the amounts recognised in the financial statements.
b) Key sources of estimation uncertainty
The key assumptions concerning the future and other key sources of estimation uncertainly at the end of the financial year, that
have a significant risk of causing a material adjustment to the carrying amounts of assets and liabilities within the next financial year,
are discussed below.
Going concern
The financial statements have been prepared on a going concern basis. The Company incurred a net loss of S$ 16,515 for the financial
period ended 31st March, 2011 and as at that date, the Company's total current and total liabilities exceed its total current and total

79
Annual Report 2010-11
Notes to the Financial Statements 31st March, 2011 (Contd.)
4. Administrative expenses
2011 2010
S$ S$
Professional fees 6,183 1,702
Secretarial fee 1,855 250
Tax fee – 321
8,038 2,273
7. Cash and cash equivalents
2011 2010
S$ S$
Cash at bank 7,695 7,695
Cash and cash equivalents 7,695 7,695
8. Share capital
2011 2010
S$ S$
Issued and fully paid
1,000 ordinary shares of $1 each 1,000 1,000
The holders of ordinary shares are entitled to receive dividends as and when declared by the Company. All ordinary shares carry one
vote per share without restrictions. The ordinary shares have no par value.
9. Other payables
2011 2010
S$ S$
Accrual 2,140 2,140
Others 1,854 1,854
3,994 3,994
5. Income tax
No provision for tax is made as the Company is in a tax loss position.
Deferred tax benefits arising from these losses have not been recognized in the accounts owing to the uncertainly of their realisation in
the foreseeable future.
6. Other receivable
2011 2010
S$ S$
Deposit 3,000 3,000
assets by S$15,515. These factors indicate the existence of a material uncertainly which may cast significant doubt about the Company's
ability to continue as a going concern. However, the Company is able to meet its financial obligations and to continue as a going
concern based on the Company generating profits in the near future, sufficient positive cash flows from its operations and/or having
continued financial support from the Directors and the holding Company.
80
Notes to the Financial Statements 31st March, 2011 (Contd.)
10. Amount due to holding company
The amount due to holding company in non-trade, unsecured, non-interest bearing and with no fixed terms of repayment.
11. Financial risk management
The main risks arising from the Company's financial instruments are liquidity risk and fair value of financial assets and liabilities. The
policies for managing the risks are summarized below:
(a) Liquidity risk
Liquidity risk is the risk that the Company is unable to pay its debts as and when they fall due. To mitigate this risk, the Company
receives funds from Directors and shareholder as and when necessary. Liquidity risk arises if such financial support is abruptly
withdrawn.
(b) Foreign exchange risk
The Company is not exposed to any foreign exchange risks.
(c) Interest rate risk
The Company is not exposed to significant market risk for changes in interest rates as the Company has no loans and borrowings which
are subject to interest charge.
(d) Fair value of financial assets and liabilities
The carrying amounts of financial assets and financial liabilities recorded in the financial statements represent their respective net
fair values.
12. Comparative Figures
The comparative figures for the financial period are in respect of the financial year 2009-10.
MSP GROUP INTERNATIONAL (SINGAPORE) PTE. LTD.

81
Annual Report 2010-11
We, the Directors of MSP GROUP INTERNATIONAL (SINGAPORE) PTE> LTD., hereby agree that the Report of the Directors and the accompanying
Financial Statements prepared by Rikvin Pte Ltd in accordance with statutory provisions in force at the time of preparation in strictly based on
the information provided by the MSP GROUP INTERNATIONAL (SINGAPORE) PTE. LTD.
The Directors of MSP GROUP INTERNATIONAL (SINGAPORE) PTE. LTD. will not hold Rikvin Pte Ltd liable on any grounds whatsoever to any party
in respect of reliance on the information contained in this report.
For MSP Group International (Singapore) Pte. Ltd. Manish Agrawal Richa Agrawal
Date: 25th May 2011 Director Director
Detailed Income Statement For the year ended 31st March, 2011
The above statement does not form part of the financial statements of the Company and is prepared solely for tax purposes.
2011 2010
S$ S$
Revenue – –
Less : (Schedule 1)
Administrative expenses 8,038 (2,273)
Loss before taxation 8,038 (2,273)
Schedule 1
Personal Indemnity
2011 2010
S$ S$
Administrative Expenses
Professional fees 6,183 1,702
Secretarial fee 1,855 250
Tax fee – 321
8,038 2,273

82
MADANPUR SOUTH COAL COMPANY LTD.
Auditors’ Report
To
The Members of
Madanpur South Coal Company Ltd.
1. We have audited the attached balance sheet of Madanpur South
Coal Company Ltd as at 31st March, 2011 and the Profit & Loss
Account for the year ended on that date annexed thereto. These
financial statements are the responsibility of the company’s
management. Our responsibility is to express an opinion on these
financial statements based on our audit.
2. We conducted our audit in accordance with the auditing standards
generally accepted in India. Those standards require that we plan
and perform the audit to obtain reasonable assurance about
whether the financial statements are free of material
misstatement. An audit includes examining, on a test basis,
evidence supporting the amounts and disclosures in the financial
statements. An audit also includes assessing the accounting
principles used and significant estimates made by the
management, as well as evaluating the overall financial statement
presentation. We believe that our audit provides a reasonable
basis for our opinion.
3. As required by the Companies (Auditors' Report) Order, 2003 (As
amended) issued by the Central Government of India, in terms of
sub section (4A) of Section 227 of the Companies Act, 1956. We
enclose in the Annexure a statement on the matter specified in
paragraphs 4 and 5 of the said order.
4. Further to our comment in the Annexure referred to above, we
report that:
i) We have obtained all the information and explanations, which
to the best of our knowledge and belief were necessary for
the purposes of our audit;
ii) In our opinion, proper books of account as required by law
have been kept by the Company so far as appears from our
examination of the books;
iii) The Balance Sheet and Profit & Loss Account dealt with by
this report are in agreement with the books of account;
iv) In our opinion, the Balance Sheet and Profit & Loss Account
dealt with by this report complies with the Accounting
standards referred to in sub-section (3C) of Section 211 of the
Companies Act, 1956;
v) On the basis of written representations received from the
directors as on 31st March 2011 and taken on record by the
Board of Directors, we report that none of the Directors is
disqualified as on 31st March 2011 from being appointed as a
Director in terms of clause (g) of sub-section (1) of Section
274 of the Companies Act, 1956;
vi) In our opinion and to the best of our information and
according to the explanations given to us, the said accounts
read alongwith the notes thereon, give the information
required by the Companies Act, 1956, in the manner so
required and give a true and fair view in conformity with the
accounting principles generally accepted in India:
a) in the case of the balance sheet, of the state of the affairs
of the Company, as at 31st March, 2011; and
b) in the case of the Profit & Loss Account, of the Loss for
the year ended on that date.
For O P Singhania & Co.
Firm Reg. No. 002172C
Chartered Accountants
Sanjay Singhania
Place : Raipur Partner
Date : 02.06.2011 Membership No. 076961

83
Annual Report 2010-11
Annexure to the Auditors’ Report
Re: Madanpur South Coal Company Limited
Referred to in paragraph 3 of our report of even date,
i) (a) The Company has maintained the proper records showing
full particulars, including quantitative details and situation
of fixed assets.
(b) Thee fixed assets have been physically verified by the
management at reasonable intervals. No material
discrepancies were noticed on such verification.
(c) The company has not disposed off any part of its fixed
assets so as to affect its going concern status.
(ii) As there was no inventories, therefore, the provisions of clause
4(ii), (a), (b) and (c) of the Companies (Auditor's Report) Order,
2003 are not applicable to the company.
(iii) According to the information and explanation given to us the
company has not granted/taken any loans to/from any
companies, firms or other parties covered in the register
maintained under section 301 of the Companies Act, 1956.
Therefore, the provisions of clause-4 (iii)(a), (b), (c), (d), (e), (f)
and (g) of the Companies (Auditor's Report) Order, 2003 are not
applicable to the company.
(iv) In our opinion and according to the information & explanations
given to us there are adequate internal control procedures
commensurate with the size of the company and nature of its
business for the purchase of fixed assets and services. During
the course of our audit, we have not observed any continuing
failure to correct major weaknesses in internal controls.
(v) According to the information & explanations given to us, there
was no transactions made with the company, firms or other
parties that need to be entered in the register maintained under
Section 301 of the Companies Act, 1956, therefore, the
provisions of clause 4(v)(a) and (b) of the Companies (Auditor's
Report) Order, 2003 are not applicable to the company.
(vi) According to the information and explanations given to us, the
company has not accepted any deposits from the public with in
the meaning of section 58A and 58AA of the Act and the rules
framed thereunder.
(vii) In our opinion the company has an internal audit system
commensurate with the size and nature of its business.
(viii) As informed to us, the Central Govt has not prescribed for the
maintenance of cost record under section 209(1)(d) of the
Companies Act, 1956, therefore, the provisions of clause 4(viii)
of the Companies (Auditor's Report) Order, 2003 are not
applicable to the company.
(ix) (a) The company is generally regular in depositing with
appropriate authorities undisputed statutory dues
including provident fund, investor's education and
protection fund, employees' state insurance, income tax,
wealth tax, sales tax, service tax, custom duty, excise duty,
cess and other material statutory dues applicable to it.
According to the information & explanations given to us,
no undisputed amounts payable in respect of statutory
dues as stated above were in arrears as at 31st March 2011
for a period of more than six months from the date they
became payable.
(b) According to the information and explanations given to
us, there are no statutory dues in respect of income tax,
sales tax, wealth tax, service tax, custom duty, excise duty
and cess which have not been deposited on account of
any dispute.
(x) The company's accumulated loss are not more than fifty percent
of its net-worth and has not incurred cash losses during the
financial year covered by our audit and also in the immediately
preceeding financial year.

84
MADANPUR SOUTH COAL COMPANY LTD.
(xi) As the Company has not taken any loans from banks or financial
institutions and also has not issued any debentures, therefore,
the provisions of clause 4(xi) of the Companies (Auditor's
Report) Order, 2003 are not applicable to the company.
(xii) In our opinion and according to the information and
explanations given to us, the company has not granted any
loans & advances on the basis of security by way of pledge of
securities. Therefore, the provisions of clause 4(xii) of the
Companies (Auditor's Report) Order, 2003 are not applicable to
the company.
(xiii) In our opinion, the company is not a chit fund or a nidhi/mutual
benefit fund/society.
Therefore, the provisions of clause 4(xiii) of the Companies
(Auditor's Report) Order, 2003 are not applicable to the
company.
(xiv) In our opinion and according to information and explanations
given to us, the company does not have any transactions and
contracts related to dealing or trading in shares, securities,
debentures and other investments, therefore, the provisions of
clause 4(xiv)of the Companies (Auditor's Report) Order, 2003
are not applicable to the company.
(xv) In our opinion and according to the information and
explanations given to us, the company has not given any
guarantee for loans taken by others from banks or financial
institutions. Therefore, the provisions of clause 4(xv) of the
Companies (Auditor's Report) Order, 2003 are not applicable to
the company.
(xvi) As there was no term loan from banks, therefore, the provisions
of clause 4(xvi) of the Companies (Auditor's Report) Order, 2003
are not applicable to the company.
(xvii) As there as no short term loan from banks, therefore, the
provisions of clause 4(xvii) of the Companies (Auditor's Report)
Order, 2003 are not applicable to the company.
(xviii) The company has not made any preferential allotment of shares
during the year. Therefore, the provisions of clause 4(xviii) of
the Companies (Auditor's Report) Order, 2003 are not
applicable to the company.
(xix) The company has not issued any debentures during the year;
therefore, the provisions of clause 4(xix) of the Companies
(Auditor's Report) Order, 2003 are not applicable to the
company.
(xx) The company has not raised any money by way of public issue
during the year. Therefore, the provisions of clause 4(xx) of the
Companies (Auditor's Report) Order, 2003 are not applicable to
the company.
(xxi) In our opinion and according to the information and
explanations given to us, no fraud on or by the company has
been noticed or reported during the year. Therefore, the
provisions of clause 4(xxi) of the Companies (Auditor's Report)
Order, 2003 are not applicable to the company.
For O P Singhania & Co.
Firm Reg. No. 002172C
Chartered Accountants
Sanjay Singhania
Place : Raipur Partner
Date : 02.06.2011 Membership No. 076961
Annexure to the Auditors’ Report (Contd.)

85
Annual Report 2010-11
As per our Report of even date
For O. P. Singhania & Co. On behalf of the Board of Directors
Firm Regn No. 002172C
Chartered Accountants
Sanjay Singhania G. K. Chhanghani
Partner Director
Membership No. 076961
Place : Raipur Alok Choudhary
Date : 02.06.2011 Director
(Amount in Rs.)
Schedule As at As at31st March, 2011 31st March, 2010
I. SOURCES OF FUNDS
Shareholders' Funds
a) Capital “A” 9,119,110.00 9,119,110.00
b) Share Application Money Pending Allotment 28,537,002.00 184,726.61
c) Reserves & Surplus “B” 106,043,568.09 106,043,568.09
143,699,680.09 115,347,404.70
Loan Funds
a) Secured Loans
b) Unsecured Loans “C” 600,000.00 600,000.00
600,000.00 600,000.00
Total 144,299,680.09 115,947,404.70
II. APPLICATION OF FUNDS
Fixed Assets “D”
Gross Block 26,112,313.00 26,277,978.00
Less: Depreciation 371,078.00 201,826.00
Net Block 25,741,235.00 26,076,152.00
Work in Progress including Pre-operative expenses & Advances 64,833,830.90 59,395,163.90
90,575,065.90 85,471,315.90
Investments
Deferred Tax Assets (Net) 112,704.00 46,821.00
Current Assets, Loans & Advances
a) Cash & Bank Balances “E” 52,199,438.19 28,868,575.80
b) Loans & Advances “F” 1,159,314.00 1,480,241.00
53,358,752.19 30,348,816.80
Less: Current Liabilities & Provisions “G” 48,450.00 107,265.00
Net Current Assets 53,310,302.19 30,241,551.80
MISCELLANEOUS EXPENDITURE
(To the extent not written off or Adjusted)
Preliminary Expenses 106,080.00 141,440.00
PROFIT & LOSS ACCOUNT 195,528.00 46,276.00
301,608.00 187,716.00
Total 144,299,680.09 115,947,404.70
Notes to the Accounts “H”
Balance Sheet As at 31st March, 2011

86
MADANPUR SOUTH COAL COMPANY LTD.
As per our Report of even date
For O. P. Singhania & Co. On behalf of the Board of Directors
Firm Regn No. 002172C
Chartered Accountants
Sanjay Singhania G. K. Chhanghani
Partner Director
Membership No. 076961
Place : Raipur Alok Choudhary
Date : 02.06.2011 Director
(Amount in Rs.)
Particulars Schedule Year ended Year ended31st March, 2011 31st March, 2010
INCOME
Interest received 90,759.00 111,068.00
90,759.00 111,068.00
EXPENDITURE
Filing Fees 6,353.00 8,860.00
Audit fees 16,545.00 16,545.00
Miscellaneous Expenditure Written off 35,360.00 35,360.00
Legal & Professional Fees 800.00 0.00
Loss on sale of fixed assets 43,464.00 0.00
Depreciation 201,453.00 143,400.00
303,975.00 204,165.00
Profit (Loss) for the year before Tax (213,216.00) (93,097.00)
Provision for current income-tax – –
Tax related to earlier year (1,919.00) –
Deferred Tax Adjustment (Net) 65,883.00 46,821.00
Profit(Loss) For The Year After Tax (149,252.00) (46,276.00)
Balance brought forward from previous year (46,276.00) –
Balance carried to Balance Sheet (195,528.00) (46,276.00)
Notes to the Accounts "H'
Profit and Loss Account For the year ended 31st March, 2011

87
Annual Report 2010-11
GROSS BLOCK DEPRECIATION NET BLOCK
Particulars As at Addition Deduction As at Up to For Adjustment Upto As at As at
01.04.2010 during during 31.03.2011 31.03.2010 the year during 31.03.2011 31.03.2011
the year the year the year 31.03.2010
Freehold Land 25,104,420.00 – – 25,104,420.00 – – – – 25,104,420.00 25,104,420.00
Furniture & Fixtures 304,674.00 – 139,315.00 165,359.00 47,685.00 34,825.00 28,099.00 54,411.00 110,948.00 256,989.00
Office Equipment 243,340.00 – 26,350.00 216,990.00 22,613.00 28,922.00 4,102.00 47,433.00 169,557.00 220,727.00
Vehicle 491,584.00 – – 491,584.00 67,061.00 109,909.00 – 176,970.00 314,614.00 424,523.00
Computer 133,960.00 – – 133,960.00 64,467.00 27,797.00 – 92,264.00 41,696.00 69,493.00
26,277,978.00 – 165,665.00 26,112,313.00 201,826.00 201,453.00 32,201.00 371,078.00 25,741,235.00 26,076,152.00
Schedules forming part of the Balance Sheet
SCHEDULE A SHARE CAPITAL
Particulars As at As at31st March, 2011 31st March, 2010
Authorised
1000000 (1000000) Equity Share of Rs. 10/- each 10,000,000.00 10,000,000.00
Issued, Subscribed and Paid Up:
911911 (911911) Equity Share of Rs. 10/- each fully paid up 9,119,110.00 9,119,110.00
9,119,110.00 9,119,110.00
(Amount in Rs.)
SCHEDULE E CASH & BANK BALANCES
As at As at31st March, 2011 31st March, 2010
Cash in hand (as certified by the management) 1,042,000.00 2,381,221.00
Balances with Scheduled Banks
On Current Account 27,299,665.19 887,354.80
On Deposit Account* 23,857,773.00 25,600,000.00
52,199,438.19 28,868,575.80
• Pledged with Bank against Bank Guarantee
SCHEDULE B RESERVES & SURPLUS
Securities Premium Account
As per last account 106,043,568.09 91,793,188 09
Addition during the year – 14,250,380.00
106,043,568.09 106,043,568.09
SCHEDULE C UNSECURED LOANS
Other Loans & Advances
From Body Corporates other than Bank 600,000.00 600,000.00
600,000.00 600,000.00
SCHEDULE D FIXED ASSETS

88
MADANPUR SOUTH COAL COMPANY LTD.
Schedules forming part of the Balance Sheet
SCHEDULE F LOANS & ADVANCES (UNSECURED, CONSIDERED GOOD)
Particulars As at As at31st March, 2011 31st March, 2010
Advances recoverable in cash or in kind or for value to be received 128,972.00 100,699.00Deposit with others 29,000.00 54,500.00TDS Receivable 889,274.00 1,150,138.00Interest accrued on FDR 112,068.00 174,904.00
1,159,314.00 1,480,241.00
(Amount in Rs.)
SCHEDULE G CURRENT LIABILITIES & PROVISIONS
Other Liabilities 48,450.00 107,265.0048,450.00 107,265.00
SCHEDULE H NOTES TO THE ACCOUNTS
1. Significant Accounting Policiesa) Accounting Convention
The accounts of the company are prepared under the historical cost convention using the accrual method of accounting in accordancewith the generally accepted accounting principles in India and the provisions of the Companies Act, 1956.
b) Fixed AssetsFixed Assets are stated at cost less depreciation. All costs including incidental expenses incurred in relation to acquisition andinstallation till the assets is put to commercial use are capitalized.
c) DepreciationDepreciation is provided on Written Down Value Method based on estimated useful life of the assets which is same as envisaged inSchedule XIV of the Companies Act, 1956.
d) Capital Work In Progress/Project ExpensesProjects under commissioning and other capital work in progress are carried at cost, comprising direct cost, related incidentalexpenses, attributed cost and advances for capital goods. Expenses incurred on exploration of new projects are to be capitalised inthe relevant period on execution If project is dropped, the expenditure incurred till date is to be charged to Profit & Loss Account.
e) Borrowing CostBorrowing Cost attributable to the acquisition/construction of qualifying assets are capitalized and added to the cost of relatedassets. Other borrowings cost are recognised as an expense in the period in which they are incurred.
f) Contingent LiabilitiesLiabilities which are material and whose future outcome cannot be reasonably ascertained are treated as contingent and not providedfor and disclosed by way of notes to the accounts.
g) Taxes on IncomeCurrent Taxes are accounted based on provisions of Income Tax Act, 1961.
Deferred Tax is recognized, subject to the consideration of prudence, in timing differences between taxable income and accountingincome that originate in one period and are capable of reversal in one or more subsequent periods
h) Impairment of AssetsThe Company assesses at each balance sheet date whether there is any indication that any asset may be impaired. If any suchindication exists, the carrying value of such assets is reduced to its estimated recoverable amount and the amount of such impairmentloss is charged to profit & loss account If at the balance sheet date there is an indication that previously assessed impairment lossno longer exists, then such loss is reversed and the asset is restated to that effect.
i) Earnings per ShareBasic earnings per share are calculated by dividing the net profit or loss for the period attributable to equity shareholders by weightedaverage number of equity shares outstanding during the period. The weighted average number of equity shares outstanding duringthe period are adjusted for events of bonus issue: bonus element in a right issue to existing shareholders.

89
Annual Report 2010-11
Schedules forming part of the Balance Sheet and Profit and Loss Account
3. Estimated amount of contracts remaining to be executed on capital accounts Rs. 34.34 lacs (Previous Year Rs. 34.64 lacs)
2. Contingent Liabilities not provided for in respect of (Amount in Rs.)
Particulars 2010-11 2009-10
Counter guarantee given to Bank against Bank Guarantee issued 436,200,000 436,000,000
4. Earnings per Share (Amount in Rs.)
Particulars 2010-11 2009-10
Net Profit after tax (149,252.00) (46,276.00)
Weighted average No. of Equity Shares of Rs 10/- each 911911 846567
Basic and Diluted earning per share (0.16) (0.05)
6. Payment to Auditors (Amount in Rs.)
Particulars 2010-11 2009-10
Towards Audit Fees 16,545.00 16,545.00
Towards Other Matters 8,273.00 00.00
5. Accounting for Taxes on Income
As required by Accounting Standard-22 “Accounting for Taxes on Income”, issued by ICAI, the Company has recognised the deferred tax.
The details of major components are as under-
7. There is no additional information as required by paragraph 3, 4(c) and 4(d) of Part II of Schedule VI to the Companies Act, 1956.
8. The previous year figures are regrouped/rearranged wherever necessary.
(Amount in Rs.)
Particulars Balance Arising Balancecarried As at during the year carried As at
1st April, 2010 31st March, 2011
Deferred Tax LiabilitiesTiming difference between book and tax depreciation (5,950.00) 31,302.00 25,352.00Deferred Tax AssetsCarried Forward Unabsorbed Depreciation 52,771.00 34,581.00 87,352.00Net Deferred Tax Assets (Liability) 46,821.00 65,883.00 112,704.00
As per our Report of even date
For O. P. Singhania & Co. On behalf of the Board of Directors
Firm Regn No. 002172C
Chartered Accountants
Sanjay Singhania G. K. Chhanghani
Partner Director
Membership No. 076961
Place : Raipur Alok Choudhary
Date : 02.06.2011 Director

90
MADANPUR SOUTH COAL COMPANY LTD.
Balance Sheet Abstract and Company’s General Business Profile
On behalf of Board of Directors
G. K. Chhanghani Director
Place : Raipur Alok ChoudharyDate : 02.06.2011 Director
Additional information as required under Part IV of Schedule VI to the Companies Act, 1956
II. Capital raised during the year (Amount in Rs. Thousands)
I. Registration Details
Balance Sheet Date 3 1 0 3 2 0 1 1
Public Issue N I L
Registration No. U10300CT2006PLC02006
Rights Issue N I L
Bonus Issue N I L Private Placement N I L
III. Position of mobilisation/deployment of funds (Amount in Rs. Thousands)
Total Liabilities 1 4 4 3 4 8 Total Assets 1 4 4 3 4 8
Paid up Capital 9 1 1 9 Share Application Money 2 8 5 3 7
Reserves & Surplus 1 0 6 0 4 4
Un-secured Loans 6 0 0
Secured Loans N I L
IV. Performance of the Company (Amount in Rs. Thousands)
Turnover (Gross Receipts) 9 1 Total Expenditure 3 0 4
Profit/(Loss) after Tax ( 1 4 9 )
On Preference Shares
Dividend Rate Including Special Dividend, If any
N I L
Item Code No. (ITC Code) N A
Product Description N A
Item Code No. (ITC Code) N A
Product Description N A
On Equity Shares N I L
Application of Funds
Sources of Funds :
Net Fixed Assets 9 0 5 7 5
V. Generic Names of Principal Products, Services of the Company (as per monetary terms)
Investments N I L
Deferred Tax Assets 1 1 3 Misc. Expenditure 1 0 6
Accumulated losses 1 9 6Net Current Assets 5 3 3 1 0
Profit/(Loss) before Tax ( 2 1 3 )
Earning per share in Rs. ( 0 . 1 6 )
State Code 1 0

91
Annual Report 2010-11
Consolidated Auditors’ Report
To
The Board of Directors
MSP Steel & Power Limited
1. We have audited the attached consolidated balance sheet of MSP
Steel & Power Limited (“the Company”) its subsidiary and joint
venture together referred as “the Group”, as at March 31, 2011,
and the related statement of consolidated profit and loss, and
the consolidated cash flow statement for the year ended on that
date annexed thereto. These financial statements are the
responsibility of the MSP Steel & Power Limited’s management
and have been prepared by the management on the basis of
separate financial statements and other financial information
regarding components. Our responsibility is to express an opinion
on these financial statements based on our audit.
2. We conducted our audit in accordance with the auditing standards
generally accepted in India. Those Standards require that we plan
and perform the audit to obtain reasonable assurance about
whether the financial statements are free of material
misstatement. An audit includes examining, on a test basis,
evidence supporting the amounts and disclosures in the financial
statements. An audit also includes assessing the accounting
principles used and significant estimates made by management,
as well as evaluating the overall financial statement presentation.
We believe that our audit provides a reasonable basis for our
opinion.
3. As indicated in Note No 1(i)(e) on Schedule 22, the financial
statements of MSP Group International (Singapore) PTE. Ltd, a
wholly owned subsidiary, which reflect total assets of Rs. 3.84
lacs as at March 31, 2011, total expenditure of Rs. 2.81 lacs and
cash flows amounting to Rs. Nil for the year then ended have been
consolidated based on unaudited financial statements as
furnished to us, which has been relied upon by us
4. We did not audit the financial statement of Madanpur South Coal
Company Ltd, a joint venture company whose share of total assets
in the Group is Rs. 213.47 lacs as at March 31, 2011 and share of
total revenue and share of cash flows (net cash inflow) is Rs.0.14
lacs and Rs. 37.93 lacs respectively for the year then ended. These
financial statements and other financial information have been
consolidated in these accounts on the basis of unaudited financial
statements as certified by the management and our opinion, in so
far as it relates to the amounts included in respect of this joint
venture, is based on such certified unaudited financial
statements.
5. We report that the consolidated financial statements have been
prepared by the MSP Steel & Power Limited's management in
accordance with the requirements of Accounting Standards (AS)
21, “Consolidated Financial Statements” and Accounting Standard
(AS) 27, “Financial Reporting of Interests in Joint Ventures”
notified pursuant to the Companies (Accounting Standards) Rules,
2006, (as amended).
6. Attention is drawn on note 19 on schedule 22 regarding
accounting of gain of Rs. 3,025 lakhs arisen on settlement of
commodity transactions, settled otherwise than through actual
delivery, which is in the nature of speculative income. However
based on a legal opinion obtained, the same has been treated as
income from normal business by the Company. Consequently, we
are unable to comment on the impact of these transactions on the
tax expense and Group’s net worth.
7. On the basis of the information and explanation given to us and
on the consideration of unaudited financial statements and on
the relevant financial information of the subsidiary and joint
venture as certified by the management, we are of the opinion
that the attached consolidated financial statements, subject to
the matter contained in para 6 above whose impact on the
Group’s profit is currently not ascertainable, give a true and fair
view in conformity with the accounting principles generally
accepted in India:
(a) in the case of the consolidated balance sheet, of the state of
affairs of the Group as at 31st March 2011;
(b) in the case of the consolidated profit and loss account, of the
profit for the year ended on that date; and
(c) in the case of the consolidated cash flow statement, of the
cash flows for the year ended on that date.
For S.R. Batliboi & Co.
Firm Registration Number : 301003E
Chartered Accountants
per Sanjoy K Gupta
Place : Kolkata Partner
Date : 30th May, 2011 Membership No. 54968

92
MSP STEEL & POWER LIMITED
Consolidated Balance Sheet As at 31st March, 2011
The schedules referred to above form an integral part of the Consolidated Balance Sheet.
As per our Report of even date
For S. R. Batliboi & Co. For and on behalf of Board of DirectorsFirm Registration No.- 301003EChartered Accountants
per Sanjoy K. Gupta Puranmal Agrawal Suresh Kumar AgrawalPartner Chairman Managing DirectorMembership No 54968
22, Camac Street, Block C, 3rd FloorKolkata -700 016 Pinky GuptaDate : 30th May, 2011 Company Secretary
(Rs. in lacs)
Schedules As at As at31st March, 2011 31st March, 2010
SOURCES OF FUNDSShareholders' FundShare Capital 1 6,564.00 5,810.00 Preference Share Application Money [Pending allotment] – 2,220.00 (Refer Note No. 4 on Schedule 22 )Reserves & Surplus 2 25,428.11 14,315.97
31,992.11 22,345.97 Loan FundsSecured Loans 3 64,048.35 42,474.42 Unsecured Loans 4 6,500.26 3,633.60
70,548.61 46,108.02 Deferred Tax Liability (Net) (Refer Note No. 11 on Schedule 22 ) 3,337.34 1,985.79
105,878.06 70,439.78 APPLICATION OF FUNDSFixed AssetsGross Block 5 55,596.20 29,261.40 Less : Accumulated Depreciation 5,567.07 3,633.92 Net Block 50,029.13 25,627.48 Capital work in Progress 6 31,187.74 22,305.62 Pre-operative & Trial Run Expenses (Pending Allocation) 7 3,097.66 2,323.85
84,314.53 50,256.95 Investments 8 523.09 4,323.50 Deferred Tax Asset 0.17 0.07 Current Assets, Loans & Advances Inventories 9 12,085.47 6,834.01 Sundry Debtors 10 4,040.40 6,683.72 Cash & Bank Balances 11 1,114.03 3,832.21 Loans & Advances 12 11,686.84 5,410.15 Other Current Assets 13 9.84 6.65
(A) 28,936.58 22,766.74 Less:Current Liabilities & Provisions 14Current Liabilities 6,704.36 6,424.76 Provisions 1,192.11 482.93
(B) 7,896.47 6,907.69 Net Current Assets (A-B) 21,040.11 15,859.05 Miscellaneous Expenditure (To the extent not written off or adjusted)Preliminary Expense 0.16 0.21
105,878.06 70,439.78Significant Accounting Policies and Notes on Accounts 22

93
Annual Report 2010-11
The schedules referred to above form an integral part of the Consolidated Profit and Loss Account.
As per our Report of even date
For S. R. Batliboi & Co. For and on behalf of Board of DirectorsFirm Registration No.- 301003EChartered Accountants
per Sanjoy K. Gupta Puranmal Agrawal Suresh Kumar AgrawalPartner Chairman Managing DirectorMembership No 54968
22, Camac Street, Block C, 3rd FloorKolkata -700 016 Pinky GuptaDate : 30th May, 2011 Company Secretary
(Rs. in lacs)
Schedules 2010-11 2009-10
INCOMEGross Sales 15 51,789.50 41,427.80 Less: Excise Duty 4,042.56 2,553.32 Net Sales 47,746.94 38,874.48 Other Income 16 3,598.23 711.07
51,345.17 39,585.55 EXPENDITURE(Increase) / Decrease in Stocks 17 (3,835.57) (794.52)Excise Duty and Cess on Stocks (Refer Note No. 15 on Schedule 22) 207.46 80.24 Raw Materials Consumed 18 31,657.18 23,091.14 Purchase of Trading Goods 3,491.33 3,817.19 Personnel Cost 19 1,533.72 1,193.84 Manufacturing, Selling & Administrative Expenses 20 7,288.61 5,048.97 Prior Period Expenses 15.72 30.63 [Net of Prior Period Income Rs. 0.06 lacs (Rs. 6.69 lacs)]Interest & Finance Charges 21 2,346.62 2,040.43 Depreciation 1,933.20 1,257.57
44,638.27 35,765.49 Profit before Taxes 6,706.90 3,820.06 Provision For Taxes:
– Current Tax [Minimum Alternate Tax (MAT)] 1,392.89 685.13 Less: MAT Credit Entitlement (Refer Note No. 10 on Schedule 22) 1,055.53 337.36 472.84 212.29
– Prior year tax Expenses – 2.36 – Deferred Tax charge (Net) 1,351.44 402.77
Profit After Taxes 5,018.10 3,202.64 Balance brought forward from previous Year 14,260.43 11,057.79 Profit available for appropriation 19,278.53 14,260.43 Appropriations :Dividend Paid for the year 2009-10 (Refer Note no. 20 Schedule 22) 290.50 Dividend distribution tax on above 49.37 Proposed Dividend for the year 2010-11
– On equity shares 290.50 – On 6% non cumulative preference shares 10.85
Dividend distribution tax on above 50.05 –Balance carried to the Balance Sheet 18,587.26 14,260.43Earning per equity share [Nominal value of shares - Rs 10/-] 8.62 5.51
– Basic & Diluted (Rs) (Refer Note No. 13 on Schedule 22)Significant Accounting Policies and Notes on Accounts 22
Consolidated Profit and Loss Account For the year ended 31st March, 2011

94
MSP STEEL & POWER LIMITED
(Rs. in lacs)
2010-11 2009-10
A. CASH FLOW FROM OPERATING ACTIVITIES:
Net Profit before taxes 6,706.90 3,820.06
Adjustments for :
Depreciation 1,933.20 1,257.57
Unrealised Loss on Foreign Exchange Fluctuation/Forward 23.72 8.90
Irrecoverable Debts, Deposits and Advances written off 46.72 74.08
Provision for bad & doubtful debts/advances 49.80 98.74
Liabilities no longer required written back (81.74) (61.18)
Loss on sale of fixed assets 0.06 0.90
Preliminary Expenses written Off 0.05 0.05
Interest received on loans, deposits etc. (383.82) (68.74)
Interest Expenses 2,260.43 1,945.57
Dividend Income (2.27) (1.06)
Operating Profit before working capital changes 3,846.15 3,254.83
Movement in Working Capital for:
(Increase)/Decrease in Sundry Debtors 2,546.80 (2,611.11)
(Increase)/Decrease in Loans & Advances (4,965.25) (817.80)
(Increase)/Decrease in Inventories (5,251.47) (2,900.25)
Increase/(Decrease) in Current Liabilities & Provisions (1,512.50) 4,340.53
Cash generated from Operations (5,336.27) 1,266.20
Direct Taxes Paid 1,113.16 527.64
Net Cash generated from Operating Activities 257.47 4,558.62
B. CASH FLOW FROM INVESTING ACTIVITIES
Purchase of Fixed Assets [including Pre-Operative and Trial Run Expenses (34,120.89) (16,542.73)
(Pending allocation)]
Proceeds from sale of fixed assets 0.14 1.80
Purchase of Investments – (7,351.63)
Sale of Investments 3,800.41 3,700.92
Exchange difference arising on consolidation (0.69) (0.05)
Fixed Deposits (with maturity period of more than three months) (144.14) –
Interest received 124.72 67.08
Dividends received 2.27 1.06
Net cash used in investing activities (30,338.18) (20,123.55)
Consolidated Cash Flow Statement For the year ended 31st March, 2011

95
Annual Report 2010-11
As per our Report of even date
For S. R. Batliboi & Co. For and on behalf of Board of Directors
Firm Registration No.- 301003E
Chartered Accountants
per Sanjoy K. Gupta Puranmal Agrawal Suresh Kumar Agrawal
Partner Chairman Managing Director
Membership No 54968
22, Camac Street, Block C, 3rd Floor
Kolkata -700 016 Pinky Gupta
Date : 30th May, 2011 Company Secretary
(Rs. in lacs)
2010-11 2009-10
C. CASH FLOW FROM FINANCING ACTIVITIES
Application money towards Preference Shares – 2,220.00
Dividend and dividend distribution tax paid (339.87) –
Proceeds from issue of share capital 5,320.00 –
Deferred payment credit received 4,014.23
Long Term Borrowings Received 22,850.07 16,488.80
Long Term Borrowings Repaid (4,049.05) (7,636.02)
Short Term Borrowings Received / (paid) (Net) (3,573.94) 6,798.80
Cash credit and working capital received (Net) 5,199.29 3,187.20
Interest Paid (2,202.34) (3,664.78)
Share Issue expenses – (0.05)
Net cash generated in financing activities 27,218.39 17,393.95
Net (Decrease)/Increase in Cash & Cash equivalents (A+B+C) (2,862.32) 1,829.02
Cash & Cash equivalents as at the beginning of the year 3,711.18 1,882.16
Cash & Cash equivalents as at the end of the year * 848.86 3,711.18
* Represents the following
Cash-on-hand 475.50 317.06
With Scheduled Banks on Current Account 361.20 3,394.12
Fixed Deposit (Maturity Period of not more than 3 months) 12.16 –
848.86 3,711.18
Cash and Bank balances as per schedule - 11 1,114.03 3,832.21
Less : Fixed Deposits not considered as cash equivalent 265.17 121.03
Cash & Cash equivalents in cash flow statement 848.86 3,711.18
Consolidated Cash Flow Statement For the year ended 31st March, 2011

96
MSP STEEL & POWER LIMITED
Schedules forming part of the Consolidated Balance Sheet (Rs. in lacs)
As at As at31st March, 2011 31st March, 2010
Authorised
8,20,00,000 (6,00,00,000) equity shares of Rs. 10/- each (Rs. 10/-) 8,200.00 6,000.00
1,50,00,000 (1,50,00,000) 6% non cumulative redeemable
preference shares of Rs. 10/- each (Rs. 10/-) 1,500.00 1,500.00
9,700.00 7,500.00
Issued, Subscribed & Paid-Up
5,81,00,000 Equity Shares of Rs. 10/- each, fully paid up 5,810.00 5,810.00
Of the Above:
a) 71,800 Equity shares of Rs 10/- each were alloted as fully
paid up for consideration other than cash.
b) 47,54,300 Equity shares of Rs 10/- each were alloted as fully
paid bonus shares by capitalisation of securities premium.
7,540,000 (Nil) 6% non cumulative redeemable preference
shares of Rs 10 each, fully paid up 754.00 –
(Redeemable within 20 years from the date of allotment at a price
to be decided by the Board of Directors at the time of redemption) 6,564.00 5,810.00
Securities Premium Account
As per last Account 55.59 55.59
Add : Received during the year 6,786.00 6,841.59 – 55.59
Profit & Loss Account Balance 18,587.26 14,260.43
Foreign Currency Translation Difference Account (0.74) (0.05)
25,428.11 14,315.97
SCHEDULE 1 SHARE CAPITAL
SCHEDULE 2 RESERVES & SURPLUS
(Refer Note No. 6 on Schedule 22)
From Scheduled Banks
Term Loans 46,763.03 30,398.82
Cash Credit and Working Capital Facilities 17,179.33 11,980.04
Deferred Payment Credits under Hire Purchase 61.64 63.74
From Bodies Corporate
Deferred Payment Credits under Hire Purchase 44.35 31.82
64,048.35 42,474.42
SCHEDULE 3 SECURED LOANS
Inter corporate deposit from Bodies Corporate 2,486.03 3,633.60
[(Due within One Year Rs. 1,385.00 lacs (Rs. 2,022.80 lacs)]
Deferred payment credits 4,014.23 –
[Due within One Year Rs.Nil (Nil)]
6,500.26 3,633.60
SCHEDULE 4 UNSECURED LOANS

97
Annual Report 2010-11
Sche
dule
s fo
rmin
g pa
rt o
f the
Con
solid
ated
Bal
ance
She
etSC
HED
ULE
5FI
XED
ASS
ETS
(Rs.
in la
cs)
Des
crip
tion
G
ross
Blo
ck (a
t cos
t)
Dep
reci
atio
n N
et B
lock
As
at
Add
itio
nsD
elet
ions
/A
s at
A
s at
Fo
r th
eLe
ss: O
n A
s at
As
atA
s at
1st A
pril
A
djus
tmen
ts
31st
Mar
ch
1st A
pril
year
Del
etio
ns/
31st
Mar
ch31
st M
arch
31st
Mar
ch
2010
2011
2010
A
djus
tmen
ts20
11
2011
2010
Land
83
4.76
13
1.83
–
96
6.59
(b
) –
–
–
–
96
6.59
83
4.76
Fact
ory
Build
ings
3,
353.
10
2,66
7.44
–
6,
020.
54
311.
86
145.
85
–
457.
71
5,56
2.83
3,
041.
24
Non
-Fac
tory
Bui
ldin
gs
143.
13
992.
78
–
1,13
5.91
10
.37
6.17
–
16
.54
1,11
9.37
13
2.76
Plan
t & M
achi
nery
24
,436
.09
22,3
85.4
0 0.
04
46,8
21.4
5 3,
147.
47
1,73
0.67
0.
01
4,87
8.13
41
,943
.32
21,2
88.6
2
Vehi
cles
42
7.91
12
9.10
–
55
7.01
14
8.66
46
.59
–
195.
25
361.
76
279.
25
Furn
iture
& F
ixtu
res
66.4
1 28
.50
0.21
94
.70
15.5
6 3.
92
0.04
19
.44
75.2
6 50
.85
Tota
l 29
,261
.40
26
,335
.05
(c)
0.2
5 55
,596
.20
3,
633.
92
1,93
3.20
(a
) 0
.05
5,56
7.0
7 50
,029
.13
25,6
27.4
8
Prev
ious
Yea
r's to
tal
25,0
89.0
6 4,
176.
59
4.25
29
,261
.40
2,36
1.46
1,
274.
01
1.55
3,
633.
92
25,6
27.4
8
Not
es :
a)In
clud
es R
s. N
il (R
s.16
.66
lacs
) tra
nsfe
rred
to P
re-o
pera
tive
& T
rial
Run
Exp
ense
s (P
endi
ng A
lloca
tion)
b)In
clud
es R
s. 1
0.86
lacs
(Rs.
10.
86 la
cs )
bein
g th
e co
st o
f lan
d w
hich
is y
et to
be
regi
ster
ed in
the
nam
e of
the
Com
pany
.
c)In
clud
es R
s. 4
,356
.74
lacs
(Rs.
499
.72
lacs
) cap
italis
ed fr
om P
re-o
pera
tive
& T
rial
Run
Exp
ense
(pen
ding
allo
catio
n)

98
MSP STEEL & POWER LIMITED
SCHEDULE 7 PRE-OPERATIVE & TRIAL RUN EXPENSES (PENDING ALLOCATION)
Schedules forming part of the Consolidated Balance Sheet
SCHEDULE 6 CAPITAL WORK IN PROGRESS (INCLUDING CAPITAL ADVANCES)
As at As at31st March, 2011 31st March, 2010
Buildings ** 6,960.72 2,545.74 Plant & Machinery 39,762.96 20,440.97 Capital Goods in Stock 1,331.09 525.30 [including in transit Rs. 1,098.67 lacs (Rs. 96.74 lacs)]Capital Advances 4,836.53 2,783.71
52,891.30 26,295.72 Less : Capitalised during the year 21,703.56 3,990.10 Total 31,187.74 22,305.62
** Includes Rs. 531.56 lacs (Rs.355.36 lacs) transferred from finished goods.
Opening Balance Brought Forward 2,323.85 553.47Raw Materials Consumed 1,481.82 202.84Work in Progress Consumed 170.19 –Personnel Cost*Salary, Wages & Bonus 309.04 36.58Contribution to Provident and Other Funds 3.79 0.62Staff Welfare 10.12 0.28*Refer Note Nos. 7 and 12 on Schedule 22Administrative and Other Indirect OverheadsStores & Spares Consumed 7.51 1.87Power & Fuel 73.13 0.11Repairs & Maintenance
– Plant & Machinery 108.75 1.57– Others 7.61 0.46
Material Handling Charges 16.28 3.91Travelling & Conveyance 32.20 18.88Vehicle Running & Maintenance Expense 33.51 0.44Insurance Charges 3.12 0.01Printing and Stationary 6.13 0.02Postage and Communication 2.11 0.46Legal & Professional Charges 113.63 113.93Rent & Hire Charges 261.55 59.89Rates & Taxes 23.38 18.01Miscellaneous Expenses 17.75 17.52Borrowing CostInterest on Term Loans 3,823.35 1,726.18Finance Charges 348.49 258.22Depreciation – 16.66Total 9,177.31 3,031.93Less:Material Transferred for Captive Consumption 1,113.82 –Generation cost of Power consumed in Production 422.01 –Sale of Finished Goods – 0.97Closing Stock of Finished Goods (Transferred to Schedule - 17) 187.08 207.39
7,454.40 2,823.57Less: Transferred to Fixed Assets 4,356.74 499.72Amount carried to Balance Sheet 3,097.66 2,323.85
(Rs. in lacs)

99
Annual Report 2010-11
Schedules forming part of the Consolidated Balance Sheet
SCHEDULE 8 INVESTMENTS
Numbers Face value per As at As atof Shares share (Rs.) 31st March, 2011 31st March, 2010
A. LONG TERM, Equity Shares fully paid up (at Cost)
Other than trade -
(i) Unquoted
MSP Metallics Limited 420,000 10 402.00 402.00
MSP Properties (I) Private Limited 7,500 10 0.75 0.75
MSP Sponge Iron Limited 313,000 10 49.50 49.50
MSP Cement Limited 8,000 10 0.80 0.80
MSP Power Limited 8,000 10 0.80 0.80
Shree Sai Sharddha Metallics Private Limited 50,000 10 50.00 50.00
503.85 503.85
(ii) Quoted
Howrah Gases Limited 93,700 10 15.91 15.91
Ashirwad Steel & Industries Limited 2,500 10 0.25 0.25
Nageshwar Investment Limited 11,000 10 0.61 0.61
Indian Overseas Bank 2,900 10 0.70 0.70
IDFC Limited 5,201 10 1.77 1.77
19.24 19.24
B. CURRENT INVESTMENTS, Units of Mutual Funds (Quoted)
(at lower of cost and market value)
In SBI Magnum Insta Cash Fund Daily Dividend Option – 10 – 3,800.41
(22,688,612)
– 3,800.41
Total 523.09 4,323.50
(Rs. in lacs)
(Rs. in lacs)As at As at
31st March, 2011 31st March, 2010
Cost Market Cost Market
Value Value
Aggregate Value of investments - -Quoted 19.24 28.65 3819.65 3827.90
-Unquoted 503.85 – 503.85 –
Total 523.09 – 4323.50 –
There are no investments that have been purchased as well as sold during the year.

100
MSP STEEL & POWER LIMITED
Schedules forming part of the Consolidated Balance Sheet
SCHEDULE 10 SUNDRY DEBTORS (Unsecured)
SCHEDULE 9 INVENTORIES
As at As at31st March, 2011 31st March, 2010
Stores & Spares 906.08 766.21
[including in transit Rs 96.31 lacs (Rs. 23.67 lacs)]
Raw Materials 5,224.60 3,433.91
[including in transit Rs 733.42 lacs (Rs. 251.74 lacs)]
Work in progress 845.16 226.79
Finished Goods 3,918.70 1,600.74
By Products 1,190.93 806.36
12,085.47 6,834.01
Debts outstanding for a period exceeding six months
Considered good 720.05 544.68
Considered doubtful 164.12 114.32
Other Debts
Considered good 3,320.35 6,139.04
4,204.52 6,798.04
Less: Provision for Doubtful Debts 164.12 114.32
4,040.40 6,683.72
(Refer Note No. 8 on Schedule 22)
(Rs. in lacs)
SCHEDULE 11 CASH AND BANK BALANCES
Cash on Hand 475.50 317.06
[including cheques in hand Rs. 369.77 lacs (Rs. 100.00 lacs)]
Balances with Scheduled Banks on:
Current Accounts 361.20 3,394.12
Fixed Deposit Accounts 277.33 121.03
[Receipts for Rs 236.51 lacs (Rs. 79.46 lacs) pledged with banks as margin against loans/
guarantees issued by them and Rs 5.27 lacs (Rs. 3.42 lacs) lodged with other parties]
1,114.03 3,832.21

101
Annual Report 2010-11
Schedules forming part of the Consolidated Balance Sheet
SCHEDULE 13 OTHER CURRENT ASSETS
Interest Receivable on loans, deposits etc. 9.84 6.65 9.84 6.65
SCHEDULE 12 LOANS & ADVANCES (Unsecured)
As at As at31st March, 2011 31st March, 2010
Considered Good
Loans:
To Others [Including to staff Rs. 18.62 lacs (Rs. 21.30 lacs)] 3,886.00 188.42
Advances recoverable in cash or in kind or for value to be received 3,982.34 2,605.85
[Including to staff Rs. 10.36 lacs (Rs. 13.78 lacs)]
Export Incentive Receivable 57.21 35.92
Balance with Central Excise & Sales Tax Authorities 1,735.30 1,610.38
MAT Credit Entitlement 1,915.88 860.35
Security & Other Deposits 110.11 109.23
Considered Doubtful
Advances recoverable in cash or in kind or for value to be received 19.40 19.40
11,706.24 5,429.55
Less: Provision for Doubtful Advances 19.40 19.40
11,686.84 5,410.15
(Refer Note No. 9 on Schedule 22)
(Rs. in lacs)
SCHEDULE 14 CURRENT LIABILITIES & PROVISIONS
A. CURRENT LIABILITIES
Acceptances 150.31 –
Sundry Creditors for goods, services, expenses etc
a) Due to Micro & Small Enterprises (Refer Note No. 5 on Schedule 22) – –
b) Due to Others [Includes Rs. 4.17 lacs (Rs. 3.87 lacs) due to the Directors] 5,390.16 5,814.06
Other Liabilities 544.56 461.56
Advance from Customers 554.27 142.17
Interest Accrued but not due on Loans 65.06 6.97
6,704.36 6,424.76
B. PROVISIONS
Gratuity 80.82 28.94
Leave Salary 63.16 36.99
Proposed Dividend 301.35 –
Dividend Distribution Tax 50.05 –
Taxation [Net of Advance Tax Rs 2,782.66 lacs (Rs. 1,667.79 lacs)] 696.73 417.00
1,192.11 482.93

102
MSP STEEL & POWER LIMITED
Schedules forming part of the Consolidated Profit and Loss Account
SCHEDULE 15 SALES
As at As at31st March, 2011 31st March, 2010
Finished Goods 49,383.39 39,835.38
Less: Trade Discount 117.16 –
49,266.23 39,835.38
Power 1,534.39 615.71
Scraps & By Products 512.13 489.46
Raw Materials 409.10 368.95
Stores Material 10.02 –
Export Incentive 57.63 118.30
51,789.50 41,427.80
(Rs. in lacs)
SCHEDULE 16 OTHER INCOME
Interest on loan, deposits etc (Gross) 383.82 68.74
[Tax deducted at source Rs 30.38 lacs (Rs 7.42 lacs)]
Insurance Claim Received 49.66 5.75
Dividend from Current Investments (Non Trade) 2.27 0.87
Dividend from Long Term Investments (Non Trade) – 0.19
Liabilities no longer required written back 81.74 61.18
Gain on Transactions in Commodity Exchange 3,025.00 101.77
Commission Earned 46.44 451.47
Rent Received 1.20 –
Miscellaneous Receipts 8.10 21.10
3,598.23 711.07
SCHEDULE 17 (INCREASE)/DECREASE IN STOCKS
Opening Stock
Finished Goods 1,600.74 882.69
Goods under Process 226.79 34.71
By Products 806.36 1,069.94
2,633.89 1,987.34
Add: Transferred from Trial Run Production 187.08 207.39
2,820.97 2,194.73
Less:
Closing Stock
Finished Goods 3,918.70 1,600.74
Goods under Process 845.16 226.79
By Products 1,190.93 806.36
5,954.79 2,633.89
Less : Transfer for Trial Run - Finished Goods 170.19 –
Less : Transfer to CWIP - Finished Goods 531.56 355.36
(3,835.57) (794.52)
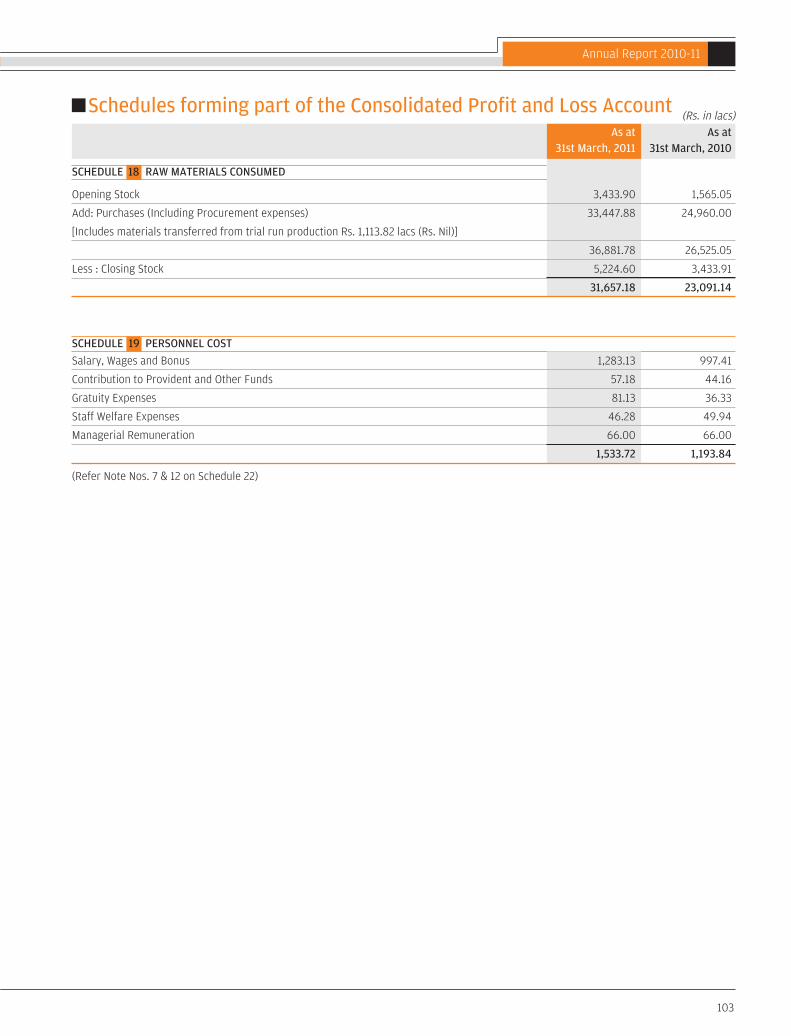
103
Annual Report 2010-11
Schedules forming part of the Consolidated Profit and Loss Account
SCHEDULE 18 RAW MATERIALS CONSUMED
As at As at31st March, 2011 31st March, 2010
Opening Stock 3,433.90 1,565.05
Add: Purchases (Including Procurement expenses) 33,447.88 24,960.00
[Includes materials transferred from trial run production Rs. 1,113.82 lacs (Rs. Nil)]
36,881.78 26,525.05
Less : Closing Stock 5,224.60 3,433.91
31,657.18 23,091.14
(Rs. in lacs)
SCHEDULE 19 PERSONNEL COST
Salary, Wages and Bonus 1,283.13 997.41
Contribution to Provident and Other Funds 57.18 44.16
Gratuity Expenses 81.13 36.33
Staff Welfare Expenses 46.28 49.94
Managerial Remuneration 66.00 66.00
1,533.72 1,193.84
(Refer Note Nos. 7 & 12 on Schedule 22)

104
MSP STEEL & POWER LIMITED
Schedules forming part of the Consolidated Profit and Loss Account(Rs. in lacs)
As at As at31st March, 2011 31st March, 2010
Stores & Spares Consumed 2,504.18 1,857.75
Power & Fuel 1,913.72 1,420.65
Repairs & Maintenance
– Plant & Machinery 243.06 65.36
– Building 8.19 9.95
– Others 56.13 21.65
Material Handling Charges 406.68 406.00
Travelling & Conveyance 29.10 33.63
Vehicle Running Expense 212.49 145.98
Commission on sales (Other than Sole Selling Agents) 123.29 110.53
Freight Outward [net of recoveries Rs. 55.68 lacs (Rs. 218.32 lacs)] 625.75 154.10
Auditor's Remuneration
– Statutory Audit Fees 8.02 8.00
– Limited Review Fees 4.50 4.50
– Out of pocket expenses 1.44 0.34
Insurance Charges 36.36 11.44
Printing and Stationary 12.23 12.52
Postage and Communication 36.71 29.83
Legal & Professional Charges 75.02 31.65
Rent 35.09 13.19
Rates & Taxes [Including Rs.9.05 lacs (Rs. 76.06 lacs) for earlier years] 67.49 98.17
Loss on Foreign Exchange Fluctuation 130.60 8.90
Selling & Marketing expenses 267.88 –
Charity & Donations 16.25 6.86
Irrecoverable Debts, Deposits and Advances written off 46.72 – 109.27 –
Less: Adjusted with provision – 46.72 35.19 74.08
Loss on sale of Assets – 0.06 0.90
Provision for doubtful debts/advances 49.80 98.74
Miscellaneous Expenses 377.80 424.20
Preliminary Expenses written off – 0.05 0.05
7,288.61 5,048.97
SCHEDULE 20 MANUFACTURING, SELLING & ADMINISTRATIVE EXPENSES
Interest
– On Term Loans 1,524.69 1,089.43
– On Working Capital Facilities 695.30 826.25
– On Others 40.44 29.89
Finance Charges 86.19 94.86
2,346.62 2,040.43
SCHEDULE 21 INTEREST & FINANCE CHARGES

105
Annual Report 2010-11
Schedules forming part of the Consolidated Balance Sheet and Profit and Loss Account
SCHEDULE 22 SIGNIFICANT ACCOUNTING POLICIES AND NOTES TO ACCOUNTS
1. Significant Accounting Policies
i) Principles Of Consolidation
a) The Consolidated Financial Statements present the consolidated Accounts of MSP Steel & Power Limited (“the Company”) and
its Subsidiary and Joint Venture (collectively the “Group”)
b) The subsidiary company considered for consolidation in the Financial Statements is as follows:
In terms of Accounting Standard 21 “Consolidated Financial Statements” notified pursuant to the Companies (Accounting
Standards) Rules, 2006 (as amended), no minority interest exists. MSPGI is into the business of wholesale trade, including
general import and export and other service activities.
c) The financial statements of the Company and its subsidiary have been consolidated on a line-by-line basis by adding together
the book value of like items of assets, liabilities, income and expenses, after fully eliminating intra-group balances, intra-group
transactions and any unrealized profits/losses.
d) The financial statements of MSPGI have been prepared in accordance with Singapore Financial Reporting Standard. However,
there would be no major impact on the profitability or financial position on conversion of these accounts under Indian GAAP.
e) MSPGI is a private Company and meets the requirement of audit exemption in Singapore. The unaudited financial statements,
prepared by the management of MSPGI have been considered for the consolidation.
f) The Joint Venture Company considered in the consolidated financial statements is as follows :
g) In terms of Accounting Standard 27 “Financial Reporting of Interests in Joint Venture” notified pursuant to the Companies
(Accounting Standards) Rules, 2006 (as amended), MSCCL, in which the Company holds 14.90% shares, is a joint venture
company and proportionate interest in the Joint Venture’s assets, liabilities, income and expenditure has been consolidated on
line by line basis by adding together the book value of like items of assets, liabilities, income and expenditure.
h) The consolidated financial statements have been prepared using uniform accounting policies for like transactions and events
in similar circumstances and necessary adjustments required for deviation in accounting policies, if any to the extent possible,
are made in the consolidated financial statements and are presented in the same manner as the Company’s separate financial
statements.
i) In translating the financial statements of the non-integral foreign Subsidiary for incorporation in the consolidated financial
statements, the assets and liabilities, both monetary and non-monetary are translated at the closing rate, while income and
expense items are translated at average exchange rate and all resulting exchange differences are accumulated in foreign
currency translation reserve.
The financial statements of the entities used for the purpose of consolidation are drawn up to same reporting date as that of
the Company i.e. year ended March 31, 2011.
ii) Basis of preparation of Accounts
The financial statements have been prepared to comply in all material respects with the Accounting Standards notified by the
Companies (Accounting Standards) Rules, 2006 (as amended) and the relevant provisions of the Companies Act, 1956. The financial
statements have been prepared under the historical cost convention on an accrual basis except in respect of insurance and other
claims, which on the ground of prudence or uncertainty in realisation, are accounted for as and when accepted / received. The
Incorporation 31st March 2011 31st March 2010
MSP Group International (Singapore) PTE. Ltd. (MSPGI) Singapore 100% 100%
Name of the Subsidiary Country of Proportion of ownership/interest
Incorporation 31st March 2011 31st March 2010
Madanpur South Coal Company Ltd. (MSCCL) India 14.90% 14.90%
Name of the joint venture Country of Proportion of ownership/interest

106
MSP STEEL & POWER LIMITED
Schedules forming part of the Consolidated Balance Sheet and Profit and Loss Account
SCHEDULE 22 SIGNIFICANT ACCOUNTING POLICIES AND NOTES ON ACCOUNTS (Contd.)
accounting policies applied by the Company, are consistent with those used in the previous year.
iii) Use of Estimates
The preparation of financial statements in conformity with generally accepted accounting principles requires management to make
estimates and assumptions that affect the reported amounts of assets and liabilities and disclosure of contingent liabilities at the date
of the financial statements and the results of operations during the reporting period. Although these estimates are based upon
management’s best knowledge of current events and actions, actual results could differ from these estimates.
iv) Fixed Assets
a) Fixed Assets are stated at cost, less accumulated depreciation and impairment if any. The cost of acquisition comprises of
purchase price inclusive of duties (net of Cenvat / VAT), taxes, incidental expenses, erection/commissioning/trial run expenses
and borrowing cost etc, up to the date the assets are ready for intended use. Borrowing costs relating to acquisition of fixed
assets which takes substantial period of time to get ready for its intended use are also included to the extent they relate to the
period till such assets are ready to be put to use.
b) Machinery spares which can be used only in connection with an item of fixed assets and whose use as per technical assessment,
are expected to be irregular, are capitalized and depreciated prospectively over the residual life of the respective assets.
c) All direct expenditure relating to construction of project as well as administrative and in direct cost attributable to the
construction of the project and/or bringing it to the working conditions for intended use, are capitalized as “Pre-operative &
Trial Run Expenses (pending allocation)”.
v) Impairment
The carrying amounts of assets are reviewed at each balance sheet date to determine if there is any indication of impairment based
on external/internal factors. An impairment loss is recognized wherever the carrying amount of an asset exceeds its recoverable
amount which represents the greater of the net selling price and ‘value in use’ of the assets. The estimated future cash flows
considered for determining the value in use, are discounted to their present value arrived at after considering the prevailing interest
rates and weighted average cost of capital.
vi) Depreciation
a) The classification of Plant & Machinery into continuous and non-continuous process is done as per the technical evaluation and
depreciation thereon is provided accordingly.
b) Depreciation on fixed assets is provided on straight-line method at the rates and in the manner prescribed in schedule XIV to
the Companies Act, 1956 or at the rates determined based on useful life of the respective asset, as estimated by the management,
whichever is higher.
c) In case of impairment, if any, depreciation is provided on the revised carrying amount of the assets over their remaining useful
life.
vii) Borrowing Cost
Borrowing Costs relating to the acquisition / construction of qualifying assets are capitalized until the time all substantial activities
necessary to prepare the qualifying assets for their intended use are complete.
A qualifying asset is one that necessarily takes substantial period of time to get ready for its intended use. All other borrowing cost
are charged to revenue.
viii) Leases
Leases where the lessor effectively retains substantially all the risks and benefits of ownership of the leased item, are classified as
operating leases. Operating lease payments are recognized as an expense in the Profit and Loss account on a straight-line basis over
the lease term.
ix) Government Grant and Subsidies
Grants and subsidies from the government are recognized when there is reasonable assurance that the grant/subsidy will be received
and all attaching conditions will be complied with.

107
Annual Report 2010-11
Schedules forming part of the Consolidated Balance Sheet and Profit and Loss Account
SCHEDULE 22 SIGNIFICANT ACCOUNTING POLICIES AND NOTES ON ACCOUNTS (Contd.)
When the grant or subsidy relates to an expense item, it is recognized as income over the periods necessary to match them on a
systematic basis to the costs, which it is intended to compensate.
Where the grant or subsidy relates to an asset, its value is deducted from the gross value of the asset concerned in arriving at the
carrying amount of the related asset.
x) Foreign Currency Transactions
a) Initial Recognition: Foreign currency transactions are recorded in the reporting currency by applying to the foreign currency
amount the exchange rate between the reporting currency and the foreign currency at the date of the transaction.
b) Conversion: Foreign currency monetary items are reported using the closing rate. Non-monetary items which are carried in
terms of historical cost denominated in a foreign currency are reported using the exchange rate at the date of the transaction;
and non-monetary items which are carried at fair value or other similar valuation denominated in a foreign currency are reported
using the exchange rates that existed when the values were determined.
c) Exchange Differences: Exchange differences arising on the settlement or reporting of monetary items at rates different from
those at which they were initially recorded during the period or reported in previous financial statements and / or on conversion
of monetary items, are recognized as income or expenses in the year in which they arise.
d) Forward Exchange Contracts (not intended for trading or speculation purpose): The premium or discount arising at the
inception of forward exchange contracts is amortized as expenses or income over the life of the respective contracts. Exchange
differences on such contracts are recognized in the statement of profit and loss in the period in which the exchange rates
change. Any profit or loss arising on cancellation or renewal of forward exchange contract is recognized as income or expense
for the year.
xi) Investments
Investments that are readily realizable and intended to be held for not more than a year are classified as current investments. All
other investments are classified as long-term investments.
Current investments are carried at lower of cost and fair value determined on an individual investment basis. Long term investments
are carried at cost. However, provision for diminution in value is recognized when there is an ‘other than temporary’ decline in the
value of the investments.
xii) Inventories
a) Raw materials, stores & spares & finished goods are valued at lower of cost and net realizable value. However, materials and
other items held for use in the production of finished goods are not written down below cost if the finished goods in which they
will be incorporated are expected to be sold at or above cost. Cost is determined on ‘First in First out’ basis.
b) Goods under process and finished goods are valued at lower of cost and net realizable value. Cost includes direct materials,
labour cost and a proportion of manufacturing overheads based on normal operating capacity. Cost of finished goods includes
excise duty. Cost is determined on annual average basis.
c) Saleable scrap and by-products are valued at net realizable value.
d) Net realizable value is the estimated selling price in the ordinary course of business, less estimated costs of completion and
estimated costs necessary to make the sale.
xiii) Retirement and Other Employee Benefits
a) Retirement benefit in the form of Provident Fund is a defined contribution scheme and the contributions are charged to Profit
and Loss Account of the year when the contributions to the fund are due. There are no obligation other than contribution
payable to the respective fund.
b) Gratuity liability is a defined benefit obligation and is provided for on the basis of actuarial valuation, as per projected unit credit
method made at the balance sheet date.
c) Short term compensated absences are provided for based on estimates. Long term compensated absences are provided for
based on actuarial valuation, as per projected unit credit method made at the balance sheet date
d) Actuarial gains/losses are taken to profit and loss account and are not deferred.

108
MSP STEEL & POWER LIMITED
Schedules forming part of the Consolidated Balance Sheet and Profit and Loss Account
SCHEDULE 22 SIGNIFICANT ACCOUNTING POLICIES AND NOTES ON ACCOUNTS (Contd.)
xiv) Taxation
Tax expense comprises of current (net of MAT credit entitlement) and deferred tax.
Current income tax is measured at the amount expected to be paid to the tax authorities in accordance with the Indian Income Tax
Act, 1961. Deferred income tax reflects the impact of current year timing differences between taxable income and accounting income
for the year and reversal of timing differences of earlier years.
Deferred tax is measured based on the tax rates and the tax laws enacted or substantively enacted at the balance sheet date.
Deferred tax assets and deferred tax liabilities are offset, if a legally enforceable right exists to set off current tax assets against
current tax liabilities and the deferred tax assets and deferred tax liabilities relate to the taxes on income levied by same governing
taxation laws. Deferred tax assets are recognised only to the extent that there is reasonable certainty that sufficient future taxable
income will be available against which such deferred tax assets can be realised. In situations where the company has unabsorbed
depreciation or carry forward tax losses, all deferred tax assets are recognised only if there is virtual certainty supported by convincing
evidence that they can be realised against future taxable profits.
At each balance sheet date the Company re-assesses unrecognised deferred tax assets. It recognises unrecognised deferred tax
assets to the extent that it has become reasonably certain or virtually certain, as the case may be that sufficient future taxable
income will be available against which such deferred tax assets can be realised.
MAT credit is recognised as an asset only when and to the extent there is convincing evidence that the company will pay normal
income tax during the specified period. In the year in which the Minimum Alternative tax (MAT) credit becomes eligible to be
recognized as an asset in accordance with the recommendations contained in guidance Note issued by the Institute of Chartered
Accountants of India, the said asset is created by way of a credit to the profit and loss account and shown as MAT Credit Entitlement.
The Company reviews the same at each balance sheet date and writes down the carrying amount of MAT Credit Entitlement to the
extent there is no longer convincing evidence to the effect that Company will pay normal income tax during the specified period.
xv) Revenue Recognition
Revenue is recognized to the extent that it is probable that the economic benefits will flow to the Company and the revenue can be
reliably measured.
Sale of Goods
Revenue from sale of goods is recognized when significant risks and rewards of ownership of goods have passed to the buyer,
which generally coincides with delivery. Sales are net of returns, claims, trade discounts, Sales Tax and VAT etc.
Sale of Power
Revenue from sale of power is recognized on the basis of delivery of power to the customers from the grid.
Interest
Revenue is recognised on a time proportionate basis taking into account the amount outstanding and the rate applicable.
Commission Income
Revenue is recognised when the services are rendered and there is no significant uncertainty as regards the collection thereof.
Export Incentives
Export Incentives under the Duty Entitlement Pass Book (DEPB) scheme are recognized when such incentive accrues upon export of
goods.
xvi) Segment Reporting Policies
Based on the synergies, risks and return associated with business operations and in terms of Accounting Standard-17, the Company
is predominantly engaged in a single reportable segment of Iron and Steel during the year. The risks and returns of existing captive
power plants are directly associated with the manufacturing operations of iron & steel and hence treated as a single reportable
segment as per Accounting Standard-17.
The analysis of geographical segments is based on the area in which the customers of the Company are located.
xvii) Provision
A provision is recognized when the Company has a present obligation as a result of past event and it is probable that an outflow of
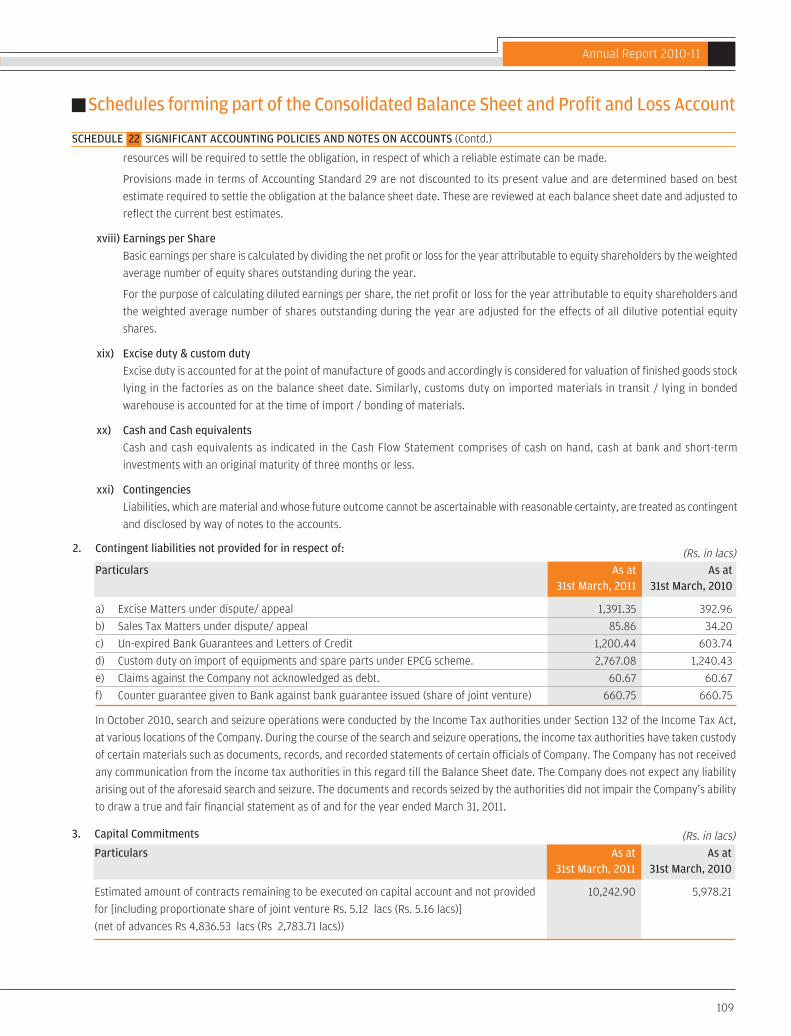
109
Annual Report 2010-11
resources will be required to settle the obligation, in respect of which a reliable estimate can be made.
Provisions made in terms of Accounting Standard 29 are not discounted to its present value and are determined based on best
estimate required to settle the obligation at the balance sheet date. These are reviewed at each balance sheet date and adjusted to
reflect the current best estimates.
xviii) Earnings per Share
Basic earnings per share is calculated by dividing the net profit or loss for the year attributable to equity shareholders by the weighted
average number of equity shares outstanding during the year.
For the purpose of calculating diluted earnings per share, the net profit or loss for the year attributable to equity shareholders and
the weighted average number of shares outstanding during the year are adjusted for the effects of all dilutive potential equity
shares.
xix) Excise duty & custom duty
Excise duty is accounted for at the point of manufacture of goods and accordingly is considered for valuation of finished goods stock
lying in the factories as on the balance sheet date. Similarly, customs duty on imported materials in transit / lying in bonded
warehouse is accounted for at the time of import / bonding of materials.
xx) Cash and Cash equivalents
Cash and cash equivalents as indicated in the Cash Flow Statement comprises of cash on hand, cash at bank and short-term
investments with an original maturity of three months or less.
xxi) Contingencies
Liabilities, which are material and whose future outcome cannot be ascertainable with reasonable certainty, are treated as contingent
and disclosed by way of notes to the accounts.
Schedules forming part of the Consolidated Balance Sheet and Profit and Loss Account
SCHEDULE 22 SIGNIFICANT ACCOUNTING POLICIES AND NOTES ON ACCOUNTS (Contd.)
2. Contingent liabilities not provided for in respect of:
Particulars As at As at31st March, 2011 31st March, 2010
a) Excise Matters under dispute/ appeal 1,391.35 392.96
b) Sales Tax Matters under dispute/ appeal 85.86 34.20
c) Un-expired Bank Guarantees and Letters of Credit 1,200.44 603.74
d) Custom duty on import of equipments and spare parts under EPCG scheme. 2,767.08 1,240.43
e) Claims against the Company not acknowledged as debt. 60.67 60.67
f) Counter guarantee given to Bank against bank guarantee issued (share of joint venture) 660.75 660.75
In October 2010, search and seizure operations were conducted by the Income Tax authorities under Section 132 of the Income Tax Act,
at various locations of the Company. During the course of the search and seizure operations, the income tax authorities have taken custody
of certain materials such as documents, records, and recorded statements of certain officials of Company. The Company has not received
any communication from the income tax authorities in this regard till the Balance Sheet date. The Company does not expect any liability
arising out of the aforesaid search and seizure. The documents and records seized by the authorities did not impair the Company’s ability
to draw a true and fair financial statement as of and for the year ended March 31, 2011.
(Rs. in lacs)
3. Capital Commitments
Particulars As at As at31st March, 2011 31st March, 2010
Estimated amount of contracts remaining to be executed on capital account and not provided 10,242.90 5,978.21
for [including proportionate share of joint venture Rs. 5.12 lacs (Rs. 5.16 lacs)]
(net of advances Rs 4,836.53 lacs (Rs 2,783.71 lacs))
(Rs. in lacs)

110
MSP STEEL & POWER LIMITED
Schedules forming part of the Consolidated Balance Sheet and Profit and Loss Account
SCHEDULE 22 SIGNIFICANT ACCOUNTING POLICIES AND NOTES ON ACCOUNTS (Contd.)
4. During the year, the Company has issued 7,540,000 numbers of 6% non cumulative non convertible redeemable preference shares of Rs.10
each with a premium of Rs.90 per share on private placement basis.
5. As per information available with the Company, there are no suppliers covered under Micro, Small & Medium Enterprise Development Act,
2006. As a result, no interest provision/payment has been made by the Company to such creditors, if any, and no disclosure thereof is
made in the accounts.
6. Loans are secured as follows:
i) Rupee Term Loans from Banks are secured by way of equitable mortgage by deposit of title deed of Company’s land and immovable
properties at Raigarh and a first charge by way of hypothecation of the company's movables (save and except book debts) including
movable machinery, machinery spares, tools & accessories, (both present and future), subject to prior charges created in favour of
the company's bankers on the stock of raw materials, finished goods, process stock, consumable stores and book debts for securing
working capital facilities.
ii) The above term loans are further secured by the personal guarantee of Mr. Puranmal Agrawal (chairman), Mr. Suresh Kumar Agrawal,
Mr. Saket Agrawal & Mr. Manish Agrawal (directors of the company).
iii) Cash Credit and other working capital facilities from banks are secured by hypothecation of raw materials, finished goods, goods under
process, stores and spares, book debts etc.(both present and future), second charge over the entire fixed assets of the company and
personal guarantee of Mr. Puranmal Agrawal(chairman), Mr. Suresh Kumar Agrawal, Mr. Saket Agrawal & Mr. Manish Agrawal(directors
of the company).
iv) Hire purchases obligations are secured by hypothecation of vehicles purchased under the respective agreements.
All the mortgages and charges created in favour of the banks rank pari-passu inter se, except where specifically stipulated otherwise.
7. Gratuity and other post retirement benefit plans
The Company provides gratuity benefits which are funded with Life Insurance Corporation of India in the form of qualifying insurance policy.
Leave encashment benefits is an unfunded plan of the Company.
(a) Expenses recognized in the profit and loss account/ Pre-operative & Trial run expenses (Pending allocation) for respective years
are as follows:
2010-11 2009-10 2010-11 2009-10
Current service cost 40.51 15.77 1.53 1. 39
Interest cost 4.98 1.93 3.00 2.59
Expected return on plan assets (3.80) (1.72) – –
Past Service Cost – 25.53 – –
Net actuarial losses/(gains) 39.44 (5.18) 22.81 0.76
Net benefit expense 81.13 36.33 27.34 4.74
Actual return on plan assets 3.80 0.10 N.A. N.A.
Particulars Gratuity Leave
(Rs. in lacs)
(b) Net Liability recognized in the balance sheet as at respective dates are as follows:-
2010-11 2009-10 2010-11 2009-10
Defined benefit obligation 144.38 61.30 63.16 36.99
Fair value of plan assets 63.56 32.36 – –
Net liability 80.82 28.94 63.16 36.99
Particulars Gratuity Leave
(Rs. in lacs)

111
Annual Report 2010-11
Schedules forming part of the Consolidated Balance Sheet and Profit and Loss Account
SCHEDULE 22 SIGNIFICANT ACCOUNTING POLICIES AND NOTES ON ACCOUNTS (Contd.)
(c) Changes in the present value of the defined benefit obligation during respective years are as follows:
2010-11 2009-10 2010-11 2009-10
Opening defined benefit obligation 61.30 24.87 36.99 34.61
Interest cost 4.98 1.93 3.00 2.59
Current service cost 40.51 15.77 1.53 1.39
Benefit paid (1.85) – (1.17) (2.36)
Actuarial losses/(gains) 39.44 (6.80) 22.81 0.76
Plan Amendments – 25.53 – –
Closing defined benefit obligation 144.38 61.30 63.16 36.99
Particulars Gratuity Leave
(Rs. in lacs)
(d) The details of fair value of plan assets as on the Balance Sheet date are as follows:
31st March 2011 31st March 2010
Opening fair value of plan assets 32.36 12.09
Expected return on plan assets* 3.8 1.72
Contribution by the Company 29.25 20.17
Benefits paid (1.85) –
Actuarial gains / (loss) – (1.62)
Closing fair value of plan assets 63.56 32.36
* Determined based on government bond rate.
Particulars Gratuity
(Rs. in lacs)
(e) The principal assumptions used in determining gratuity and leave liability are as shown below:
Particulars 2010-11 2009-10
Discount rate (%) 8.35 8.25
Return on Plan Assets (Gratuity Scheme) (%) 8.25 10.00
Mortality Rate LIC (1994-96) LIC (1994-96)
Ultimate Ultimate
Employee Turnover (%) 6.2 6.2
(f) Amount of expenses incurred for the current and previous years are as follows:
31st March 2011 31st March 2010 31st March 2009 31st March 2008
Defined benefit obligation 144.38 61.30 24.87 12.06Fair value of plan assets 63.56 32.36 12.09 –Deficit 80.82 28.94 12.78 12.06Experience adjustments on plan liabilities – (gains)/ losses 42.14 (3.64) (0.07) –Experience adjustments on plan assets – (1.62) Nil N.A.
Particulars Gratuity(Rs. in lacs)

112
MSP STEEL & POWER LIMITED
Schedules forming part of the Consolidated Balance Sheet and Profit and Loss Account
SCHEDULE 22 SIGNIFICANT ACCOUNTING POLICIES AND NOTES ON ACCOUNTS (Contd.)
31st March 2011 31st March 2010 31st March 2009 31st March 2008
Defined benefit obligation 63.16 36.99 34.61 7.33Fair value of plan assets - - - -Deficit 63.16 36.99 34.61 7.33Experience adjustments on plan liabilities – (gains)/ losses 24.09 4.73 23.06 -Experience adjustments on plan assets - N.A. N.A. N.A.
Particulars Leave(Rs. in lacs)
Since Accounting Standard 15 (Revised) on Employee Benefits was adopted from 1st January 2007, disclosures given above are only
for current year and previous three years.
(g) The estimate of future salary increase, considered in actuarial valuation, takes account of inflation, seniority, promotion and other
relevant factors such as supply and demand in the employee market.
(h) The Company expects to contribute Rs. 148.00 lacs to gratuity fund in the year 2011-12.
(i) The amount provided for defined contribution plan are as follows:
Particulars 2010-11 2009-10
Provident Fund 60.97 44.78
(Rs. in lacs)
8. Dues from companies under the same management.
2010-11 2009-10
MSP Cokes Private Limited* - 61.60 - 83.48
Chaman Metallics Limited 153.94 - 153.94 -
* Merged with MSP Metallics Ltd. w.e.f. 01st April’2010.
Maximum Amount outstanding
Name of the Company 31st March 2011 31st March 2010 during the year
(Rs. in lacs)
9. (a) Loans & Advances include the following amounts:
(i) Companies under the same management:-
2010-11 2009-10
MSP Metallics Limited - N.A. 4500.00 N.A.
Chaman Metallics Limited 182.49 N.A. 182.49 N.A.
MSP Cement Limited 1.20 1.20 1.20 1.20
MSP Power Limited 3.20 3.20 3.20 3.20
Maximum Amount outstanding
Name of the Company 31st March 2011 31st March 2010 during the year
(Rs. in lacs)
(ii) Private company in which a director of the Company is a director or a member:-
2010-11 2009-10
Prateek Mines & Minerals Private Ltd. - 41.00 41.00 41.00
Maximum Amount outstanding
Name of the Company 31st March 2011 31st March 2010 during the year
(Rs. in lacs)

113
Annual Report 2010-11
Schedules forming part of the Consolidated Balance Sheet and Profit and Loss Account
SCHEDULE 22 SIGNIFICANT ACCOUNTING POLICIES AND NOTES ON ACCOUNTS (Contd.)
b) Disclosure in terms of clause 32 of the Listing Agreements:
2010-11 2009-10
MSP Metallics Limited Company in which Loan without fixed - N.A. 4,500.00 N.A.
directors are interested repayment schedule
Chaman Metallics Company in which Loan without fixed 182.49 N.A. 182.49 N.A.
Limited directors are interested repayment schedule
MSP Cement Limited Company in which Loan without fixed 1.20 1.20 1.20 1.20
directors are interested Loan without fixed
MSP Power Limited Company in which Loan without fixed 3.20 3.20 3.20 3.20
directors are interested Loan without fixed
Maximum Amount
31st March 31st March outstanding
Name of the Company Relation Category 2011 2010 during the year
(Rs. in lacs)
10. During the current year, the Company has recognized MAT credit entitlement of Rs. 1,055.53 Lacs (Rs. 472.84 lacs) in terms of Section
115JAA of the Income Tax Act, 1961. Based on future profitability projections, the Company is certain that there would be sufficient taxable
income in the future, to claim the above tax credit.
11. In terms of Accounting Standard 22, net deferred tax liability (DTL) of Rs 1,351.54 lacs (Rs. 402.84 lacs) has been recognized during the
year and consequently the net DTL stands at Rs. 3,337.34 lacs (Rs. 1,985.79 lacs).
The break-up of major components of such net DTL is as follows:
Components of Deferred Tax Liability/ (Assets) As at As at31st March, 2011 31st March, 2010
Timing Difference in depreciable assets 3,581.50 2,148.25
Difference on expense allowable in future (244.16) (162.46)
Total 3,337.34 1,985.79
(Rs. in lacs)
12. Details of remuneration paid to the directors: (Rs. in lacs)
Particulars 2010-11 2009-10
Salary & Bonus* 66.00 66.00
* As the liabilities for gratuity and leave encashment are provided on an actuarial basis for the Company as a whole, the amounts pertaining
to the directors are not included above.
13. Basis for calculation of Basic and Diluted Earning per Share is as follows:
Particulars 2010-11 2009-10
Present Weighted Average Number of Equity Shares Nos. 58,100,000 58,100,000
Net Profit After Tax available for Equity Shareholders Rs. in lacs 5,018.10 3,202.64
Less : Dividend and dividend distribution tax on Preference Shares Rs. in lacs 12.65 –
Rs. in lacs 5,005.45 3,202.64
Nominal Value of each Share Rs. 10/- 10/-
Basic & Diluted Earning Per Share Rs. 8.62 5.51
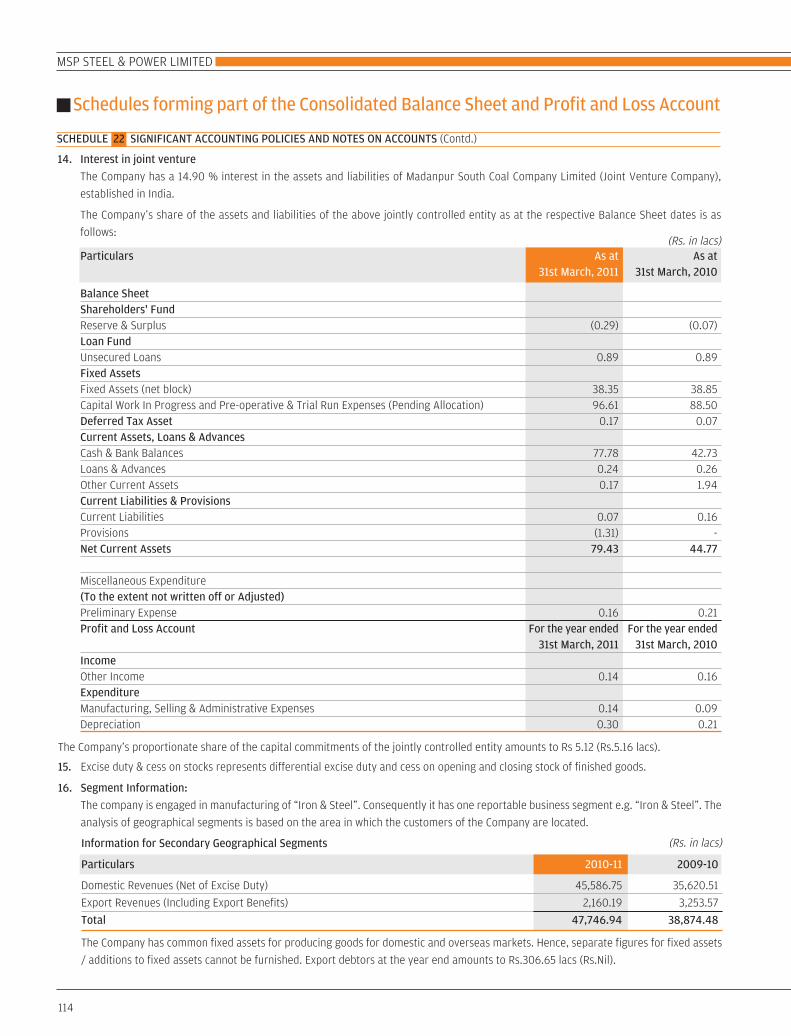
114
MSP STEEL & POWER LIMITED
Schedules forming part of the Consolidated Balance Sheet and Profit and Loss Account
SCHEDULE 22 SIGNIFICANT ACCOUNTING POLICIES AND NOTES ON ACCOUNTS (Contd.)
14. Interest in joint venture
The Company has a 14.90 % interest in the assets and liabilities of Madanpur South Coal Company Limited (Joint Venture Company),
established in India.
The Company’s share of the assets and liabilities of the above jointly controlled entity as at the respective Balance Sheet dates is as
follows:
15. Excise duty & cess on stocks represents differential excise duty and cess on opening and closing stock of finished goods.
16. Segment Information:
The company is engaged in manufacturing of “Iron & Steel”. Consequently it has one reportable business segment e.g. “Iron & Steel”. The
analysis of geographical segments is based on the area in which the customers of the Company are located.
The Company’s proportionate share of the capital commitments of the jointly controlled entity amounts to Rs 5.12 (Rs.5.16 lacs).
The Company has common fixed assets for producing goods for domestic and overseas markets. Hence, separate figures for fixed assets
/ additions to fixed assets cannot be furnished. Export debtors at the year end amounts to Rs.306.65 lacs (Rs.Nil).
Particulars As at As at31st March, 2011 31st March, 2010
Balance Sheet Shareholders' FundReserve & Surplus (0.29) (0.07)Loan Fund Unsecured Loans 0.89 0.89Fixed AssetsFixed Assets (net block) 38.35 38.85Capital Work In Progress and Pre-operative & Trial Run Expenses (Pending Allocation) 96.61 88.50Deferred Tax Asset 0.17 0.07Current Assets, Loans & AdvancesCash & Bank Balances 77.78 42.73Loans & Advances 0.24 0.26Other Current Assets 0.17 1.94Current Liabilities & ProvisionsCurrent Liabilities 0.07 0.16Provisions (1.31) -Net Current Assets 79.43 44.77
Miscellaneous Expenditure(To the extent not written off or Adjusted)Preliminary Expense 0.16 0.21Profit and Loss Account For the year ended For the year ended
31st March, 2011 31st March, 2010IncomeOther Income 0.14 0.16ExpenditureManufacturing, Selling & Administrative Expenses 0.14 0.09Depreciation 0.30 0.21
(Rs. in lacs)
Information for Secondary Geographical Segments (Rs. in lacs)
Particulars 2010-11 2009-10
Domestic Revenues (Net of Excise Duty) 45,586.75 35,620.51
Export Revenues (Including Export Benefits) 2,160.19 3,253.57
Total 47,746.94 38,874.48
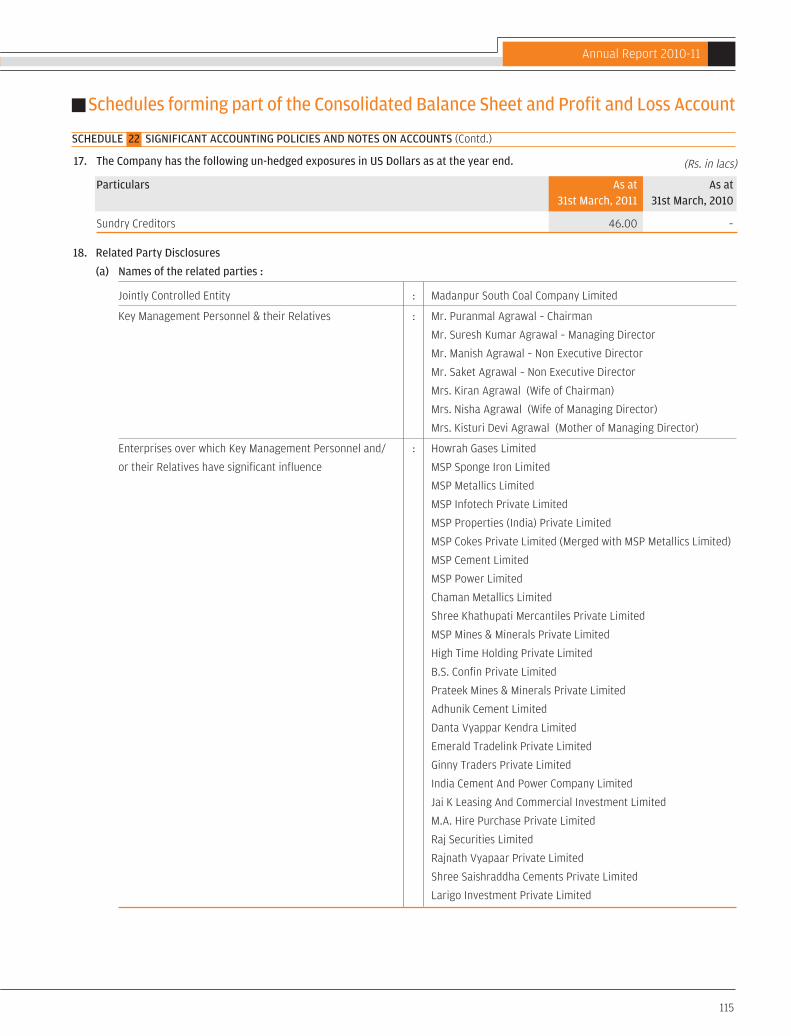
115
Annual Report 2010-11
Schedules forming part of the Consolidated Balance Sheet and Profit and Loss Account
SCHEDULE 22 SIGNIFICANT ACCOUNTING POLICIES AND NOTES ON ACCOUNTS (Contd.)
17. The Company has the following un-hedged exposures in US Dollars as at the year end.
Particulars As at As at31st March, 2011 31st March, 2010
Sundry Creditors 46.00 –
(Rs. in lacs)
18. Related Party Disclosures
(a) Names of the related parties :
Jointly Controlled Entity : Madanpur South Coal Company Limited
Key Management Personnel & their Relatives : Mr. Puranmal Agrawal – Chairman
Mr. Suresh Kumar Agrawal – Managing Director
Mr. Manish Agrawal – Non Executive Director
Mr. Saket Agrawal – Non Executive Director
Mrs. Kiran Agrawal (Wife of Chairman)
Mrs. Nisha Agrawal (Wife of Managing Director)
Mrs. Kisturi Devi Agrawal (Mother of Managing Director)
Enterprises over which Key Management Personnel and/ : Howrah Gases Limited
or their Relatives have significant influence MSP Sponge Iron Limited
MSP Metallics Limited
MSP Infotech Private Limited
MSP Properties (India) Private Limited
MSP Cokes Private Limited (Merged with MSP Metallics Limited)
MSP Cement Limited
MSP Power Limited
Chaman Metallics Limited
Shree Khathupati Mercantiles Private Limited
MSP Mines & Minerals Private Limited
High Time Holding Private Limited
B.S. Confin Private Limited
Prateek Mines & Minerals Private Limited
Adhunik Cement Limited
Danta Vyappar Kendra Limited
Emerald Tradelink Private Limited
Ginny Traders Private Limited
India Cement And Power Company Limited
Jai K Leasing And Commercial Investment Limited
M.A. Hire Purchase Private Limited
Raj Securities Limited
Rajnath Vyapaar Private Limited
Shree Saishraddha Cements Private Limited
Larigo Investment Private Limited

116
MSP STEEL & POWER LIMITED
Schedules forming part of the Consolidated Balance Sheet and Profit and Loss Account
SCHEDULE 22 SIGNIFICANT ACCOUNTING POLICIES AND NOTES ON ACCOUNTS (Contd.)
(b) Related Party Disclosures :
Nature of Transactions Jointly Key Management Enterprises over which TotalControlled Personnel & their Key Management
Entity Relatives Personnel / ShareHolders/Relatives have
significant influence
SalesMSP Sponge Iron Limited 543.22 543.22
(358.19) (358.19)MSP Metallics Limited 534.04 534.04
(607.78) (607.78)Chaman Metallics Limited 150.31 150.31
(8.93) (8.93)MSP Properties (India) Private Limited 22.46 22.46
( – ) ( – )Purchases of GoodsMSP Sponge Iron Limited 2,556.99 2,556.99
(2,745.11) (2,745.11)MSP Metallics Limited 9,029.41 9,029.41
(4,291.79) (4,291.79)Chaman Metallics Limited 46.11 46.11
(122.16) (122.16)Howrah Gases Limited – –
(337.59) (337.59)Managerial RemunerationMr. Puranmal Agrawal 36.00 36.00
(36.00) (36.00)Mr. Suresh Kumar Agrawal 30.00 30.00
(30.00) (30.00)Legal & Professional Charges PaidMSP Mines & Minerals Private Limited 11.64 11.64
(6.97) (6.97)Rent PaidLarigo Investment Private Limited 0.18 0.18
(0.18) (0.18)MSP Infotech Private Limited 3.60 3.60
(3.60) (3.60)Shree Khathupati Mercantiles 3.49 3.49Private Limited (2.43) (2.43)Mrs. Kasturi Devi Agrawal 0.48 0.48
(0.84) (0.84)Mrs. Nisha Agrawal 0.36 0.36
(0.58) (0.58)Mrs. Kiran Agrawal 0.36 0.36
(0.58) (0.58)Mr. Manish Agrawal 0.48 0.48
(0.96) (0.96)Mr. Saket Agrawal 0.48 0.48
(0.96) (0.96)
(Rs. in lacs)

117
Annual Report 2010-11
Schedules forming part of the Consolidated Balance Sheet and Profit and Loss Account
SCHEDULE 22 SIGNIFICANT ACCOUNTING POLICIES AND NOTES ON ACCOUNTS (Contd.)
(b) Related Party Disclosures (Contd.) :
Nature of Transactions Jointly Key Management Enterprises over which TotalControlled Personnel & their Key Management
Entity Relatives Personnel / ShareHolders/Relatives have
significant influence
Subscription to Equity Shares
Madanpur South Coal Company Limited – –
(22.35) (22.35)
Loans Taken
MSP Infotech Private Limited – –
(50.00) (50.00)
MSP Properties (India) Private Limited. – –
(50.00) (50.00)
Loans Given
Prateek Mines & – –
Minerals Private Limited (93.50) (93.50)
Chaman Metallics Ltd 245.00 245.00
(–) (–)
MSP Metallics Limited 4,585.00 4,585.00
(–) (–)
MSP Sponge Iron Limited 7,850.00 7,850.00
(–) (–)
Adhunik Cement Limited 2780.00 2780.00
(–) (–)
Guarantees Given on behalf of
Madanpur South Coal Company Limited 660.75 660.75
(660.75) (660.75)
Guarantees Obtained
MSP Infotech Private Limited – –
(1,500.00) (1,500.00)
Mr. Puranmal Agrawal 130.00 130.00
(130.00) (130.00)
Mr. Suresh Kumar Agrawal 111.00 111.00
(111.00) (111.00)
Mr. Manish Agrawal 140.00 140.00
(140.00) (140.00)
Mr. Saket Agrawal 131.00 131.00
(131.00) (131.00)
Interest Paid
High Time Holdings Private Limited 2.51 2.51
(8.00) (8.00)
B.S. Confin Private Limited 1.90 1.90
(4.00) (4.00)
(Rs. in lacs)

118
MSP STEEL & POWER LIMITED
Schedules forming part of the Consolidated Balance Sheet and Profit and Loss Account
SCHEDULE 22 SIGNIFICANT ACCOUNTING POLICIES AND NOTES ON ACCOUNTS (Contd.)
(b) Related Party Disclosures (Contd.) :
Nature of Transactions Jointly Key Management Enterprises over which TotalControlled Personnel & their Key Management
Entity Relatives Personnel / ShareHolders/Relatives have
significant influence
MSP Infotech Private Limited 6.00 6.00
(2.01) (2.01)
MSP Properties (India) Private Limited. 3.00 3.00
(1.49) (1.49)
Ginny Traders Private Limited 2.84 2.84
(6.00) (6.00)
Emerald Tradelink Private Limited 2.46 2.46
(5.20) (5.20)
Rajnath Vyapaar Private Limited 3.79 3.79
(8.00) (8.00)
Raj Securities Limited 3.46 3.46
(10.00) (10.00)
Danta Vyappar Kendra Limited 12.51 12.51
(26.40) (26.40)
Interest Received
Chaman Metallics Limited 4.98 4.98
(–) (–)
MSP Metallics Limited 47.86 47.86
(–) (–)
MSP Sponge Iron Limited 71.75 71.75
(–) (–)
Adhunik Cement Limited 117.09 117.09
(–) (–)
Closing Balance as at the year end–debit
MSP Metallics Limited 287.59 287.59
(61.60) (61.60)
MSP Sponge Iron Limited 197.29 197.29
(361.70) (361.70)
MSP Cement Limited 1.20 1.20
(1.20) (1.20)
Madanpur South Coal Company Limited 1.63 1.63
(1.70) (1.70)
MSP Power Limited 3.20 3.20
(3.20) (3.20)
Prateek Mines & Minerals Private Limited – –
(41.00) (41.00)
MSP Mines and Minerals Private Limited 25.87 25.87
(–) (–)
(Rs. in lacs)

119
Annual Report 2010-11
Schedules forming part of the Consolidated Balance Sheet and Profit and Loss Account
SCHEDULE 22 SIGNIFICANT ACCOUNTING POLICIES AND NOTES ON ACCOUNTS (Contd.)
(b) Related Party Disclosures (Contd.) :
Nature of Transactions Jointly Key Management Enterprises over which TotalControlled Personnel & their Key Management
Entity Relatives Personnel / ShareHolders/Relatives have
significant influence
Chaman Metallics Limited 336.43 336.43 (–) (–)
MSP Properties (India) Private Limited 12.15 12.15(–) (–)
MSP Infotech Private Limited 0.03 0.03(0.54) (0.54)
Closing Balance as at the year end – creditMSP Sponge Iron Limited 27.29 27.29
(88.09) (88.09)MSP Metallics Limited 2,729.09 2,729.09
(166.17) (166.17)Shree Khathupati Mercantiles 4.56 4.56Private Limited (1.41) (1.41)MSP Mines & Minerals Private Limited – –
(0.52) (0.52)High Time Holding Private Limited – –
(100.00) (100.00)B.S Confin Private Limited – –
(50.00) (50.00)MSP Infotech Private Limited 49.56 49.56
(52.34) (52.34)MSP Properties (India) Private Limited 25.00 25.00
(25.00) (25.00)Mr. Puranmal Agrawal 2.27 2.27
(2.10) (2.10)Mr. Suresh Kumar Agrawal 1.90 1.90
(1.77) (1.77)Chaman Metallics Limited – –
(13.72) (13.72)Howrah Gases Limited – –
(35.56) (35.56)Danta Vyappar Kendra Limited – –
(330.00) (330.00)Emerald Trade Link Private Limited – –
(65.00) (65.00)Ginny Traders Private Limited – –
(75.00) (75.00)Rajnath Vyappar Private Limited – –
(100.00) (100.00)Raj Securities Limited – –
(125.00) (125.00)Adhunik Cement Limited 105.38 105.38
(–) (–)
(Rs. in lacs)

120
MSP STEEL & POWER LIMITED
Schedules forming part of the Consolidated Balance Sheet and Profit and Loss Account
SCHEDULE 22 SIGNIFICANT ACCOUNTING POLICIES AND NOTES ON ACCOUNTS (Contd.)
19. During the year, the Company has hedged its exposure in the iron and steel products by way of entering into certain commodity contracts
through the broker dealer. These contracts were settled, otherwise than through actual delivery, whereby the Company has earned an
amount of Rs.3,025 lacs on net settlement basis. Based on a legal opinion obtained, the said income has been treated as income from
normal business.
20. The Board of Directors of the Company approved the final audited financial statements for the year 2009-2010 at their meeting dated May
29, 2010. The dividend for the year 2009-2010 was proposed by the Board of Directors in their meeting dated June 28, 2010 and accordingly
paid and accounted for in the financial statements for the year ended March 31, 2011.
21. Previous year’s figures including those given in brackets have been regrouped / rearranged where necessary to conform to this year’s
classification.
Signatories to Schedules 1 to 22
As per our Report of even date
For S. R. Batliboi & Co. For and on behalf of Board of Directors
Firm Registration No.- 301003E
Chartered Accountants
per Sanjoy K. Gupta Puranmal Agrawal Suresh Kumar Agrawal
Partner Chairman Managing Director
Membership No 54968
22, Camac Street, Block C, 3rd Floor
Kolkata -700 016 Pinky Gupta
Date : 30th May, 2011 Company Secretary

A PRODUCT
Forward-looking statements In this annual report we have disclosed forward-looking information to enable investors to comprehend our prospects and take informed
investment decisions. This report and other statements – written and oral –that we periodically make contain forward-looking statements
that set out anticipated results based on the management’s plans and assumptions. We have tried wherever possible to identify such
statements by using words such as ‘anticipates’, ‘estimates’, ‘expects’, ‘projects’, ‘intends’, ‘plans’, ‘believes’ and words of similar substance
in connection with any discussion of future performance.
We cannot guarantee that these forward-looking statements will be realised, although we believe we have been prudent in our assumptions.
The achievement of results is subject to risks, uncertainties and even inaccurate assumptions. Should known or unknown risks or
uncertainties materialise, or should underlying assumptions prove inaccurate, actual results could vary materially from those anticipated,
estimated or projected.
We undertake no obligation to publicly update any forward-looking statements, whether as a result of new information, future events or otherwise
Board of DirectorsChairman
Mr. Puranmal Agrawal
Managing Director
Mr. Suresh Kumar Agrawal
Non Executive Directors
Mr. Manish Agrawal
Mr. Saket Agrawal
Independent Directors
Mr. Arvind Kumar Saraf
Mr. Navneet Jagatramka
Mr. Amit Mehta
Mr. Pavan Kumar Gupta
Company SecretaryMiss Pinky Gupta, B.Com (H), ACS
AuditorsM/s. S. R. Batliboi & Co.
Chartered Accountants
BankersState Bank of India
ING Vysya Bank
Andhra Bank
UCO Bank
Indian Overseas Bank
State Bank of Mysore
Allahabad Bank
Axis Bank
State Bank of Bikaner & Jaipur
United Bank of India
Corporation Bank
DBS Bank Limited
ICICI Bank Limited
Union Bank of India
Dena Bank
Oriental Bank of Commerce
Registered Office1, Crooked Lane,
Kolkata - 700 069
Ph. No: (033) 22483795
Fax No: 22484138
Corporate Office16/S, Block-‘A’, New Alipore,
Kolkata - 700 053
Ph No: 40057777/23990038/3940
Fax No: 23982239/40057788
E-mail: [email protected]
Share RegistrarsKarvy Computershare Pvt. Ltd
46, Avenue 4, Street No. 1,
Banjara Hills,
Hyderabad - 500 034
Corporate Information
02Corporate identity
04Growth in our numbers
06Strategic overview by the Chairman
12Answering shareholder questions
16Business segment review
18Exciting industry prospects
20Corporate social responsibility
21Management discussion and analysis report
25Directors’ Report
30Report on Corporate Governance
38CEO & CFO certification
39Auditors’ Report
42Balance sheet
43Profit & loss account
44Cash flow statement
45Schedules and notes
71Balance sheet abstract
72Section 212
73Other financial statements
Contents

MSP STEEL & POWER LIMITED | ANNUAL REPORT, 2010-11
MSP Group 16/S, Block-A, New Alipore, Kolkata 700 053
Phone: 033 40057777/40145678
Fax: 23982239/40057799
Email: [email protected]
Website: www.mspsteel.com
BEBOLD.BEDIFFERENT.


