Balance-of-Payments Accounts and Net Financial Flows.
38
Balance-of-Payments Balance-of-Payments Accounts and Net Accounts and Net Financial Flows Financial Flows
-
Upload
margery-douglas -
Category
Documents
-
view
221 -
download
0
Transcript of Balance-of-Payments Accounts and Net Financial Flows.

Balance-of-Payments Balance-of-Payments Accounts and Net Accounts and Net Financial FlowsFinancial Flows
Economic Summits Fred Thompson 2
Financial InflowFinancial Inflow
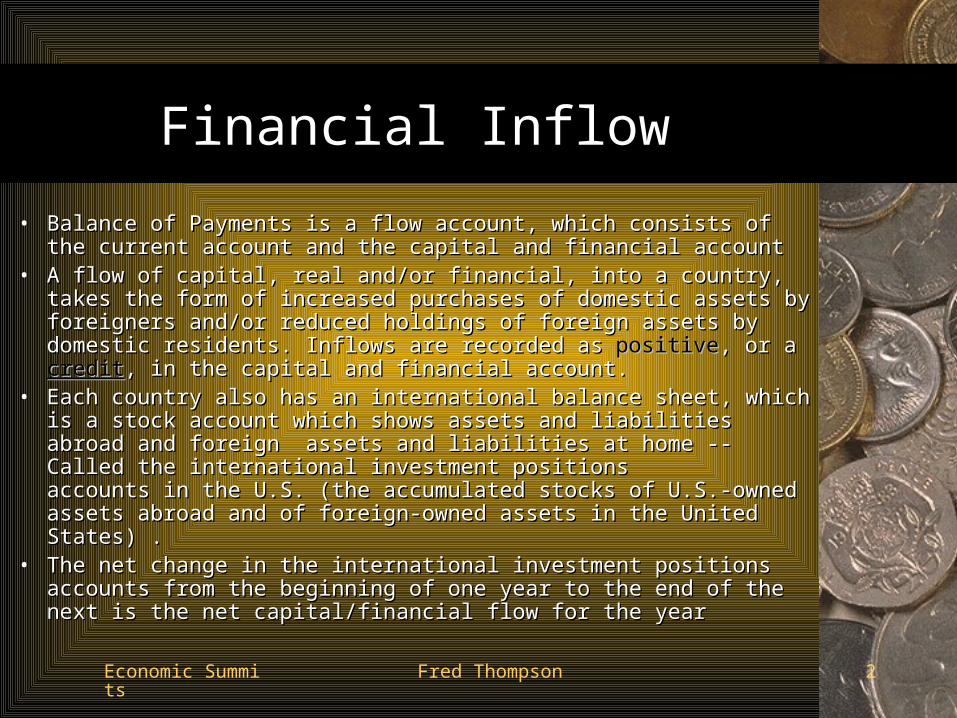
• Balance of Payments is a flow account, which consists of the current Balance of Payments is a flow account, which consists of the current account and the capital and financial account account and the capital and financial account
• A flow of capital, real and/or financial, into a country, takes the form A flow of capital, real and/or financial, into a country, takes the form of increased purchases of domestic assets by foreigners and/or reduced of increased purchases of domestic assets by foreigners and/or reduced holdings of foreign assets by domestic residents. Inflows are recorded holdings of foreign assets by domestic residents. Inflows are recorded as as positivepositive, or a , or a creditcredit, in the capital and financial account., in the capital and financial account.
• Each country also has an international balance sheet, which is a stock Each country also has an international balance sheet, which is a stock account which shows assets and liabilities abroad and foreign assets account which shows assets and liabilities abroad and foreign assets and liabilities at home -- Called the international investment positions and liabilities at home -- Called the international investment positions accounts in the U.S. (the accumulated stocks of U.S.-owned assets accounts in the U.S. (the accumulated stocks of U.S.-owned assets abroad and of foreign-owned assets in the United States) .abroad and of foreign-owned assets in the United States) .
• The net change in the international investment positions accounts from The net change in the international investment positions accounts from the beginning of one year to the end of the next is the net the beginning of one year to the end of the next is the net capital/financial flow for the yearcapital/financial flow for the year

Economic Summits Fred Thompson 3
Exchange and Net FlowsExchange and Net Flows
• Exchange of Real Assets – exchange of goods and Exchange of Real Assets – exchange of goods and services for other goods and services or for financial services for other goods and services or for financial claims (will give rise to a net change in financial claims if claims (will give rise to a net change in financial claims if x≠m)x≠m)
• Exchange of Financial Assets – Exchange of financial Exchange of Financial Assets – Exchange of financial claims for other financial claims (net financial claims are claims for other financial claims (net financial claims are unchanged)unchanged)
• Hence, m-x = net capital flow, also = I-SHence, m-x = net capital flow, also = I-S
[ignoring reporting errors and official settlements][ignoring reporting errors and official settlements]
Economic Summits Fred Thompson 4
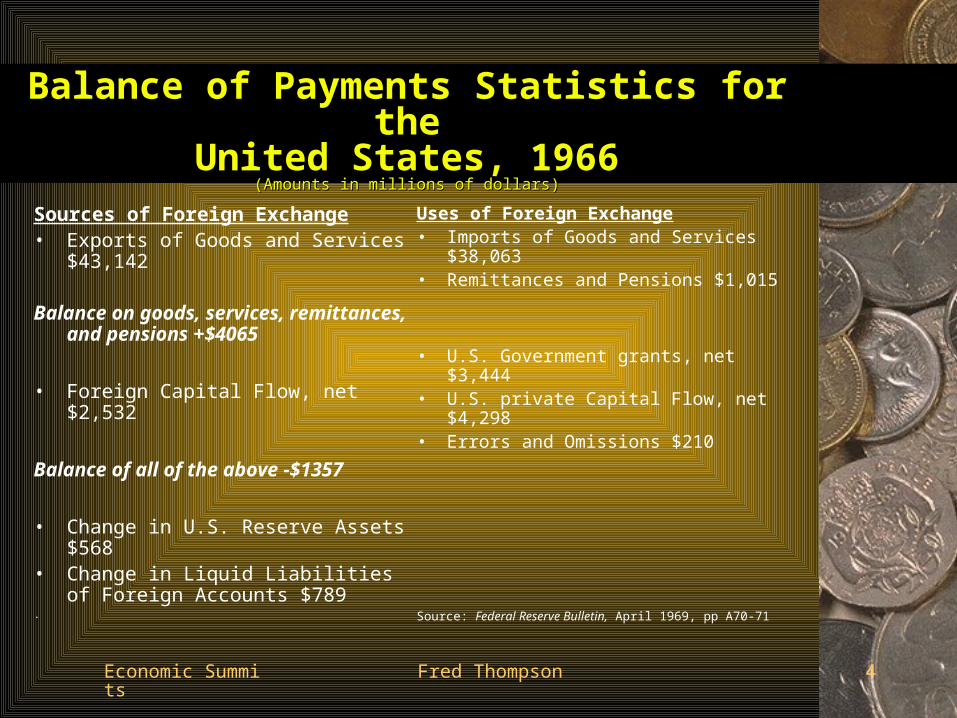
Balance of Payments Statistics for theBalance of Payments Statistics for theUnited States, 1966United States, 1966
(Amounts in millions of dollars)(Amounts in millions of dollars)
Sources of Foreign Exchange• Exports of Goods and Services $43,142
Balance on goods, services, remittances, and pensions +$4065
• Foreign Capital Flow, net $2,532
Balance of all of the above -$1357
• Change in U.S. Reserve Assets $568• Change in Liquid Liabilities of Foreign
Accounts $789.
Uses of Foreign Exchange• Imports of Goods and Services $38,063• Remittances and Pensions $1,015
• U.S. Government grants, net $3,444• U.S. private Capital Flow, net $4,298• Errors and Omissions $210
Source: Federal Reserve Bulletin, April 1969, pp A70-71
The Balance of Payments The Balance of Payments Accounting SystemAccounting System
International Bookkeeping
Economic Summits Fred Thompson 6
International Transactions Accounts (Balance of Payments) A quarterly statistical summary of
transactions between U.S. and foreign residents organized into three major categories:– The current account– The capital account– The financial account
Economic Summits Fred Thompson 7
Balance of Payments
• System of accounts which is a subset of the National Income and Production Accounts– A double-entry bookkeeping system.– Debit Entries: Transactions that generate a
payment outflow (e.g., import).– Credit Entries: Transactions that generate a
payment inflow (e.g., export).
Economic Summits Fred Thompson 8
Balance of Payments
• The current account includes exports and imports of goods, services, income, and current transfers.– Goods– Services– Income Receipts and Payments– Unilateral Transfers
Economic Summits Fred Thompson 9
Balance of Payments
• Goods: Exports and imports of tangible items.
• Services: Exports and imports of services, for example:– Typical business services such as banking and
financial services, insurance, and consulting.– Tourism
Economic Summits Fred Thompson 10
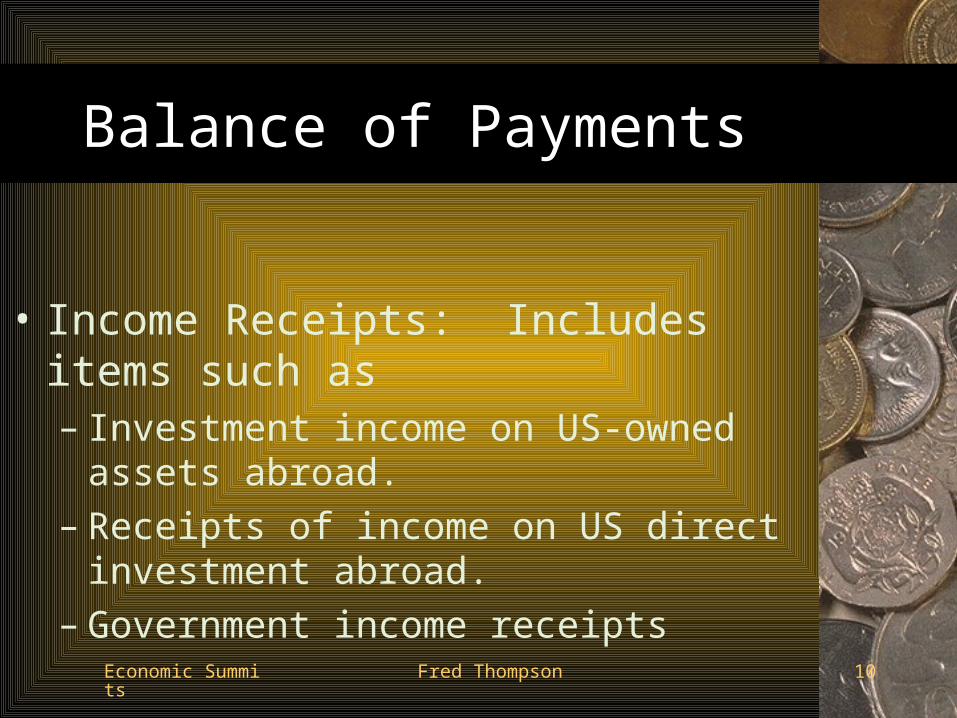
Balance of Payments
• Income Receipts: Includes items such as– Investment income on US-owned assets abroad.– Receipts of income on US direct investment
abroad.– Government income receipts
Economic Summits Fred Thompson 11
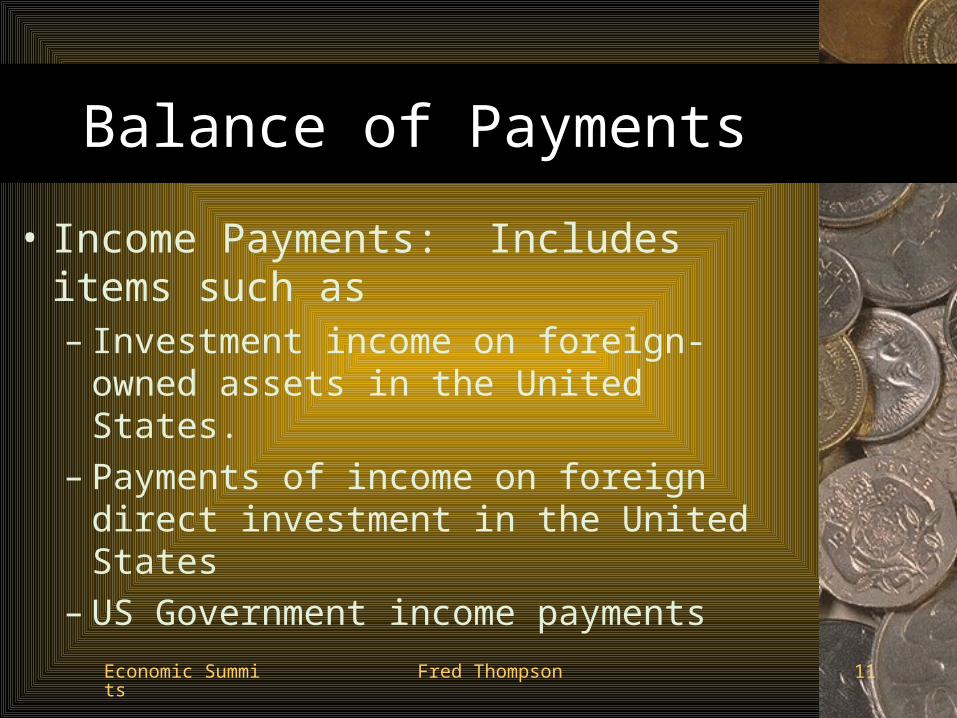
Balance of Payments
• Income Payments: Includes items such as– Investment income on foreign-owned assets in
the United States.– Payments of income on foreign direct
investment in the United States– US Government income payments
Economic Summits Fred Thompson 12
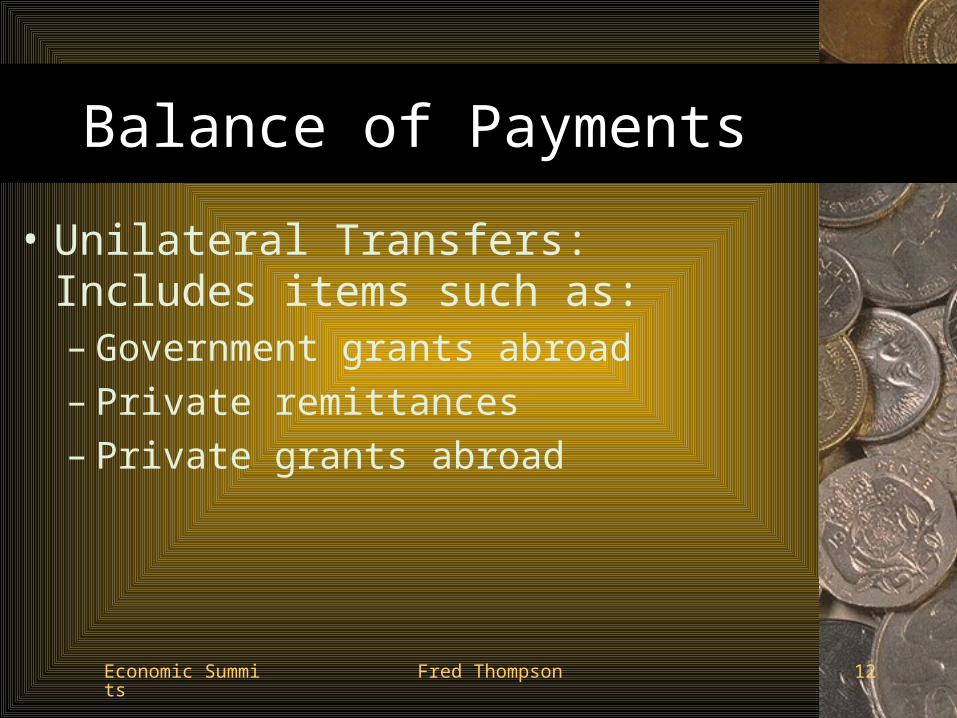
Balance of Payments
• Unilateral Transfers: Includes items such as:– Government grants abroad– Private remittances– Private grants abroad
Economic Summits Fred Thompson 13
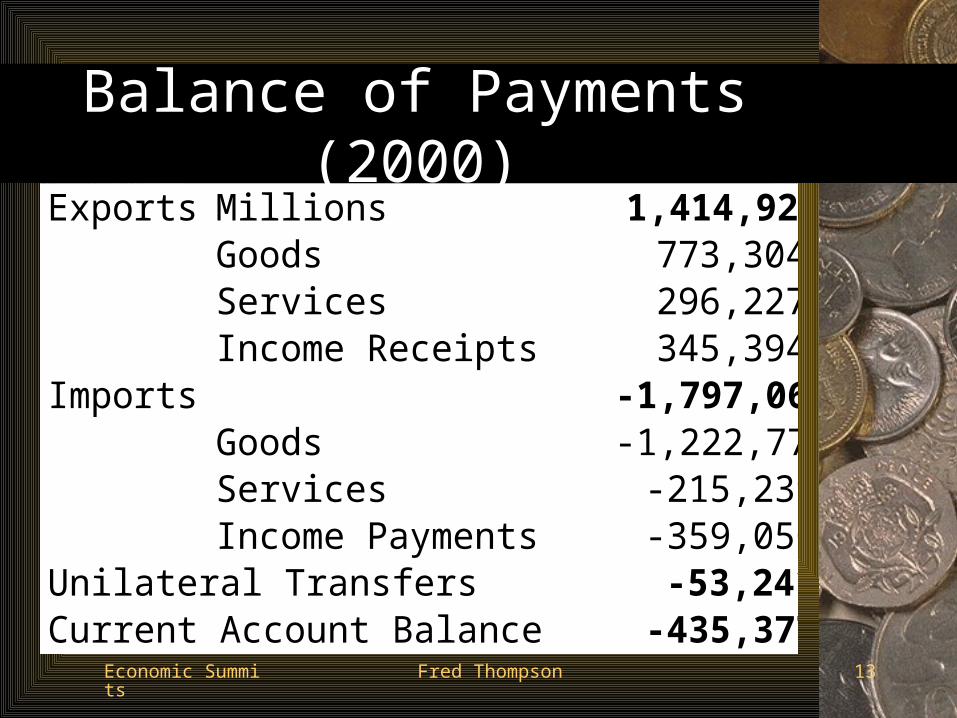
Balance of Payments (2000)Exports Millions 1,414,925
Goods 773,304 Services 296,227 Income Receipts 345,394
Imports -1,797,061 Goods -1,222,772 Services -215,239 Income Payments -359,050Unilateral Transfers -53,241Current Account Balance -435,377
Economic Summits Fred Thompson 14
Balance of PaymentsThe Financial Sector
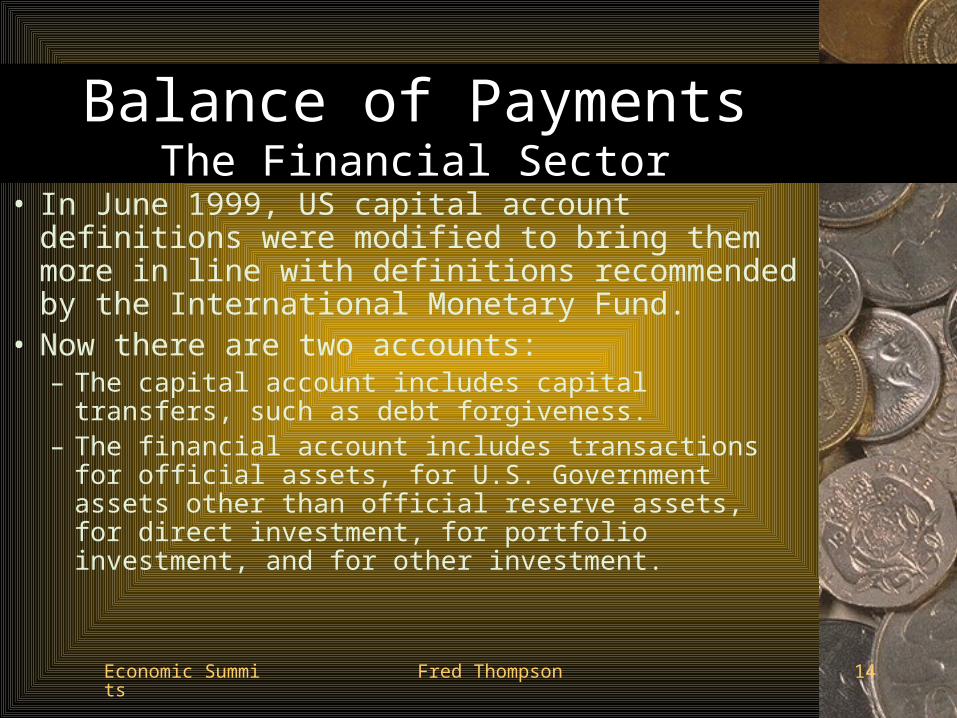
• In June 1999, US capital account definitions were modified to bring them more in line with definitions recommended by the International Monetary Fund.
• Now there are two accounts: – The capital account includes capital transfers, such as
debt forgiveness. – The financial account includes transactions for official
assets, for U.S. Government assets other than official reserve assets, for direct investment, for portfolio investment, and for other investment.

Economic Summits Fred Thompson 15
Balance of PaymentsThe Financial Sector
• The new Capital Account includes items that were previously included in unilateral transfers, such as:– Debt forgiveness– Migrants’ transfers (as they leave the country).
• The new capital account is small for the US (< 0.1 percent of capital flows), but expected to grow.
Economic Summits Fred Thompson 16
Balance of PaymentsThe Financial Sector
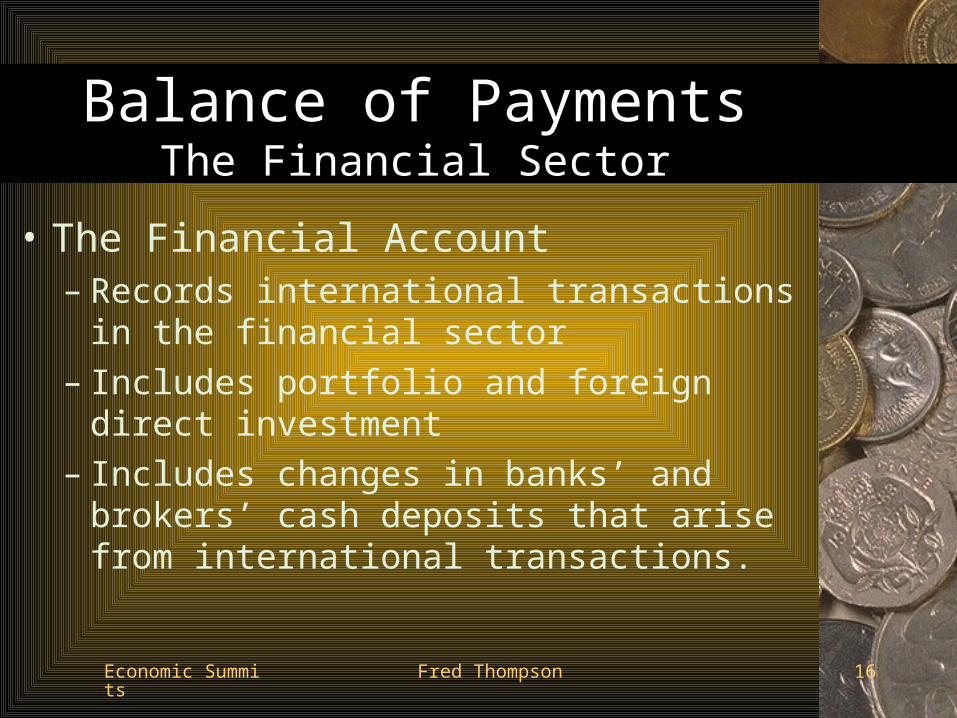
• The Financial Account– Records international transactions in the
financial sector– Includes portfolio and foreign direct investment– Includes changes in banks’ and brokers’ cash
deposits that arise from international transactions.
Economic Summits Fred Thompson 17
Balance of PaymentsThe Financial Sector
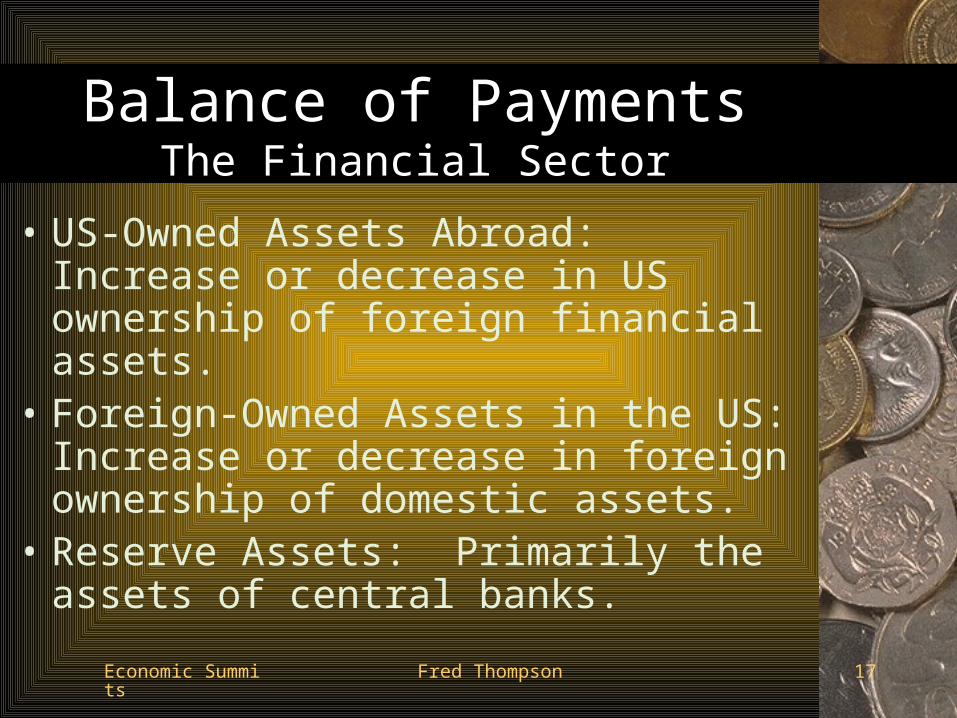
• US-Owned Assets Abroad: Increase or decrease in US ownership of foreign financial assets.
• Foreign-Owned Assets in the US: Increase or decrease in foreign ownership of domestic assets.
• Reserve Assets: Primarily the assets of central banks.
Economic Summits Fred Thompson 18
Balance of PaymentsThe Financial Sector
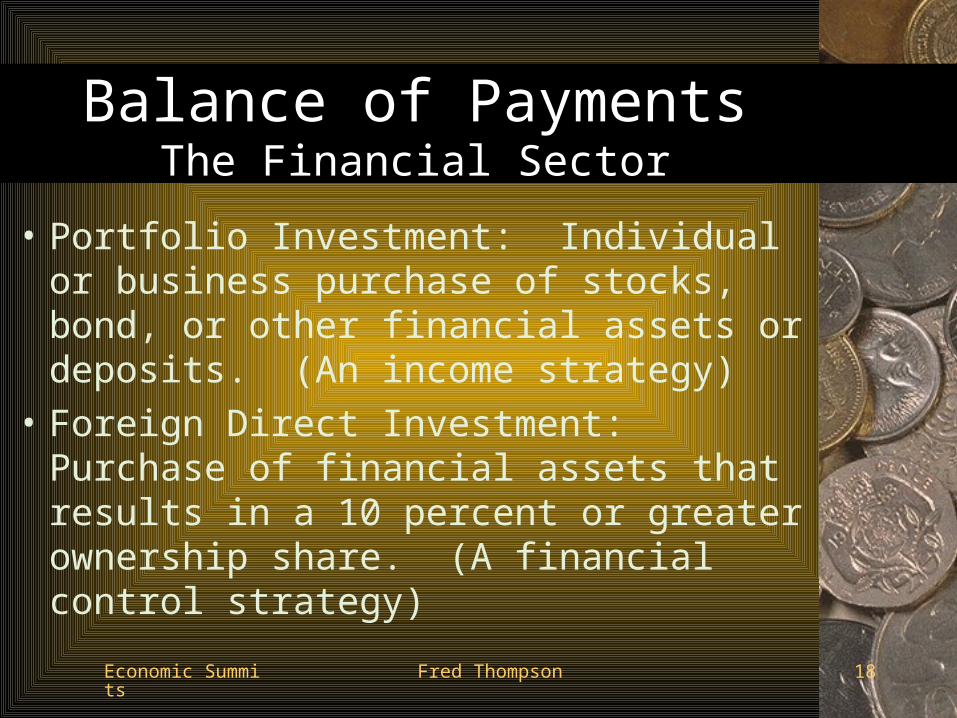
• Portfolio Investment: Individual or business purchase of stocks, bond, or other financial assets or deposits. (An income strategy)
• Foreign Direct Investment: Purchase of financial assets that results in a 10 percent or greater ownership share. (A financial control strategy)
Economic Summits Fred Thompson 19
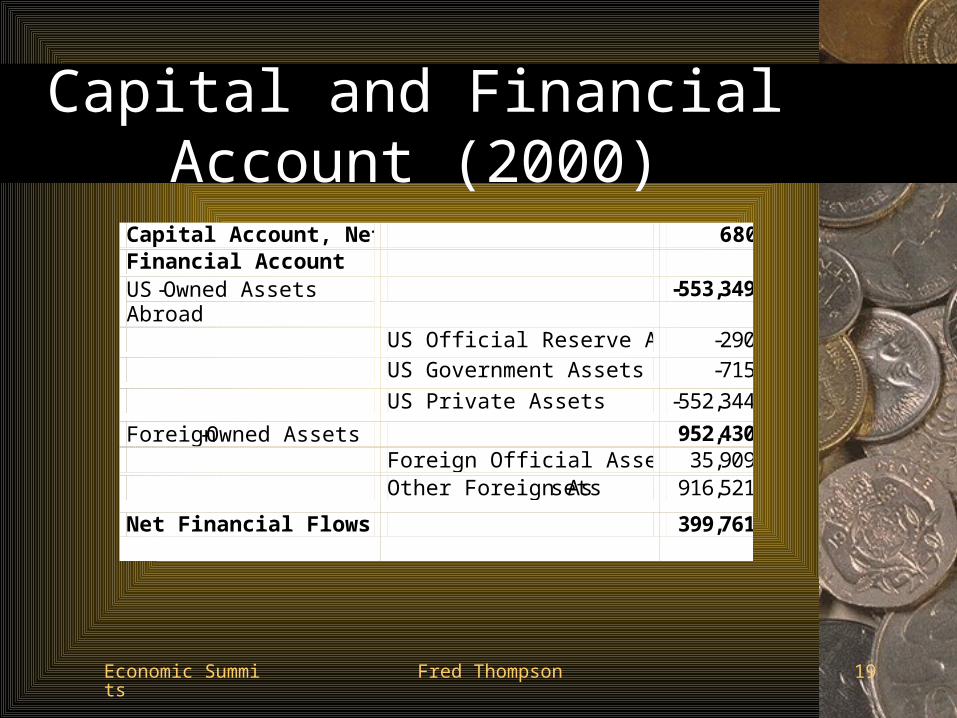
Capital and Financial Account (2000)
Capital Account, Net 680 Financial Account US-Owned Assets Abroad
-553,349
US Official Reserve Assets -290
US Government Assets -715
US Private Assets -552,344
Foreign-Owned Assets 952,430 Foreign Official Assets 35,909 Other Foreign Assets 916,521
Net Financial Flows 399,761
Economic Summits Fred Thompson 20
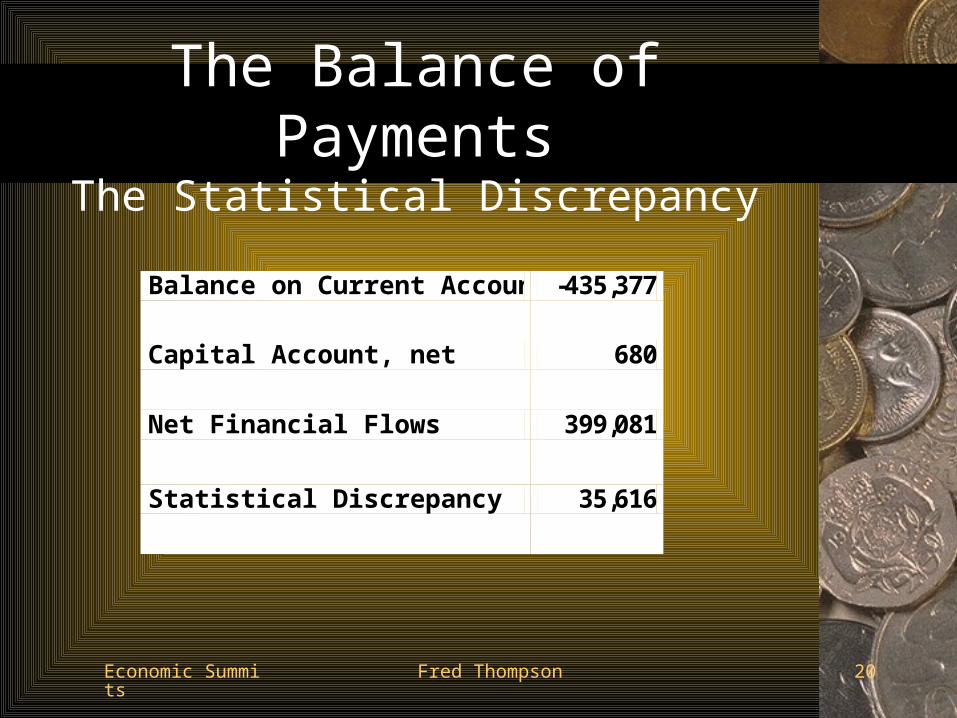
The Balance of PaymentsThe Statistical Discrepancy
Balance on Current Account -435,377
Capital Account, net 680
Net Financial Flows 399,081
Statistical Discrepancy 35,616
International Allocation of International Allocation of CapitalCapital

Economic Summits Fred Thompson 22
Feldstein - Horioka
• Savings and Investment Relation
• Based on a closed economy income condition:
y = c + i + g.
• Rearrange as:
y - c - g = i.
Economic Summits Fred Thompson 23
Feldstein - Horioka
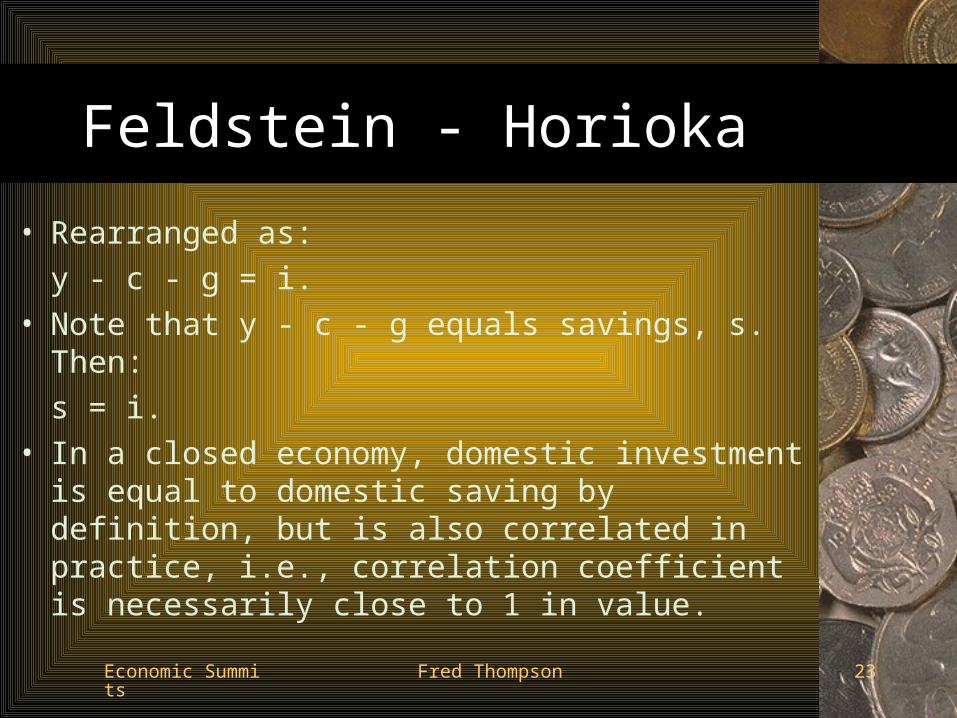
• Rearranged as:
y - c - g = i.
• Note that y - c - g equals savings, s. Then:
s = i.
• In a closed economy, domestic investment is equal to domestic saving by definition, but is also correlated in practice, i.e., correlation coefficient is necessarily close to 1 in value.
Economic Summits Fred Thompson 24
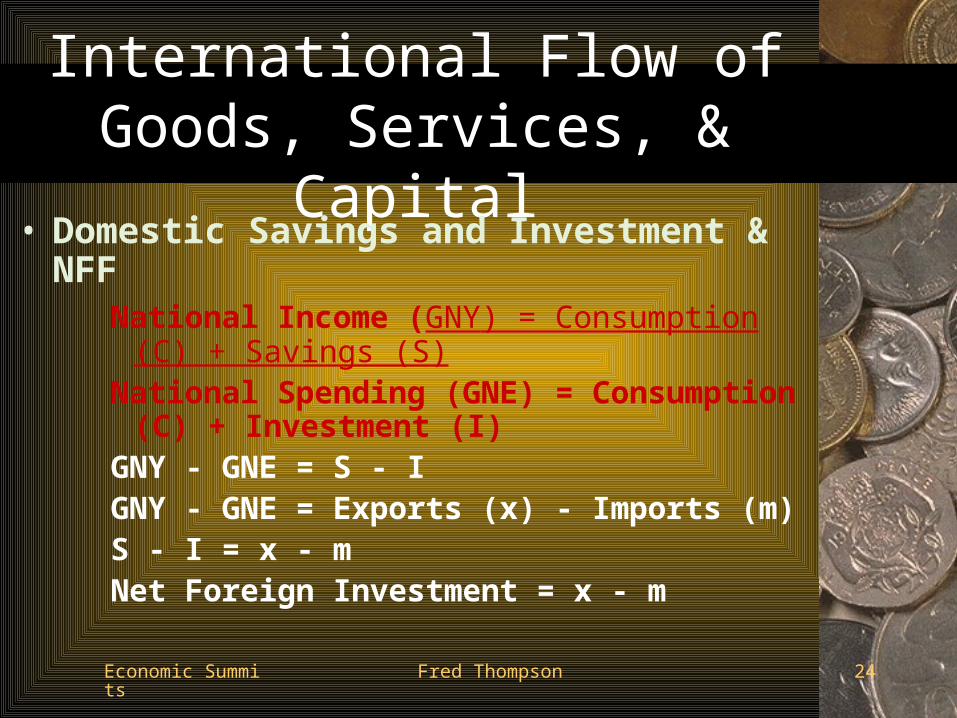
International Flow of Goods, Services, & Capital
• Domestic Savings and Investment & NFFNational Income (GNY) = Consumption (C) +
Savings (S)National Spending (GNE) = Consumption (C) +
Investment (I)GNY - GNE = S - IGNY - GNE = Exports (x) - Imports (m)S - I = x - mNet Foreign Investment = x - m
Economic Summits Fred Thompson 25
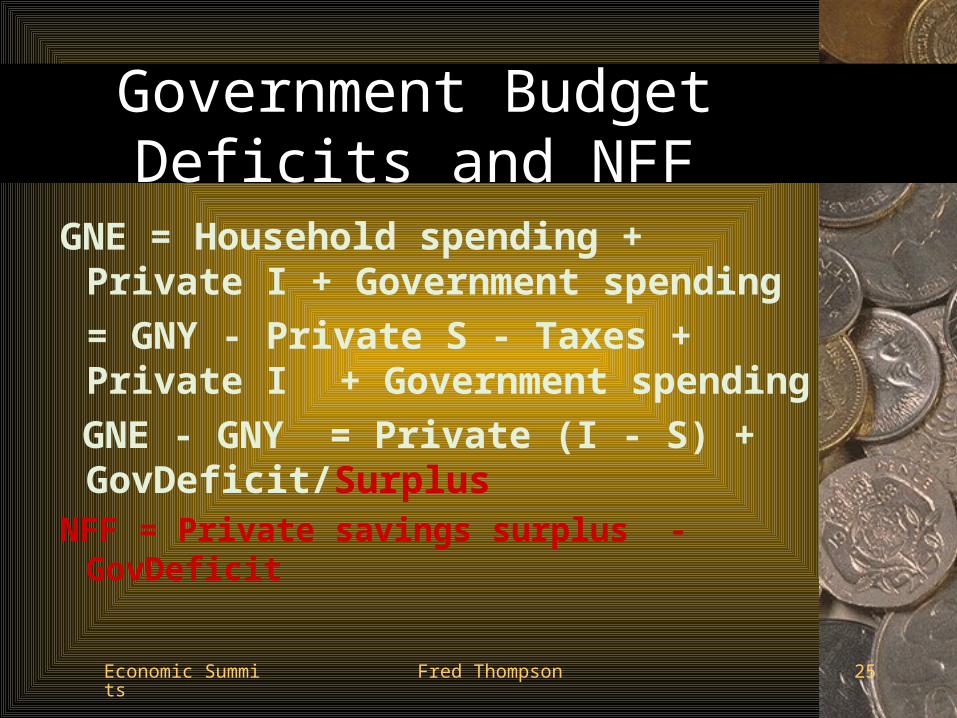
Government Budget Deficits and NFF
GNE = Household spending + Private I + Government spending
= GNY - Private S - Taxes + Private I + Government spending
GNE - GNY = Private (I - S) + GovDeficit/Surplus
NFF = Private savings surplus - GovDeficit
US Balance of PaymentsUS Balance of Payments

Economic Summits Fred Thompson 27
U.S. TRADE AND CURRENT ACCOUNT BALANCESEXPRESSED AS A PERCENTAGE OF GDP
-6%
-4%
-2%
0%
2%
4%
46 50 54 58 62 66 70 74 78 82 86 90 94 98 2
C/A
TB
Economic Summits Fred Thompson
Basic PremiseBasic Premise
A current account deficit A current account deficit mustmust be financed by be financed by capital inflows, or it cannot be incurred in the capital inflows, or it cannot be incurred in the first placefirst place
Economic Summits Fred Thompson
Over 1982-2003, U.S. current Over 1982-2003, U.S. current account deficits have averaged account deficits have averaged
$183 billion per year.$183 billion per year.$4 $4 trilliontrillion worth of assets have worth of assets have
been transferred to foreign been transferred to foreign ownership.ownership.
FACTFACT
Economic Summits Fred Thompson 30
Trade and Scale Variables ITrade and Scale Variables I
QuickTime™ and aTIFF (Uncompressed) decompressor
are needed to see this picture.
Economic Summits Fred Thompson 31
Scale Variables I
U.S. monthly GDP: $1 trillionU.S. monthly GDP: $1 trillion
• Monthly goods and services exports: $130 Monthly goods and services exports: $130 billion = 13% billion = 13%
• Monthly goods and services imports: $185 Monthly goods and services imports: $185 billion = 18.5% billion = 18.5%
• Balancing item: net capital flow: $55 billion Balancing item: net capital flow: $55 billion = 5.5% = 5.5%
Economic Summits Fred Thompson 32
Scale Variables II
U.S. GDP per worker: $84,000 per U.S. GDP per worker: $84,000 per yearyear
• Exports of $10,900 per year Exports of $10,900 per year • Imports of $15,500 per yearImports of $15,500 per year
Economic Summits Fred Thompson
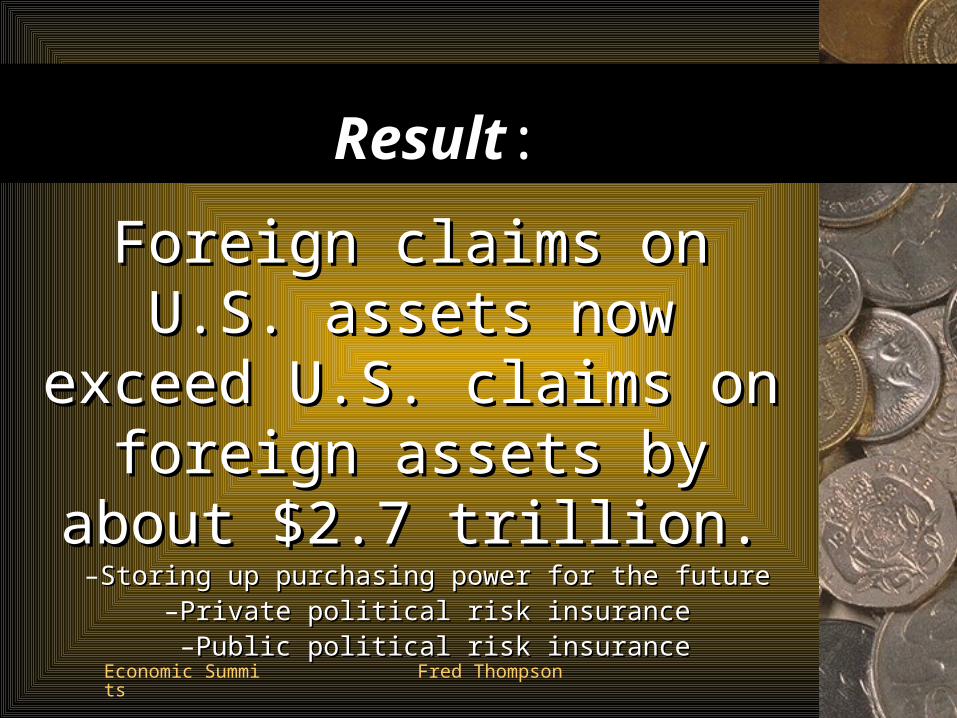
Foreign claims on U.S. assets Foreign claims on U.S. assets now exceed U.S. claims on now exceed U.S. claims on foreign assets by about $2.7 foreign assets by about $2.7
trillion.trillion.–Storing up purchasing power for the future Storing up purchasing power for the future
–Private political risk insurance Private political risk insurance –Public political risk insurancePublic political risk insurance
ResultResult::
Economic Summits Fred Thompson
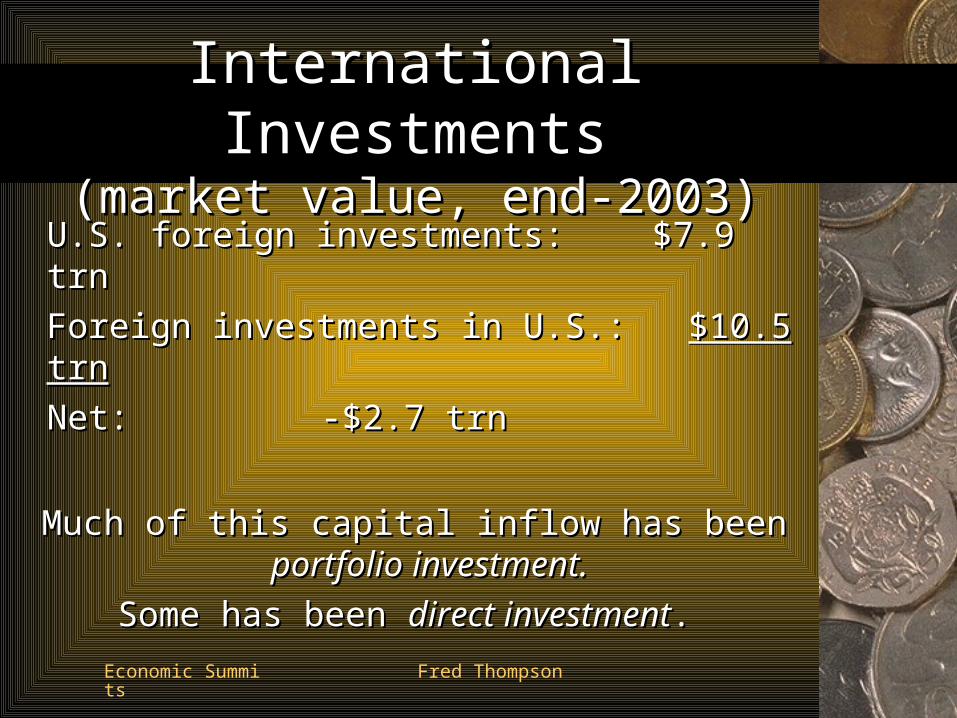
International InvestmentsInternational Investments(market value, end-2003)(market value, end-2003)
U.S. foreign investments:U.S. foreign investments: $7.9 trn $7.9 trn
Foreign investments in U.S.:Foreign investments in U.S.: $10.5 trn$10.5 trn
Net:Net: -$2.7 trn -$2.7 trn
Much of this capital inflow has been Much of this capital inflow has been portfolio portfolio investment.investment.
Some has been Some has been direct investmentdirect investment..

Economic Summits Fred Thompson
Foreign Direct InvestmentForeign Direct Investment(market value, end-2003)(market value, end-2003)
U.S. DI abroad:U.S. DI abroad: $2.7 trillion$2.7 trillion
Foreign DI in U.S.:Foreign DI in U.S.: $2.4 trillion$2.4 trillion
Net:Net: $0.3 trillion $0.3 trillion
Economic Summits Fred Thompson 36
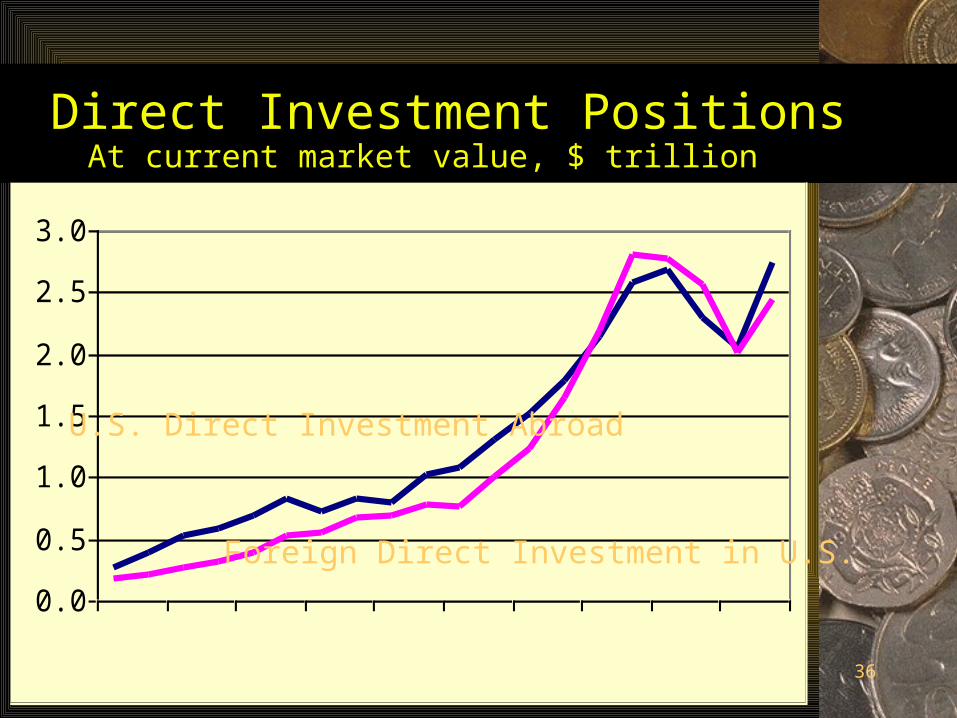
Direct Investment PositionsDirect Investment PositionsAt current market value, $ trillionAt current market value, $ trillion
0.0
0.5
1.0
1.5
2.0
2.5
3.0
84 86 88 90 92 94 96 98 00 02
U.S. Direct Investment Abroad
Foreign Direct Investment in U.S.
Economic Summits Fred Thompson 37
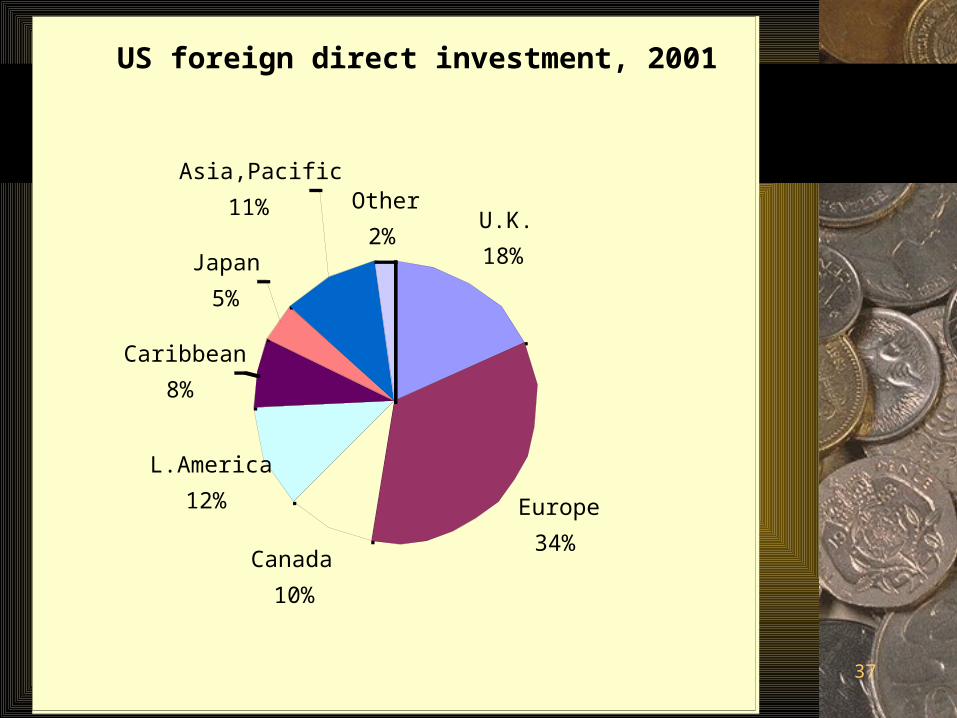
US foreign direct investment, 2001
U.K.
18%
Europe
34%Canada
10%
L.America
12%
Caribbean
8%
Japan
5%
Asia,Pacific
11% Other
2%
Economic Summits Fred Thompson 38
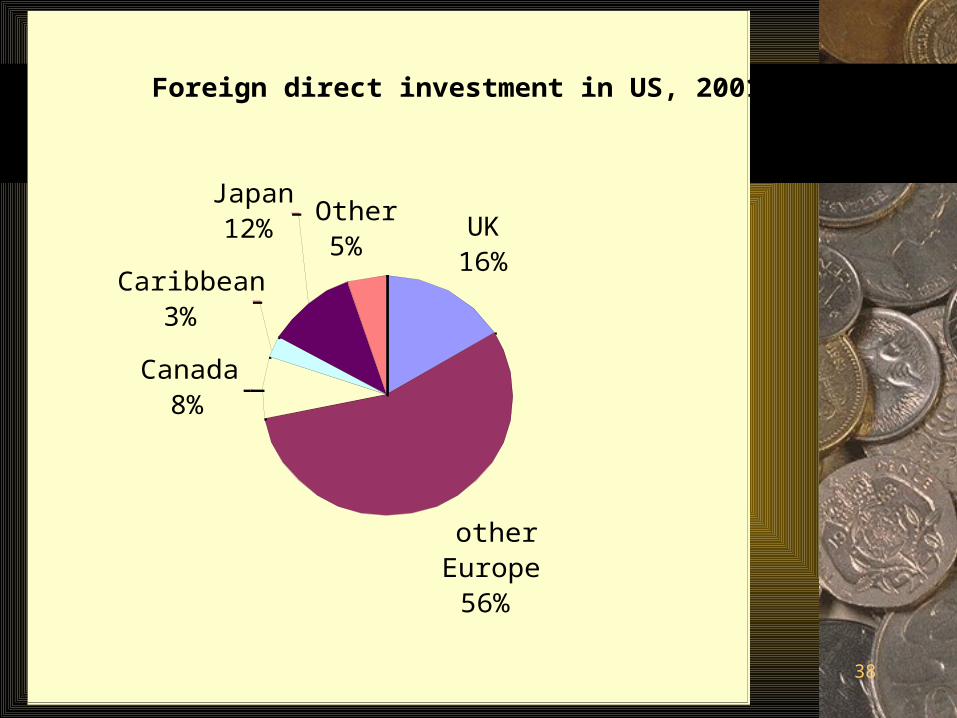
Foreign direct investment in US, 2001
UK16%
other Europe
56%
Canada8%
Caribbean3%
Japan12%
Other5%