BALANCE
12
FINANCIAL RESULTS OF AEROFLOT, JSC ACCORDING TO THE RUSSIAN ACCOUNTING STANDARDS FOR 12 MONTHS OF 2005. KEY STATISTICS FOR 1Q 2006.
-
Upload
fatima-byrd -
Category
Documents
-
view
12 -
download
0
description
FINANCIAL RESULTS OF AEROFLOT, JSC ACCORDING TO THE RUSSIAN ACCOUNTING STANDARDS FOR 12 MONTHS OF 2005. KEY STATISTICS FOR 1Q 2006. BALANCE. RUR million. 01.01.2005 31.12.2005 Changes %. FIXED ASSETS 7 387 7 64 3 25 6 3,4% CURRENT - PowerPoint PPT Presentation
Transcript of BALANCE
FINANCIAL RESULTS OF AEROFLOT,
JSC ACCORDING TO THE RUSSIAN ACCOUNTING STANDARDS FOR 12 MONTHS OF 2005.
KEY STATISTICS FOR 1Q 2006.

NONCURRENT LIABILITIES 463 2 767 2 304 497,6%CURRENT LIABILITIES 7 502 9 254 1 752 23,3%
CAPITAL AND RESERVES 16 331 20 734 4 403 26,9%
01.01.2005 31.12.2005 Changes %
FIXED ASSETS 7 387 7 643 256 3,4%CURRENT ASSETS 16 909 25 112 8 203 48,5%
TOTAL ASSETS 24 296 32 755 8 459 34,8%
TOTAL LIABILITIES 24 296 32 755 8 459 34,8%AND OWN CAPITAL
BALANCE RUR million

NET ASSETS ACCOUNTING
01.01.2005 г. 01.01.2006 г.
Аssets taken into account 24 296 32 755
Liabilities, taken into account 7 955 11 992
Value of the company’s net assets 16 341 20 763
RUR million

Parameters of financial stability
Parameters Recommended values
Year2004
Year 2005
Debt to equity ratio0,700 0,487 0,578
Noncurrent assets to noncurrent liabilities ratio
more or equal to 1
2,212 2,717
Coverage ratioот 1,00 to
2,00 2,257 2,722
Interim coverage ratioот 0,50 to
0,80 1,803 2,349
Current ratioот 0,20 to
0,40 0,232 0,345

Net operating 62 849 56 377 6 472 11,5%incomeProduction cost (53 738) (46 496) 7 242 15,6%Gross profit 9 111 9 882 (771) (7,8%)Business expenses (3 523) (3 405) 118 3,5%Administrative expenses (2 298) (2 163) 135 6,3%Profit on ordinary 3 291 4 314 (1 023) (23,7%)activitiesOther net profits and losses 5 075 3 952 1 123 28,4%
Pre-tax profit
8 366 8 266 100 1,2%
Net profit 6 032 6 330 (298) (4,7%)
2005 2004 Changes %
PROFIT AND LOSS ACCOUNT RUR million
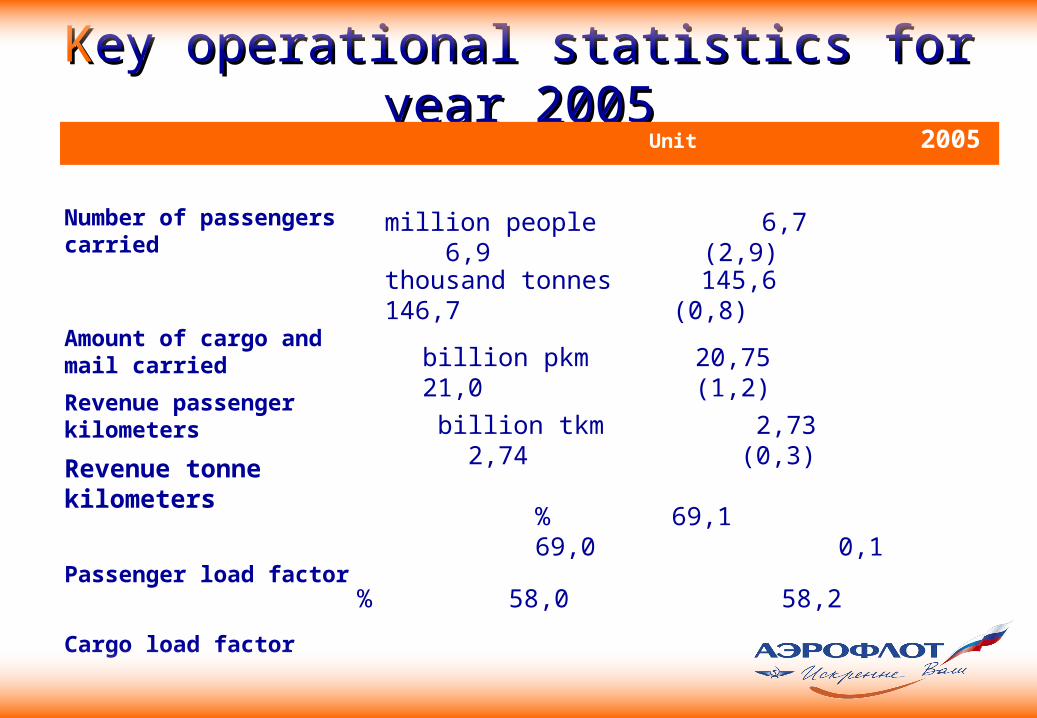
KKey operational statistics for year 2005ey operational statistics for year 2005
Number of passengers carried
Amount of cargo and mail carried
Revenue passenger kilometers
Revenue tonne kilometers
Passenger load factor
Cargo load factor
Unit 2005 2004 % on 2004
million people 6,7 6,9 (2,9)
billion tkm 2,73 2,74 (0,3)
thousand tonnes 145,6 146,7 (0,8)
billion pkm 20,75 21,0 (1,2)
% 69,1 69,0 0,1
% 58,0 58,2 (0,2)

Estimated percentage of aviation fuel and lubricants costs for the period of 2003 to 2005
(RUR million)
0
10000
20000
30000
40000
50000
60000
70000
2003 2004 2005
Aviation fuel and oil& lubricants
Total expenses
Expensesexcluding aviationfuel and oil &lubricants costsRevenues

Estimated percentage of aviation fuel and lubricants costs for the period of 2003 to 2005
(RUR million)
2003 2004 2005
AVIATION FUEL AND 9 142 13 311 18 690OIL & LUBRICANTSTOTAL EXPENSES 45 417 52 063 59 558EXPENSES EXCLUDING AVIATIONFUEL AND OIL & LUBRICANTS COSTS 36 275 38 752 40 869
% OF OIL AND LUBRICANTS COSTS TO TOTAL EXPENSES 20,1 25,6 31,4EXPENSE GROWTH WITHOUTOIL AND LUBRICANTS COSTS (%) 6,8 5,5

Weighted average cost of fuel for the period from 2003 to 2005
0
100
200
300
400
500
600
2003 2004 2005
US dollar pertonne of aviationfuel
2003 г. 271.0 US$/tonne
2004 г. 364.9 US$/tonne
2005 г. 586.3 US$/tonne

NONCURRENT LIABILITIES 2 767 2 780 13 0,4%CURRENT LIABILITIES 9 254 7 349 1 905 (20,6%)
CAPITAL AND RESERVES 20 733 21 097 364 1,8%
31.12.2005 31.03.2006 Changes %
FIXED ASSETS 7 641 11 165 3 524 46,1%CURRENT ASSETS 25 112 20 062 (5 050) (20,1%)
TOTAL ASSETS 32 754 31 226 (1 528) (4,7%)
TOTAL LIABILITIES 32 754 31 226 (1 528) (4,7%)AND OWN CAPITAL
BALANCE mln RUR
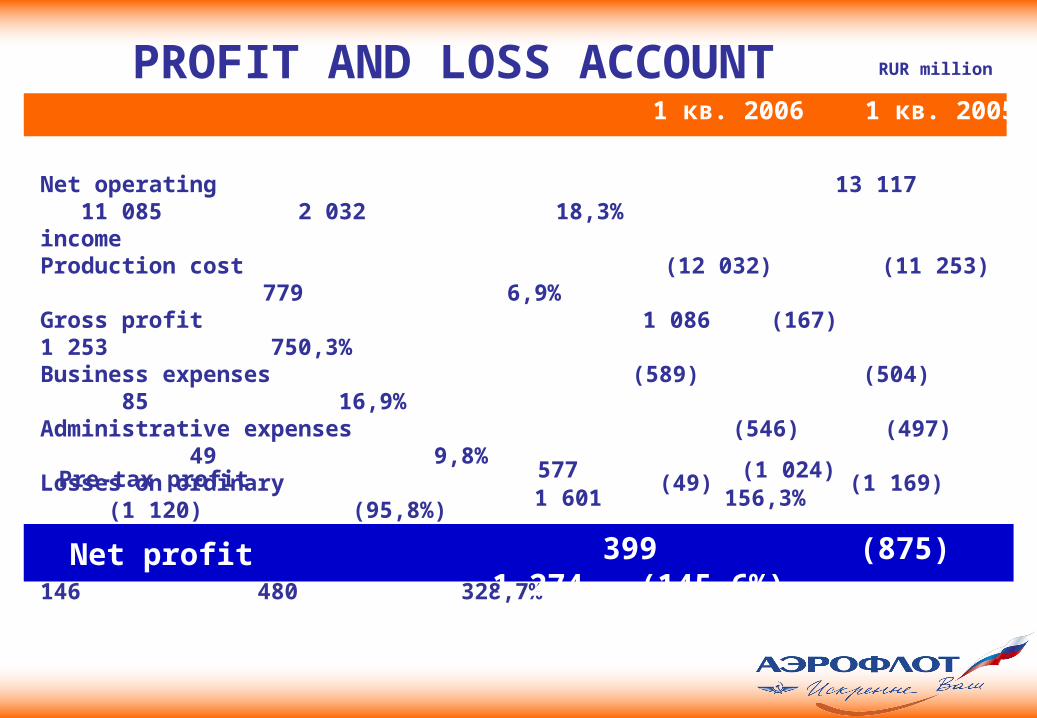
Net operating 13 117 11 085 2 032 18,3%incomeProduction cost (12 032) (11 253) 779 6,9%Gross profit 1 086 (167) 1 253 750,3%Business expenses (589) (504) 85 16,9%Administrative expenses (546) (497) 49 9,8%Losses on ordinary (49) (1 169) (1 120) (95,8%)activitiesOther net profits and losses 626 146 480 328,7%
Pre-tax profit
577 (1 024) 1 601 156,3%
Net profit 399 (875) 1 274 (145,6%)
1 кв. 2006 1 кв. 2005 Changes %
PROFIT AND LOSS ACCOUNT RUR million

Key operational statistics for 1Q 2006Key operational statistics for 1Q 2006
Number of passengers carried
Amount of cargo and mail carried
Revenue passenger kilometers
Revenue tonne kilometers
Passenger load factor
Cargo load factor
UNIT 1 Q 2006 1Q 2005 % on 2005
млн. чел. 1,38 1,37 0,8
млрд. ткм. 0,59 0,60 (1,8)
тыс. тонн 31,7 34,7 (8,4)
млрд. пкм. 4,40 4,49 (1,9)
% 66,4 65,1 1,3
% 56,0 55,7 0,3