bajaj_ppt (1)
15
CONCEPT OF WORKING CAPIT AL Working capital is the amount of capital that a business has available to meet the day- to-day cash requirements of its operations, or more specially, for financing the conversion of raw material into finished goods, which the company sells for payment. WORKING CAPIT AL MANAGEMENT It is concerned with the problem that arise in attempting to manage the current assets and liabilities and the inter relationship that exists between them.
-
Upload
manasa-murthy -
Category
Documents
-
view
216 -
download
0
Transcript of bajaj_ppt (1)

8/7/2019 bajaj_ppt (1)
http://slidepdf.com/reader/full/bajajppt-1 1/15
CONCEPT OF WORKING CAPITAL
Working capital is the amount of capital that a business has
available to meet the day- to-day cash requirements of itsoperations, or more specially, for financing the conversionof raw material into finished goods, which the companysells for payment.
WORKING CAPITAL MANAGEMENT
It is concerned with the problem that arise in attempting to
manage the current assets and liabilities and the inter relationship that exists between them.

8/7/2019 bajaj_ppt (1)
http://slidepdf.com/reader/full/bajajppt-1 2/15
CLASSIFICATION OF WORKING CAPITAL
WORKING CAPITAL
BASIS OF CONCEPT BASIS OF TIME
Grossworkingcapital
Networkingcapital
Permanent/fixed
workingcapital
Fluctuating/variableworkingcapital

8/7/2019 bajaj_ppt (1)
http://slidepdf.com/reader/full/bajajppt-1 3/15
Current ratio Current assets AZHAR
Current liabilities
It gives a picture about the companies ability to pay back its liabilities
with its short term assets. It can give a sense o efficiencyocompany¶s opearting cycle or its ability to turn product into cash.
PARTICULARS 2009 2010
CURRENT ASSETS 30284 23019
CURRENTLIABLITIES
24581 42812
CURRENT RATIO 1.23 0.53

8/7/2019 bajaj_ppt (1)
http://slidepdf.com/reader/full/bajajppt-1 4/15
QU ICK RATIO AZHAR
Also known as acid test ratio. It measures acompany¶s ability to meet short term obligations withits most liquid assets.
=current assets-stock (quick assets)
current liablities
PARTICULARS 2009 2010
Q UICK ASSETS 20863 38829
Q UICK LIABILITIES 24581 42812
Q UICK RATIO 0.84 0.90
8/7/2019 bajaj_ppt (1)
http://slidepdf.com/reader/full/bajajppt-1 5/15
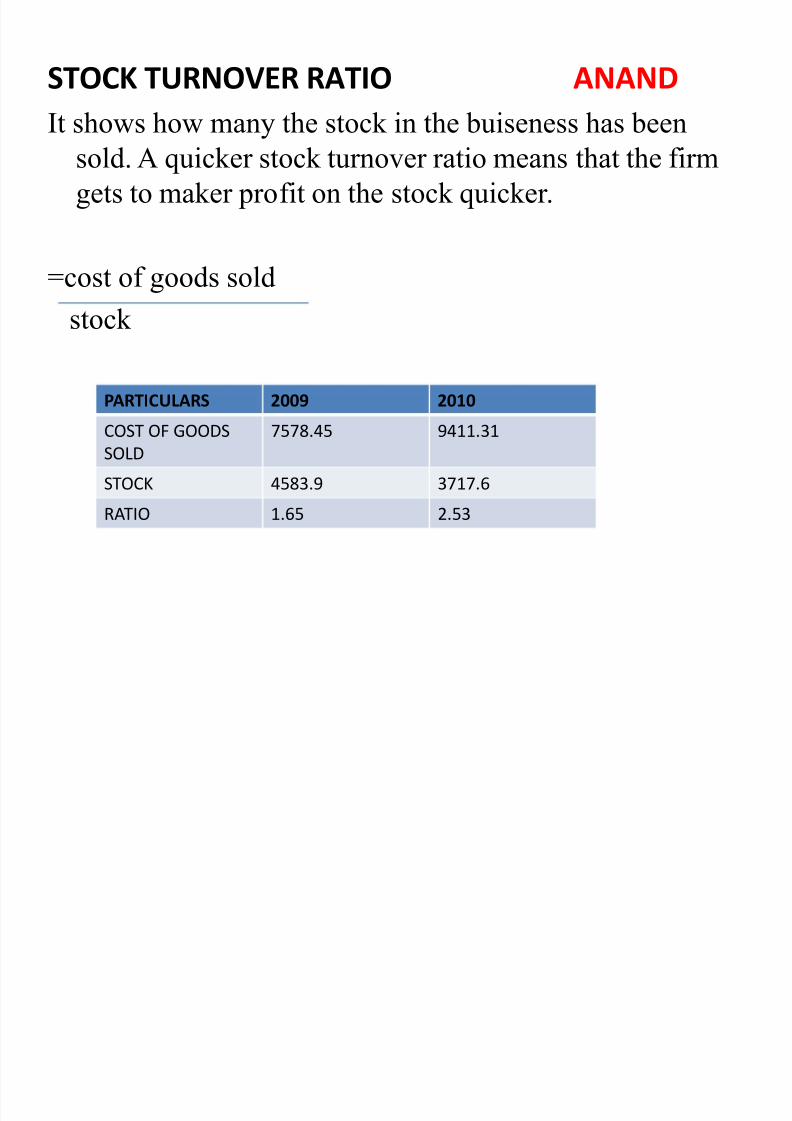
STOCK TURNOVER RATIO ANAND
It shows how many the stock in the buiseness has beensold. A quicker stock turnover ratio means that the firmgets to maker profit on the stock quicker.
=cost of goods soldstock
PARTICULARS 2009 2010
COST OF GOODSSOLD
7578.45 9411.31
STOCK 4583.9 3717.6
RATIO 1.65 2.53

8/7/2019 bajaj_ppt (1)
http://slidepdf.com/reader/full/bajajppt-1 6/15
DEBTORS TURNOVER RATIO ANAND
= average debtorsCredit sales/365
PARTCULARS 2009 2010

8/7/2019 bajaj_ppt (1)
http://slidepdf.com/reader/full/bajajppt-1 7/15
W ORKING CAPITAL TURNOVER RATIOMANSA
= Net salesNet working capital
PARTICULARS 2009 2010
NET SALES 84460 115431
NETW ORKINGCAPITAL
-1832 -12528
RATIO -4610 -9.16

8/7/2019 bajaj_ppt (1)
http://slidepdf.com/reader/full/bajajppt-1 8/15
OPERATING CYCLE MANSA

8/7/2019 bajaj_ppt (1)
http://slidepdf.com/reader/full/bajajppt-1 9/15
RAW MATERIAL HOLDING PERIOD RICHA
=360 days x stock of raw material
Cost of raw material
PARTICULARS 2009 2010
RAW MATERIALHOLDING PERIOD
83.53 47.35

8/7/2019 bajaj_ppt (1)
http://slidepdf.com/reader/full/bajajppt-1 10/15
W IP HOLDNG PERIOD RICHA=360 days x stock of W IP
Cost of goods manufactured
PARTICULARS 2009 2010
HOLDING PERIOD 19.57 42.85

8/7/2019 bajaj_ppt (1)
http://slidepdf.com/reader/full/bajajppt-1 11/15
DEBTORS COLLECTION PERIOD ROHAN
=360 days x debtorsCredit sales
PARTICULARS 2009 2010
COLLECTIONPERIOD
11.97 8.479

8/7/2019 bajaj_ppt (1)
http://slidepdf.com/reader/full/bajajppt-1 12/15
CREDITORS PAYMENT PERIOD ROHAN
360 DAYS X CREDITORSPurchases
PARTICULARS 2009 2010
HOLDING PERIOD 48.53 73.5

8/7/2019 bajaj_ppt (1)
http://slidepdf.com/reader/full/bajajppt-1 13/15
FINISHED GOODS HOLDING PERIOD DIVANSHU
360 X Stock of finished goodsCost of goods sold
PARTICULARS 2009 2010
HOLDING PERIOD 10.053 9.956

8/7/2019 bajaj_ppt (1)
http://slidepdf.com/reader/full/bajajppt-1 14/15
2009 2010
RM Conversion Period 83.53 47.35
-Creditors payment period 48.53 73.5
W IP Holding Period 19.57 46.76
FG Holding Period 10.053 9.956
Debtors Collection Period 11.97 8.479
76.59 39.03
MANAS

8/7/2019 bajaj_ppt (1)
http://slidepdf.com/reader/full/bajajppt-1 15/15


![[XLS]fmism.univ-guelma.dzfmism.univ-guelma.dz/sites/default/files/le fond... · Web view1 1 1 1 1 1 1 1 1 1 1 1 1 1 1 1 1 1 1 1 1 1 1 1 1 1 1 1 1 1 1 1 1 1 1 1 1 1 1 1 1 1 1 1 1 1](https://static.fdocuments.net/doc/165x107/5b9d17e509d3f2194e8d827e/xlsfmismuniv-fond-web-view1-1-1-1-1-1-1-1-1-1-1-1-1-1-1-1-1-1-1-1-1-1.jpg)