Biscuit Making Machinery & Biscuit Baking Machinery by Besto Oven Industries Mumbai

Group B4 - Minesweepers Aditi Vaish | Pranav Maranganty | Kevin John | Deepak Agnihotri | Archana Rajan
BADM Project – Hyper Market
Classifying Biscuit Brand Switchers for Targeted Marketing for a Biscuit Manufacturer

Business Problem • Client Profile and Background
• Minesweepers Biscuits (MSB) based out of Denmark
• Renowned brand internationally but limited brand presence in India
• Expansion to India with new products and innovative promotions
• Competition
• Brands like Britannia and Parle own a big pool of loyalists
• Business Objective
• Increase Trial Rate of MSB products and hence Market Share by partnering with Hyper Market
• Improve Marketing Efficiency by targeting only the “Brand Switchers”
• Offer samples and personalized promotions at checkout counters or at kiosks of the Hyper Market to the “Brand Switchers”
All Consumers
Selected Consumers for better ROI on marketing
0
2000
4000
6000
8000
10000
Number of Enrollments

Data Mining Problem • Objective
• Classify new customers as “Brand Loyalist” (1) and “Brand Switchers” (0) based on demographics and purchase patterns in “Ready Food”
• New Customer – A customer who has made 2 purchases from the “Ready Food” department
Business Rules
Classification
Continuous Evaluation and Classification
MSB’s Target
“Brand Loyalist”: A person who has purchased biscuits at least 3 times and purchased the same brand over 50% of the times
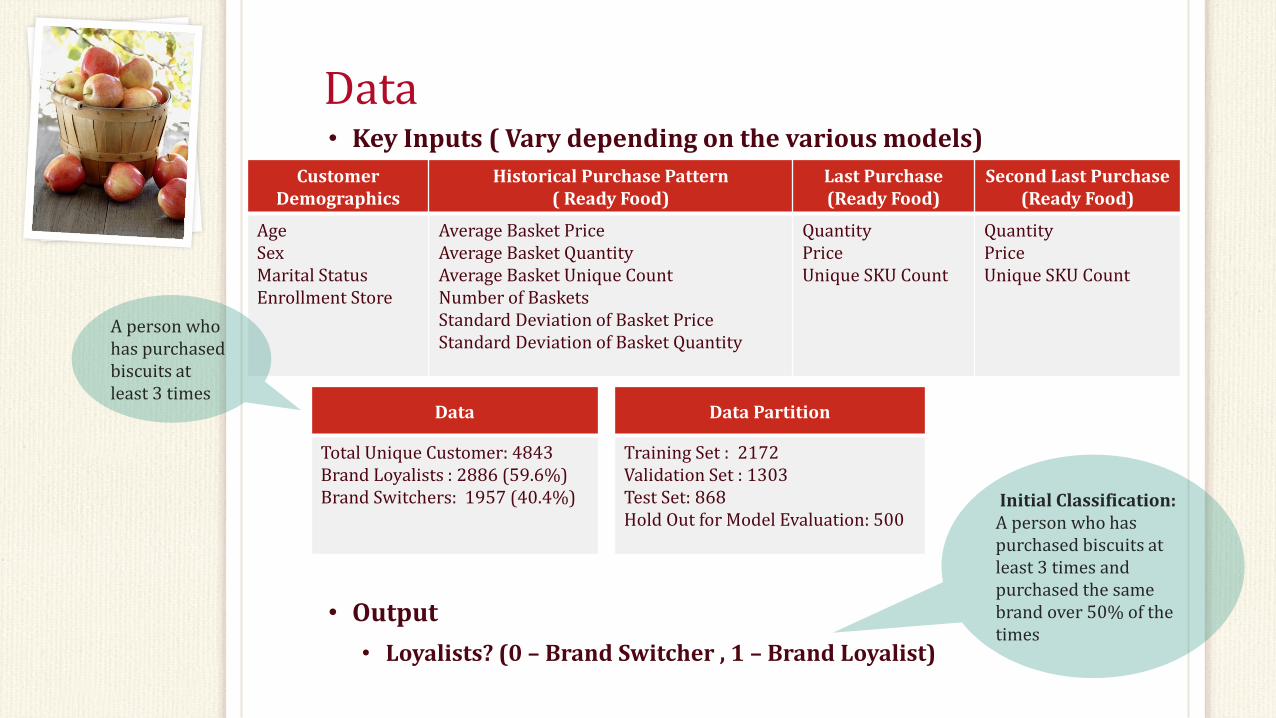
Data • Key Inputs ( Vary depending on the various models)
• Output
• Loyalists? (0 – Brand Switcher , 1 – Brand Loyalist)
Customer Demographics
Historical Purchase Pattern ( Ready Food)
Last Purchase (Ready Food)
Second Last Purchase (Ready Food)
Age Sex Marital Status Enrollment Store
Average Basket Price Average Basket Quantity Average Basket Unique Count Number of Baskets Standard Deviation of Basket Price Standard Deviation of Basket Quantity
Quantity Price Unique SKU Count
Quantity Price Unique SKU Count
Data Partition
Training Set : 2172 Validation Set : 1303 Test Set: 868 Hold Out for Model Evaluation: 500
Data
Total Unique Customer: 4843 Brand Loyalists : 2886 (59.6%) Brand Switchers: 1957 (40.4%)
A person who has purchased biscuits at least 3 times
Initial Classification: A person who has purchased biscuits at least 3 times and purchased the same brand over 50% of the times

Methods
CART Pruned Tree : 3 Nodes # Input Variables: 18
Naïve Bayes # Input Variables : 6
Class # Cases # Errors % Error
0 524 208 39.69
1 779 334 42.88
Overall 1303 542 41.60
Class # Cases # Errors % Error
0 905 241 26.63
1 1267 456 35.99
Overall 2172 697 32.09
Training Set Test Set
Class # Cases # Errors % Error
0 359 146 40.67
1 509 235 46.17
Overall 868 381 43.89
Validation Set
K-NN Best K: 5 # Input Variables : 14
Class # Cases # Errors % Error
0 905 112 12.38
1 1267 613 48.38
Overall 2172 725 33.38
Class # Cases # Errors % Error
0 524 148 28.24
1 779 508 65.21
Overall 1303 656 50.35
Class # Cases # Errors % Error
0 359 95 26.46
1 509 313 61.49
Overall 868 408 47.00
Value of k% Error
Training
% Error
Validation
1 0.00 44.67
2 23.94 49.12
3 23.16 45.13
4 27.53 47.51
5 28.68 43.13
6 30.66 47.12
7 30.34 43.90
8 31.72 45.89
9 32.27 43.75
10 32.97 44.74
Probability Cutoff: 0.4
Class # Cases # Errors % Error
0 905 0 0.00
1 1267 0 0.00
Overall 2172 0 0.00
Class # Cases # Errors % Error
0 524 189 36.07
1 779 321 41.21
Overall 1303 510 39.14
Class # Cases # Errors % Error
0 359 125 34.82
1 509 215 42.24
Overall 868 340 39.17
Logistic Regression - Stepwise Initial No. of Variables: 21 # Variables based on Cp: 20
Class # Cases # Errors % Error
0 905 386 42.65
1 1267 444 35.04
Overall 2172 830 38.21
Class # Cases # Errors % Error
0 524 222 42.37
1 779 272 34.92
Overall 1303 494 37.91
Class # Cases # Errors % Error
0 359 142 39.55
1 509 198 38.90
Overall 868 340 39.17
Coefficient
-47.1890297
0.00544622
1.11986947
1.03916395
-0.67768991
0.1495695
0.09804565
0.07624547
-0.05565267
-0.00135054
-0.04568335
0.00852676
0.00019505
0.02833186
0.00110265
0.01369065
0.00012139
-0.00228719
-0.00255478
0.00014995
Input variables
Average Basket Quantity
Constant term
Age
Sex_F
Sex_M
Enrollment Store_1001
Enrollment Store_1002
Marital Status_N
Marital Status_Y
Email_Y
Average Basket Price
Number of Baskets
StdDev of Basket Price
StdDev of Basket Quantity
Last Transaction Date
Last Purchase Unique Count
Last Purchase Price
Last Purchase Quantity
Second Last Purchase
Second Last Purchase Price
We tried different # variables, but all had some over fitting

Model Evaluation (Test Data) • Naïve Rule is considered as the benchmark
for evaluation with all customers tagged as “Brand Loyalist”
• Key Metrics for Evaluation
• Sensitivity (0 1)
• All models are better than the benchmark
• % Total Error
• Logistic Regression and CART fare better than benchmark
• Misclassification Costs
• INR 120 for 0 1 (Customer Value)
• INR 20 for 1 0 (Coupons and Samples)
• All models fare better than benchmark
• Holdout Evaluation - K-NN has some over fitting
100.00%
0.00%
41.36%
0.00%
20.00%
40.00%
60.00%
80.00%
100.00%
Sensitivity Specificity % Total Error
Benchmark Logistic Regression Naïve Bayes K-NN CART
61080
21000 22220 17660 19300
0
20000
40000
60000
80000
Benchmark LogisticRegression
Naïve Bayes K-NN CART
Logistic Regression
Class # Cases # Errors % Error
0 190 86 45.26%
1 310 102 32.90%
Overall 500 188 37.60%
Class # Cases # Errors % Error
0 190 144 75.79%
1 310 73 23.55%
Overall 500 217 43.40%
CART
• Deploy Logistic Regression Model for classifying new customers
• Low Misclassification Costs
• Similar Accuracy across all Data
• Better Overall Error and Sensitivity
• Easy Deployment of Model / Stable Model
• Continuously improve the model by updating the classifications and adding more data
• Include External Demographics data to improve the model
• Expand model to include other products of MSB
Recommendations
Next Steps