Badlands National Park Visitor Studypsu.sesrc.wsu.edu/vsp/reports/123_BADL_rept.pdf · Badlands...
112
Badlands National Park Visitor Study Summer 2000 Todd Simmons and James H. Gramann Visitor Services Project Report 123 July 2001 Todd Simmons is a VSP Research Aide based at the Cooperative Park Studies Unit, University of Idaho. I thank Dr. James Gramann and the staff and volunteers of Badlands National Park for their assistance with this study. The VSP acknowledges the Public Opinion Lab of the Social and Economic Sciences Research Center, Washington State University, for its technical assistance
Transcript of Badlands National Park Visitor Studypsu.sesrc.wsu.edu/vsp/reports/123_BADL_rept.pdf · Badlands...

Badlands National ParkVisitor Study
Summer 2000
Todd Simmonsand
James H. Gramann
Visitor Services ProjectReport 123
July 2001
Todd Simmons is a VSP Research Aide based at the Cooperative Park Studies Unit,
University of Idaho. I thank Dr. James Gramann and the staff and volunteers of Badlands NationalPark for their assistance with this study. The VSP acknowledges the Public Opinion Lab of theSocial and Economic Sciences Research Center, Washington State University, for its technicalassistance
Visitor Services Project
Badlands National Park Visitor StudyReport Summary
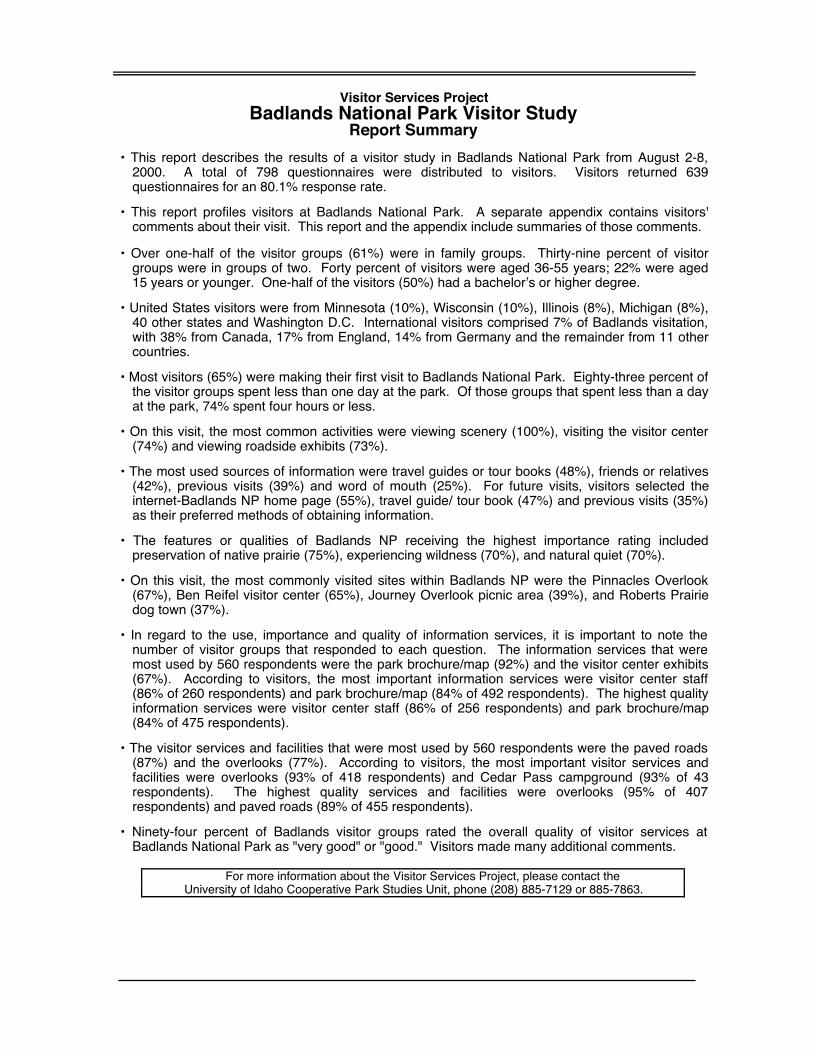
• This report describes the results of a visitor study in Badlands National Park from August 2-8,2000. A total of 798 questionnaires were distributed to visitors. Visitors returned 639questionnaires for an 80.1% response rate.
• This report profiles visitors at Badlands National Park. A separate appendix contains visitors'comments about their visit. This report and the appendix include summaries of those comments.
• Over one-half of the visitor groups (61%) were in family groups. Thirty-nine percent of visitorgroups were in groups of two. Forty percent of visitors were aged 36-55 years; 22% were aged15 years or younger. One-half of the visitors (50%) had a bachelor’s or higher degree.
• United States visitors were from Minnesota (10%), Wisconsin (10%), Illinois (8%), Michigan (8%),40 other states and Washington D.C. International visitors comprised 7% of Badlands visitation,with 38% from Canada, 17% from England, 14% from Germany and the remainder from 11 othercountries.
• Most visitors (65%) were making their first visit to Badlands National Park. Eighty-three percent ofthe visitor groups spent less than one day at the park. Of those groups that spent less than a dayat the park, 74% spent four hours or less.
• On this visit, the most common activities were viewing scenery (100%), visiting the visitor center(74%) and viewing roadside exhibits (73%).
• The most used sources of information were travel guides or tour books (48%), friends or relatives(42%), previous visits (39%) and word of mouth (25%). For future visits, visitors selected theinternet-Badlands NP home page (55%), travel guide/ tour book (47%) and previous visits (35%)as their preferred methods of obtaining information.
• The features or qualities of Badlands NP receiving the highest importance rating includedpreservation of native prairie (75%), experiencing wildness (70%), and natural quiet (70%).
• On this visit, the most commonly visited sites within Badlands NP were the Pinnacles Overlook(67%), Ben Reifel visitor center (65%), Journey Overlook picnic area (39%), and Roberts Prairiedog town (37%).
• In regard to the use, importance and quality of information services, it is important to note thenumber of visitor groups that responded to each question. The information services that weremost used by 560 respondents were the park brochure/map (92%) and the visitor center exhibits(67%). According to visitors, the most important information services were visitor center staff(86% of 260 respondents) and park brochure/map (84% of 492 respondents). The highest qualityinformation services were visitor center staff (86% of 256 respondents) and park brochure/map(84% of 475 respondents).
• The visitor services and facilities that were most used by 560 respondents were the paved roads(87%) and the overlooks (77%). According to visitors, the most important visitor services andfacilities were overlooks (93% of 418 respondents) and Cedar Pass campground (93% of 43respondents). The highest quality services and facilities were overlooks (95% of 407respondents) and paved roads (89% of 455 respondents).
• Ninety-four percent of Badlands visitor groups rated the overall quality of visitor services atBadlands National Park as "very good" or "good." Visitors made many additional comments.
For more information about the Visitor Services Project, please contact theUniversity of Idaho Cooperative Park Studies Unit, phone (208) 885-7129 or 885-7863.
TABLE OF CONTENTSPage
INTRODUCTION 1
METHODS 2
RESULTS 5
Visitors contacted 5
Demographics 5
Length of stay 12
Activities 14
Hiking at Badlands National Park 15
Sources of information 17
Travel plans 23
Importance of selected reasons for visiting 26
Prescribed fire policy 32
Sites visited 34
Information services: use, importance and quality 35
Visitor services and facilities: use, importance, and quality 54
Entrance fee 76
Public transportation 77
Park elements-effects on visitor experience 78
Expenditures 81
Anything unable to see or do 95
Visit again in the future 96
Overall quality of visitor services 97
Planning for the future 98
Comment summary 98
ADDITIONAL ANALYSIS 103
QUESTIONNAIRE 104
VISITOR SERVICES PROJECT PUBLICATIONS 106


Badlands National Park Visitor Study August 2-8, 2000 1
INTRODUCTION
This report describes the results of a study of visitors at
Badlands National Park (NP). This visitor study was conducted August
2 – 8, 2000 by the National Park Service (NPS) Visitor Services Project
(VSP), part of the Cooperative Park Studies Unit at the University of
Idaho.
A Methods section discusses the procedures and limitations of
the study. A Results section follows, including a summary of visitor
comments. Next, an Additional Analysis page helps managers
request additional analyses. The final section has a copy of the
Questionnaire. The separate appendix includes comment summaries
and visitors' unedited comments.
Most of this report’s graphs resemble the example below. The
large numbers refer to explanations following the graph.
SAMPLE ONLY
First visit
2-4 visits
5-9 visits
10 or more visits
0 75 150 225 300Number of respondents
59%
20%
11%
10%
Number
of visits
N=691 individuals
Figure 4: Number of visits1
2
3
4
5
1: The figure title describes the graph's information.
2: Listed above the graph, the 'N' shows the number of visitors responding and a
description of the chart's information. Interpret data with an 'N' of less than
30 with CAUTION! as the results may be unreliable.
3: Vertical information describes categories.
4: Horizontal information shows the number or proportions in each category.
5: In most graphs, percentages provide additional information.

Badlands National Park Visitor Study August 2-8, 20002
METHODS
The questionnaire for this visitor study was designed using a
standard format that has been developed in previous Visitor Services
Project (VSP) studies. Some of the questions are comparable with VSP
visitor studies conducted at other parks. Other questions are
customized for Badlands NP. A copy of the questionnaire is included at
the end of this report.
Interviews were conducted with, and questionnaires distributed
to, a sample of visitor groups who arrived at Badlands NP during the
period from August 2 - 8, 2000. Visitors were sampled at a total of six
locations (see Table 1).
Table 1: Questionnaire distribution locations
percentages do not equal 100 due to rounding.
Location: Questionnaires distributed
Questionnaire
design and
administration
Number %
Ben Reifel Visitor Center 324 41
Pinnacles Overlook 150 19
Door Trailhead 149 19
Cedar Pass Lodge 75 10
White River Visitor Center 75 10
Sage Creek Campground 25 3
GRAND TOTAL 798 102
Visitor groups were greeted, briefly introduced to the purpose of
the study, and asked to participate. If visitors agreed, an interview lasting
approximately two minutes was used to determine group size, group
type, and the age of the adult who would complete the questionnaire.
These individuals were then given a questionnaire and asked their
names, addresses, and telephone numbers in order to mail them a
reminder/thank-you postcard. Visitor groups were asked to complete the
questionnaire during or after their visit, then return it by mail.
Two weeks following the survey, a reminder thank-you postcard
was mailed to all participants. Replacement questionnaires were mailed
to participants who had not returned their questionnaires four weeks after
the survey. Seven weeks after the survey, second replacement
questionnaires were mailed to visitors who still had not returned their
questionnaires.
Badlands National Park Visitor Study August 2-8, 2000 3
Returned questionnaires were coded and the information was
entered into a computer using Statistical Analysis System (SAS), a
standard statistical software package. Frequency distributions and
cross-tabulations were calculated for the coded data, and responses to
open-ended questions were categorized and summarized.
Data analysis
This study collected information on both visitor groups and
individual group members, depending upon the specific survey
question. Thus, the sample size ("N"), varies from figure to figure. For
example, while Figure 1 shows group size information for 632 visitor
groups, Figure 4 presents age data for 2,079 individuals. A note above
each graph specifies the information illustrated.
Occasionally, a respondent may not have answered all of the
questions, or may have answered some incorrectly. Unanswered
questions result in missing data and cause the number in the sample to
vary from figure to figure. For example, although 639 questionnaires
were returned by Badlands visitors, Figure 1 shows data for only 632
respondents.
Questions answered incorrectly due to carelessness,
misunderstanding directions, and so forth turn up in the data as
reporting errors. These create small data inconsistencies.
Sample size,missing dataand reportingerrors
Badlands National Park Visitor Study August 2-8, 20004
Limitations Like all surveys, this study has limitations that should be
considered when interpreting the results.
1. It is not possible to know whether visitor responses reflect
actual behavior. This disadvantage applies to all such studies and is
reduced by having visitors fill out the questionnaire soon after they visit
the park.
2. The data reflect visitor use patterns of visitors to the selected
sites during the study period of August 2 – 8, 2000. The results do not
necessarily apply to visitors during other times of the year.
3. Caution is advised when interpreting any data with a sample
size of less than 30, as the results may be unreliable. Whenever the
sample size is less than 30, the word "CAUTION!" is included in the
graph, figure or table.
Special
conditions
Weather conditions during the visitor study were typical of
August in the Badlands area, with hot, sunny days. At the park's
request, the survey was conducted during the Sturgis (SD) Motorcycle
Rally. Visitation during this period included many Rally participants
passing through the park in small groups or in large motorcycle
caravans.

Badlands National Park Visitor Study August 2-8, 2000 5
RESULTS
In Badlands National Park, 822 visitor groups were contacted,
and 798 of these groups (97%) accepted questionnaires.
Questionnaires were completed and returned by 639 visitor groups,
resulting in an 80.1% response rate for this study.
Table 2 compares age and group size of the total sample of
visitors contacted with the age and groups of visitors who actually
returned questionnaires. Based on the variables of respondent age
and visitor group size, non-response bias was judged to be
insignificant.
Visitors
contacted
Table 2: Comparison of total sample andactual respondents
Variable Total sample Actualrespondents
N Avg. N Avg.
Age of respondents 788 45.0 630 46.0
Group size 795 3.7 632 3.8
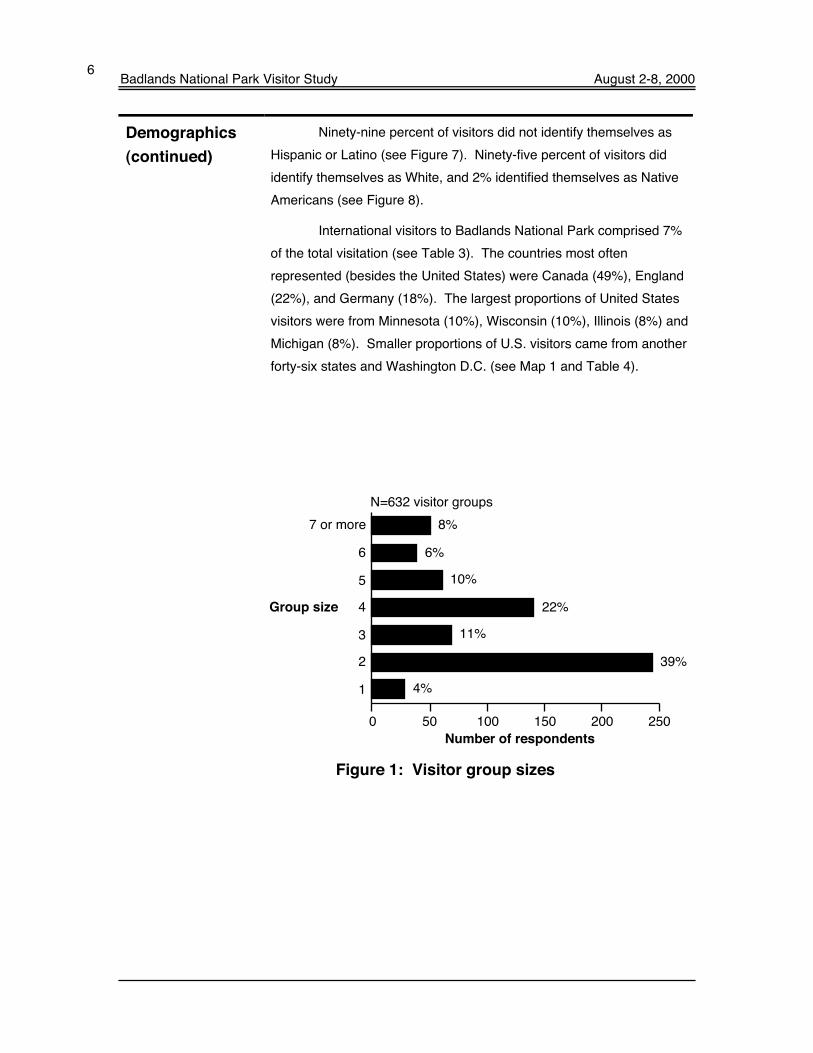
Figure 1 shows visitor group sizes, which ranged from one
person to 51 people. Thirty-nine percent of visitor groups consisted of
two people, while another 22% were people visiting in groups of four.
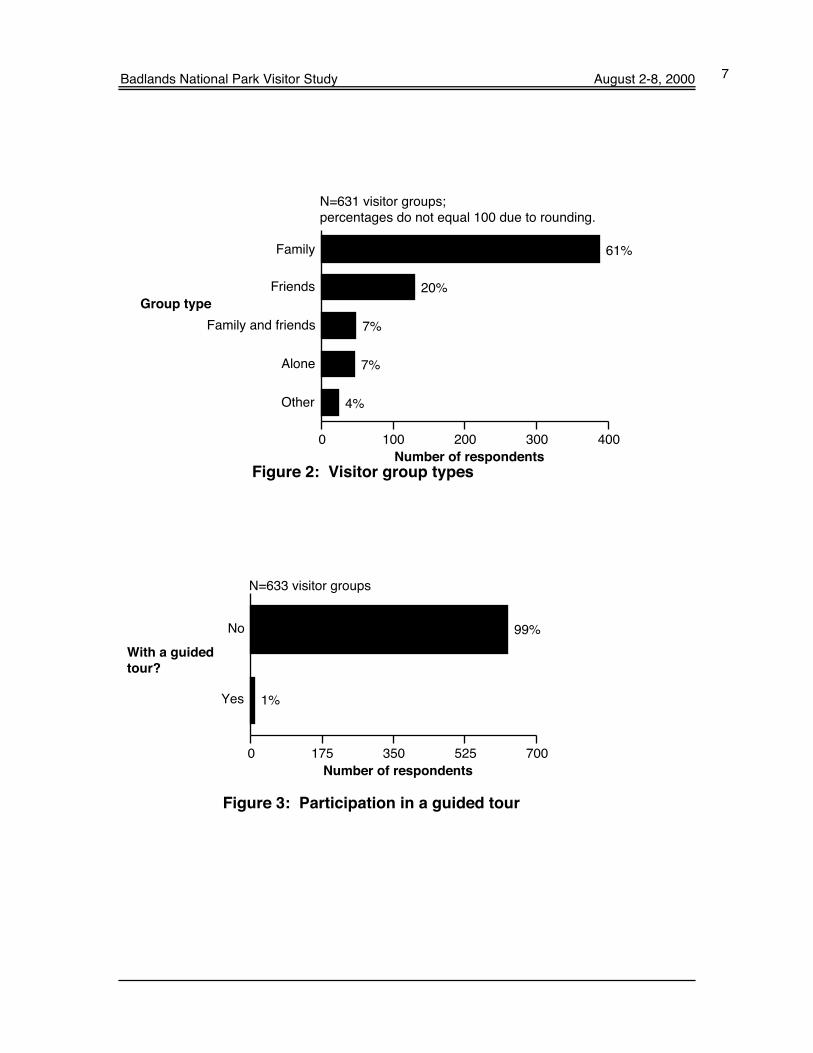
Sixty-one percent of visitor groups were made up of family members,
20% were made up of friends, and 7% were made up of family and
friends (see Figure 2). Groups listing themselves as “other” for group
type included school trips and spouses. One percent of visitors were in
a tour group (see Figure 3).
Thirty-two percent of the visitors were between the ages of 36
and 50 (see Figure 4). Another 27% of visitors were below the age of
21.
Sixty-five percent of visitors were making their first visit to the
park, whereas 36% had visited the park previously (see Figure 5).
Twenty-three percent of visitors stated they had graduate
degrees, while another 27% had bachelor’s degrees (see Figure 6).
Demographics
Badlands National Park Visitor Study August 2-8, 20006
Demographics
(continued)
Ninety-nine percent of visitors did not identify themselves as
Hispanic or Latino (see Figure 7). Ninety-five percent of visitors did
identify themselves as White, and 2% identified themselves as Native
Americans (see Figure 8).
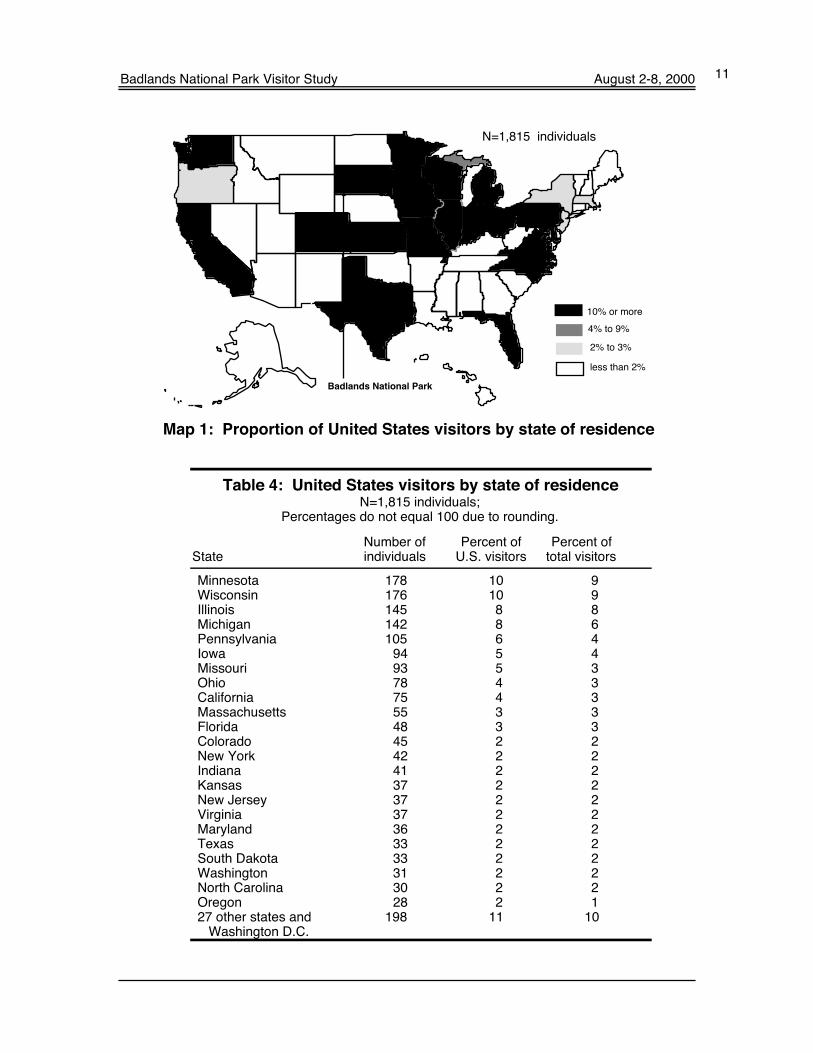
International visitors to Badlands National Park comprised 7%
of the total visitation (see Table 3). The countries most often
represented (besides the United States) were Canada (49%), England
(22%), and Germany (18%). The largest proportions of United States
visitors were from Minnesota (10%), Wisconsin (10%), Illinois (8%) and
Michigan (8%). Smaller proportions of U.S. visitors came from another
forty-six states and Washington D.C. (see Map 1 and Table 4).
1
2
3
4
5
6
7 or more
0 50 100 150 200 250
Number of respondents
Group size
N=632 visitor groups
8%
6%
10%
22%
11%
39%
4%
Figure 1: Visitor group sizes
Badlands National Park Visitor Study August 2-8, 2000 7
Other
Alone
Family and friends
Friends
Family
0 100 200 300 400
Number of respondents
61%
20%
7%
7%
4%
Group type
N=631 visitor groups;percentages do not equal 100 due to rounding.
Figure 2: Visitor group types
Yes
No
0 175 350 525 700
Number of respondents
99%
1%
With a guided
tour?
N=633 visitor groups
Figure 3: Participation in a guided tour

Badlands National Park Visitor Study August 2-8, 20008
10 and younger
11-15
16-20
21-25
26-30
31-35
36-40
41-45
46-50
51-55
56-60
61-65
66-70
71-75
76 and older
0 50 100 150 200 250 300
Number of respondents
1%
2%
4%
6%
6%
8%
11%
12%
9%
5%
4%
4%
5%
10%
12%
Visitor ages
N=2,079 individuals;percentages do not equal 100 due to rounding.
Figure 4: Visitor ages
1
2 to 4
5 to 9
10 or more
0 500 1000 1500
Number of respondents
2%
3%
30%
65%
Number of
visits
N=1,948 individuals
Figure 5: Number of visits

Badlands National Park Visitor Study August 2-8, 2000 9
Some high school
High school graduate
Some college
Bachelor's degree
Graduate degree
0 100 200 300 400 500
Number of respondents
23%
27%
26%
20%
5%
Educationlevel
N=1,587 individuals;percentages do not equal 100 due to rounding.
Figure 6: Education level
Hispanic or Latino
Not Hispanic or Latino
0 100 200 300 400 500
Number of respondents
99%
1%
Ehtnicity
N=474 individuals
Figure 7: Ethnicity

Badlands National Park Visitor Study August 2-8, 200010
Native Hawaiian or other Pacific Islander
Hispanic or Latino
Black or African American
Asian
American Indian or Alaska Native
White
0 100 200 300 400 500 600 700
Number of respondents
95%
2%
2%
1%
0%
0%
Race
N=632 individuals;percentages do not equal 100 because individualscould be of more than one race.
<1%
<1%
Figure 8: Race
Table 3: International visitors by country of residenceN=128 individuals;
percentages do not equal 100 due to rounding.
Number of Percent of Percent ofCountry individuals Int’l visitors total visitors
Canada 49 38 3England 22 17 1Germany 18 14 1France 11 9 <1Guatemala 7 5 <1Switzerland 4 3 <1Belgium 3 2 <1Hungary 3 2 <1Japan 3 2 <1Australia 2 2 <1India 2 2 <1Italy 2 2 <1Austria 1 1 <1South Africa 1 1 <1
Badlands National Park Visitor Study August 2-8, 2000 11
N=1,815 individuals
10% or more
4% to 9%
2% to 3%
less than 2%
Badlands National Park
Map 1: Proportion of United States visitors by state of residence
Table 4: United States visitors by state of residenceN=1,815 individuals;
Percentages do not equal 100 due to rounding.
Number of Percent of Percent ofState individuals U.S. visitors total visitors
Minnesota 178 10 9Wisconsin 176 10 9Illinois 145 8 8Michigan 142 8 6Pennsylvania 105 6 4Iowa 94 5 4Missouri 93 5 3Ohio 78 4 3California 75 4 3Massachusetts 55 3 3Florida 48 3 3Colorado 45 2 2New York 42 2 2Indiana 41 2 2Kansas 37 2 2New Jersey 37 2 2Virginia 37 2 2Maryland 36 2 2Texas 33 2 2South Dakota 33 2 2Washington 31 2 2North Carolina 30 2 2Oregon 28 2 127 other states and 198 11 10 Washington D.C.
Badlands National Park Visitor Study August 2-8, 200012
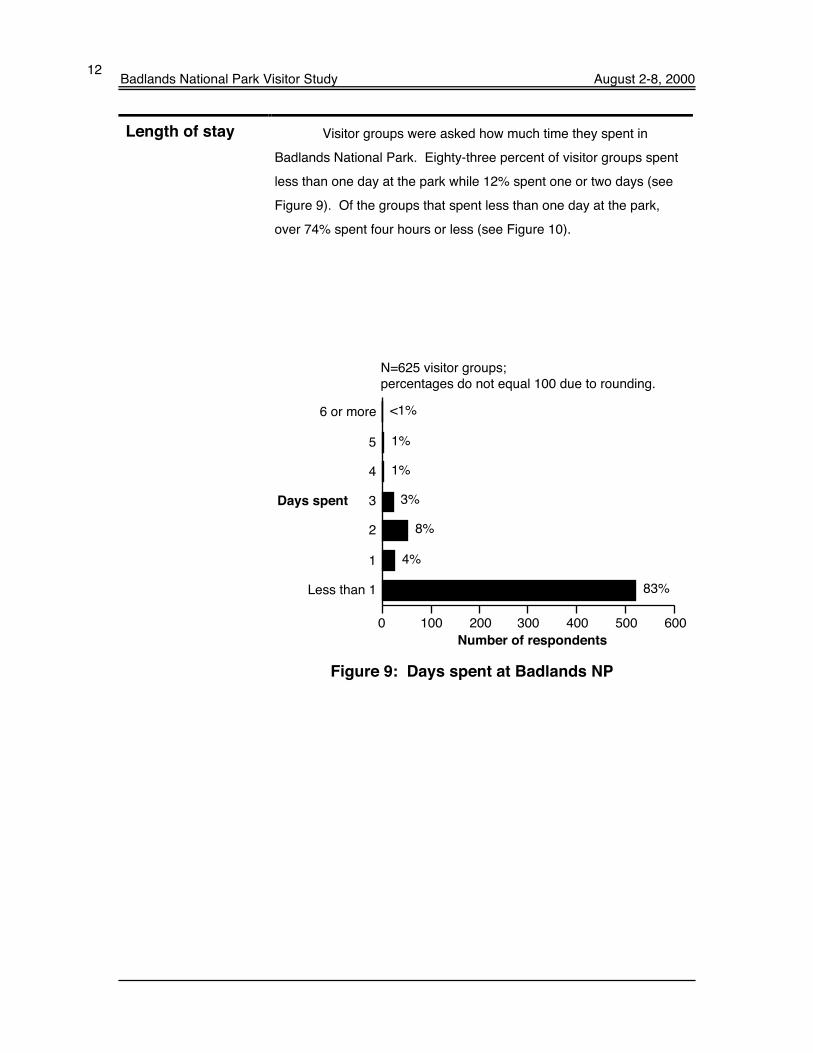
Length of stay Visitor groups were asked how much time they spent in
Badlands National Park. Eighty-three percent of visitor groups spent
less than one day at the park while 12% spent one or two days (see
Figure 9). Of the groups that spent less than one day at the park,
over 74% spent four hours or less (see Figure 10).
Less than 1
1
2
3
4
5
6 or more
0 100 200 300 400 500 600
Number of respondents
N=625 visitor groups;percentages do not equal 100 due to rounding.
Days spent
<1%
1%
1%
3%
8%
4%
83%
Figure 9: Days spent at Badlands NP

Badlands National Park Visitor Study August 2-8, 2000 13
Less than 1
1
2
3
4
5
6
7 or more
0 25 50 75 100 125 150
Number of respondents
Hours spent
N=520 visitor groups;percentages do not equal 100 due to rounding.
14%
6%
7%
16%
23%
28%
7%
<1%
Figure 10: Hours spent at Badlands NP

Badlands National Park Visitor Study August 2-8, 200014
Activities Figure 11 shows the proportions of visitor groups that
participated in a variety of activities at Badlands National Park. The
most common activities were viewing scenery (100%), visiting visitor
center (74%), and viewing roadside exhibits (73%). Visitor groups
participated in a number of "other" activities including hiking, nature
study and biking.
Other
Horseback ride in park
Bicycling
Camp in backcountry
Stay in overnight lodging
Attend ranger-led program
Picnic
Nature study
Camp in campground
Motorcycle touring
Visit Cedar Pass Lodge
Hike on maintained trail
View roadside exhibits
Visit visitor center
View scenery
0 100 200 300 400 500 600 700
Number of respondents
N=636 visitor groups;percentages do not equal 100 because groupscould participate in more than one activity.
Activities
100%
74%
73%
40%
21%
16%
16%
16%
14%
13%
3%
8%
1%
1%
8%
Figure 11: Visitor activities

Badlands National Park Visitor Study August 2-8, 2000 15
Figure 12 shows the proportions of visitor groups that hiked
trails located within Badlands NP. The most hiked trails included Fossil
Exhibit Trail (54%), Door Trail (40%), and Windows Trail (38%).
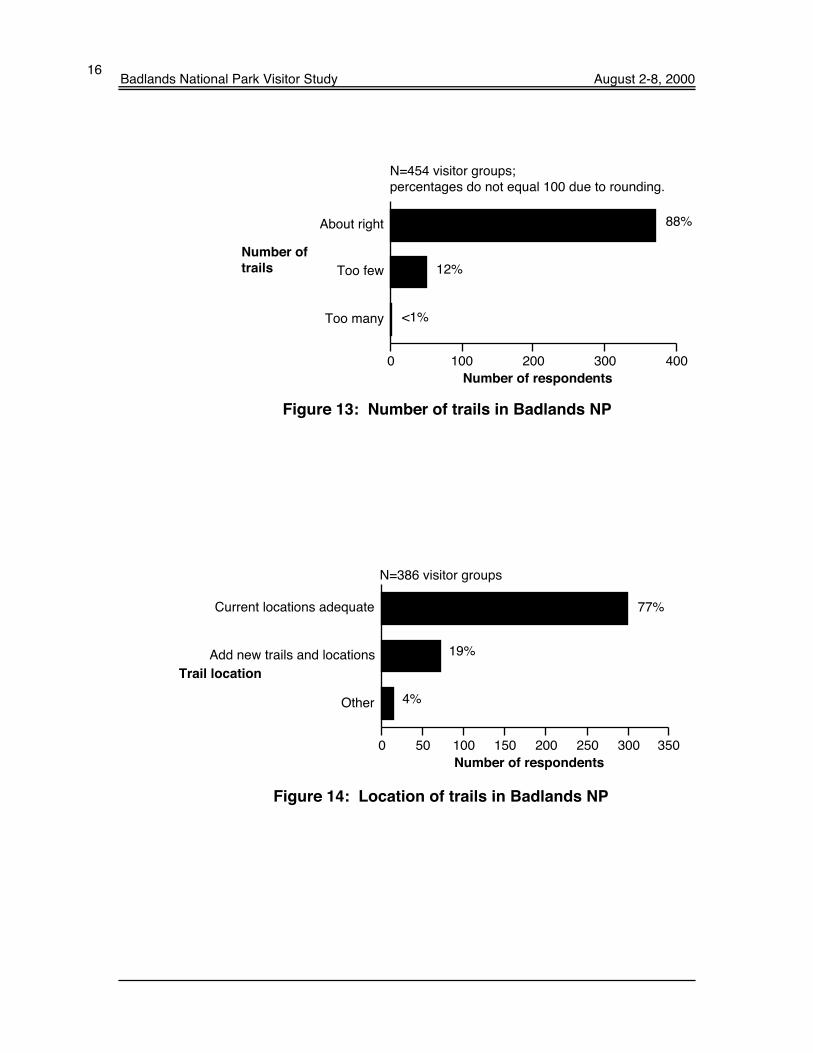
Visitor groups were also asked about their opinion on the
number of trails in Badlands NP. Eighty-eight percent of visitor groups
indicated that the number of trails was about right, while 12% thought
there were too few trails (see Figure 13).
Visitor groups were also asked about the current locations of
the trails in Badlands NP. Seventy-seven percent of visitor groups
indicated that the current locations were adequate, while 19% indicated
new trails in different locations were needed (see Figure 14).
Hiking at
Badlands
National
Park
Medicine Root Trail
Castle Trail
Saddle Pass Trail
Notch Trail
Cliff Shelf Trail
Windows Trail
Door Trail
Fossil Exhibit Trail
0 50 100 150 200
Number of respondents
Trails hiked
N=338 visitor groups;percentages do not equal 100 because visitorsuse more than one trail.
54%
40%
38%
28%
25%
15%
15%
9%
Figure 12: Trails hiked in Badlands NP
Badlands National Park Visitor Study August 2-8, 200016
Too many
Too few
About right
0 100 200 300 400
Number of respondents
Number of
trails
N=454 visitor groups;percentages do not equal 100 due to rounding.
88%
12%
<1%
Figure 13: Number of trails in Badlands NP
Other
Add new trails and locations
Current locations adequate
0 50 100 150 200 250 300 350
Number of respondents
Trail location
N=386 visitor groups
77%
19%
4%
Figure 14: Location of trails in Badlands NP
Badlands National Park Visitor Study August 2-8, 2000 17
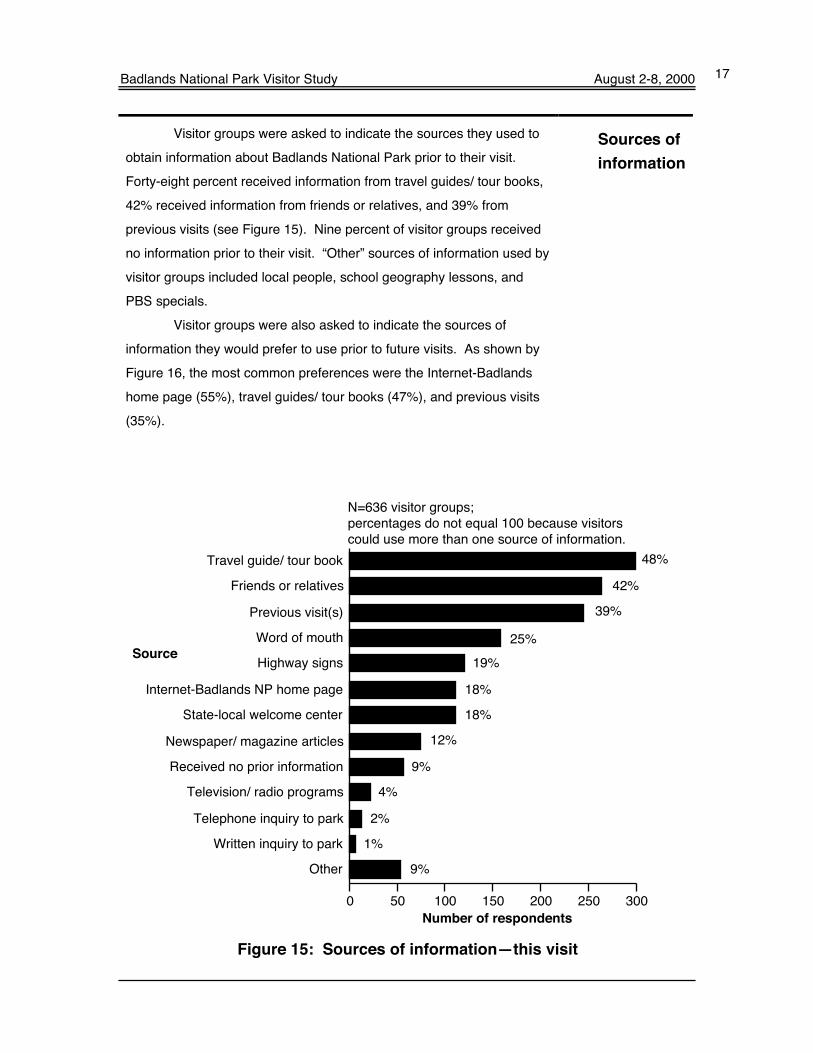
Visitor groups were asked to indicate the sources they used to
obtain information about Badlands National Park prior to their visit.
Forty-eight percent received information from travel guides/ tour books,
42% received information from friends or relatives, and 39% from
previous visits (see Figure 15). Nine percent of visitor groups received
no information prior to their visit. “Other” sources of information used by
visitor groups included local people, school geography lessons, and
PBS specials.
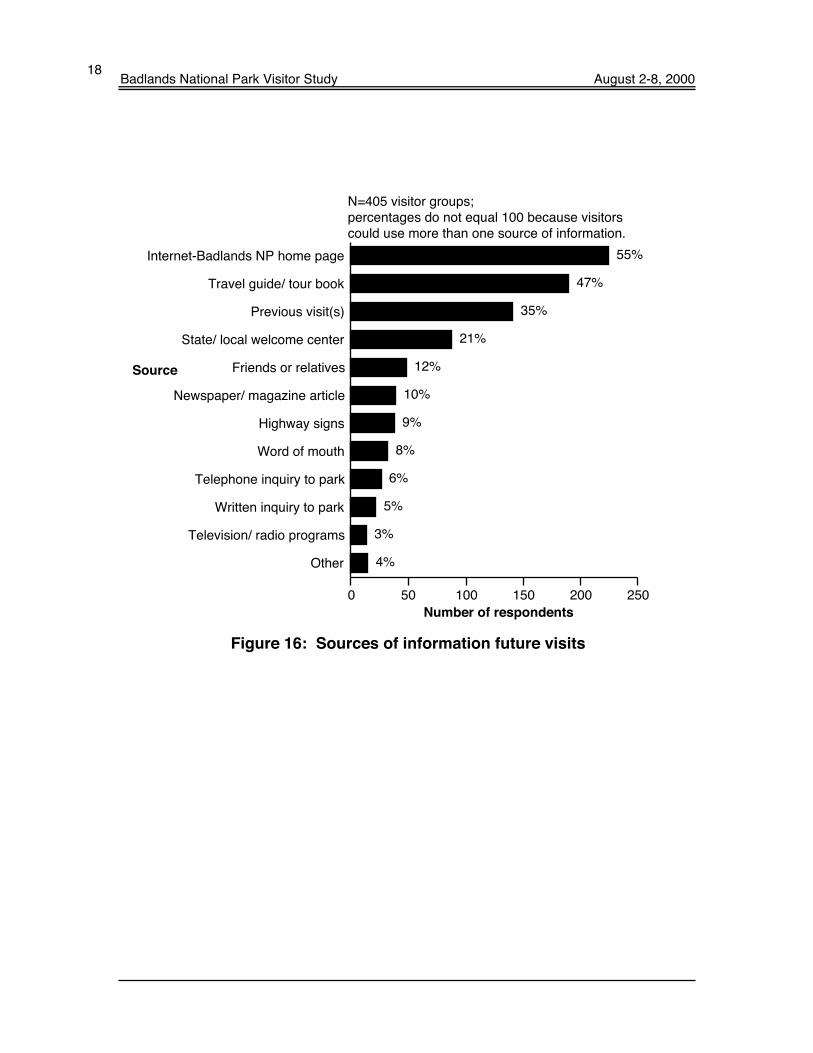
Visitor groups were also asked to indicate the sources of
information they would prefer to use prior to future visits. As shown by
Figure 16, the most common preferences were the Internet-Badlands
home page (55%), travel guides/ tour books (47%), and previous visits
(35%).
Sources of
information
Other
Written inquiry to park
Telephone inquiry to park
Television/ radio programs
Received no prior information
Newspaper/ magazine articles
State-local welcome center
Internet-Badlands NP home page
Highway signs
Word of mouth
Previous visit(s)
Friends or relatives
Travel guide/ tour book
0 50 100 150 200 250 300
Number of respondents
Source
N=636 visitor groups;percentages do not equal 100 because visitorscould use more than one source of information.
48%
42%
39%
25%
19%
18%
18%
12%
9%
4%
2%
1%
9%
Figure 15: Sources of information—this visit
Badlands National Park Visitor Study August 2-8, 200018
Other
Television/ radio programs
Written inquiry to park
Telephone inquiry to park
Word of mouth
Highway signs
Newspaper/ magazine article
Friends or relatives
State/ local welcome center
Previous visit(s)
Travel guide/ tour book
Internet-Badlands NP home page
0 50 100 150 200 250
Number of respondents
Source
N=405 visitor groups;percentages do not equal 100 because visitorscould use more than one source of information.
55%
47%
35%
21%
12%
10%
9%
8%
6%
5%
3%
4%
Figure 16: Sources of information future visits

Badlands National Park Visitor Study August 2-8, 2000 19
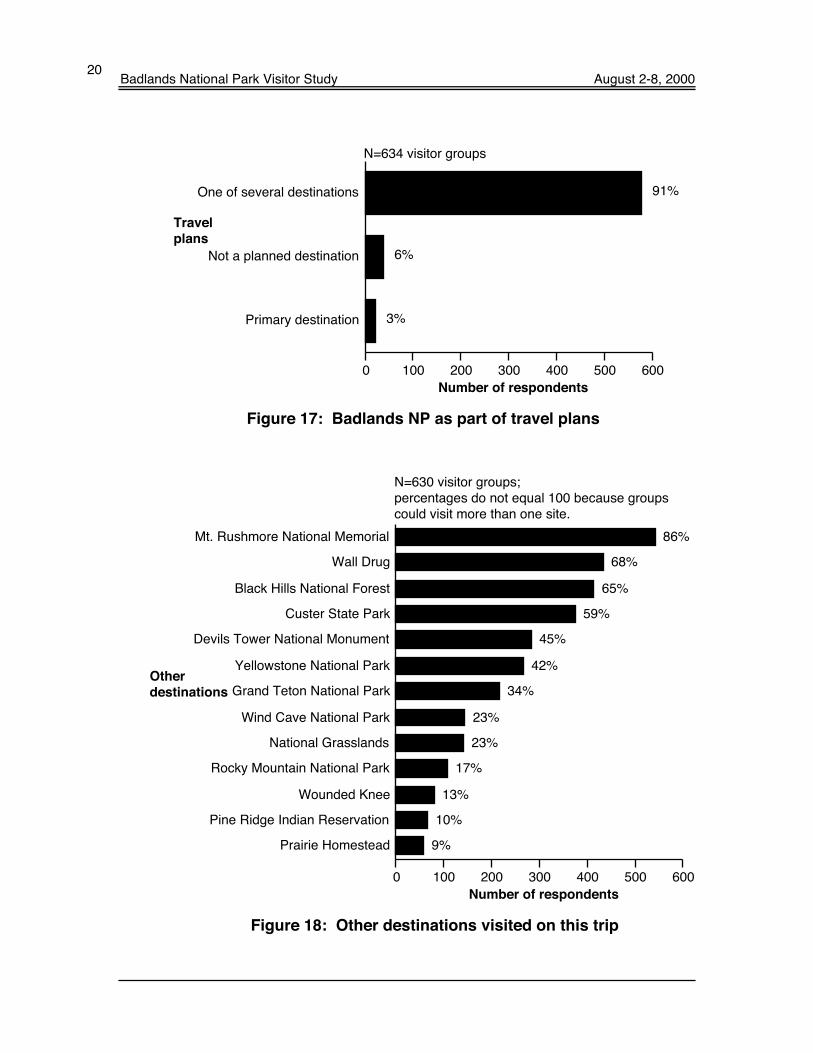
Visitor groups were asked to indicate how their visit to
Badlands NP fit into their travel plans. Ninety-one percent of visitors
to Badlands NP were planning to visit the park as one of several
destinations. Six percent of visitors were not planning on visiting
Badlands NP at all. Three percent of visitors intended it to be their
primary destination (see Figure 17). Other destinations indicated by
visitor groups included Mt. Rushmore National Memorial (86%), Wall
Drug (68%), Black Hills National Forest (65%) and Custer State Park
(59%), as shown in Figure 18.
Fifty-three percent of visitor groups indicated that they spent
one night away from home within a 1-hour drive of Badlands NP (see
Figure 19). Fifty percent of visitor groups spent zero nights inside
Badlands NP and 28% spent one night (see Figure 20). Forty-two
percent of visitor groups spent one night outside Badlands NP and
22% spent two nights (see Figure 21). As shown in Figure 22, 54%
percent of visitor groups stayed in campgrounds inside the park,
while 32% utilized motels or cabins. Of those visitors staying outside
the park, 43% used motels and cabins, and 29% stayed in
campgrounds (see Figure 23).
Figure 24 shows the number of times visitor groups entered
the park: 69% entered one time, 19% entered two times and 5%
entered three times.
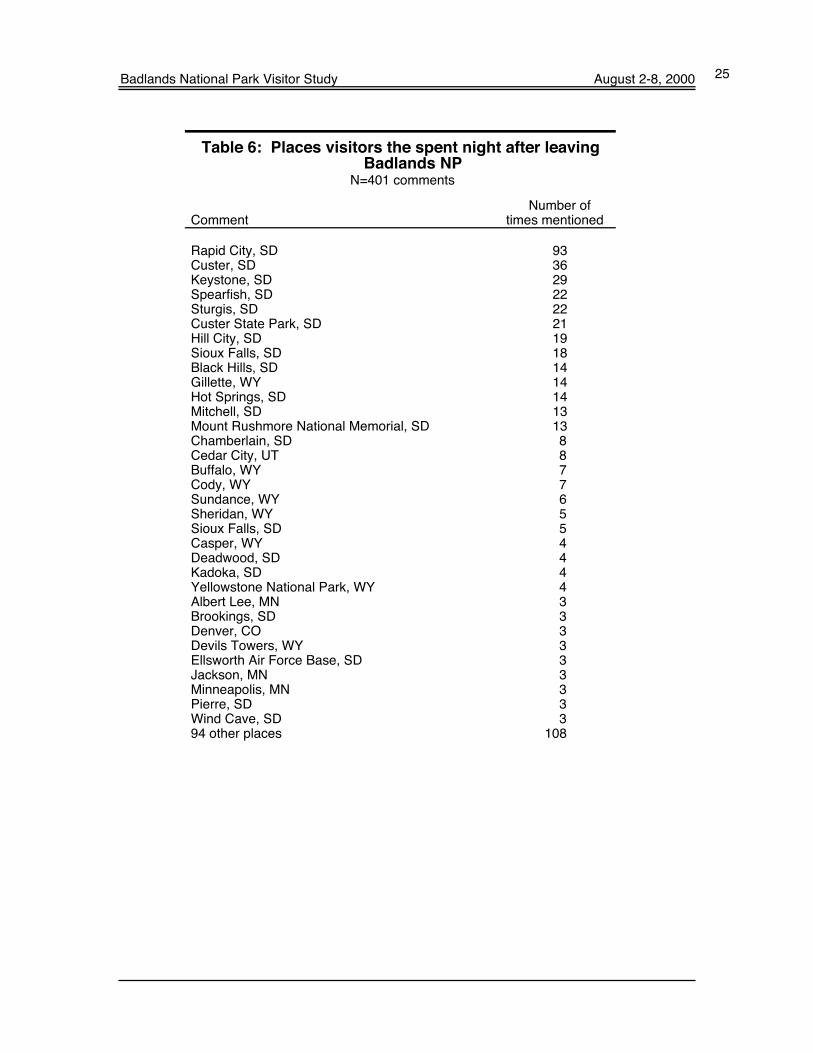
Visitors were asked where they spent the night prior to arriving
at Badlands NP and also where they spent the night after leaving
Badlands NP. Table 5 shows the number of visitor groups who
stayed in each town/ city prior to arriving at Badlands NP. Table 6
shows the number of visitor groups who stayed in each town/ city
after leaving Badlands NP. Rapid City, SD was the most listed city
on both tables.
Travel plans
Badlands National Park Visitor Study August 2-8, 200020
Primary destination
Not a planned destination
One of several destinations
0 100 200 300 400 500 600
Number of respondents
Travel
plans
N=634 visitor groups
91%
6%
3%
Figure 17: Badlands NP as part of travel plans
Prairie Homestead
Pine Ridge Indian Reservation
Wounded Knee
Rocky Mountain National Park
National Grasslands
Wind Cave National Park
Grand Teton National Park
Yellowstone National Park
Devils Tower National Monument
Custer State Park
Black Hills National Forest
Wall Drug
Mt. Rushmore National Memorial
0 100 200 300 400 500 600
Number of respondents
Other
destinations
N=630 visitor groups;percentages do not equal 100 because groupscould visit more than one site.
86%
68%
65%
59%
45%
42%
34%
23%
23%
17%
13%
10%
9%
Figure 18: Other destinations visited on this trip

Badlands National Park Visitor Study August 2-8, 2000 21
No
Yes
0 50 100 150 200 250 300 350
Number of respondents
53%
47%
Stay overnight
away from
home?
N=622 visitor groups
Figure 19: Stay overnight away from home within1-hour of Badlands NP
0
1
2
3
4
5
6
7
8 or more
0 20 40 60
Number of respondents
1%
0%
0%
2%
2%
5%
13%
28%
50%
Number of
nights
N=110 visitor groups;percentages do not equal 100 due to rounding.
Figure 20: Number of nights spent in Badlands NP

Badlands National Park Visitor Study August 2-8, 200022
0
1
2
3
4
5
6
7
8 or more
0 50 100 150
Number of respondents
Number of
nights
N=283 visitor groups;percentages do not equal 100 due to rounding.
4%
4%
3%
4%
6%
12%
22%
42%
4%
Figure 21: Number of nights spent within 1-hour drive ofBadlands NP
Other
Seasonal residence
Residence of friends or relatives
Backcountry campsite
Lodge, motel, cabin, etc.
Campground/ Trailer park
0 20 40 60
Number of respondents
Type of
lodging
N=87 visitor groups;percentages do not equal 100 because groupscould use more than one type of lodging.
54%
32%
11%
2%
0%
7%
Figure 22: Type of lodging used inside Badlands NP bygroups staying overnight in the park

Badlands National Park Visitor Study August 2-8, 2000 23
Other
Seasonal residence
At friend's house
Campground
Motel, cabin, etc.
0 50 100 150
Number of respondents
Type of
lodging
N=342 visitor groups;percentages do not equal 100 because groupscould use more than one type of lodging.
43%
29%
1%
0%
3%
Figure 23: Lodging type used outside of Badlands NP bygroups staying overnight out of park
1
2
3
4
5
6
7 or more
0 50 100 150 200 250
Number of respondents
2%
1%
2%
3%
5%
19%
69%
Number of
park entries
N=319 visitor groups;percentages do not equal 100 due to rounding.
Figure 24: Number of times entered park

Badlands National Park Visitor Study August 2-8, 200024
Table 5: Places visitors spent the night prior toarriving at Badlands NP
N=565 comments
Number ofComment times mentioned
Rapid City, SD 62Mitchell, SD 50Wall, SD 42Sioux Falls, SD 33Custer, SD 23Keystone, SD 23Chamberlain, SD 21Kadoka, SD 18Sturgis, SD 18Murdo, SD 15Hill City, SD 12Custer State Park, SD 11Hot Springs, SD 11Spearfish, SD 11Pierre, SD 10Sioux City, IA 10Gillette, WY 8Mt. Rushmore National Memorial, SD 7Belvidere, SD 5Interior, SD 5Oacoma, SD 5Minneapolis, MN 4Philip, SD 4Albert Lee, SD 3Buffalo, WY 3Casper, WY 3Deadwood, SD 3St. Paul, MN 3120 other places 142
Badlands National Park Visitor Study August 2-8, 2000 25
Table 6: Places visitors the spent night after leavingBadlands NP
N=401 comments
Number ofComment times mentioned
Rapid City, SD 93Custer, SD 36Keystone, SD 29Spearfish, SD 22Sturgis, SD 22Custer State Park, SD 21Hill City, SD 19Sioux Falls, SD 18Black Hills, SD 14Gillette, WY 14Hot Springs, SD 14Mitchell, SD 13Mount Rushmore National Memorial, SD 13Chamberlain, SD 8Cedar City, UT 8Buffalo, WY 7Cody, WY 7Sundance, WY 6Sheridan, WY 5Sioux Falls, SD 5Casper, WY 4Deadwood, SD 4Kadoka, SD 4Yellowstone National Park, WY 4Albert Lee, MN 3Brookings, SD 3Denver, CO 3Devils Towers, WY 3Ellsworth Air Force Base, SD 3Jackson, MN 3Minneapolis, MN 3Pierre, SD 3Wind Cave, SD 394 other places 108

Badlands National Park Visitor Study August 2-8, 200026
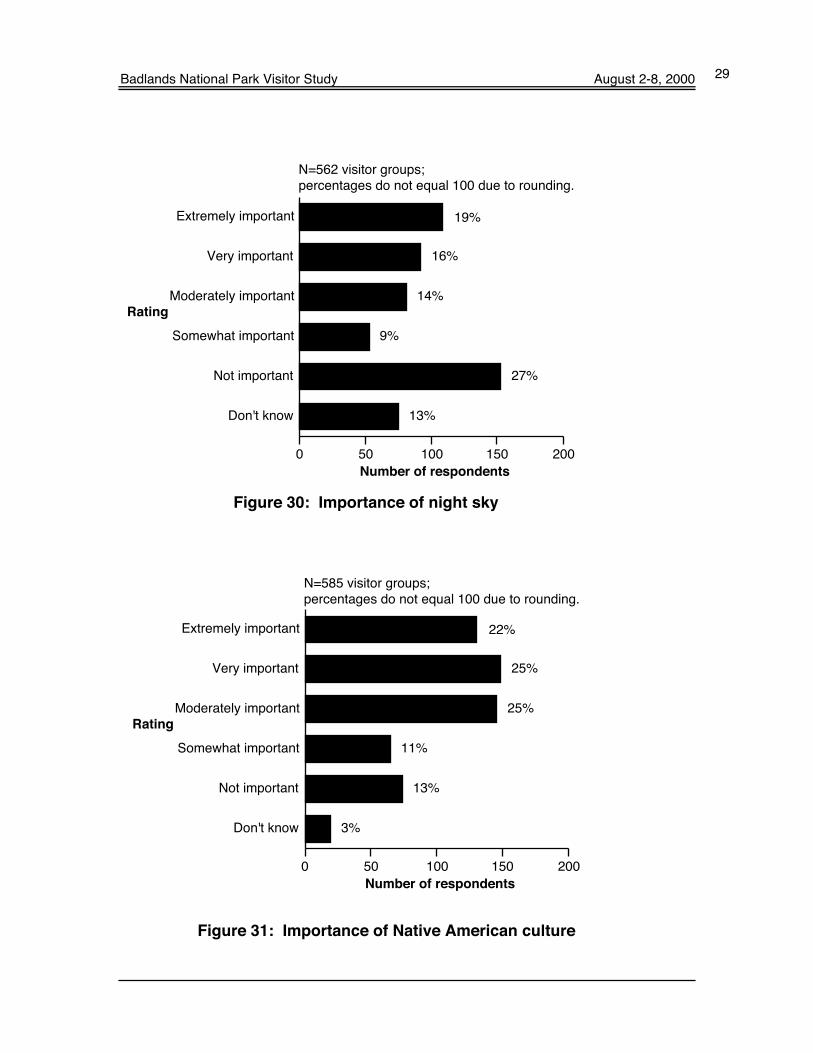
Importance of
selected features
or qualities
Visitor groups were asked to rate the importance of certain
features or qualities of Badlands NP. The features or qualities they
were asked to rate included geology, educational opportunities,
recreational opportunities, experience wilderness, solitude, night
sky, Native American culture/ history, paleontology, protection of
endangered species, preservation of native prairie, and natural
quiet. As shown by Figure 25-34, the features or qualities that
received the highest “extremely important” and “very important”
ratings were: preservation of native prairie (75%), experience
wilderness (70%), and natural quiet (70%). The highest “not
important” ratings were for “night sky” (27%) and solitude (13%).
Don't know
Not important
Somewhat important
Moderately important
Very important
Extremely important
0 50 100 150 200 250 300
Number of respondents
43%
22%
24%
5%
3%
2%
Rating
N=601 visitor groups;percentages do not equal 100 due to rounding.
Figure 25: Importance of geology

Badlands National Park Visitor Study August 2-8, 2000 27
Don't know
Not important
Somewhat important
Moderately important
Very important
Extremely important
0 50 100 150 200
Number of respondents
22%
29%
31%
8%
8%
2%
Rating
N=591 visitor groups;
Figure 26: Importance of educational opportunities
Don't know
Not important
Somewhat important
Moderately important
Very important
Extremely important
0 50 100 150 200
Number of respondents
20%
25%
30%
12%
10%
3%
Rating
N=831 visitor groups
Figure 27: Importance of recreational opportunities

Badlands National Park Visitor Study August 2-8, 200028
Don't know
Not important
Somewhat important
Moderately important
Very important
Extremely important
0 100 200 300
Number of respondents
41%
29%
17%
7%
5%
1%
Rating
N=831 visitor groups
Figure 28: Importance of experiencing wilderness
Don't know
Not important
Somewhat important
Moderately important
Very important
Extremely important
0 50 100 150 200
Number of respondents
26%
25%
20%
13%
13%
2%
Rating
N=583 visitor groups;percentages do not equal 100 due to rounding.
Figure 29: Importance of solitude
Badlands National Park Visitor Study August 2-8, 2000 29
Don't know
Not important
Somewhat important
Moderately important
Very important
Extremely important
0 50 100 150 200
Number of respondents
19%
16%
14%
9%
27%
13%
Rating
N=562 visitor groups;percentages do not equal 100 due to rounding.
Figure 30: Importance of night sky
Don't know
Not important
Somewhat important
Moderately important
Very important
Extremely important
0 50 100 150 200
Number of respondents
22%
25%
25%
11%
13%
3%
Rating
N=585 visitor groups;percentages do not equal 100 due to rounding.
Figure 31: Importance of Native American culture

Badlands National Park Visitor Study August 2-8, 200030
Don't know
Not important
Somewhat important
Moderately important
Very important
Extremely important
0 50 100 150 200
Number of respondents
16%
25%
29%
12%
11%
8%
Rating
N=570 visitor groups;percentages do not equal 100 due to rounding.
Figure 31: Importance of paleontology
Don't know
Not important
Somewhat important
Moderately important
Very important
Extremely important
0 50 100 150 200 250
Number of respondents
41%
23%
18%
6%
8%
3%
Rating
N=587 visitor groups;percentages do not equal 100 due to rounding.
Figure 32: Importance of protecting of endangeredspecies

Badlands National Park Visitor Study August 2-8, 2000 31
Don't know
Not important
Somewhat important
Moderately important
Very important
Extremely important
0 75 150 225 300 375
Number of respondents
51%
24%
15%
4%
4%
1%
Rating
N=599 visitor groups;percentages do not equal 100 due to rounding.
Figure 33: Importance of preserving native prairie
Don't know
Not important
Somewhat important
Moderately important
Very important
Extremely important
0 50 100 150 200 250 300
Number of respondents
44%
26%
16%
6%
7%
2%
Rating
N=598 visitor groups;percentages do not equal 100 due to rounding.
Figure 34: Importance of natural quiet
Badlands National Park Visitor Study August 2-8, 200032
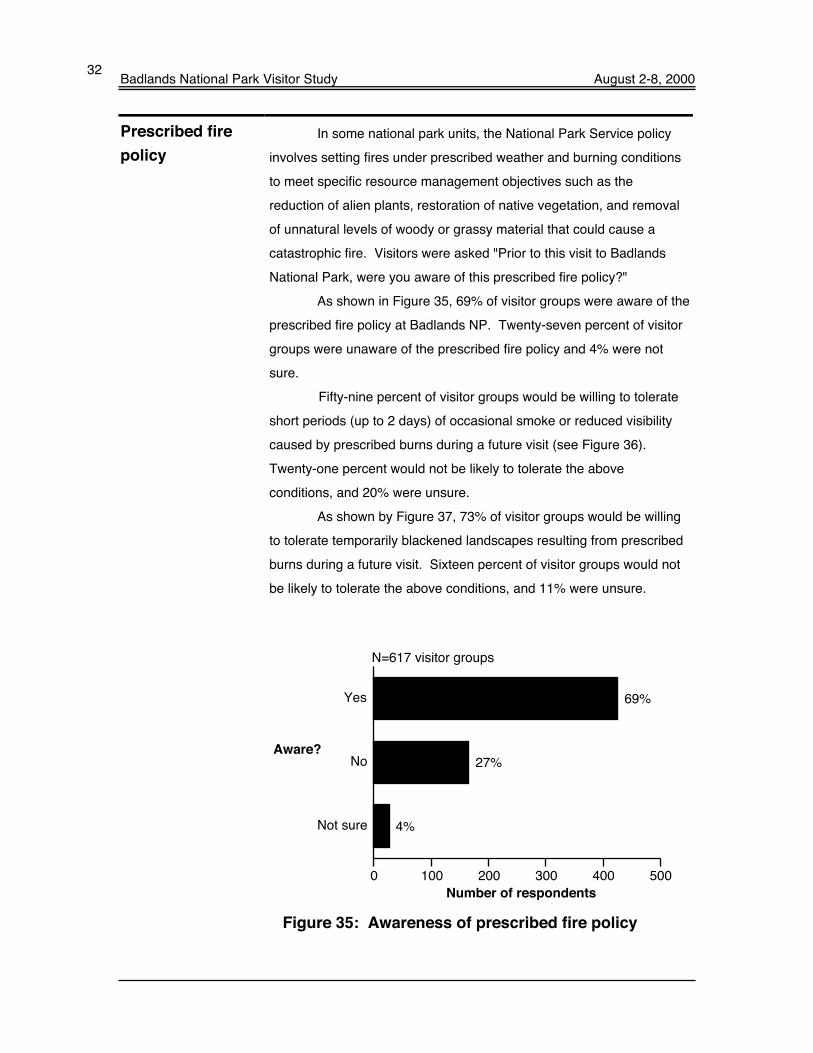
Prescribed fire
policy
In some national park units, the National Park Service policy
involves setting fires under prescribed weather and burning conditions
to meet specific resource management objectives such as the
reduction of alien plants, restoration of native vegetation, and removal
of unnatural levels of woody or grassy material that could cause a
catastrophic fire. Visitors were asked "Prior to this visit to Badlands
National Park, were you aware of this prescribed fire policy?"
As shown in Figure 35, 69% of visitor groups were aware of the
prescribed fire policy at Badlands NP. Twenty-seven percent of visitor
groups were unaware of the prescribed fire policy and 4% were not
sure.
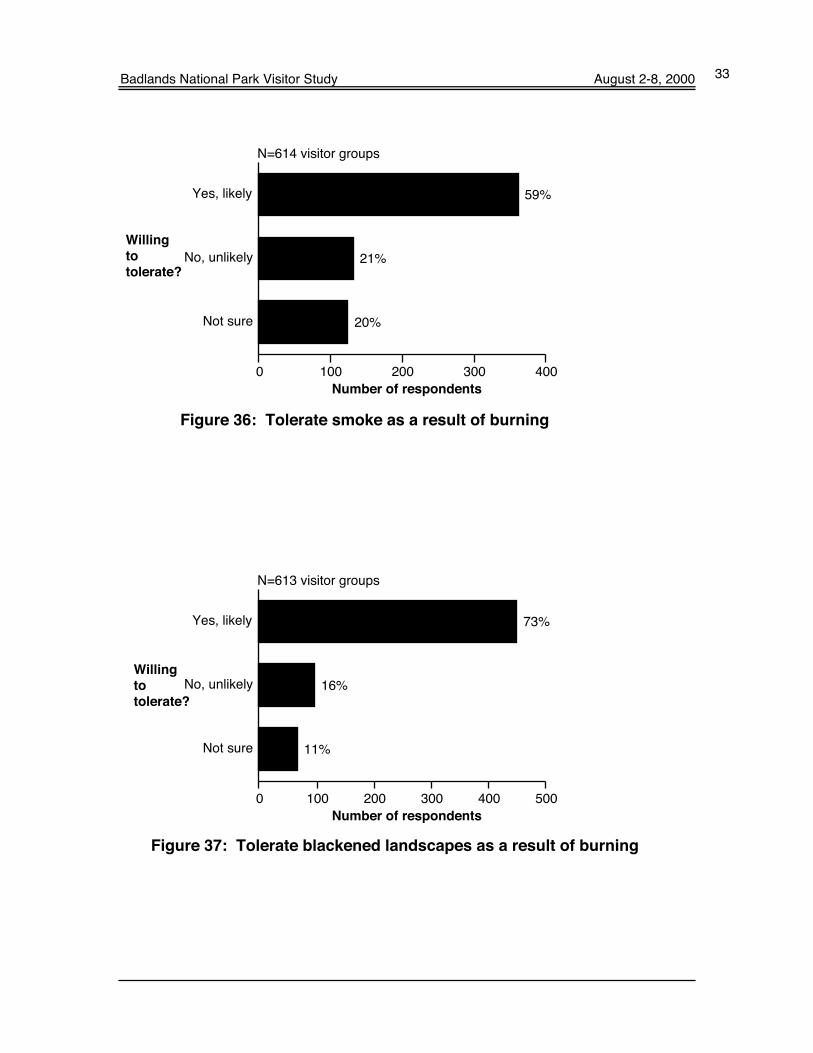
Fifty-nine percent of visitor groups would be willing to tolerate
short periods (up to 2 days) of occasional smoke or reduced visibility
caused by prescribed burns during a future visit (see Figure 36).
Twenty-one percent would not be likely to tolerate the above
conditions, and 20% were unsure.
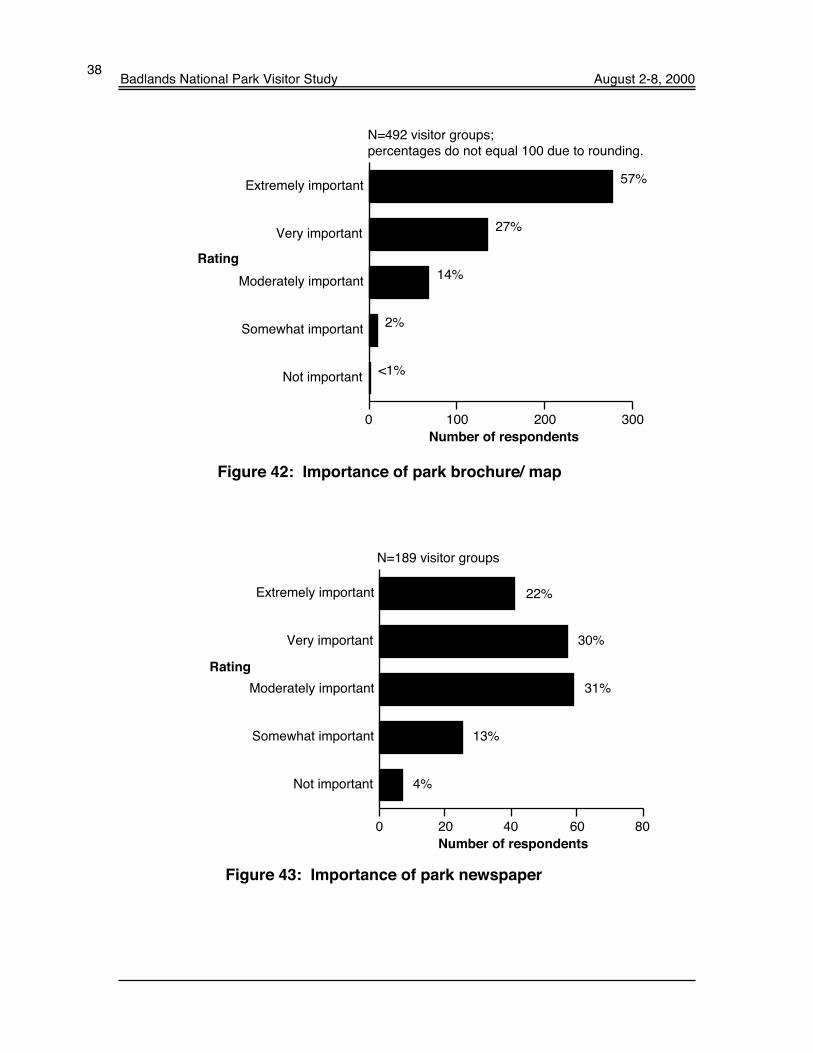
As shown by Figure 37, 73% of visitor groups would be willing
to tolerate temporarily blackened landscapes resulting from prescribed
burns during a future visit. Sixteen percent of visitor groups would not
be likely to tolerate the above conditions, and 11% were unsure.
Not sure
No
Yes
0 100 200 300 400 500
Number of respondents
69%
27%
4%
Aware?
N=617 visitor groups
Figure 35: Awareness of prescribed fire policy
Badlands National Park Visitor Study August 2-8, 2000 33
Not sure
No, unlikely
Yes, likely
0 100 200 300 400
Number of respondents
59%
21%
20%
Willing
to
tolerate?
N=614 visitor groups
Figure 36: Tolerate smoke as a result of burning
Not sure
No, unlikely
Yes, likely
0 100 200 300 400 500
Number of respondents
73%
16%
11%
Willing
to
tolerate?
N=613 visitor groups
Figure 37: Tolerate blackened landscapes as a result of burning

Badlands National Park Visitor Study August 2-8, 200034
Sites visited Visitor groups were asked to indicate the sites they visited at
Badlands NP. Figure 38 shows the proportion of visitor groups that
visited selected sites within Badlands NP during their visit. The most
frequently visited sites included Pinnacles Overlook (67%), Ben Reifel
Visitor Center (65%), Journey Overlook picnic area (39%), and Roberts
Prairie Dog Town (37%). The least visited sites were Sage Creek
Campground (12%) and Sheep Mountain Table (12%).
Sheep Mountain Table
Sage Creek Campground
White River Visitor Center
"Pig dig"
Cedar Pass Lodge
Roberts Prairie Dog town
Journey Overlook picnic area
Ben Reifel Visitor Center
Pinnacles Overlook
0 50 100 150 200 250 300 350 400
Number of respondents
Sites
Visited
N=592 visitor groups;percentages do not equal 100 because groups couldvisit more than one site.
67%
65%
39%
37%
36%
24%
20%
12%
12%
Figure 38: Sites visited this visit

Badlands National Park Visitor Study August 2-8, 2000 35
Visitor groups were asked to note the information services they
used during their visit to Badlands National Park. As shown in Figure 39,
the services that were most commonly used by visitor groups were the
park brochure/map (92%), visitor center exhibits (67%), and roadside
exhibits (66%). The least used services were the evening slide show
(8%) and sales publications (5%).
Information
services: use,
importance and
quality
Sales publications
Evening slide show
Ranger-led walks
"Pig Dig" site
Badlands web site
Roving rangers
Bulletin boards
Orientation video
Trail brochures
Park newspaper
Entrance station staff
V.C. staff
Roadside exhibits
V.C exhibits
Park brochure/map
0 100 200 300 400 500 600
Number of respondents
Service
N=560 visitor groups;percentages do not equal 100 because groups coulduse more than one service.
92%
67%
38%
66%
49%
36%
28%
25%
22%
20%
17%
13%
11%
5%
8%
Figure 39: Information services used this visit

Badlands National Park Visitor Study August 2-8, 200036
Visitor groups rated the importance and quality of each of the services
they used. The following five point scales were used in the questionnaire:
IMPORTANCE QUALITY 5=extremely important 5=very good 4=very important 4=good 3=moderately important 3=average 2=somewhat important 2=poor 1=not important 1=very poor
The average importance and quality ratings for each service were
determined based on ratings provided by visitors who used each service.
Figures 40 and 41 show the average importance and quality ratings for each of
the visitor services. All services were rated as above "average" both in
importance and quality. It should be noted that sales publications were not
rated by enough people to provide reliable data.
Figures 42-56 show the importance ratings that visitor groups gave each
of the individual services. Those services receiving the highest proportion of
"extremely important" or "very important" ratings included ranger-led walks
(86%), park brochure/ map (84%), and trail brochures (81%). The highest
proportions of "not important" ratings were for entrance station staff (5%) and
the park newspaper-Prairie Preamble (4%).
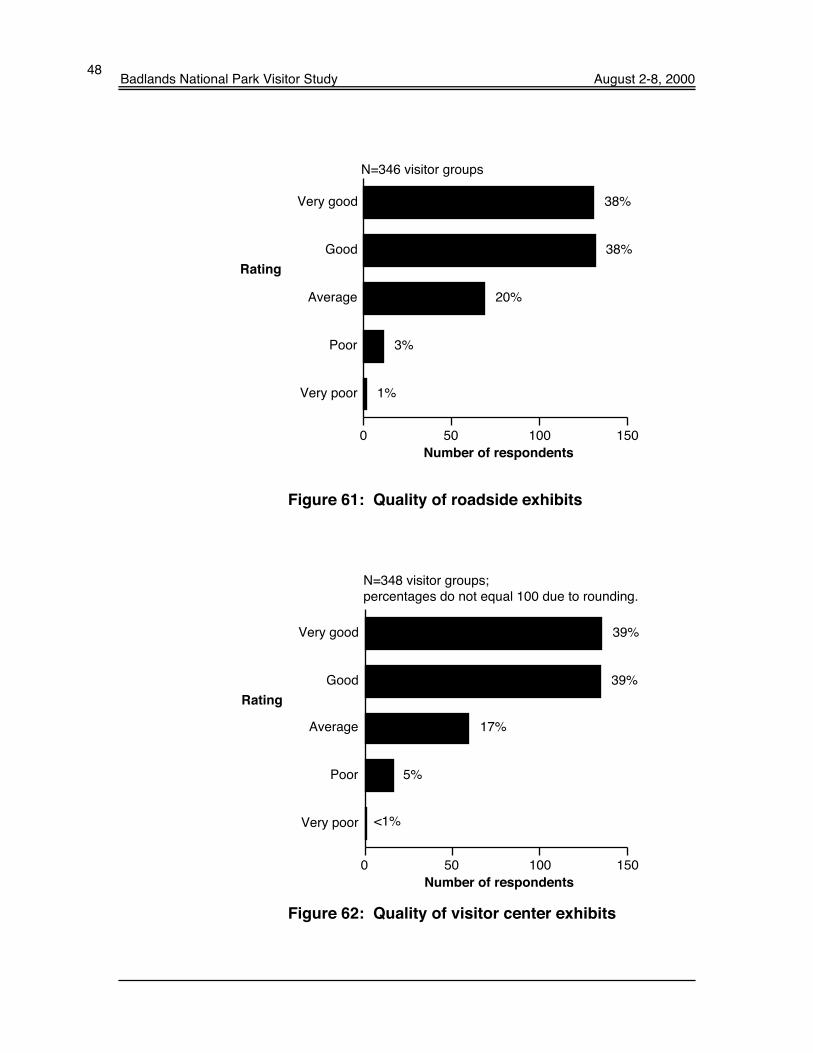
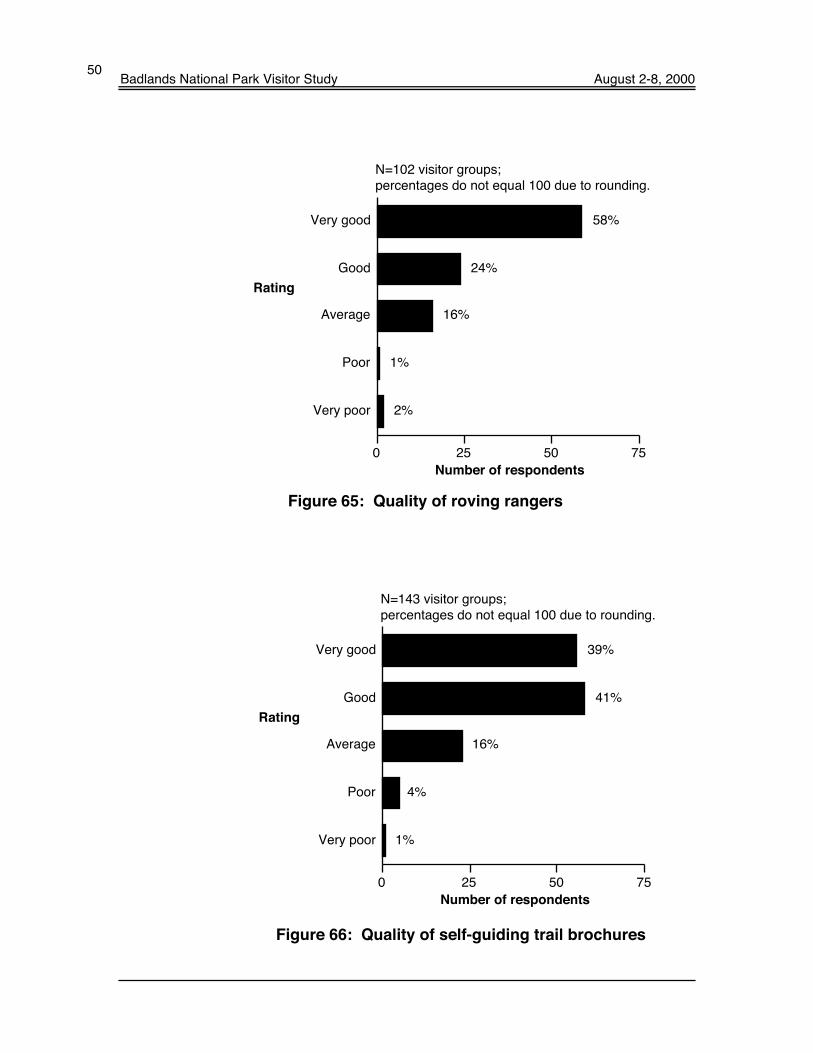
Figures 57-71 show the quality ratings that visitor groups gave each of
the individual services. Those services receiving the highest proportion of "very
good" or "good" ratings included information from visitor center staff (86%), park
brochure/ map (84%) and roving rangers (82%). The highest proportions of
“very poor” ratings were for the entrance station staff (2%) and the Badlands
web site (2%).
Figure 72 combines the “very good” and “good” quality ratings and
compares those ratings for all of the services.

Badlands National Park Visitor Study August 2-8, 2000 37
J
J
J
J
JJJ
JJ
JJ
J
J
J
1
2
3
4
5
1 2 3 4 5
Very good
quality
Very poor
quality
Extremely
important
Not
important
Figure 40: Average ratings of information serviceimportance and quality
J
J
J
J
JJJ
J
J
J
J
J
J
J
3
3.5
4
4.5
5
33.5 4 4.5 5
Very good
quality
Extremelyimportant
Average
Park brochure/ map
Ranger-led walks
Park newspaper
Bulletin boards
Badland web site
Trail brochures
V.C. staff
Orientation video Roadside exhibits
Pig dig site
Evening slide show
Roving rangers
Entrance station staff
Figure 41: Detail of Figure 40
see
enlargement
below
Badlands National Park Visitor Study August 2-8, 200038
Not important
Somewhat important
Moderately important
Very important
Extremely important
0 100 200 300
Number of respondents
Rating
N=492 visitor groups;percentages do not equal 100 due to rounding.
57%
27%
14%
2%
<1%
Figure 42: Importance of park brochure/ map
Not important
Somewhat important
Moderately important
Very important
Extremely important
0 20 40 60 80
Number of respondents
22%
30%
31%
13%
4%
Rating
N=189 visitor groups
Figure 43: Importance of park newspaper

Badlands National Park Visitor Study August 2-8, 2000 39
Not important
Somewhat important
Moderately important
Very important
Extremely important
0 20 40 60
Number of respondents
28%
33%
31%
7%
1%
Rating
N=134 visitor groups
Figure 44: Importance of orientation video
Not important
Somewhat important
Moderately important
Very important
Extremely important
0 20 40 60
Number of respondents
18%
36%
30%
12%
3%
Rating
N=122 visitor groups;percentages do not equal 100 due to rounding.
Figure 45: Importance of bulletin boards

Badlands National Park Visitor Study August 2-8, 200040
Not important
Somewhat important
Moderately important
Very important
Extremely important
0 50 100 150
Number of respondents
Rating
N=356 visitor groups;percentages do not equal 100 due to rounding.
34%
38%
22%
5%
<1%
Figure 46: Importance of roadside exhibits
Not important
Somewhat important
Moderately important
Very important
Extremely important
0 50 100 150
Number of respondents
35%
32%
26%
6%
1%
Rating
N=362 visitor groups
Figure 47: Importance of visitor center exhibits

Badlands National Park Visitor Study August 2-8, 2000 41
Not important
Somewhat important
Moderately important
Very important
Extremely important
0 50 100 150
Number of respondents
45%
28%
20%
4%
2%
Rating
N=260 visitor groups;percentages do not equal 100 due to rounding.
Figure 48: Importance of visitor center staff
Not important
Somewhat important
Moderately important
Very important
Extremely important
0 50 100
Number of respondents
38%
24%
25%
8%
5%
Rating
N=197 visitor groups
Figure 49: Importance of entrance station staff

Badlands National Park Visitor Study August 2-8, 200042
Not important
Somewhat important
Moderately important
Very important
Extremely important
0 20 40 60
Number of respondents
42%
31%
19%
7%
1%
Rating
N=108 visitor groups
Figure 50: Importance of roving rangers
Not important
Somewhat important
Moderately important
Very important
Extremely important
0 20 40 60 80
Number of respondents
43%
38%
14%
3%
2%
Rating
N=150 visitor groups
Figure 51: Importance of self-guiding trail brochures

Badlands National Park Visitor Study August 2-8, 2000 43
Not important
Somewhat important
Moderately important
Very important
Extremely important
0 5 10 15
Number of respondents
19%
37%
37%
7%
0%
Rating
N=27 visitor groups
CAUTION!
Figure 52: Importance of sales publications
Not important
Somewhat important
Moderately important
Very important
Extremely important
0 10 20 30 40
Number of respondents
55%
31%
13%
2%
0%
Rating
N=55 visitor groups;percentages do not equal 100 due to rounding.
Figure 53: Importance of ranger-led walks & talks

Badlands National Park Visitor Study August 2-8, 200044
Not important
Somewhat important
Moderately important
Very important
Extremely important
0 5 10 15 20
Number of respondents
41%
33%
21%
5%
0%
Rating
N=39 visitor groups
Figure 54: Importance of evening slide show program
Not important
Somewhat important
Moderately important
Very important
Extremely important
0 10 20 30
Number of respondents
28%
34%
31%
6%
1%
Rating
N=71 visitor groups
Figure 55: Importance of “Pig Dig” (paleontological site)

Badlands National Park Visitor Study August 2-8, 2000 45
Not important
Somewhat important
Moderately important
Very important
Extremely important
0 10 20 30 40 50
Number of respondents
48%
29%
14%
9%
0%
Rating
N=90 visitor groups
Figure 56: Importance of web site

Badlands National Park Visitor Study August 2-8, 200046
Very poor
Poor
Average
Good
Very good
0 50 100 150 200 250
Number of respondents
48%
36%
14%
1%
1%
Rating
N=475 visitor groups
Figure 57: Quality of park brochure/ map
Very poor
Poor
Average
Good
Very good
0 20 40 60 80 100
Number of respondents
30%
43%
22%
4%
2%
Rating
N=186 visitor groups;percentages do not equal 100 due to rounding
Figure 58: Quality of park newspaper

Badlands National Park Visitor Study August 2-8, 2000 47
Very poor
Poor
Average
Good
Very good
0 20 40 60
Number of respondents
36%
40%
17%
5%
2%
Rating
N=129 visitor groups
Figure 59: Quality of orientation video
Very poor
Poor
Average
Good
Very good
0 20 40 60
Number of respondents
28%
33%
34%
4%
1%
Rating
N=120 visitor groups
Figure 60: Quality of bulletin boards
Badlands National Park Visitor Study August 2-8, 200048
Very poor
Poor
Average
Good
Very good
0 50 100 150
Number of respondents
38%
38%
20%
3%
1%
Rating
N=346 visitor groups
Figure 61: Quality of roadside exhibits
Very poor
Poor
Average
Good
Very good
0 50 100 150
Number of respondents
39%
39%
17%
5%
0%
Rating
N=348 visitor groups;percentages do not equal 100 due to rounding.
<1%
Figure 62: Quality of visitor center exhibits

Badlands National Park Visitor Study August 2-8, 2000 49
Very poor
Poor
Average
Good
Very good
0 50 100 150
Number of respondents
55%
30%
11%
3%
1%
Rating
N=256 visitor groups;percentages do not equal 100 due to rounding.
56%
Figure 63: Quality of visitor center staff
Very poor
Poor
Average
Good
Very good
0 25 50 75 100 125
Number of respondents
51%
25%
17%
5%
2%
Rating
N=197 visitor groups
Figure 64: Quality of entrance station staff
Badlands National Park Visitor Study August 2-8, 200050
Very poor
Poor
Average
Good
Very good
0 25 50 75
Number of respondents
58%
24%
16%
1%
2%
Rating
N=102 visitor groups;percentages do not equal 100 due to rounding.
Figure 65: Quality of roving rangers
Very poor
Poor
Average
Good
Very good
0 25 50 75
Number of respondents
39%
41%
16%
3%
1%
Rating
N=143 visitor groups;percentages do not equal 100 due to rounding.
4%
Figure 66: Quality of self-guiding trail brochures

Badlands National Park Visitor Study August 2-8, 2000 51
Very poor
Poor
Average
Good
Very good
0 10 20
Number of respondents
54%
25%
18%
4%
0%
Rating
N=28 visitor groups;percentages do not equal 100 due to rounding.
CAUTION!
Figure 67: Quality of sales publications
Very poor
Poor
Average
Good
Very good
0 20 40
Number of respondents
49%
31%
7%
11%
2%
Rating
N=55 visitor groups
Figure 68: Quality of ranger-led walks & talks

Badlands National Park Visitor Study August 2-8, 200052
Very poor
Poor
Average
Good
Very good
0 10 20
Number of respondents
37%
39%
24%
0%
0%
Rating
N=38 visitor groups;percentages do not equal 100 due to rounding
Figure 69: Quality of evening slide show program
Very poor
Poor
Average
Good
Very good
0 20 40
Number of respondents
44%
27%
21%
6%
2%
Rating
N=66 visitor groups
Figure 70: Quality of “Pig Dig” (paleontological site)

Badlands National Park Visitor Study August 2-8, 2000 53
Very poor
Poor
Average
Good
Very good
0 25 50
Number of respondents
28%
43%
20%
7%
2%
Rating
N=89 visitor groups
Figure 71: Quality of web site
Bulletin boards
"Pig Dig" site
Badlands NP web site
Park newspaper
Evening slide show
Orientation video
Entrance station staff
Roadside exhibits
Visitor center exhibits
Ranger-led walks
Trail brochures
Roving rangers
Park brochure/map
Visitor center staff
0 25 50 75 100
Proportion of respondents (%)
Visitorservice
N=total number of groups that rated each service.
86%, N=256
84%, N=475
82%, N=102
80%, N=143
79%, N=55
78%, N=348
76%, N=346
76%, N=197
76%, N=129
76%, N=38
73%, N=186
71%, N=89
71%, N==66
61%, N=120
Figure 72: Combined proportions of “very good” or “good” qualityratings for services
Badlands National Park Visitor Study August 2-8, 200054
Visitor services
and facilities: use,
importance and
quality
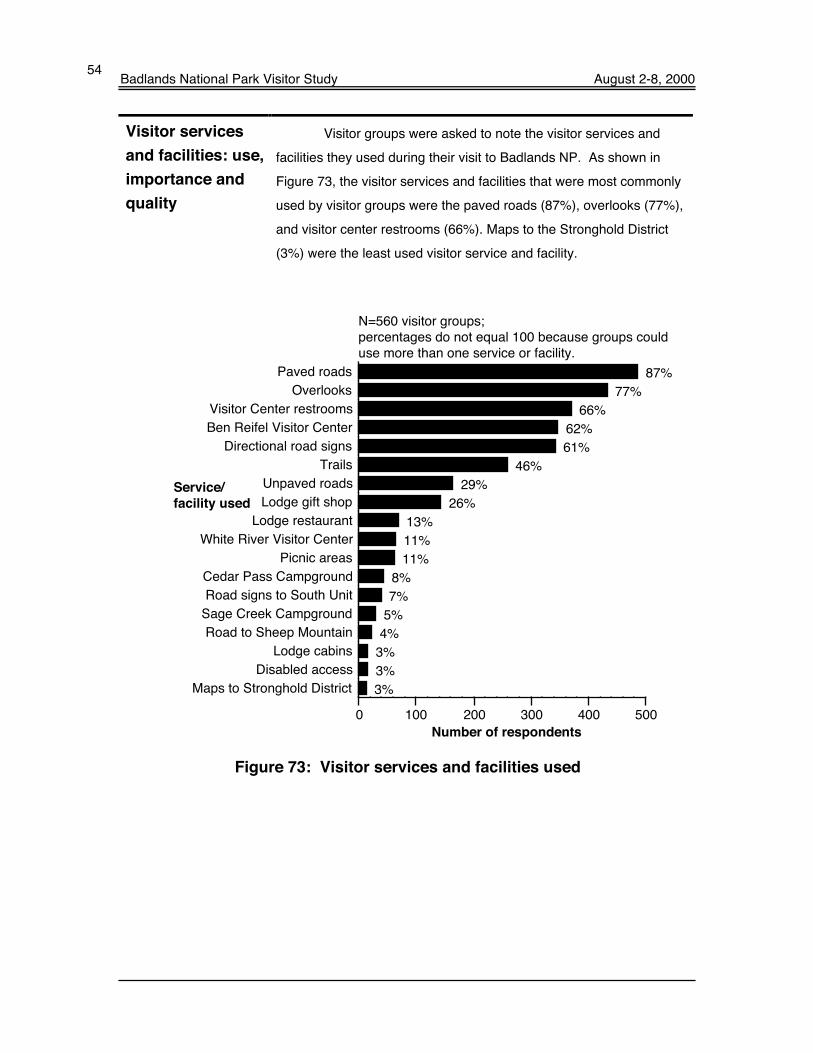
Visitor groups were asked to note the visitor services and
facilities they used during their visit to Badlands NP. As shown in
Figure 73, the visitor services and facilities that were most commonly
used by visitor groups were the paved roads (87%), overlooks (77%),
and visitor center restrooms (66%). Maps to the Stronghold District
(3%) were the least used visitor service and facility.
Maps to Stronghold District
Disabled access
Lodge cabins
Road to Sheep Mountain
Sage Creek Campground
Road signs to South Unit
Cedar Pass Campground
Picnic areas
White River Visitor Center
Lodge restaurant
Lodge gift shop
Unpaved roads
Trails
Directional road signs
Ben Reifel Visitor Center
Visitor Center restrooms
Overlooks
Paved roads
0 100 200 300 400 500
Number of respondents
N=560 visitor groups;percentages do not equal 100 because groups coulduse more than one service or facility.
Service/
facility used
87%
77%
66%
62%
61%
46%
29%
26%
13%
11%
11%
8%
7%
5%
3%
3%
4%
3%
Figure 73: Visitor services and facilities used

Badlands National Park Visitor Study August 2-8, 2000 55
Visitor groups rated the importance and quality of each of the services
and facilities they used. The following five point scales were used in the
questionnaire:
IMPORTANCE QUALITY 5=extremely important 5=very good 4=very important 4=good 3=moderately important 3=average 2=somewhat important 2=poor 1=not important 1=very poor
The average importance and quality ratings for each service/ facility
were determined based on ratings provided by visitors who used each service/
facility. Figures 74 and 75 show the average importance and quality ratings for
each of the visitor services and facilities. All services/ facilities were rated as
above "average" both in importance and quality. It should be noted that Sage
Creek Campground, access for disabled persons, lodge cabins, directional road
signs to South Unit, road to Sheep Mountain, and maps to locate Stronghold
District and/ or Palmer Creek were not rated by enough people to provide
reliable data.
Figures 76-93 show the importance ratings that were provided by visitor
groups for each of the individual visitor services and facilities. Those visitor
services and facilities receiving the highest proportion of "extremely important"
or "very important" ratings included the overlooks (93%), Cedar Pass
Campground (93%) and the trails (92%). The highest proportions of "not
important" ratings were for the lodge gift shop (3%) and unpaved roads (2%).
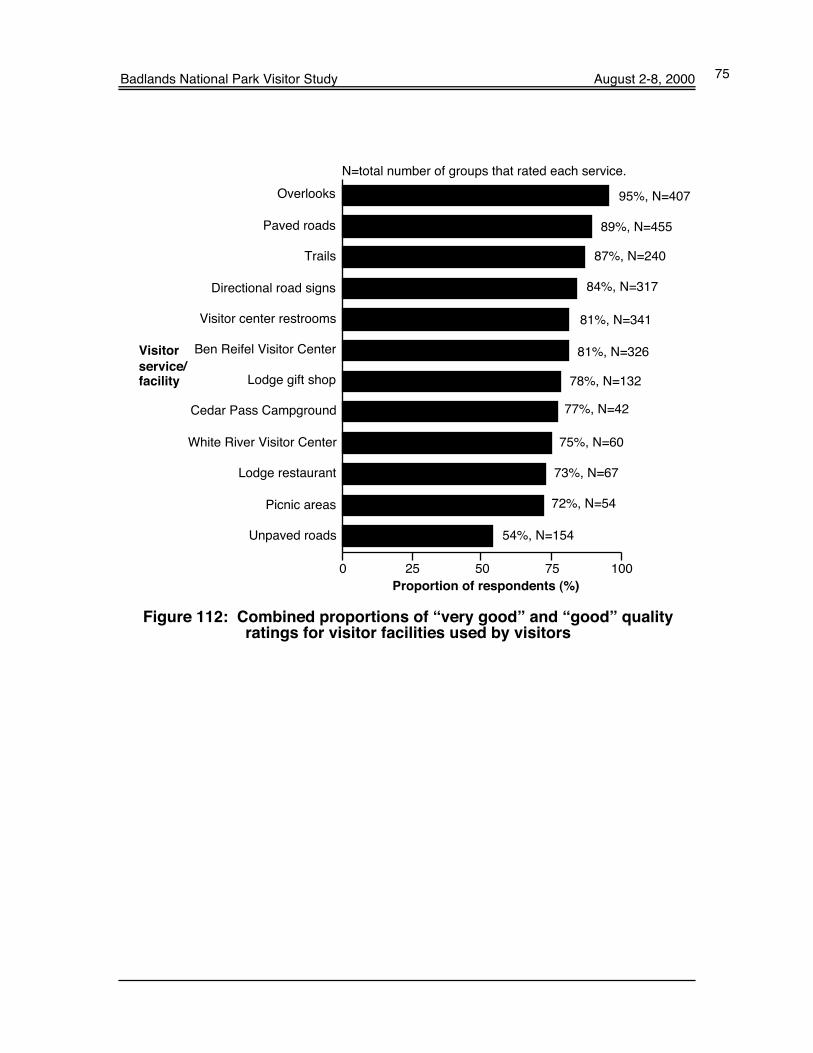
Figures 94-111 show the quality ratings that were provided by visitor
groups for each of the individual facilities. Those facilities receiving the highest
proportion of "very good" or "good" ratings included overlooks (95%), paved
roads (89%) and trails (87%). The highest proportions of “very poor” ratings
were for unpaved roads (4%) and picnic areas (2%).
Figure 112 combines the “very good” and “good” quality ratings and
compares those ratings for all of the services and facilities.

Badlands National Park Visitor Study August 2-8, 200056
J
JJ JJ
J
JJ
JJ
J
J
1
2
3
4
5
1 2 3 4 5
Very good
quality
Very poorquality
Extremely
important
Not
important
Figure 74: Average ratings of service and facility importance and quality
J
JJ JJ
J
JJ
JJ
J
J
3
3.5
4
4.5
5
33.5 4 4.5 5
Very good
quality
Extremely
important
Average
Ben Reifel Visitor Center
Visitor Center restrooms
Cedar Pass Campground
Directional road signs
Paved roads
Unpaved roads
OverlooksTrails
Picnic areas
Lodge restaurant
Lodge gift shop
White River Visitor Center
Figure 75: Detail
see
enlargementbelow

Badlands National Park Visitor Study August 2-8, 2000 57
Not important
Somewhat important
Moderately important
Very important
Extremely important
0 25 50 75 100 125 150 175
Number of respondents
43%
31%
23%
2%
0%
Rating
N=338 visitor groups;percentages do not equal 100 due to rounding.
<1%
Figure 76: Importance of Ben Reifel Visitor Center
Not important
Somewhat important
Moderately important
Very important
Extremely important
0 50 100 150 200 250
Number of respondents
69%
21%
9%
1%
1%
Rating
N=350 visitor groups;percentages do not equal 100 due to rounding.
Figure 77: Importance of visitor center restrooms

Badlands National Park Visitor Study August 2-8, 200058
Not important
Somewhat important
Moderately important
Very important
Extremely important
0 5 10 15 20
Number of respondents
68%
20%
12%
0%
0%
Rating
N=25 visitor groups
CAUTION!
Figure 78: Importance of Sage Creek Campground
Not important
Somewhat important
Moderately important
Very important
Extremely important
0 5 10 15 20 25 30
Number of respondents
70%
23%
7%
0%
0%
Rating
N=43 visitor groups
Figure 79: Importance of Cedar Pass Campground

Badlands National Park Visitor Study August 2-8, 2000 59
Not important
Somewhat important
Moderately important
Very important
Extremely important
0 50 100 150 200 250
Number of respondents
68%
24%
7%
0%
0%
Rating
N=329 visitor groups;percentages do not equal 100 due to rounding.
<1%
<1%
Figure 80: Importance of directional road signs
Not important
Somewhat important
Moderately important
Very important
Extremely important
0 50 100 150 200 250 300
Number of respondents
62%
25%
10%
2%
1%
Rating
N=468 visitor groups
Figure 81: Importance of paved roads

Badlands National Park Visitor Study August 2-8, 200060
Not important
Somewhat important
Moderately important
Very important
Extremely important
0 20 40 60 80
Number of respondents
41%
30%
22%
4%
2%
Rating
N=161 visitor groups;percentages do not equal 100 due to rounding.
Figure 82: Importance of unpaved roads
Not important
Somewhat important
Moderately important
Very important
Extremely important
0 50 100 150 200 250 300
Number of respondents
66%
27%
7%
0%
0%
Rating
N=418 visitor groups;percentages do not equal 100 due to rounding.
<1%
<1%
Figure 83: Importance of overlooks

Badlands National Park Visitor Study August 2-8, 2000 61
Not important
Somewhat important
Moderately important
Very important
Extremely important
0 20 40 60 80 100 120 140 160
Number of respondents
65%
27%
7%
1%
0%
Rating
N=248 visitor groups
Figure 84: Importance of trails
Not important
Somewhat important
Moderately important
Very important
Extremely important
0 2 4 6 8 10 12
Number of respondents
92%
0%
8%
0%
0%
Rating
N=13 visitor groups
CAUTION!
Figure 85: Importance of access for disabled persons
Badlands National Park Visitor Study August 2-8, 200062
Not important
Somewhat important
Moderately important
Very important
Extremely important
0 5 10 15 20 25
Number of respondents
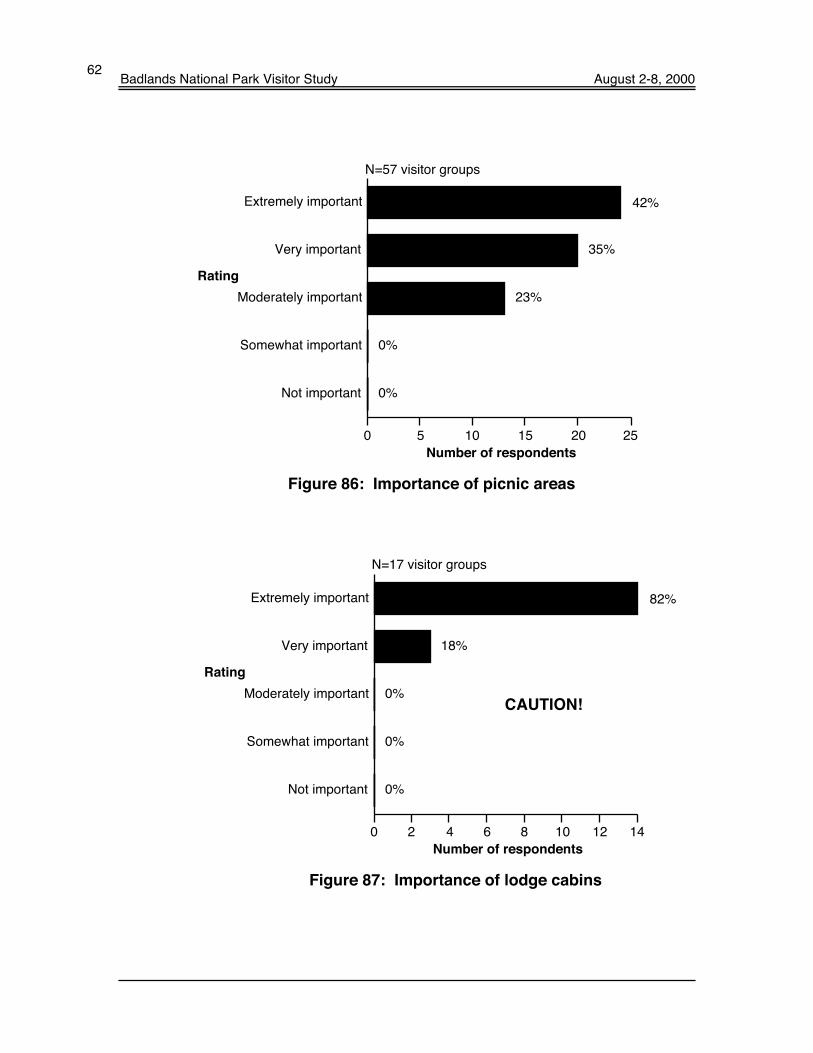
42%
35%
23%
0%
0%
Rating
N=57 visitor groups
Figure 86: Importance of picnic areas
Not important
Somewhat important
Moderately important
Very important
Extremely important
0 2 4 6 8 10 12 14
Number of respondents
82%
18%
0%
0%
0%
Rating
N=17 visitor groups
CAUTION!
Figure 87: Importance of lodge cabins

Badlands National Park Visitor Study August 2-8, 2000 63
Not important
Somewhat important
Moderately important
Very important
Extremely important
0 5 10 15 20 25 30 35 40
Number of respondents
58%
20%
17%
3%
1%
Rating
N=69 visitor groups;percentages do not equal 100 due to rounding.
Figure 88: Importance of lodge restaurant
Not important
Somewhat important
Moderately important
Very important
Extremely important
0 10 20 30 40 50 60
Number of respondents
25%
25%
38%
9%
3%
Rating
N=138 visitor groups
Figure 89: Importance of lodge gift shop

Badlands National Park Visitor Study August 2-8, 200064
Not important
Somewhat important
Moderately important
Very important
Extremely important
0 5 10 15 20 25 30
Number of respondents
43%
27%
27%
3%
0%
Rating
N=63 visitor groups
Figure 90: Importance of White River Visitor Center
Not important
Somewhat important
Moderately important
Very important
Extremely important
0 2 4 6 8 10 12 14 16 18
Number of respondents
67%
19%
15%
0%
0%
Rating
N=27 visitor groups;percentages do not equal 100 due to rounding.
CAUTION!
Figure 91: Importance of directional road signs to South Unit

Badlands National Park Visitor Study August 2-8, 2000 65
Not important
Somewhat important
Moderately important
Very important
Extremely important
0 2 4 6 8 10 12 14
Number of respondents
59%
18%
23%
0%
0%
Rating
N=22 visitor groups
Figure 92: Importance of road to Sheep Mountain
Not important
Somewhat important
Moderately important
Very important
Extremely important
0 1 2 3 4 5 6
Number of respondents
43%
21%
29%
0%
7%
Rating
N=14 visitor groups
CAUTION!
Figure 93: Importance of maps to locate Stronghold Districtand/ or Palmer Creek

Badlands National Park Visitor Study August 2-8, 200066
Very poor
Poor
Average
Good
Very good
0 20 40 60 80 100 120 140
Number of respondents
42%
39%
17%
1%
0%
Rating
N=326 visitor groups;percentages do not equal 100 due to rounding.
<1%
Figure 94: Quality of Ben Reifel Visitor Center
Very poor
Poor
Average
Good
Very good
0 25 50 75 100 125 150 175
Number of respondents
45%
36%
13%
5%
1%
Rating
N=341 visitor groups
Figure 95: Quality of visitor center restrooms
Badlands National Park Visitor Study August 2-8, 2000 67
Very poor
Poor
Average
Good
Very good
0 10 20
Number of respondents
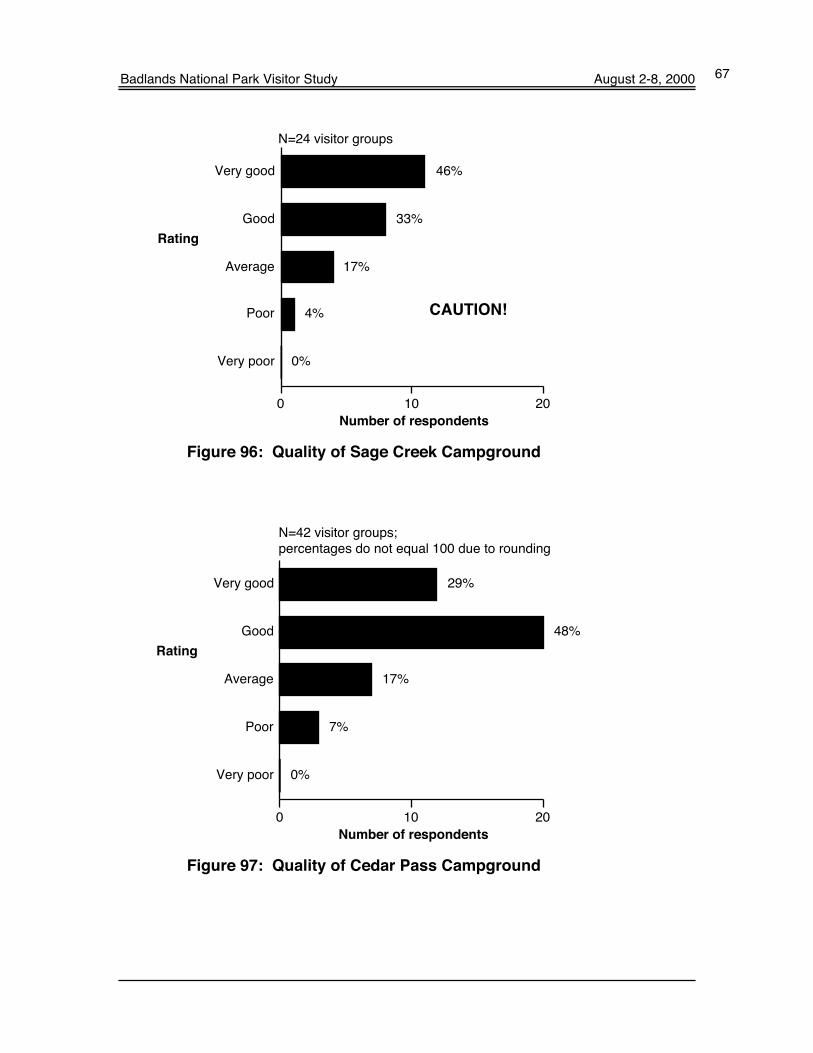
46%
33%
17%
4%
0%
Rating
N=24 visitor groups
CAUTION!
Figure 96: Quality of Sage Creek Campground
Very poor
Poor
Average
Good
Very good
0 10 20
Number of respondents
29%
48%
17%
7%
0%
Rating
N=42 visitor groups;percentages do not equal 100 due to rounding
Figure 97: Quality of Cedar Pass Campground

Badlands National Park Visitor Study August 2-8, 200068
Very poor
Poor
Average
Good
Very good
0 25 50 75 100 125 150 175
Number of respondents
51%
33%
12%
3%
1%
Rating
N=317 visitor groups
Figure 98: Quality of directional road signs
Very poor
Poor
Average
Good
Very good
0 50 100 150 200 250 300
Number of respondents
56%
33%
9%
1%
0%
Rating
N=455 visitor groups;percentages do not equal 100 due to rounding.
<1%
Figure 99: Quality of paved roads

Badlands National Park Visitor Study August 2-8, 2000 69
Very poor
Poor
Average
Good
Very good
0 20 40 60
Number of respondents
29%
25%
31%
12%
4%
Rating
N=154 visitor groups;percentages do not equal 100 due to rounding.
Figure 100: Quality of unpaved roads
Very poor
Poor
Average
Good
Very good
0 50 100 150 200 250 300
Number of respondents
64%
31%
4%
0%
0%
Rating
N=407 visitor groups;percentages do not equal 100 due to rounding.
<1%
Figure 101: Quality of overlooks

Badlands National Park Visitor Study August 2-8, 200070
Very poor
Poor
Average
Good
Very good
0 20 40 60 80 100 120 140
Number of respondents
57%
30%
11%
3%
0%
Rating
N=240 visitor groups;percentages do not equal 100 due to rounding.
Figure 102: Quality of trails
Very poor
Poor
Average
Good
Very good
0 2 4
Number of respondents
33%
33%
17%
0%
17%
Rating
N=12 visitor groups
CAUTION!
Figure 103: Quality of access for disabled persons

Badlands National Park Visitor Study August 2-8, 2000 71
Very poor
Poor
Average
Good
Very good
0 10 20 30
Number of respondents
39%
33%
24%
2%
2%
Rating
N=54 visitor groups
Figure 104: Quality of picnic areas
Very poor
Poor
Average
Good
Very good
0 2 4 6 8
Number of respondents
38%
25%
31%
6%
0%
Rating
N=16 visitor groups
CAUTION!
Figure105: Quality of lodge cabins

Badlands National Park Visitor Study August 2-8, 200072
Very poor
Poor
Average
Good
Very good
0 20 40
Number of respondents
43%
30%
22%
0%
4%
Rating
N=67 visitor groups;percentages do not equal 100 due to rounding.
Figure 106: Quality of lodge restaurant
Very poor
Poor
Average
Good
Very good
0 20 40 60
Number of respondents
41%
37%
20%
2%
1%
Rating
N=132 visitor groups;percentages do not equal 100 due to rounding.
Figure 107: Quality of lodge gift shop

Badlands National Park Visitor Study August 2-8, 2000 73
Very poor
Poor
Average
Good
Very good
0 20 40
Number of respondents
45%
30%
18%
3%
3%
Rating
N=60 visitor groups;percentages do not equal 100 due to rounding.
Figure 108: Quality of White River Visitor Center
Very poor
Poor
Average
Good
Very good
0 20
Number of respondents
42%
27%
12%
12%
8%
Rating
N=26 visitor groups;percentages do not equal 100 due to rounding.
CAUTION!
Figure 109: Quality of directional road signs to South Unit

Badlands National Park Visitor Study August 2-8, 200074
Very poor
Poor
Average
Good
Very good
0 4 8 12
Number of respondents
40%
10%
40%
10%
0%
Rating
N=20 visitor groups
CAUTION!
Figure 110: Quality of road to Sheep Mountain
Very poor
Poor
Average
Good
Very good
0 20
Number of respondents
42%
17%
17%
17%
8%
Rating
N=12 visitor groups;percentages do not equal 100 due to rounding.
Figure 111: Quality of maps to locate Stronghold Districtand/or Palmer Creek
Badlands National Park Visitor Study August 2-8, 2000 75
Unpaved roads
Picnic areas
Lodge restaurant
White River Visitor Center
Cedar Pass Campground
Lodge gift shop
Ben Reifel Visitor Center
Visitor center restrooms
Directional road signs
Trails
Paved roads
Overlooks
0 25 50 75 100
Proportion of respondents (%)
Visitor
service/facility
N=total number of groups that rated each service.
95%, N=407
89%, N=455
87%, N=240
84%, N=317
81%, N=341
81%, N=326
78%, N=132
77%, N=42
75%, N=60
73%, N=67
72%, N=54
54%, N=154
Figure 112: Combined proportions of “very good” and “good” qualityratings for visitor facilities used by visitors
Badlands National Park Visitor Study August 2-8, 200076
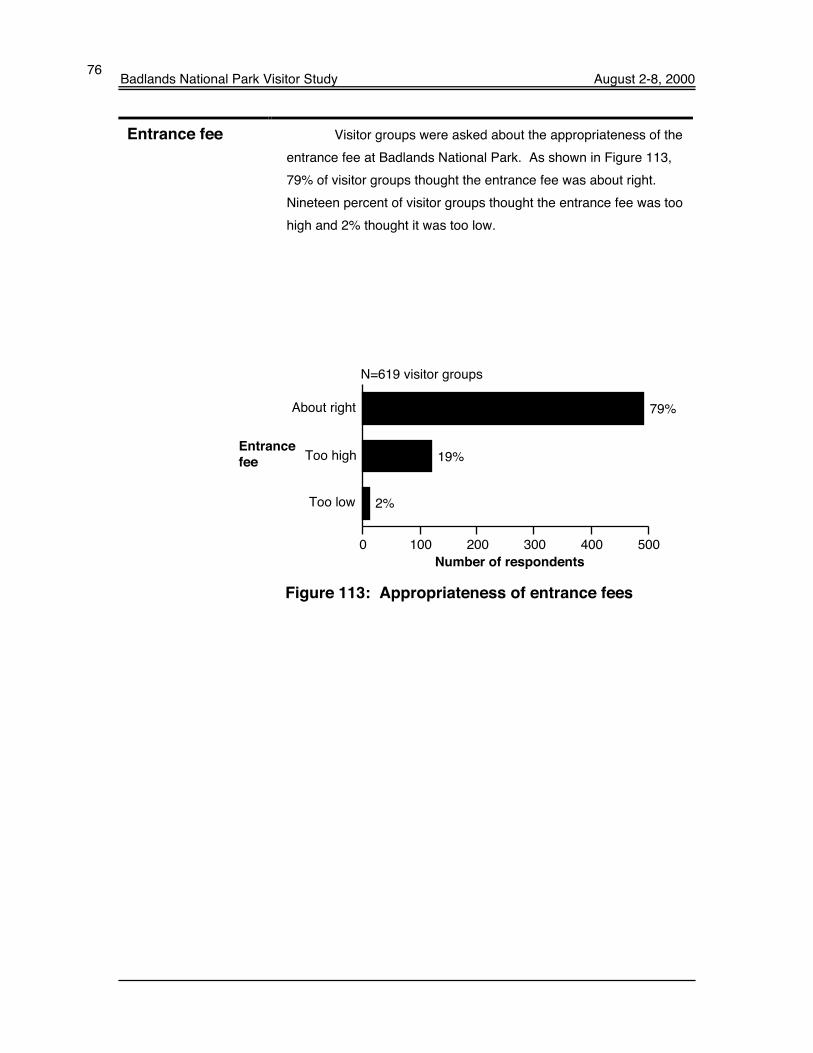
Entrance fee Visitor groups were asked about the appropriateness of the
entrance fee at Badlands National Park. As shown in Figure 113,
79% of visitor groups thought the entrance fee was about right.
Nineteen percent of visitor groups thought the entrance fee was too
high and 2% thought it was too low.
Too low
Too high
About right
0 100 200 300 400 500
Number of respondents
79%
19%
2%
Entrance
fee
N=619 visitor groups
Figure 113: Appropriateness of entrance fees

Badlands National Park Visitor Study August 2-8, 2000 77
Visitors groups were asked about their willingness to utilize
public transportation in the future. As shown in Figure 114, 80% of
visitor groups indicated they would be unlikely to use public
transportation into the park. Twelve percent of visitor groups were "not
sure" if they would use public transportation and 7% indicated they
would use public transportation. Of the visitor groups who indicated a
willingness to use public transportation, 44% stated their preference for
using a shuttle from Rapid City, South Dakota, 37% from Interior, South
Dakota, and 39% for other forms of transportation (see Figure 115).
The other forms of transportation ranged from a service to carry
bicycles into the park, to a shuttle from other small towns like Wall,
South Dakota.
Public
transportation
Not sure
Yes, likely
No, unlikely
0 100 200 300 400 500 600
Number of respondents
80%
7%
12%
Use public
transportation
into park?
N=627 visitor groups;percentages do not equal 100 due to rounding.
Figure 114: Use public transportation into Badlands NP
Other
Shuttle from Interior, SD
Shuttle from Rapid City, SD
0 5 10 15 20
Number of respondents
Preferred
public
transportation
N=41 visitor groups;percentages do not equal 100 because groupscould select more than one.
44%
39%
37%
Figure 115: Preferred types of public transportation

Badlands National Park Visitor Study August 2-8, 200078
Park
elements—effects
on visitor
experience
Visitor groups were asked: “For any of the following elements
that you and your group experienced in Badlands National Park, please
indicate how they affected your park experience.” As shown in Figures
116-121, the majority of visitor groups indicated “no effect” for each of
the 6 elements included in the question. Twenty-three percent of visitor
groups indicated that visitors climbing on geologic features detracted
from their experience (see Figure 117). Fifteen percent of visitor groups
indicated that the number of visitors detracted from their experience (see
Figure 118). As shown in Figure 121, 13% of visitor groups indicated that
the horseback riders in the park added to their experience.
Detracted from
No effect
Added to
0 100 200 300 400
Number of respondents
2%
83%
15%
Helicopter
noise
N=442 visitor groups
Figure 116: Did helicopter noise in Badlands NP affect your experience?
Detracted from
No effect
Added to
0 100 200 300 400
Number of respondents
13%
64%
23%
Visitors
climbing on
geologic
features
N=494 visitor groups
Figure 117: Did visitors climbing on geologic features in Badlands NPaffect your experience?

Badlands National Park Visitor Study August 2-8, 2000 79
Detracted from
No effect
Added to
0 100 200 300 400 500
Number of respondents
4%
81%
15%
Number of
people in park
N=539 visitor groups
Figure 118: Did the number of people in Badlands NPaffect your experience?
Detracted from
No effect
Added to
0 100 200 300 400 500
Number of respondents
3%
76%
22%
Number ofvehicles in
park
N=538 visitor groups;percentages do not equal 100 due to rounding.
Figure 119: Did the number of vehicles in BadlandsNP affect your experience?
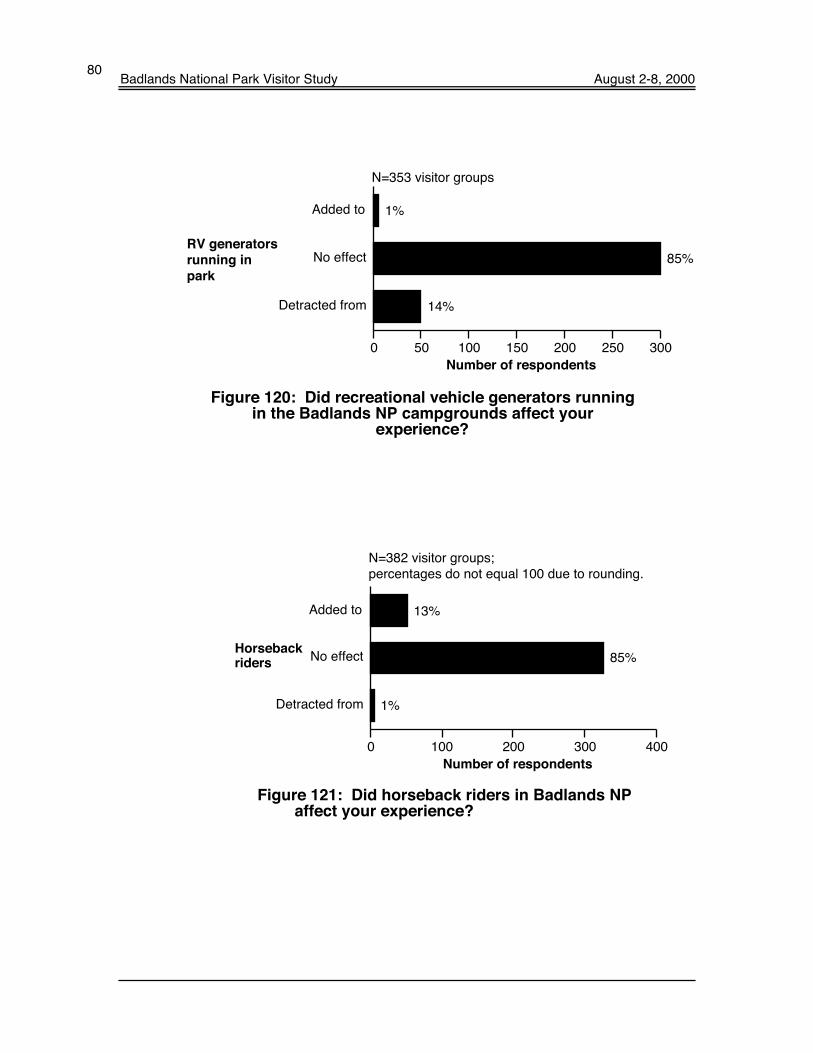
Badlands National Park Visitor Study August 2-8, 200080
Detracted from
No effect
Added to
0 50 100 150 200 250 300
Number of respondents
1%
85%
14%
RV generators
running in
park
N=353 visitor groups
Figure 120: Did recreational vehicle generators runningin the Badlands NP campgrounds affect your
experience?
Detracted from
No effect
Added to
0 100 200 300 400
Number of respondents
13%
85%
1%
Horsebackriders
N=382 visitor groups;percentages do not equal 100 due to rounding.
Figure 121: Did horseback riders in Badlands NPaffect your experience?
Badlands National Park Visitor Study August 2-8, 2000 81
Visitor groups were asked to state the amount of money they
spent in Badlands NP and in the surrounding area (within a 1-hour
drive of the park) on this visit. Groups were asked to indicate the
amounts they spent for lodging; camping fees; restaurants and bars;
groceries and take-out food; gas and oil; other transportation
expenses; admissions, recreation, and entertainment fees; and all
other purchases.
Total expenditures (inside and outside of park): Thirty-
three percent of the visitor groups spent from $1 to $50, and another
17% spent from $51 to $100 in Badlands NP and the surrounding area
(see Figure 122). Thirteen percent of the groups spent $101 to $150
and 7% of visitor groups spent no money. Of the total expenditures by
groups, 26% was for lodging, 18% was for restaurants and bars, and
20% was for “other” items (see Figure 123).
The average visitor group expenditure during this visit was
$228. The median visitor group expenditure (50% of groups spent
more and 50% of groups spent less) was $85. The average per capita
expenditure was $71.
Proportion of expenditures (inside park): Of the total
expenditures by visitor group inside Badlands NP, 33% was for
admissions, recreation, and entertainment fees, 15% was for
restaurants and bars, and 26% was for “other” items (see Figure 124).
Lodging (inside park): Ninety-five percent of visitor groups
spent no money for lodging in Badlands NP (see Figure 125). Two
percent of visitor groups spent $76 to $100 for lodging.
Camping fees (inside park): Eighty-three percent of visitor
groups spent no money for camping fees in Badlands NP. Twelve
percent of visitor groups spent $1 to $25 for camping fees (see Figure
126).
Restaurants and bars (inside park): Seventy-four percent of
visitor groups spent no money at restaurants and bars in Badlands NP
(see Figure 127). Twelve percent spent $1 to $25 at restaurants and
bars, and 10% spent $26 to $50.
Expenditures
Badlands National Park Visitor Study August 2-8, 200082
Expenditures
(continued)
Groceries and take-out food (inside park): Eighty-four
percent of visitor groups spent no money on groceries and take-out
foodl in Badlands NP(see Figure 128). Fourteen percent spent $1 to
$25 on groceries and take-out food.
Gas and oil (inside park): Eighty-nine percent of visitor
groups spent no money on gas and oil in Badlands NP (see Figure
129). Eight percent spent $1 to $25 on gas and oil. As there are no
service stations within Badlands NP, visitor groups answering this
question might have been confused as to the actual boundary of the
park.
Other transportation expenses (inside park): Ninety-eight
percent of visitor groups spent no money on other transportation
expenses in Badlands NP (see Figure 130). One percent of the
groups spent from $1 to $25 on other transportation expenses.
Admissions, recreation, entertainment fees (inside park):
Fifty-eight percent of visitor groups spent from $1 to $25 on
admissions, recreation, and entertainment fees in Badlands NP (see
Figure 131). Thirty-six percent of visitor groups spent no money on
admissions, recreation, and entertainment fees.
All other purchases (inside park): Forty-five percent of
visitor groups spent no money on other purchases in Badlands NP
(see Figure 132). Thirty-four percent of visitor groups spent $1 to
$25, and 15% spent $26 to $50 on other purchases.
Proportion of expenditures (outside park): Of the total
expenditures by visitor group outside Badlands NP, 31% was for
lodging, 19% was for restaurants and bars, and 19% was for “other”
items (see Figure 133).
Lodging (outside park): Sixty percent of visitor groups
spent no money on lodging outside of Badlands NP (see Figure
134). Ten percent of visitor groups spent $76 to $100 on lodging.
Camping Fees (outside park): Seventy-two percent of
visitor groups spent no money on camping fee outside of Badlands
NP (see Figure 135). Fourteen percent of visitor groups spent $1 to
$25 on camping fees.

Badlands National Park Visitor Study August 2-8, 2000 83
Restaurants and Bars (outside park): Thirty-eight percent
of visitor groups spent no money at restaurants and bars outside of
Badlands NP (see Figure 136). Twenty-four percent of visitor groups
spent $1 to $25 at restaurants and bars, and 16% spent $26 to $50.
Groceries and take-out food (outside park): Fifty-three
percent of visitor groups spent no money on groceries and take-out
food outside of Badlands NP (see Figure 137). Twenty-seven
percent spent $1 to $25 on groceries and take-out food.
Gas and oil (outside park): Thirty-nine percent of visitor
groups spent $1 to $25 on gas and oil in Badlands NP (see Figure
138). Thirty percent of visitor groups spent no money on gas and oil.
Other transportation expenses (outside park): Ninety-six
percent of visitor groups spent no money on other transportation
expenses outside of Badlands NP (see Figure 139). One percent of
the groups spent from $1 to $25 on other transportation expenses.
Admissions, recreation, entertainment fees (outside
park): Sixty-seven percent of visitor groups spent no money on
admissions, recreation, and entertainment fees outside of Badlands
NP (see Figure 140). Seventeen percent of visitor groups spent $1-
25. on admissions, recreation, and entertainment fees
All other purchases (outside park): Forty-five percent of
visitor groups spent no money on other purchases in Badlands NP
(see Figure 141). Twenty-one percent of visitor groups spent $1 to
$25
Visitor groups were asked to indicate how many adults were
covered by their expenditures. Sixty-nine percent of visitor groups
indicated their expenses covered 2 adults, while 9% indicated the
expenses covering only 1 adult (see Figure 142). Visitor groups
were also asked to indicate how many children were covered by their
expenditures. Thirty-four percent of visitor groups indicated their
expenses covered 2 children, 22% indicated the expenses covered 1
child, and 18% indicated the expenses covered 0 children (see
Figure 143).
Expenditures
(continued)

Badlands National Park Visitor Study August 2-8, 200084
No money spent
$1-50
$51-100
$101-150
$151-200
$201-250
$251-300
$301-350
$351 or more
0 50 100 150 200
Number of respondents
15%
1%
4%
4%
7%
13%
17%
33%
7%
Amount
spent
N=574 visitor groups;percentages do not equal 100 due to rounding.
Figure 122: Total expenditures in Badlands NP and surrounding area
Lodging (26%)
Camping fees (5%)
Restaurants and bars (18%)
Groceries and take-out food (6%)
Gas and oil (12%)
Other transportation expenses (1%)
(11%)
Other (20%)
N=574 visitor groups;
percentages do not equal
100 due to rounding.
Admission, recreation,
and entertainment fees
Figure 123: Proportions of expenditures in Badlands NP and surrounding area

Badlands National Park Visitor Study August 2-8, 2000 85
Lodging (7%)
Camping fees (11%)
Restaurants and bars (15%)
Groceries and take-out food (3%)
Gas and oil (4%)Other transportation expenses (1%)
(33%)
Other (26%)
N=482 visitor groups
Admission, recreation,
and entertainment fees
Figure 124: Proportion of expenditures in Badlands NP
No money spent
$1-25
$26-50
$51-75
$76-100
$101-125
$126-150
$151 or more
0 50 100 150 200 250 300 350
Number of respondents
0%
0%
1%
2%
1%
1%
0%
95%
Amount
spent
N=341 visitor groups;percentages do not equal 100 due to rounding.
<1%
<1%
Figure 125: Lodging in Badlands NP

Badlands National Park Visitor Study August 2-8, 200086
No money spent
$1-25
$26-50
$51-75
$76-100
$101-125
$126-150
$151 or more
0 50 100 150 200 250 300
Number of respondents
0%
0%
0%
0%
1%
3%
12%
83%
Amountspent
N=332 visitor groups;percentages do not equal 100 due to rounding.
<1%
<1%
<1%
Figure 126: Camping fees in Badlands NP
Figure 127: Restaurants and bars in Badlands NP
No money spent
$1-25
$26-50
$51-75
$76-100
$101-125
$126-150
$151 or more
0 50 100 150 200 250 300
Number of respondents
1%
0%
0%
2%
1%
10%
12%
74%
Amount
spent
N=352 visitor groups;percentages do not equal 100 due to rounding.
<1%
<1%

Badlands National Park Visitor Study August 2-8, 2000 87
Figure 128: Groceries in Badlands NP
Figure 129: Gas and oil in Badland NP
No money spent
$1-25
$26-50
$51-75
$76-100
$101-125
$126-150
$151 or more
0 50 100 150 200 250 300
Number of respondents
0%
0%
0%
0%
0%
2%
14%
84%
Amount
spent
N=319 visitor groups;percentages do not equal 100 due to rounding.
<1%
No money spent
$1-25
$26-50
$51-75
$76-100
$101-125
$126-150
$151 or more
0 50 100 150 200 250 300
Number of respondents
0%
0%
0%
0%
1%
2%
8%
89%
Amountspent
N=317 visitor groups;percentages do not equal 100 due to rounding.
<1%

Badlands National Park Visitor Study August 2-8, 200088
Figure 130: Other transportation expenses in Badlands NP
No money spent
$1-25
$26-50
$51-75
$76-100
$101-125
$126-150
$151 or more
0 50 100 150 200 250
Number of respondents
1%
0%
0%
0%
1%
5%
58%
35%
Amount
spent
N=392 visitor groups;percentages do not equal 100 due to rounding.
36%
Figure 131: Admissions, recreation, and entertainment fees in Badlands NP
No money spent
$1-25
$26-50
$51-75
$76-100
$101-125
$126-150
$151 or more
0 50 100 150 200 250 300
Number of respondents
0%
0%
0%
0%
0%
1%
1%
98%
Amount
spent
N=306 visitor groups;percentages do not equal 100 due to rounding.
<1%
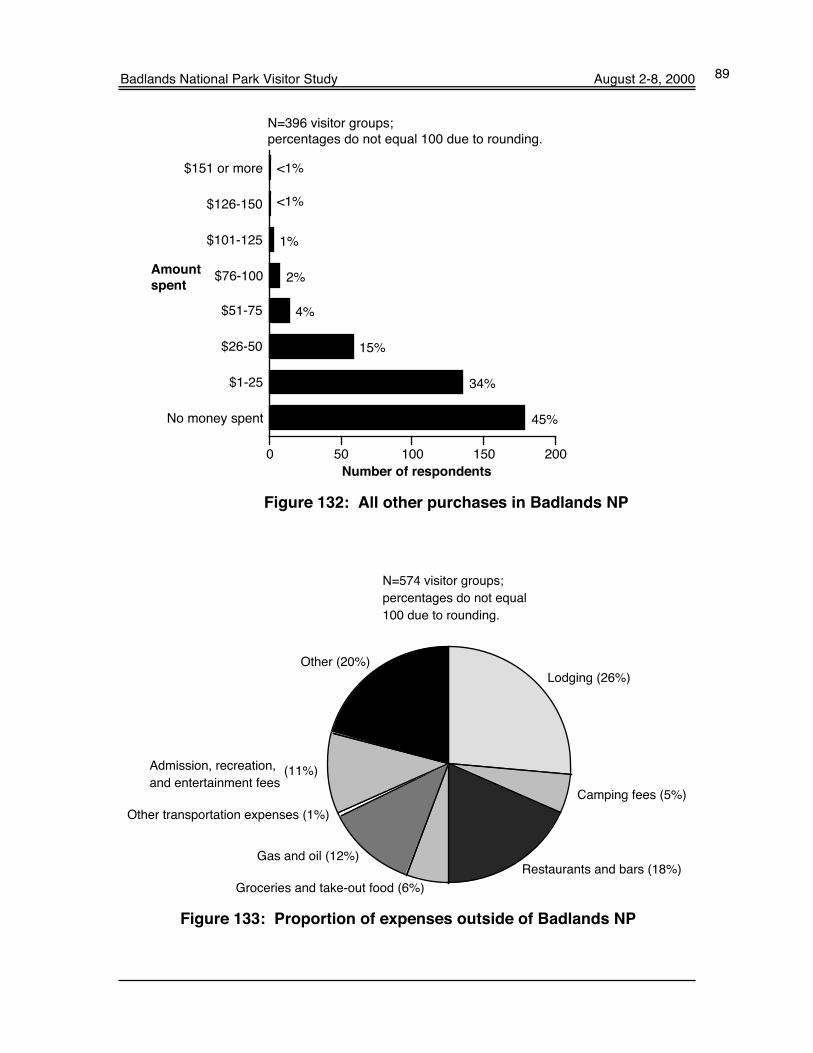
Badlands National Park Visitor Study August 2-8, 2000 89
Figure 132: All other purchases in Badlands NP
Lodging (26%)
Camping fees (5%)
Restaurants and bars (18%)
Groceries and take-out food (6%)
Gas and oil (12%)
Other transportation expenses (1%)
(11%)
Other (20%)
N=574 visitor groups;
percentages do not equal
100 due to rounding.
Admission, recreation,
and entertainment fees
Figure 133: Proportion of expenses outside of Badlands NP
No money spent
$1-25
$26-50
$51-75
$76-100
$101-125
$126-150
$151 or more
0 50 100 150 200
Number of respondents
0%
0%
1%
2%
4%
15%
34%
45%
Amount
spent
N=396 visitor groups;percentages do not equal 100 due to rounding.
<1%
<1%

Badlands National Park Visitor Study August 2-8, 200090
Figure 134: Lodging expenses outside of Badlands NP
Figure 135: Camping fees outside of Badlands NP
No money spent
$1-25
$26-50
$51-75
$76-100
$101-125
$126-150
$151 or more
0 50 100 150 200 250
Number of respondents
2%
1%
1%
2%
2%
8%
14%
72%
Amount
spent
N=316 visitor groups;percentages do not equal 100 due to rounding.
No money spent
$1-25
$26-50
$51-75
$76-100
$101-125
$126-150
$151 or more
0 50 100 150 200 250
Number of respondents
13%
2%
3%
10%
9%
4%
0%
60%
Amount
spent
N=352 visitor groups;percentages do not equal 100 due to rounding.
<1%
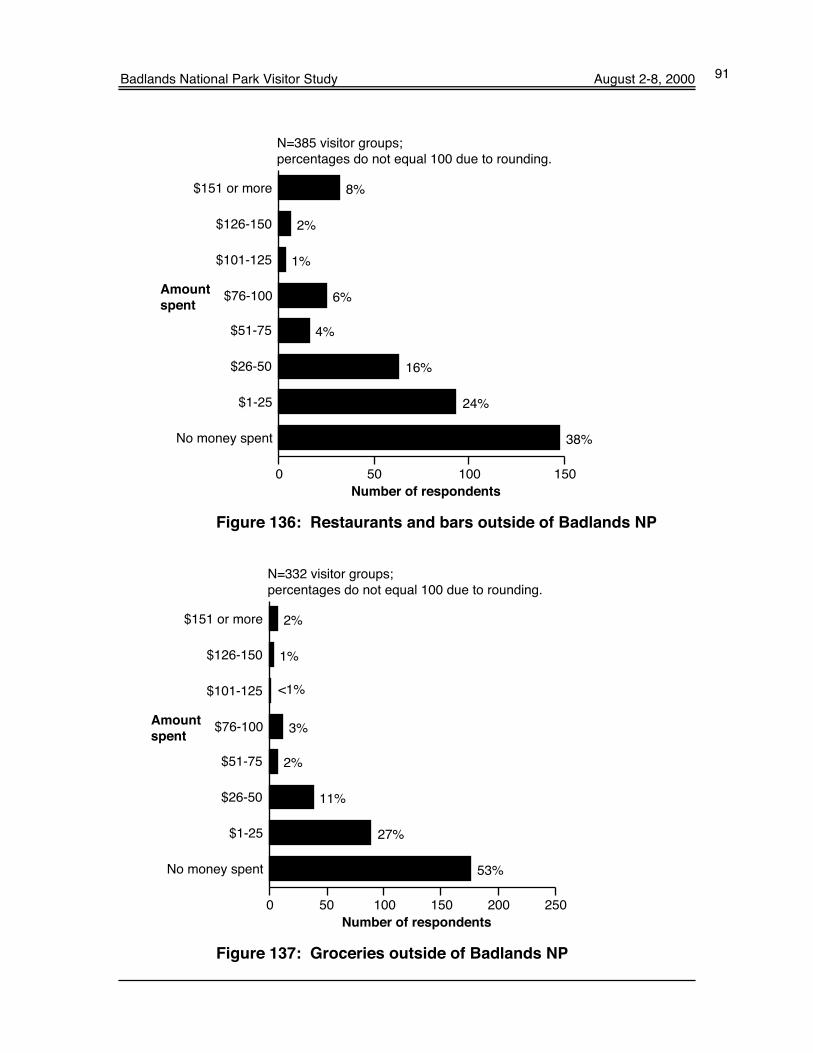
Badlands National Park Visitor Study August 2-8, 2000 91
Figure 136: Restaurants and bars outside of Badlands NP
Figure 137: Groceries outside of Badlands NP
No money spent
$1-25
$26-50
$51-75
$76-100
$101-125
$126-150
$151 or more
0 50 100 150
Number of respondents
8%
2%
1%
6%
4%
16%
24%
38%
Amount
spent
N=385 visitor groups;percentages do not equal 100 due to rounding.
No money spent
$1-25
$26-50
$51-75
$76-100
$101-125
$126-150
$151 or more
0 50 100 150 200 250
Number of respondents
2%
1%
0%
3%
2%
11%
27%
53%
Amount
spent
N=332 visitor groups;percentages do not equal 100 due to rounding.
<1%

Badlands National Park Visitor Study August 2-8, 200092
No money spent
$1-25
$26-50
$51-75
$76-100
$101-125
$126-150
$151 or more
0 50 100 150 200
Number of respondents
4%
1%
1%
4%
2%
19%
39%
30%
Amount
spent
N=392 visitor groups
Figure 138: Gas and oil outside of Badlands NP
Figure 139: Other transportation expenses outside ofBadlands NP
No money spent
$1-25
$26-50
$51-75
$76-100
$101-125
$126-150
$151 or more
0 50 100 150 200 250 300
Number of respondents
0%
0%
0%
0%
0%
1%
1%
96%
Amount
spent
N=267 visitor groups;percentages do not equal 100 due to rounding.
<1%
<1%
<1%

Badlands National Park Visitor Study August 2-8, 2000 93
No money spent
$1-25
$26-50
$51-75
$76-100
$101-125
$126-150
$151 or more
0 50 100 150 200 250
Number of respondents
3%
1%
0%
2%
3%
8%
17%
67%
Amount
spent
N=305 visitor groups;percentages do not equal 100 due to rounding.
Figure 140: Admissions, recreation, and entertainment feesoutside of Badlands NP
Figure 141: All other purchases outside of Badlands NP
No money spent
$1-25
$26-50
$51-75
$76-100
$101-125
$126-150
$151 or more
0 50 100 150 200
Number of respondents
10%
2%
1%
6%
4%
12%
21%
45%
Amount
spent
N=350 visitor groups;percentages do not equal 100 due to rounding.

Badlands National Park Visitor Study August 2-8, 200094
1
2
3
4
5 or more
0 100 200 300 400
Number of respondents
7%
8%
7%
69%
9%
Number of
adults
N=533 visitor groups
Figure 142: Adults covered by expenses
0
1
2
3
4
5 or more
0 25 50 75 100
Number of respondents
4%
6%
16%
34%
22%
18%
Number ofchildren
N=262 visitor groups
Figure 143: Children covered by expenses
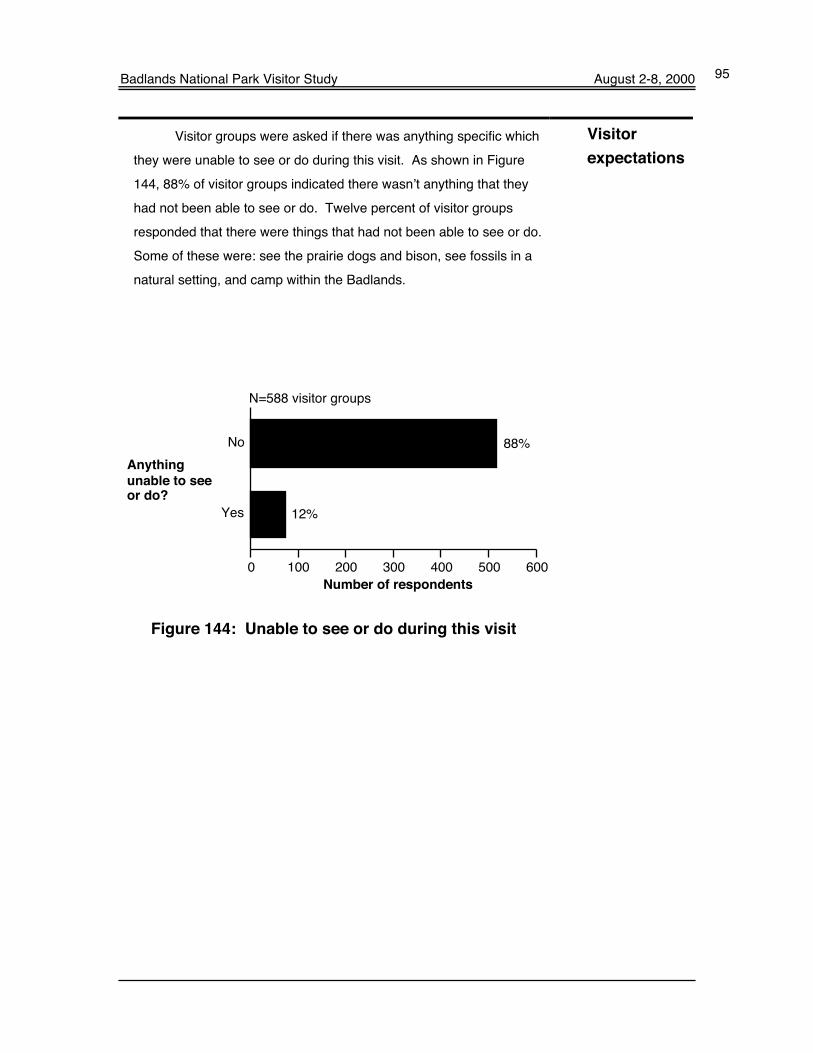
Badlands National Park Visitor Study August 2-8, 2000 95
Visitor groups were asked if there was anything specific which
they were unable to see or do during this visit. As shown in Figure
144, 88% of visitor groups indicated there wasn’t anything that they
had not been able to see or do. Twelve percent of visitor groups
responded that there were things that had not been able to see or do.
Some of these were: see the prairie dogs and bison, see fossils in a
natural setting, and camp within the Badlands.
Visitor
expectations
Yes
No
0 100 200 300 400 500 600
Number of respondents
88%
12%
Anything
unable to seeor do?
N=588 visitor groups
Figure 144: Unable to see or do during this visit

Badlands National Park Visitor Study August 2-8, 200096
Visit again in
the future
Visitor groups were asked if they would visit Badlands NP again
in the future. Eighty percent of visitor groups indicated that they would
likely visit Badlands NP again in the future (see Figure 145).
Not sure
No, unlikely
Yes, likely
0 100 200 300 400 500
Number of respondents
80%
6%
14%
Visitagain?
N=619 visitor groups
Figure 145: Visit again in the future?

Badlands National Park Visitor Study August 2-8, 2000 97
Visitor groups were asked to rate the overall quality of the
visitor services provided at Badlands NP during this visit. Most visitor
groups (94%) rated services as “very good” or “good” (see Figure
146). Less than 1% rated the overall quality of services provided at
Badlands NP as “very poor.”
Overall quality of
visitor services
Figure 146: Overall quality of visitor services
Very poor
Poor
Average
Good
Very good
0 100 200 300 400
Number of respondents
54%
40%
6%
0%
0%
Rating
N=621 visitor groups;percentages do not equal 100 due to rounding.
<1%
<1%

Badlands National Park Visitor Study August 2-8, 200098
Planning for
the future
Visitor groups were asked, “If you were a manager planning
for the future of Badlands National Park, what would you propose?”
Forty-eight percent of visitor groups (304 groups) responded to this
question. A summary of their responses is listed below in Table 15
and complete copies of visitor responses are contained in the
appendix.
Table 15: What visitors like mostN=397 comments;
some visitors made more than one comment.
Number ofComment times mentioned
PERSONNELMore rangers on trails 7Rangers need to be more knowledgeable 3More Native Americans as rangers 2Other comments 2
INTERPRETIVE SERVICESProvide more information 15More Native American exhibits 9Update visitor center 7Improve quality of map/brochure 5More history in the video 5Archeological digs 4Have more ranger-led programs 4Provide more educational signs along road 4Add relevant ecological exhibits 2Have weather warnings 2Provide more information about geology 2Other comments 16

Badlands National Park Visitor Study August 2-8, 2000 99
Number of Comment times mentioned __
FACILITIES/MAINTENANCEConstruct more trails 15Maintain road infrastructure 12Provide more water stations 9Provide more restrooms 8Provide water, electricity, and showers in campgrounds 8Construct more picnic areas 6Poor quality road signs 6Provide more showers 6Update restrooms 6Construct more scenic overlooks 5Construct some bike trails 4Better trails 3Build new visitor center 3Provide better wheelchair/handicapped accessibility 3Provide more trashcans 3Build more hiking trails in South Unit 2Clean the restrooms 2Do not modernize visitor center 2Improve non-paved roads 2Park was clean 2Provide guardrails on more roads 2Provide more campgrounds 2Provide more directional trail signs 2Provide more safety measures 2Other comments 14
POLICIESImplement shuttle system 10Prohibit/have fines for climbing on rocks 9Eliminate helicopter/airplane overflights 7Keep development limited 7Keep people on trails 6Advertise more 4Limit RV access 4Acquire more land 3Have one-day pass available 3Allow biking on trails 2Limit # of visitors per day 2More free camping 2Open up more areas for backpacking 2Other comments 12
RESOURCE MANAGEMENTKeep park natural 37Plant more shade trees 5More visible wildlife 4Motorcycle noise distracting 4Control non-native species 2Do controlled burns in May or June 2Give public notice of prescribed burns 2Other comments 6

Badlands National Park Visitor Study August 2-8, 2000100
Number ofComment times mentioned
CONCESSIONSBuild general store with water and food 3Food available at restricted use areas 2Improve Cedar Pass Lodge 2More lodging in park 2Provide vegetarian meals 2Other comments 4
GENERAL IMPRESSIONSPositive experience 19Satisfactory 3Beautiful 2Other comments 5
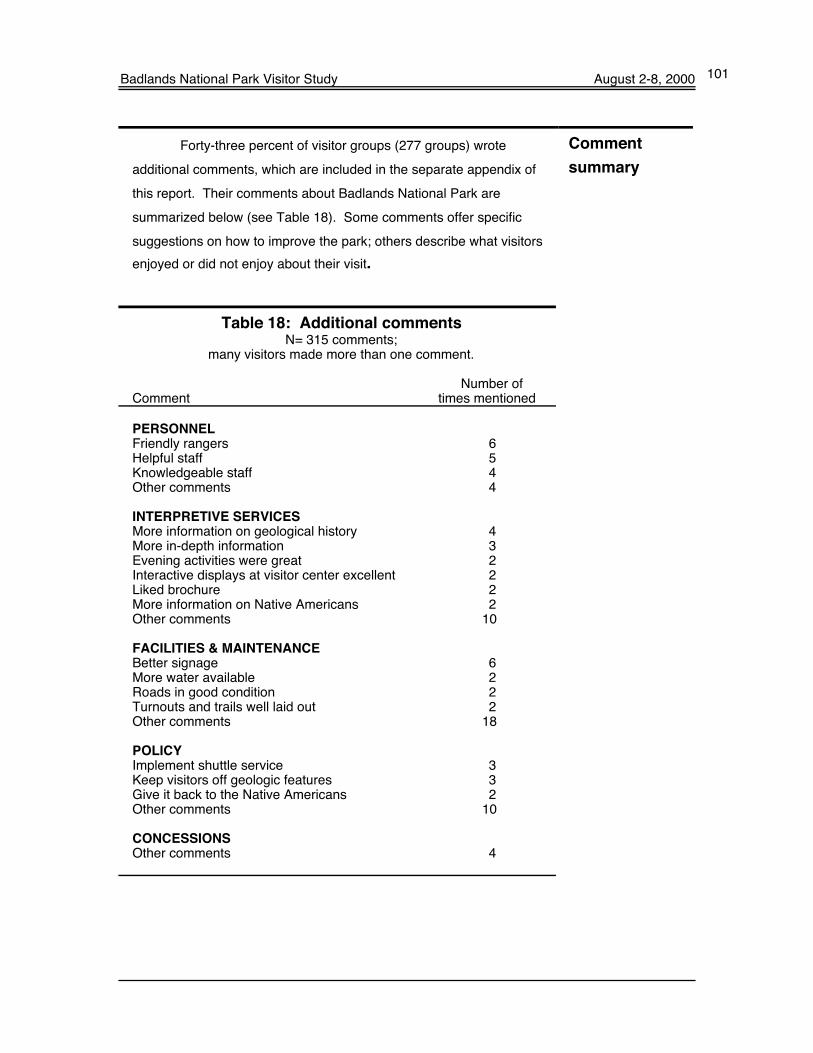
Badlands National Park Visitor Study August 2-8, 2000 101
Forty-three percent of visitor groups (277 groups) wrote
additional comments, which are included in the separate appendix of
this report. Their comments about Badlands National Park are
summarized below (see Table 18). Some comments offer specific
suggestions on how to improve the park; others describe what visitors
enjoyed or did not enjoy about their visit.
Comment
summary
Table 18: Additional commentsN= 315 comments;
many visitors made more than one comment.
Number ofComment times mentioned
PERSONNELFriendly rangers 6Helpful staff 5Knowledgeable staff 4Other comments 4
INTERPRETIVE SERVICESMore information on geological history 4More in-depth information 3Evening activities were great 2Interactive displays at visitor center excellent 2Liked brochure 2More information on Native Americans 2Other comments 10
FACILITIES & MAINTENANCEBetter signage 6More water available 2Roads in good condition 2Turnouts and trails well laid out 2Other comments 18
POLICYImplement shuttle service 3Keep visitors off geologic features 3Give it back to the Native Americans 2Other comments 10
CONCESSIONSOther comments 4

Badlands National Park Visitor Study August 2-8, 2000102
Number ofComment times mentioned
RESOURCE MANAGEMENTMotorcyclists (Sturgis) detracted from experience 7Great place to see wildlife 5Keep natural 5Black-footed ferret project interesting 2Other comments 7
GENERAL IMPRESSIONSPositive experience 91Beautiful 36Will return in the future 19Appreciate National Park Service 15Unique scenery 10Want to spend more time in park 8Enjoyed solitude 4Views challenged the imagination 2Other comments 8