Bacterial, Archaeal, and Fungal Diversity of Spacecraft
24
The work was carried out at the Jet Propulsion Laboratory, California Institute of Technology, under a contract with the National Aeronautics and Space Administration. Copyright 2012 California Institute of Technology. Government sponsorship acknowledged Presentation to the COSPAR-2012, Mysore, India Presenter: Kasthuri Venkateswaran Myron T. La Duc and Parag Vaishampayan Biotechnology and Planetary Protection Group Jet Propulsion Laboratory, Pasadena, CA 91109 Contact information: [email protected] Bacterial, Archaeal, and Fungal Diversity of Spacecraft-Associated Surfaces
Transcript of Bacterial, Archaeal, and Fungal Diversity of Spacecraft

The work was carried out at the Jet Propulsion Laboratory, California Institute of Technology, under a contract with the National Aeronautics and Space Administration. Copyright 2012 California Institute of Technology. Government sponsorship acknowledged
Presentation to the COSPAR-2012, Mysore, India
Presenter: Kasthuri VenkateswaranMyron T. La Duc and Parag Vaishampayan
Biotechnology and Planetary Protection GroupJet Propulsion Laboratory, Pasadena, CA 91109
Contact information: [email protected]
Bacterial, Archaeal, and Fungal Diversity of Spacecraft-Associated
Surfaces

Outline of the presentation
• Status and Objectives• Molecular microbial community analyses:
– Cloning – Sanger Sequencing– DNA Microarray (PhyloChip)– 454 Tag-encoded Pyrosequencing
• Demonstration of the state-of-the-art technologies to catalogue a DNA-based genetic inventory of low biomass surfaces– Spacecraft assembly facility surfaces– Spacecraft surfaces– PhyloChip and 454 Tag-encoded Pyrosequencing
2

Status and Objectives
• Under the auspices of the Mars Program-funded Genetic Inventory task to develop and end-to-end genetic inventory capability for spacecraft, we have:
– Demonstrated use of the PhyloChip DNA microarray to conduct a comprehensive census of the bacterial communities on the surfaces in three NASA spacecraft assembly cleanrooms (SAC) supporting two distinct missions (Phoenix and MSL).
• Presented in COSPAR 2010– Observed that the maximum diversity of resident bacterial DNA was uncovered by subjecting subsamples
from each cleanroom sampling to both PhlyoChip and conventional cloning/Sanger sequencing of 16S rRNAgenes.
• La Duc, M. T., S. Osman, P. Vaishampayan, Y. Piceno, G. Andersen, J. A. Spry, and K. Venkateswaran. 2009. Comprehensive census of bacteria in clean rooms by using DNA microarray and cloning methods. App. Env. Microbiol. 75:6559-6567.
– Demonstrated molecular methods to catalogue genetic inventories of all three microbial domains (bacterial, archaeal, and fungal [Eukarya]) associated with the Mars Science Laboratory (MSL) spacecraft and associated environmental samples.
• PhyloChip (bacteria only, and not discussed here)• 454 tag-encoded pyrosequencing (bacteria, archaea, and fungi)
3
DNA based technologies detect live and dead cells Establishing a link to “PP risk” of terrestrial contamination is future work

Spacecraft Assembly Environmental Samples
• Over a period of 3 years (‘09 to ‘11), 71 individual surface samples associated with various rooms were collected, including floor samples from spacecraft assembly cleanrooms (JPL-SAF, JPL Building 144), an ordinary room adjacent to JPL-SAF, and a non-NASA cleanroom.– Group I (8 sets; 33 samples) samples examined the effect of varying
cleanroom certification on resulting DNA data. • This group consisted of floor and GSE samples from JPL-SAF, an
ordinary room adjacent to JPL-SAF, and a non-NASA cleanroom. – Group II samples (4 sets; 38 samples) were collected to assess the
impact of cleaning procedures on resulting DNA data. • This group comprised floor and GSE samples gathered from the
JPL-144 facility that was expected to receive spacecraft hardware both (a) prior to cleaning, and (b) from identical locations one day after cleaning.
4La Duc, M. T., P. Vaishampayan, H. Nilsson, T. Torok, and K. Venkateswaran. 2012. Pyrosequencing-derived bacterial, archaeal, and fungal diversity of spacecraft hardware destined for Mars. Applied and environmental microbiology 78: in press.
MSL Spacecraft Surface Samples
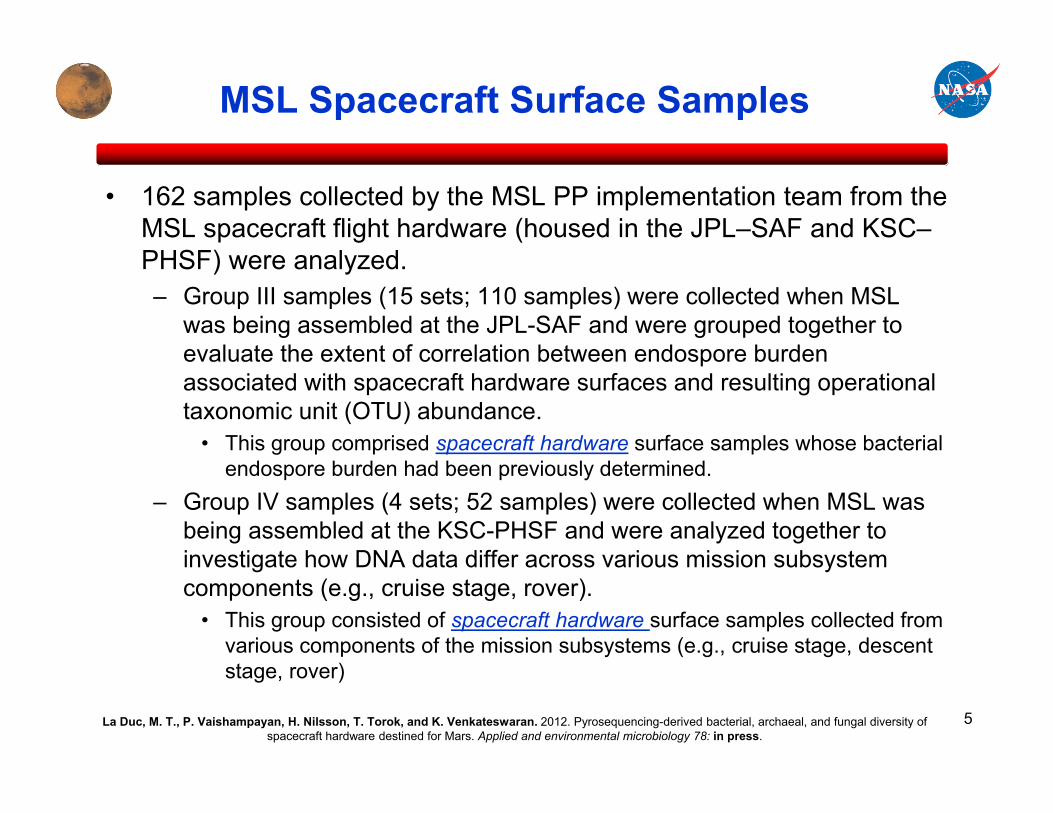
• 162 samples collected by the MSL PP implementation team from the MSL spacecraft flight hardware (housed in the JPL–SAF and KSC–PHSF) were analyzed.– Group III samples (15 sets; 110 samples) were collected when MSL
was being assembled at the JPL-SAF and were grouped together to evaluate the extent of correlation between endospore burden associated with spacecraft hardware surfaces and resulting operational taxonomic unit (OTU) abundance.
• This group comprised spacecraft hardware surface samples whose bacterial endospore burden had been previously determined.
– Group IV samples (4 sets; 52 samples) were collected when MSL was being assembled at the KSC-PHSF and were analyzed together to investigate how DNA data differ across various mission subsystem components (e.g., cruise stage, rover).
• This group consisted of spacecraft hardware surface samples collected from various components of the mission subsystems (e.g., cruise stage, descent stage, rover)
5La Duc, M. T., P. Vaishampayan, H. Nilsson, T. Torok, and K. Venkateswaran. 2012. Pyrosequencing-derived bacterial, archaeal, and fungal diversity of spacecraft hardware destined for Mars. Applied and environmental microbiology 78: in press.

iTOL tree (Bacterial pyrosequences >350-bp)
proteobacteria
JPL‐SAF cleanroom floorJPL‐SAF GSEMSL spacecraft surfaces
Interactive Tree Of Life (iTOL) is an online tool for the display and manipulation of phylogenetic trees. It provides most of the features available in other tree viewers, and offers a novel circular tree layout, which makes it easy to visualize mid-sized trees (up to several thousand leaves).

Actin
obacteria
proteo
bacteria
Firmicutes
proteobacteria
Pyrosequ
ence
diversity
of various bacteria
l gen
era
onflo
or,G
SE, and
MSL sp
acecraftsurfaces

0
100
200
300
400
500
600
1
200
400
600
800
1000
1200
1400
1600
1800
2000
2200
2400
2600
2800
3000
3200
3400
3600
3800
4000
4200
4400
4600
Coverage=0.978; Floor (10 m2)
Coverage=0.987; Spacecraft (162 m2)
Coverage=0.963; GSE (10 m2)
Num
ber o
f OTU
observed (at 0
.03 level)
Rarefaction curves based on bacterial pyrosequences
Number of pyrosequences (>350‐bp length)
• Rarefaction curves are produced by plotting the number of OTU observed against the number of pyrosequences screened.
• Coverage was calculated using the equation: C= [1-(n1/N)]*100, where n1 is the number of OTU’s appearing only once in the sample, and N is the total number of pyrosequences examined.

Spacecraft
GSE
Floor
CorynebacteriumModestobacterArthrobacterPropionibacteriumStaphylococcus‐1Staphylococcus‐2BrevundimonasBlastobacterMethylobacterium‐1Methylobacterium‐2RubellimicrobiumUnclassified‐1Unclassified‐2EscherichiaAcinetobacter‐1Acinetobacter‐2Acinetobacter‐3PseudomonasUnclassified
prot
eop
rote
oAc
tinob
acte
ria
Overlapping bacterial genera among floor, GSE, and MSL spacecraft surfaces (pyrosequence – based analysis)
Previously reported to survive in conditions: Desiccation, UV, gamma radiation

Bacterial TaxaJPL‐144 Floor JPL‐144 GSEBefore (#155)
After (159)
Before (#157)
After (#161)
Actinobacteria 51 3 186 30Armatimonadetes 3 1Bacteroidetes 39 4 75 22Chlorobi 1Verrucomicrobia 4 2Chloroflexi 8Deinococcus‐Thermus 5 15 3Acidobacteria 1 5 1Firmicutes 10 33 2Fusobacteria 2Gemmatimonadetes 3 2 1Nitrospirae 1 1Planctomycetes 2 2 1Proteobacteria
Alpha 233 38 188 22Beta 48 7 61 23Delta 3 3Gamma 76 12 40 16Unidentified 4 3
Unidentified divisionSC4 3WPS‐2 2
Unclassified bacteria 28 33 15Total # of OTU 513 66 662 136
Impact of cleaning procedures on pyrosequencing profiles
Floor
GSE

Archaeal pyrosequences from cleanroom and spacecraft surfaces
La Duc, M. T., P. Vaishampayan, H. Nilsson, T. Torok, and K. Venkateswaran. 2012. Pyrosequencing-derived bacterial, archaeal, and fungal diversity of spacecraft hardware destined for Mars. Applied and environmental microbiology 78: in press.

La Duc, M. T., P. Vaishampayan, H. Nilsson, T. Torok, and K. Venkateswaran. 2012. Pyrosequencing-derived bacterial, archaeal, and fungal diversity of spacecraft hardware destined for Mars. Applied and environmental microbiology 78: in press.
Comparison of pyrosequence data for fungal OTU on floor,GSE, and MSL spacecraft surfaces

• Spacecraft hardware and spacecraft assembly cleanroom (SAC) surfaces (233 m2 in total) were sampled, total genomic DNA was extracted, hypervariable regions of the 16S rRNA gene (bacteria and archaea) and ribosomal ITS region (fungi) were subjected to 454 tag‐encoded pyrosequencingPCR amplified, and 203,852 resulting high quality long read sequences were analyzed.
• Bioinformatic analyses revealed correlations between operational taxonomic unit (OTU) abundance and certain sample characteristics, such as source (cleanroom floor, ground support equipment [GSE], or spacecraft hardware), cleaning regimen applied, and location about the facility or spacecraft.
• NASA cleanroom floor and GSE surfaces gave rise to more diverse bacterial signatures (619 OTU; 20 m2) than co‐located spacecraft hardware (187 OTU; 162 m2).
• In contrast to the results of bacterial pyrosequencing, where sequences were generated from each of the 31 sample sets examined, archaeal and fungal sequences were detected in only 13 and 18 of these sample sets, respectively.
• As was the case for bacteria, the occurrence of fungal OTU signatures in the GSE surface samples dramatically diminished (9‐times less diversity) once cleaning protocols had been applied.
• The presence of OTUs from actinobacteria, deinococci, acidobacteria, firmicutes, and proteobacteria on spacecraft surfaces suggests that certain bacterial lineages persist in clean environments even following rigorous quality control and cleaning practices.
• The majority of bacterial OTU observed as being recurrent belonged to actinobacteria and alpha‐proteobacteria, supporting the hypothesis that the cleanliness measures applied in SACs may inadvertently provide selective pressure for organisms which may be the most fit to survive interplanetary space.
Summary
La Duc, M. T., P. Vaishampayan, H. Nilsson, T. Torok, and K. Venkateswaran. 2012. Pyrosequencing-derived bacterial, archaeal, and fungal diversity of spacecraft hardware destined for Mars. Applied and environmental microbiology 78: in press.

14
Nick
Myron Parag
Christine
Kelly
Gary$$$: Mars Program Office, JPL
Dr. Karen Buxbaum – JPLDr. Andy Spry – JPL
14K. Venkateswaran, JPL-Caltech
The TeamAlex
Henrik Tamas

Backup slides

Spacecraft Assembly Environments – 1
• Over a period of 18 months (‘07 to ‘09), 107 individual surface samples were collected from: – Kennedy Space Center Payload Hazardous Servicing Facility (KSC-
PHSF)– Lockheed Martin Aeronautics Multiple Testing Facility (LMA-MTF)– Jet Propulsion Laboratory Spacecraft Assembly Facility (JPL-SAF)
• Categorization of the samples– Category A: 37 samples collected in the presence of Phoenix spacecraft
hardware.– Category B: 30 samples collected within cleanrooms devoid of
spacecraft.– Category C: 40 samples collected from JPL-SAF during the assembly of
the MSL spacecraft.
16La Duc, M. T., S. Osman, P. Vaishampayan, Y. Piceno, G. Andersen, J. A. Spry, and K. Venkateswaran. 2009. Comprehensive census of bacteria in clean rooms
by using DNA microarray and cloning methods. Applied and environmental microbiology 75:6559-6567.

PhyloChip vs Clone Libraries
• Phylochips detected OTU from a total of 140 classified bacterial families, 46 of which were also detected by clone libraries.
• Four bacterial families were detected in clones but not chips: Brevibacteriaceae, Isosphaerae, Hydrogenophilaceae, and Fusobacteriaceae.
• Majority of clone OTU belonged to the Firmicutes, Proteobacteria and Actinobacteria.
PhyloChip vs Cloning
La Duc, M. T., S. Osman, P. Vaishampayan, Y. Piceno, G. Andersen, J. A. Spry, and K. Venkateswaran. 2009. Comprehensive census of bacteria in clean rooms by using DNA microarray and cloning methods. Applied and environmental microbiology 75:6559-6567.

-3000
-2000
-1000
0
1000
2000
3000
4000
5000
Shift in bacterial (OTU) population when JPL-SAF (MSL) was compared to KSC-PHSF (Phoenix) during
the spacecraft assembly
Act
inob
acte
ria
Bra
dyrh
izob
ium
Bac
illus
Brevindimonas
-proteo -proteo
Phx(597) MSL
(44)Common
(947)
-proteo
Mol
licut
es
-pr
oteo
Stre
ptoc
occu
s
Clo
strid
ia
-pr
oteo
Phyl
oChi
p-pr
obe
hybr
idiz
atio
n in
tens
ityIdentified Differences Between Spacecraft
Assembly Facilities
La Duc, M. T., S. Osman, P. Vaishampayan, Y. Piceno, G. Andersen, J. A. Spry, and K. Venkateswaran. 2009. Comprehensive census of bacteria in clean rooms by using DNA microarray and cloning methods. Applied and environmental microbiology 75:6559-6567.

Sample (total area sampled) Sample ID Sampling devices Sample type Area (m2) Mission Cleanroom type Description
Group I: Cleanroom types (33 m2)GI-37 150 BisKit Floor-70A 10 None Non-NASA Cleanroom Non-NASA cleanroom (LBNL; #70A)GI-35-6 143 BisKit Entrance floor 1 None Ordinary room Ordinary room adjacent to JPL-SAFGI-35-4 141 BisKit Shoe Cleaner 1 None Ordinary room Ordinary room adjacent to JPL-SAFGI-35-7 144 BisKit Floor 1 1 None Ordinary room Ordinary room adjacent to JPL-SAFGI-35-8 145 BisKit Floor 2 1 None Ordinary room Ordinary room adjacent to JPL-SAFGI-35-5 142 BisKit Air-lock 1 None Ordinary room Ordinary room adjacent to JPL-SAFGI-36-3 146 BisKit JPL-SAF GSE 9 Mars Class 100K During spacecraft assembly (JPL-SAF)GI-36-4 148 BisKit JPL-SAF Floor 9 Mars Class 100K During spacecraft assembly (JPL-SAF)
Group II: Cleaning vs prior to cleaning (38 m2)
GI-42-1 155 BisKit Floor 9 None Class 100K JPL-144 cleanroom prior to cleaningGI-42-2 157 BisKit GSE 9 None Class 100K JPL-144 cleanroom prior to cleaningGI-43-1 159 Polyester wipe Floor 10 Mars Class 100K JPL-144 cleanroom after cleaningGI-43-2 161 Polyester wipe GSE 10 Mars Class 100K JPL-144 cleanroom after cleaning
Group III: Spacecraft surfaces [(spore count-based) (110 m2)]
GI-16 124 Polyester wipe spacecraft 6 Mars Class 100K No spore countGI-17 125 Polyester wipe spacecraft 10 Mars Class 100K No spore countGI-25 133 Polyester wipe spacecraft 8 Mars Class 100K No spore countGI-26 134 Polyester wipe spacecraft 7 Mars Class 100K No spore countGI-27 135 Polyester wipe spacecraft 4 Mars Class 100K No spore countGI-28 136 Polyester wipe spacecraft 6 Mars Class 100K No spore countGI-29 137 Polyester wipe spacecraft 18 Mars Class 100K No spore countGI-18 126 Polyester wipe spacecraft 10 Mars Class 100K 1 to 5 spore per m2GI-19 127 Polyester wipe spacecraft 14 Mars Class 100K 1 to 5 spore per m2GI-20 128 Polyester wipe spacecraft 5 Mars Class 100K 1 to 5 spore per m2GI-21 129 Polyester wipe spacecraft 4 Mars Class 100K 1 to 5 spore per m2GI-22 130 Polyester wipe spacecraft 1 Mars Class 100K 1 to 5 spore per m2GI-30 138 Polyester wipe spacecraft 13 Mars Class 100K 1 to 5 spore per m2GI-32 140 Polyester wipe spacecraft 3 Mars Class 100K 5 to 10 spore per m2GI-24 132 Polyester wipe spacecraft 1 Mars Class 100K 300 spores per m2
Group IV: Spacecraft surfaces [(mission component-based) (52 m2)]GI-38 151 Polyester wipe spacecraft 26 Mars Class 100K Cruise stage (0.2 spores per m2)GI-39 152 Polyester wipe spacecraft 9 Mars Class 100K Descent stage (0.4 spores per m2)GI-40 153 Polyester wipe spacecraft 16 Mars Class 100K Rover (0.3 spores per m2)GI-41 154 Polyester wipe spacecraft 1 None Class 100K Non-flight samples (14 spores per m2)
JPL-SAF: Jet Propulsion Laboratory Spacecraft Assembly FacilityLBNL: Lawrence Berkeley National Laboratory

Non-metric multidimensional scaling to display the relatedness of various samples based on PhyloChip taxonomy
• The relatedness in presence/absence ordination analysis explains the microbial richness (number of different PTU per sample) and number of common PTU between samples at the same time.
• A curve fitting model was used to display the relation of microbial richness measure on genus level with the environmental clustering method.
• GI-36-3 (GSE) having the highest microbial richness placed somewhat apart from spacecraft samples.
• GI-36-4 (Floor) was more related to spacecraft samples GI-20, GI-21, and GI-29.
• Many spacecraft samples (7 out of 19) clustered close to sample GI-19, which was the center of these samples.
• However, 7 of 19 spacecraft samples had less than 20 different genera and were spread apart from each other (left side of NMDS), which indicates that they had only few taxa in common.
Red: FloorGreen: GSEBlue: Spacecraft
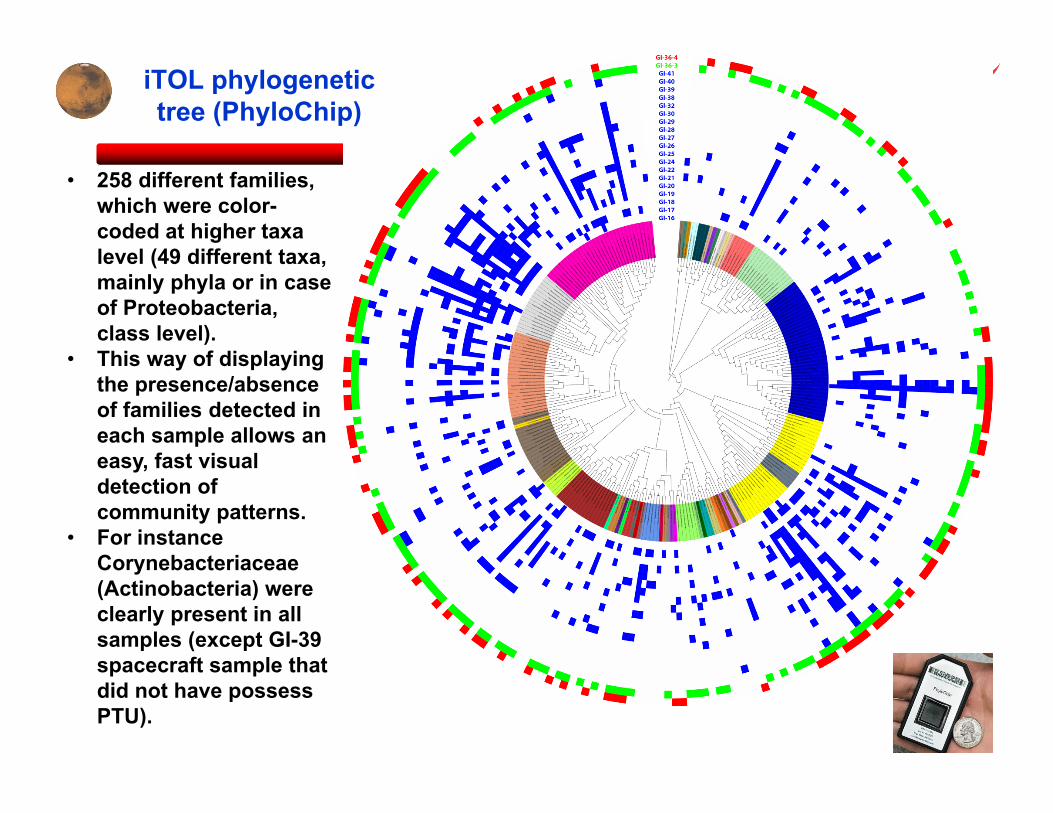
• 258 different families, which were color-coded at higher taxa level (49 different taxa, mainly phyla or in case of Proteobacteria, class level).
• This way of displaying the presence/absence of families detected in each sample allows an easy, fast visual detection of community patterns.
• For instance Corynebacteriaceae (Actinobacteria) were clearly present in all samples (except GI-39 spacecraft sample that did not have possess PTU).
iTOL phylogenetic tree (PhyloChip)

The work was carried out at the Jet Propulsion Laboratory, California Institute of Technology, under a contract with the National Aeronautics and Space Administration. Copyright 2012 California Institute of Technology. Government sponsorship acknowledged
Persistent bacterial genera pyrosequences onfloor, GSE, and MSL spacecraft surfaces

Cut set microbiome on genus level – alphabetical orderAcidobacteria; Candidatus Solibacter Bacteroidetes; Prevotella Fibrobacteres; Fibrobacter
Acidobacteria; unclassified Acidobacteriaceae Bacteroidetes; unclassified Chitinophagaceae Firmicutes; Anaerococcus
Actinobacteria; Arthrobacter Bacteroidetes; unclassified Flavobacteriaceae Firmicutes; Bacillus
Actinobacteria; Corynebacterium Bacteroidetes; unclassified Flexibacteraceae Firmicutes; Blautia
Actinobacteria; Cryobacterium Bacteroidetes; unclassified RikenellaceaeII Firmicutes; Clostridium
Actinobacteria; Kocuria Betaproteobacteria; Achromobacter Firmicutes; Enterococcus
Actinobacteria; Mycobacterium Betaproteobacteria; Aquabacterium Firmicutes; Faecalibacterium
Actinobacteria; Propionibacterium Betaproteobacteria; Burkholderia Firmicutes; Lactobacillus
Actinobacteria; Rhodococcus Betaproteobacteria; Diaphorobacter Firmicutes; Paenibacillus
Actinobacteria; unclassified Corynebacteriaceae Betaproteobacteria; Massilia Firmicutes; Pseudobutyrivibrio
Actinobacteria; unclassified Microbacteriaceae Betaproteobacteria; Methylibium Firmicutes; Roseburia
Alphaproteobacteria; Azospirillum Betaproteobacteria; Ralstonia Firmicutes; Ruminococcus
Alphaproteobacteria; Bradyrhizobium Betaproteobacteria; Rhodocyclus Firmicutes; Staphylococcus
Alphaproteobacteria; Brevundimonas Betaproteobacteria; Simplicispira Firmicutes; Streptococcus
Alphaproteobacteria; Candidatus Pelagibacter Betaproteobacteria; Thiomonas Firmicutes; unclassified Lachnospiraceae
Alphaproteobacteria; Methylobacterium Betaproteobacteria; unclassified Comamonadaceae Firmicutes; unclassified Ruminococcaceae
Alphaproteobacteria; Novosphingobium Betaproteobacteria; unclassified Neisseriaceae Gammaproteobacteria; Acinetobacter
Alphaproteobacteria; Paracoccus Betaproteobacteria; unclassified Nitrosomonadaceae Gammaproteobacteria; Pantoea
Alphaproteobacteria; Rhizobium Betaproteobacteria; unclassified Oxalobacteraceae Gammaproteobacteria; Pseudoalteromonas
Alphaproteobacteria; Skermanella Chloroflexi; unclassified Gammaproteobacteria; Pseudomonas
Alphaproteobacteria; Sphingobium Chloroflexi; unclassified A4b Gammaproteobacteria; unclassified Enterobacteriaceae
Alphaproteobacteria; Sphingomonas Cyanobacteria; Streptophyta Nitrospirae; Leptospirillum
Alphaproteobacteria; unclassified Bradyrhizobiaceae Cyanobacteria; Synechococcus OP3; unclassified
Alphaproteobacteria; unclassified Caulobacteraceae Deltaproteobacteria; unclassified Planctomycetes; unclassified Isosphaeraceae
Alphaproteobacteria; unclassified Erythrobacteraceae Deltaproteobacteria; unclassified Haliangiaceae Planctomycetes; unclassified Planctomycetaceae
Alphaproteobacteria; unclassified Phyllobacteriaceae Deltaproteobacteria; unclassified Syntrophaceae
Alphaproteobacteria; unclassified Rhodospirillaceae Epsilonproteobacteria; Arcobacter
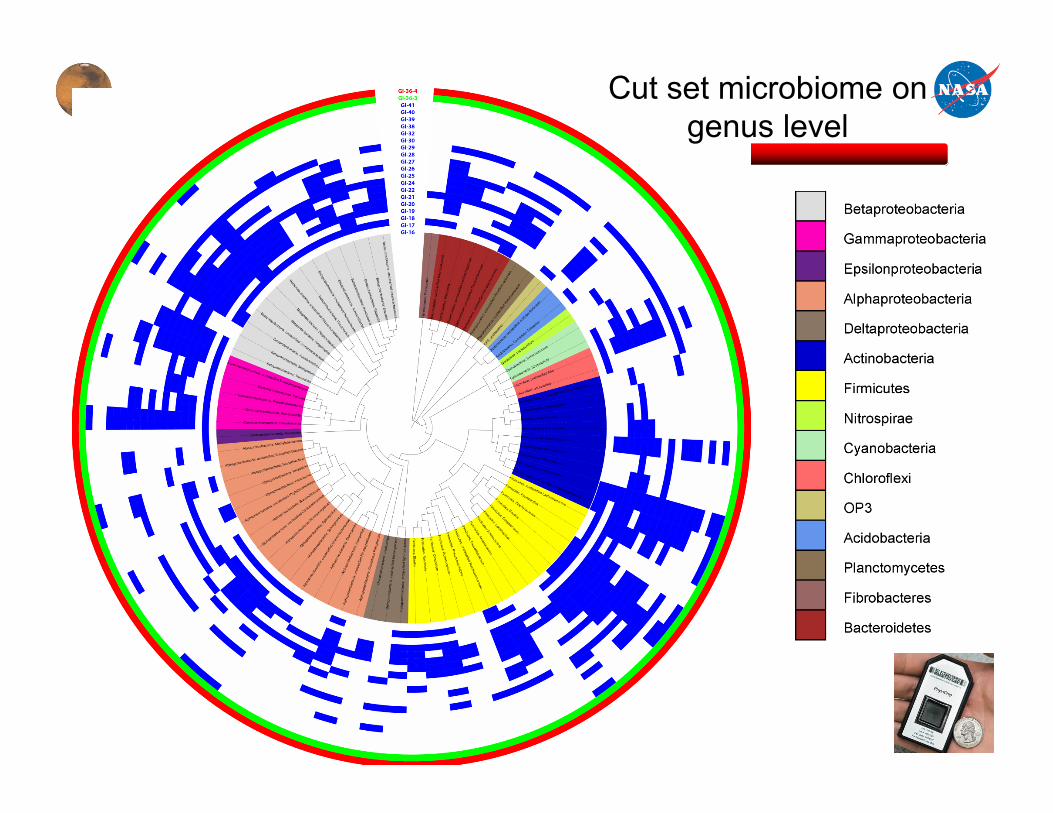
Cut set microbiome on genus level