Background · Web viewThe overall objective of the broadband investment survey is to inform...
62
European Bank for Reconstruction and Development Legal Transition Team Assessment of Investment Climate – Broadband Infrastructure Terms of reference Conduct and reporting of survey
Transcript of Background · Web viewThe overall objective of the broadband investment survey is to inform...
European Bank for Reconstruction and DevelopmentLegal Transition Team
Assessment of Investment Climate – Broadband Infrastructure
Terms of referenceConduct and reporting of survey
February 2019
1. Background
The Bank has carried out regular (in 2008, 2012 and 2016) assessments of the electronic communications sector in its countries of operation1. These assessments have focused on the overall potential of the sector for reforms that could improve the overall investment climate in the sector, in particular to improve the infrastructures for delivering modern broadband services. The previous assessment approach used by EBRD has been to study key characteristics of the market, in terms of output metrics (for example broadband penetration, eGovernment and eCommerce world rankings) alongside a comparison between the legal and regulatory framework and best practice in the sector. The methodology relied on building an accurate picture from the outputs of the sector itself alongside on the policy, legal and regulatory environment for investors, service providers and consumers.
An alternative approach to the assessment of broadband investment markets in EBRD countries is now proposed, one in which the informed views of investors has the most impact. The approach will be based on the immediate concerns in terms of which factors in each country that contribute most to an investor’s decision on whether to invest or not. The proposed survey will be designed to identify the countries that have the most attractive policies for encouraging investment, particularly for broadband infrastructure and connectivity. The proposed survey outputs, in the form of a ranking of investment attractiveness and listing of the key risk factors, should prompt policy makers to consider reforms that would improve their ranking.
In 2017/8, EBRD retained a consulting advisor to assist with the development of this assessment work. The requirements for the survey and analysis methodology have now been defined. The work already done includes the following items which will be needed to carry out the full survey:
A clear definition of the survey methodology, including objectives and target respondents Definitions of the required calculations, indexes and rankings The requirements for the survey output report An on-line questionnaire model
EBRD now wishes to engage a specialist firm (the “Consultant”) to conduct the full broadband investment assessment in accordance with the requirements already defined.
2. Overall objectives for survey, analysis and assessment of the sector
The overall objective of the broadband investment survey is to inform investors, policy makers, regulatory and other influencers of sector investment so that they can make better decisions that will increase effectiveness in telecommunications sector investments and in particular to improve broadband infrastructure coverage and capacity.
EBRD wishes to survey as many existing and potential investors as possible in broadband infrastructures and services. These investors will include finance providers, telecommunications network operators, broadband and internet service providers and other interested analysts and market stakeholders.
The specific objectives of the proposed survey, analysis and assessment are;
1 See http://www.ebrd.com/where-we-are.html

To produce a “Broadband Infrastructure Investment Attractiveness Index” plus relevant sub-indexes, that will inform policy makers and market participants, based on the perceptions of investors;
To provide a focus on the key enablers to investment in order to assist EBRD in engagement with policy makers and market participants to increase investment in the sector.
The main output of the survey, analysis and assessment will be a ranking of countries, based on their investment attractiveness, with further explanations for each country giving the main reasons expressed by investors that have led to the index and ranking calculated. The survey methodology, analysis, index calculations and output formats have already been defined – the consultant will be provided with a copy of these.
3. Objective of the consultant
The objective of the Consultant is to organise and carry out the required survey and to prepare a report detailing the survey findings. The Consultant’s final report must be prepared and presented to EBRD, containing the results and conclusions required to meet EBRD’s defined objectives (see paragraph 2 above). 4. Scope of the work and tasks of the consultant
The full scope of the work includes the identification of survey respondents, contacting these respondents and facilitating the completion of an on-line questionnaire, plus follow-up work to analyse and clarify the survey results, where necessary in face-to-face contact with key respondents principally among the investment community across a wide range of countries where EBRD operates. The following tasks will be carried out by the Consultant;
4.1 Preparation work for the survey
4.1.1 The Consultant will attend a detailed briefing and discussion with the Bank, to ensure that the Consultant is fully familiar with the requirements of the survey, including the details defined in Appendix 1. At these discussions, the Bank will welcome any suggestions to improve the survey process or survey model. Where there are any changes to the methodology defined in Appendix 1, the Bank will reissue the document as an updated part of this Terms of Reference. The Consultant will discuss with EBRD and agree the final list of countries that will be studied in the survey. The preliminary list of countries includes;
Southern and eastern Mediterranean region (Egypt, Jordan, Lebanon, Morocco, Tunisia)
South-eastern Europe (Albania, Bosnia-Herzegovina, Croatia, FYR Macedonia, Kosovo, Montenegro, Serbia)
Eastern Europe and the Caucasus (Armenia, Azerbaijan, Belarus, Georgia, Moldova, Ukraine)
Central Asia (Kazakhstan, Kyrgyz Republic, Mongolia, Uzbekistan)
4.1.2 The Consultant will discuss and agree with EBRD a list of at least 5 countries for an initial (pilot) round of visits. The purpose of these initial visits is to ensure that all the survey processes are fully tested before proceeding to the remaining countries.
4.1.3 The Consultant will prepare a detailed plan for the visits to these pilot countries (‘Pilot
Plan’), which will include;
a) The proposed dates for the initial visits;b) The proposed list of companies/ organisations to contact prior to the visits to
organise face-to-face meetings. The list should contain companies that are potential respondents to the survey, plus government policy and regulatory organisations that need to be aware of the purpose of the survey and its potential for influencing the forward development of the sector;
The list of companies should include as many participants in the sector as possible in each country. Respondents should be grouped into the following ‘respondent categories’:
a) incumbent operators and foreign operators already in the market; b) new domestic market entrants;c) third parties and key shareholders including other infrastructure utilities whose
networks could be exploited (or already are being exploited) for broadband services, plus;
d) representatives of government and private sector owners;e) domestic and foreign banks and other financial institutions that are already
supporting, or could potentially support broadband infrastructure and services investments; and,
f) sector analysts and consultants with knowledge of the sector;
The primary source of potential respondents’ contact addresses will be from databases held by each country’s ministries and regulatory agencies (lists of telecoms companies, internet eservice providers, infrastructure providers), plus trade associations in the broadband infrastructures and services sector and finance sectors. The Consultant should make a thorough search of the networks and service providers’ websites to determine their role in the sector and select those companies and organisations that would be expected to make the most contribution to the survey in terms of their awareness of the investment conditions in each country;
A minimum of 16 organisations will be targeted as primary respondents per country, with a further twenty 16 to be targeted as secondary respondents. Primary respondents are those organisations which will be met face-to-face and secondary respondents are those which will be addressed online/remotely;
There should be at least four primary respondent organisations and four secondary organisations targeted in response category (a), and at least three primary respondent organisations and three secondary organisations targeted in response categories (b) to (e). The primary respondents are expected to comprise larger organisations;
The Consultant will identify the specific function of the officials to be addressed as respondents. The function level of targeted respondents will be broadly comparable (i.e. senior management) and will be those officials who should have a broad view of the overall investment climate, and expected to be knowledgeable respondents on the topics covered by the survey. In the first instance, the Consultant will aim for the CEO as the primary targeted respondent, though in larger organisations, an appropriate respondent might be vice-president/deputy CEO, head of legal/regulatory affairs, CFO. In some organisations, it may be necessary to target more than one respondent to achieve a sufficiently clear view;

A preliminary timetable for the visits.
4.1.4 The detailed visit plans prepared by the Consultant (one plan for each pilot country) will be proposed to the Bank for approval before proceeding to the actual organisation of the visits.
4.1.5 The Consultant will hold discussions with EBRD, which will result in an agreed approach for the Consultant to organise the meetings within each country. In some cases, where determined by EBRD, the Resident Office of the EBRD in a country will be actively involved in organising some or all of the meetings. In other cases, the Consultant must make the arrangements themselves, keeping EBRD informed so that EBRD staff can attend the meetings, as required by EBRD. At the end of these discussions, the Consultant will proceed with the organisation of each initial country visit according to the approach agreed with the Bank;
4.1.6 The Consultant will ensure that the on-line questionnaire model already developed for the survey is ready for use by the Consultant’s experts in the pilot countries;
4.1.7 The Consultant will finalise all their travel and meeting arrangements with for the visits to the initial countries in co-operation with EBRD as agreed.
4.2 Conducting the visits to the pilot countries
4.2.1 The Consultant will visit each of the pilot countries according to the detailed plan agreed with the EBRD;
4.2.2 In each pilot country, the Consultant will hold meetings with the companies and organisations selected. At each meeting, the Consultant will explain the background and purpose of the survey. At meetings which are not attended by a representative of the Bank, the Consultant will also firstly explain the role of the EBRD and its objectives with regards to the survey;
4.2.3 The Consultant should aim to complete a survey questionnaire at each meeting, paying particular attention to ensuring that the questions are clearly understood and that any background reasoning given by the respondent is recorded. If there are answers which cannot be answered at a meeting, the Consultant should ensure that there is an agreed follow-up action to complete the questionnaire, for example by leaving it to the company to complete the questionnaire, or by the company sending follow-up information for the questionnaire to be completed by the Consultant;
4.2.4 Each company or organisation should be asked to provide a contact person for follow-up questions, and also to provide any additional persons known to the meeting attendees that could be asked to complete additional questionnaires. These contacts could be persons within the same company, but with different geographical or functional responsibilities, or persons in different companies that could also provide useful responses;
4.2.5 For companies and organisations that are unable to meet the Consultant face-to-face at the visits to the pilot countries, the Consultant will send further requests to additional potential respondents to complete an on-line questionnaire. The Consultant can also collaborate with any relevant trade associations to expand the list of target respondents and to help to facilitate responses;
4.2.6 The Consultant will follow-up the meetings with any requests for clarification and to ensure that any unfinished questionnaires are duly completed. Any further on-line questionnaires sent to organisations separately (to organisations where face-to-face meetings were not held) should be followed up to ensure a high response rate;
4.2.7 At least one full primary and one secondary respondent response will be required from each respondent category for the survey to be deemed valid for a given country;
4.2.8 The Consultant will document all communications with target respondents. Before an approach to a target respondent will be classified as exhausted the Consultant will make at least three documented written efforts and three phone efforts to secure a response from the minimum required respondents per country;
4.2.9 The Consultant will use the benefit of the knowledge gained during the country visits and face-to-face meetings to increase the size of the secondary respondent target pool. In any event, questionnaires should only be dispatched to secondary respondent targets following the completion of the country visits;
4.2.10 Where the Consultant encounters issues raised (by any addressee of the survey) that can only be answered by EBRD, the Consultant should record the issue and discuss it fully with the EBRD, who will agree the best way to respond;
4.2.11 The Consultant will prepare a report on the pilot visits containing a full list of the meetings held, the questionnaire responses, plus relevant notes of the meetings to add to the questionnaire responses and provide a richer picture of the investor perception of the broadband markets in the initial countries;
4.2.12 The Consultant will present the report on the pilot visits to EBRD, together with the Consultant’s recommendations on any improvements to the survey methodology and process, or ways to increase the quality of the responses or the response rate with respect to both those questionnaires responded to through face-to-face meetings and those responded to remotely.
4.3 Analysis and reporting of the pilot results
4.3.1 The Consultant will carry out a full analysis of the pilot results, using the completed questionnaires, the calculated indexes and the output rankings produced by the on-line survey model in accordance with Appendix 1;
4.3.2 The Consultant will analyse all the material collected during the visits to each pilot country and ensure that the key messages are distilled to highlight the countries and circumstances where improvements can be made to investment conditions. The reporting on important topics should also be enriched by case studies, taken from the meetings or follow-up discussions. In all cases, appropriate safeguards in the drafting should preserve the anonymity of the respondents. If the nature of any case study compromises the identity of a respondent, then it should not be used in the report, unless the relevant organisations have given their agreement;
4.3.3 The Consultant will prepare a draft Pilot Report, in accordance with the requirements in Appendix 1. The report should include the presentation of the calculated indexes in appropriate rankings (i.e. country-by-country as defined in paragraph 4.1.1 above). The narrative sections of the report should give a clear picture, country by country, of the factors of policy, regulation and associated topics that contribute most to the overall

investor perceptions. The drafting of the narrative sections of the report should be written in a way that not only points out the problems, but also explains the improvements required;
4.3.4 The Consultant should make any relevant comments in the draft Pilot Report giving further recommendations on both the actions needed by the countries and on any other aspect of the survey, its scale-up, the aim being to derive the most impact from the results;
4.3.5 The Consultant will present the draft Pilot Report to EBRD;
4.3.6 The Consultant will prepare a Pilot Report summarising the work done by the Consultant and the results obtained. The Pilot Report will include the final version of the Pilot Survey Report incorporating any changes agreed with EBRD.
4.4 Conducting the full survey
4.4.1 Taking account of any improvements necessitated from the Pilot, the Consultant will prepare a detailed plan for the conduct of the full survey (‘Full Survey Plan’). The full survey will be conducted in the remaining three regions, with the intention that the output of the pilot is joined with that of the full survey, to create a four-region survey. The Consultant will ensure that the timing involved in the pilot and full survey is such that it can be fairly referred to as being implemented over the course of a calendar year;
4.4.2 The Full Survey Plan will be prepared in accordance with the instructions and requirements set out for, and reflect, the Pilot Survey Plan, above, duly enlarged to take account of the larger number of countries and adapted to take account of the knowledge, experience and lessons learned from the pilot survey;
4.4.3 The Consultant will present the report on the full visits to EBRD, together with the Consultant’s recommendations on any improvements to the survey methodology and process, lessons learned or ways to increase the quality of the responses or the response rate with respect to both those questionnaires responded to through face-to-face meetings and those responded to remotely.
4.5 Analysis and reporting of the Full results
4.5.1 The Consultant will carry out a full analysis of the survey results, using the completed questionnaires, the calculated indexes and the output rankings produced by the on-line survey model in accordance with Appendix 1;
4.5.2 The Consultant will analyse all material collected during each country visit and ensure that the key messages are distilled to highlight countries and circumstances where improvements can be made to investment conditions. Reporting on important topics should also be enriched by case studies, taken from the meetings or follow-up discussions. In all cases, appropriate safeguards in the drafting should preserve respondents anonymity . If the nature of any case study compromises the identity of a respondent, then it should not be used in the report, unless the respondent has agreed;
4.5.3 The Consultant will prepare a draft Full Report, in accordance with the requirements in Appendix 1. The report should include the presentation of the calculated indexes in appropriate rankings (i.e. country-by-country rankings within the four main regions as defined in paragraph 4.1.1 above). The narrative sections of the report should give a

clear picture, country by country, of the factors of policy, regulation and associated topics that contribute most to the overall investor perceptions. The drafting of the narrative sections of the report should be written in a way that not only points out the problems, but also explains the improvements required;
4.5.4 The Full Survey Report will incorporate and integrate the output from the Pilot
4.5.5 The Consultant should make any relevant comments in the draft Full Report giving further recommendations on both the actions needed by the countries and also on the any other aspect of the survey, its follow-up and publication, the aim being to derive the most impact from the results;
4.5.6 The Consultant will present the draft Full Report to EBRD;
4.5.7 The Consultant will prepare a Final Report summarising the work done by the Consultant and the results obtained. The Final Report will include the final version of the Full Report incorporating any changes agreed with EBRD.
5. Duration
It is anticipated that the project will have a duration of approximately 12 months. If necessary, appropriate and financially feasible, a further extension of time or scope may be sought.
6. Implementation arrangements
The Consultant will be supervised by the Bank’s Operation Leader for this assignment. The Consultant is expected to coordinate its activities with the EBRD throughout the full duration of the project. The Consultant will be required to update the EBRD Operation Leader on a regular basis of the progress in all phases of the work. This is especially important in the context of the Consultant’s interactions with the investors and other organisations within the countries studied.
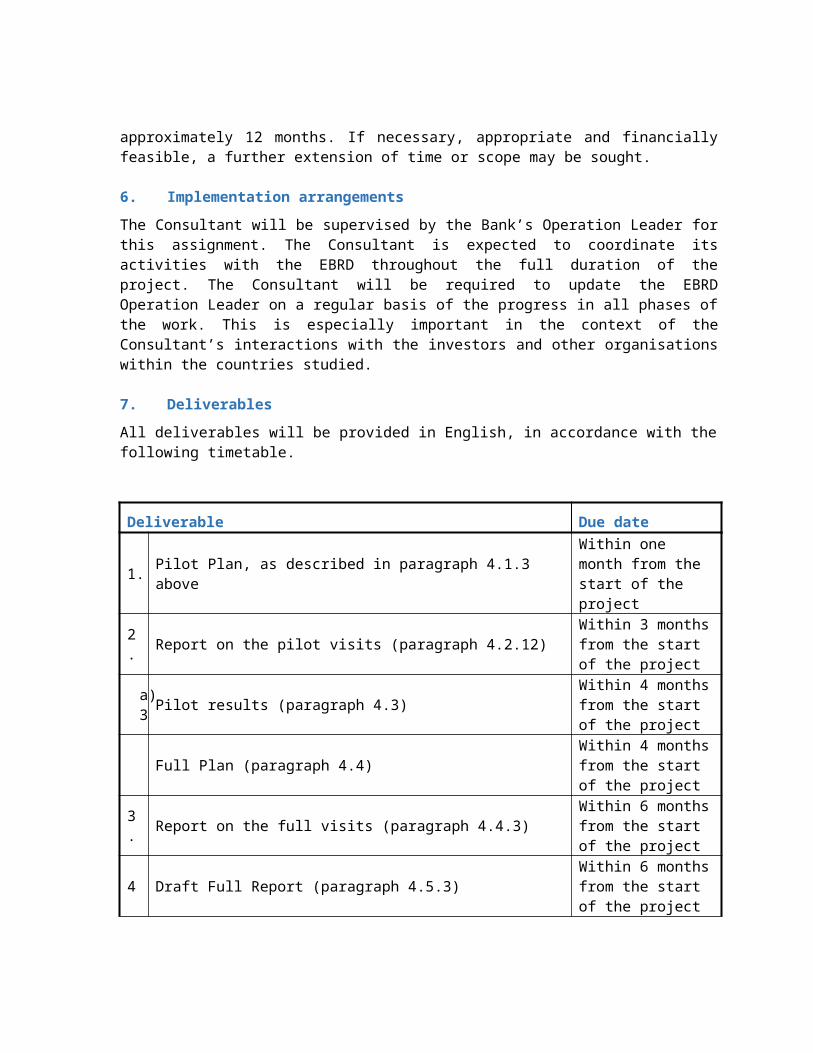
7. Deliverables
All deliverables will be provided in English, in accordance with the following timetable.
Deliverable Due date
1. Pilot Plan, as described in paragraph 4.1.3 aboveWithin one month from the start of the project
2. Report on the pilot visits (paragraph 4.2.12)Within 3 months from the start of the project
a)3
Pilot results (paragraph 4.3)Within 4 months from the start of the project
Full Plan (paragraph 4.4)Within 4 months from the start of the project

3. Report on the full visits (paragraph 4.4.3)Within 6 months from the start of the project
4 Draft Full Report (paragraph 4.5.3)Within 6 months from the start of the project
Presentation of Draft Full Report (paragraph 4.5.6) TBA
5 Final Report (paragraph 4.5.7)
Within one month from the Presentation of the Draft Survey Report
8. Progress and final reporting
Regular progress reports are required be provided to the Bank reporting on progress and any major obstacles and developments. Progress reports will clearly highlight work carried out during the reporting period, any achievement of objectives, utilisation of Project resources and remaining Project resources. A draft final Report will be prepared by the Consultant and sent to the Bank at the end of the project. The Bank will submit, no later than two weeks after receiving the draft report, its own comments on the draft report. The Final Administrative Report of the Consultant will be a summary of the work done by the Consultant and results obtained. The Consultant’s submission should also deal with any outstanding matters or additional work required for satisfying the objectives of the Project.
###
Appendix 1:
Survey Methodology

Assessment of Investment Climate – Broadband Infrastructure:
Methodology for analysis and assessment
Contents
1. Background
2. Purpose of this document
3. Survey methodology
4. Proposed definitions of the required indexes and their calculation using the questionnaire responses
5. Presentation of results
6. Using the results to identify where improvements can be made in each country
7. Time-plan and next steps
Annex A: Proposed questionnaire
1. Survey methodologyThis Assessment of Investment Climate – Broadband Infrastructure (the ‘Assessment’) is intended to cover up to 25 EBRD countries of operation (2.
Information will be gathered using an on-line (web-based) questionnaire, backed up by face-to-face or telephone discussions where necessary to gain further insight. The proposed questionnaire is given at Annex A.
The methodology for conducting the survey was developed as part of a precursor project to the assessment. This document sets out the key aspects of the methodology proposed for the conduct of the Assessment.
Target respondents
The summary table (below) lists the likely numbers of respondents per country.
Typical investor types and numbers
Type of investor Typical number in a country
Notes
Incumbent operator 2 Often have separate organisations for fixed and mobile operations
Foreign operators in the market
2-5 Often existing mobile operators plus alternative fixed network operators
New domestic market entrants
2 - 20 Often Internet Service Providers and spectrum-based broadband service providers
Third parties (including other infrastructure utilities)
3-4 Electricity, road, rail plus water/ gas/ sewerage
Key shareholders (including government)
2-3 Where the government is a key shareholder in the sector, a discussion rather than questionnaire is recommended
Domestic banks and other commercial finance entities
2-5
Foreign banks and other financing entities
10-15 Many will have a view on several countries
Total 23 - 54 Average of around 38 per country
The primary source of potential respondents’ e-mail addresses will be from databases held by each country’s regulatory agencies (lists of telecoms companies, internet eservice providers, banks and other financial institutions). Other contacts can be made via relevant trade associations or other representative bodies for ICT sector interests.
2 The current list of EBRD countries where EBRD operates is given on http://www.ebrd.com/where-we-are.html

For the purposes of the survey, it is proposed to categorise the market participants into five target groups, as follows;
a) incumbent operators and foreign operators already in the market b) new domestic market entrantsc) third parties and key shareholders including other infrastructure utilities whose
networks could be exploited (or already are being exploited) for broadband services, plus representatives of government and private sector owners;
d) domestic and foreign banks and other financial institutions that are already supporting, or could potentially support broadband infrastructure and services investments; and,
e) sector analysts and consultants with knowledge of the sector;
In order to get a valid assessment of investor perception, at least 1 response will be required for any single country. The average required response rate (if there is an average of 38 possible investor-related organisations – from the table above) is at least 5/38 13%.
In addition to the e-mail/ web-based questionnaire responses, face-to-face discussions will be required with selected investors in order to get a rich perception of the market factors that are present in each country.
There will be a target number of primary respondents per country who will be contacted face-to-face and also a target number that will be contacted on-line only. %.
To achieve the required response rate, the contacted organisations may need further explanatory advice and reminders where necessary.
The following key aspects of this methodology will need to be trialed in a limited number of EBRD countries of operation before the full survey and assessment is launched;
i. The compilation of lists of e-mail addressed in each country. This should be done in co-operation with the sector regulators (by direct contact) and also with some assistance EBRD offices in each country, for example to identify any relevant trade associations
ii. The use of e-mail-initiated web based response methods. This will require the creation of the proposed questionnaire in web format (for example using the proprietary “Typeform” tool3)
iii. The follow-up reminder and explanation proceduresiv. The need to have face-to-face discussions with selected investorsv. The analysis of completed questionnaires and follow-up where required to ensure
accuracy and to remove errorsvi. The processing of completed questionnaires to calculate the required indexes and
rankings (see also paragraph 4 below)
Note for the Trial Survey:
3 https://www.typeform.com/

As a next step, the above methodology for conducting the survey will be trialled in a few selected countries. During this trial, the full set of procedural steps (i) to (vi) should be tested.
For steps (i) – (iii) a specialist firm should be used, with experience in conducting surveys in the ICT sector using web-based response methods.
2. Proposed definitions of the required indexes and their calculation using the questionnaire responses
The main index proposed for the overall ranking of countries is the Investor Perception Index. Its calculation combines the results of three sub-indexes, the Market Attractiveness Index, the Policy Perception Index and the Best Practices Potential Index.
Calculating the composite index – the Investor Perception Index for each country (IPI)c
The Investor Perception Index seeks to measure factors associated with the attractiveness of the market, the perceived barriers to investing in that market and the potential for the country to improve the investment climate by removing the barriers.
The overall formula for arriving at a value for a country’s Investor Perception Index (IPI)c is;
(IPI)c = [wm(MAI)c + wp(PPI)c] x BPIc
Where,
wm= weighting applied to the Market Attractiveness Index (MAI)
wp= weighting applied to the Policy Perception Index (PPII)
BPIc = Best Practice Potential Index (BPI) for each country
And wm + wp = 1
Investor Perception Index
Market Attractiveness
Index
Policy Perception
Index
Best Practices Potential

The resulting IPI results will be normalised so that the maximum possible IPI value is +1 and the minimum possible value is -1. The ranking of countries according to their IPI will therefore show which countries are (overall) perceived positively by investors (values greater than 1) and which are perceived negatively (values less than 1).
The values of wp and wb are derived directly from the aggregated results (average of all respondents for that country) of the survey questionnaire Part V. This assumes that investors weight policy and market factors equally between different countries. By asking the investors to rate policy and market factors separately for each country, the questionnaire allows a comparative analysis between the countries.
Calculation of wm and wp
wp is the weighting given to the Policy Perception Index for each country (PPI)c and wm is the weighting given to the Market Attractiveness Index for each country (MAI)c when adding the PPI and MAI to arrive at the overall Investment Attractiveness Index.
Part VI of the proposed questionnaire asks the respondents to assess the relative weightings used by investors of the market factors and policy factors exhibited by countries generally. The respondents are not asked to give an assessment for each country separately, only to assess generally the relative importance of market factors in countries generally in comparison to policy factors generally in countries.
Questionnaire Part VIFactor in deciding investment in a country Your weighting
Pure market potential (the factors in Part III of the survey) Ans 1
Policy climate, risks and related factors (the factors in Part IV of the survey) Ans 2
Total 100%
The value of wm is calculated by taking the average value of Answer 1 given by all respondents. Similarly, the value of wp is calculated by taking the average of Answer 2 by all respondents.
Note for the Trial Survey:
It is expected that the answers given by respondents will be around 50%-70% for wm and around 30% to 50% for wp. If the values given by respondents in Part VI of the questionnaire have a wide range, or the average values lie outside this range, then further consideration should be given to the questionnaire design and survey calculation methodologies.
Calculating the Market Attractiveness Index for each country (MAI)c
The MAI for each country is calculated from the average of responses to Part III of the questionnaire for that country. The minimum number of responses needed to create an

average is three. If there are less than three responses for a country then it should be excluded from the results.
Part III of the questionnaire askes for the following responses;
Perception of market attractivenessFor the types of investment that you are involved in, what is your view of each country of
the overall market potential, regardless of the investment conditions there?
Note: Please give your opinion on the market alone here. Your opinion on the relevant investment conditions, for example policies and regulations (positive or negative) will be
requested in Part IV
Country
A B C D
Positively encourages investment
Does notdeter
investment
Mildly deters investment
Strongly deters
investment
No opinion/
not active in this
country
Home country 1Country 1 1Country 2 1Country 3 1
The MAI is calculated (country by country) by assigning a score of +2 for any response in column A, +1 to any response in Column B, -1 for any response in Column C and -2 for any response in Column D. For example, in the example above, the scores from one respondent are;
Country 1: 1 x -1 = -1Country 2: 1 x 1 = +1Country 3: 1 x -2 = -2Home Country: 1 x +2 = +2
The average result for each country is calculated by adding the total scores from all responses for that country and dividing by the number of responses. This resulting average

is then weighted by multiplying by wm, the factor used for MAI in the calculation of the overall Investor Perception Index.
To create a MAI value for a comparative ranking for all the countries, the value of each (MAI)c should be normalised, so that the maximum value attainable for any country is 1. This is done by dividing the calculated (MAI)c values by 2. The resulting ranking should be displayed as follows;
Country 3
Country 1
Country 2
Own Country
-1.000 -0.800 -0.600 -0.400 -0.200 0.000 0.200 0.400 0.600 0.800 1.000
Market Attractiveness Index
In this example the value of wm is 60%.
Note that the MAI for any country cannot exceed the value of wm. In the above example, “Own Country” was rated as Column A in Part III of the questionnaire by all respondents so it received an average score of 2, which was then normalised to display scores up to a maximum of 1. By applying the weighting wm, calculated as 60% for market factors, the resulting ranking shows “Own Country” with a score of 0.6.
Calculating the Policy Perception Index for each country (PPI)c
The PPI for each country is calculated from the average of responses to Part IV of the questionnaire for that country. The minimum number of responses needed to create an average is three. If there are less than three responses for a country then it should be excluded from the results.
Part IV of the questionnaire askes for the following responses;
Investment climate, risks and related factorsIn this part, we go through a list of 14 factors, which could influence investment decisions in each country.Please give your view separately for each listed factor and for each country.

If you consider any factor alone to be the sole reason for your decision not to invest, you can mention these in the last question in this part of the questionnaire. There you can as well use the comments spaces to explain your view in more detail.
Any comments in this part of the survey will be in confidence and if they are used in our report they will not be attributed to you. These statements could be on any of the listed topics or other areas of the situation, ranging from “examples of best practice” right through to “examples of any key inhibitors and barriers to investments”.Please
Following this introductory statement in Part IV of the questionnaire there are 14 questions, each relating to a separate topic of policy and related factors. The list of topics is;
Q1: The country's overall legal systemQ2: Legal and regulatory framework specific to electronic communications networks and servicesQ3: State participation in the sectorQ4: State assistance or funding schemes]Q5: Quality of databases and access to informationQ6: Availability of labour especially with digital skillsQ7: Labour regulations, employment agreements, militancy, disruptionsQ8: Access to state-controlled resources related to investment in networks and servicesQ9: Certainty in construction permits and wayleavesQ10: Taxation generally or targeted at the sectorQ11: Overall infrastructureQ12: Trade barriersQ13: Political stability, security, criminality, terrorismQ14: Corruption generally or in any aspect of operations
For each of the 14 topics, there are explanatory notes to guide the respondent about what aspects are relevant under each topic. There is also adequate space for the respondent to provide comments, observations, experiences in any countries that will help us to understand their responses.
The format of the questionnaire response is the same for each of the questions;

Response format used in Part IV of the Questionnaire
Country
A B C D
Positively encourages investment
Does notdeter
investment
Mildly deters investment
Strongly deters
investment
No opinion/
not active in this
country
Home country 1Country 1 1Country 2 1Country 3 1
This same response format is used for all the 14 questions in Part IV of the questionnaire.
The PPI is calculated (country by country) by assigning a score of +2 for any response in column A, +1 to any response in Column B, -1 for any response in Column C and -2 for any response in Column D. For example, in the example above, the scores from one respondent are;
Country 1: 1 x 1 = +1Country 2: 1 x -1 = -1Country 3: 1 x -2 = -2Home Country: 1 x +1 = +1
The average result for each country is calculated by adding the total scores from all responses from all 17 questions for that country and dividing by the number of responses to all questions (number of boxes filled for each country). This resulting average is then weighted by multiplying by wm, the factor used for PPI in the calculation of the overall Investor Perception Index.
To create a PPI value for a comparative ranking for all the countries, the value of each (PPI)c should be normalised, so that the maximum value attainable for any country is 1. This is done by dividing the calculated (PPI)c values by 2. The resulting ranking should be displayed as follows;

Country 3
Country 1
Country 2
Own Country
-0.2 -0.1 0.0 0.1 0.2 0.3 0.4
Policy Perception Index
In this example, the value of wp is 40%.
Note that the MAI for any country cannot exceed the value of wp. In the above example, “Own Country” was rated as Column A in Part III of the questionnaire by all respondents so it received an average score of 2, which was then normalised to display scores up to a maximum of 1. By applying the weighting wm, calculated as 60% for market factors, the resulting ranking shows “Own Country” with a score of 0.6.
Calculation of the Best Practice Potential Index for each country (BPI)c
The value of the BPI is calculated by using the responses to Parts IV (“Policy climate, risk and related factors”) and V (Confidence in moving towards best practice”) of the Questionnaire.
The first part of the calculation of the BPI uses the responses to Part IV of the questionnaire. Part IV asks respondents to rate the policy climate, risk and related factors over a number of specific topics (see also above description of the Policy Perception Index). If the respondent gives a positive rating this infers that some elements of best practice are currently perceived. For example, respondents are asked to rate “Certainty in construction permits and wayleaves” (Q8 of Part IV). If the respondent answers in Column A of Q8 of Part IV that “The situation is such that it positively encourages you to invest”, then a score of 2 is assigned to that response. If the respondent answers in Column B, “The situation is such that it does not deter you from investing”, then a score of 1 is assigned. If the respondent answers in Column C or D, “The situation is such that it mildly deters you from investing”, or “The situation is such that it strongly deters you from investing”, then the response is ignored, on the assumption that little or no best practice is present.
The average for each country of all scores from all respondents is calculated. This average figure is then normalised so that the maximum value is 1 (the average is divided by 2). The resulting figure is expressed as a percentage (b1%).

The second part of the calculation of the BPI uses the responses to Part V of the questionnaire. Part V asks respondents to assess their level of confidence in the country moving towards best practice.
Please rate the confidence that you place on the country's policy makers/ regulators etc. being motivated and able to improve towards implementing best practice conditions for investors
Country
A B C D
Very confident that the country
will soon implement
best practice
conditions
Some doubts that the country
will soon implement
best practice
conditions
The country is
slow to adopt best
practice conditions
but it might
happen at some stage
Strong doubt that
the country will ever
implement best
practice conditions
Home country 1Country 1 1Country 2 1Country 3 1
A calculation is made (country by country) by assigning a score of +2 for any response in column A, +1 to any response in Column B, -1 for any response in Column C and -2 for any response in Column D. For example, in the example above, the scores from one respondent are;
Home Country: 1 x +2 = +2Country 1: 1 x 1 = +1Country 2: 1 x 1 = +1Country 3: 1 x -1 = -1
The average result for each country is calculated by adding the total scores from all responses for that country and dividing by the number of responses. This average figure is then normalised so that the maximum value is 1 (the average is divided by 2).
The resulting normalised average (b2%) is then combined with the part of the country’s policy climate, risks and related factors (in Part IV of the questionnaire) where best practice is not judged to be present. The extent of best practice is already calculated in the first part of the calculation above (b1%). To combine the results of the first part of the calculation with the second part uses the formula;

Composite score = b2% x (1-b1%)
For each country, this composite score is then added to b1 to produce the Best Practice Index (BPI)c for each country.
BPI = b1% + [b2% x (1 - b1%)]
This result is already normalised so that the maximum value is 100%.
Country 1
Country 3
Country 2
Own Country
0% 10% 20% 30% 40% 50% 60% 70% 80% 90% 100%
Best Practice Potential Index
Calculation of the Investor Perception Index for each country (IPI)c
The Investor Perception Index (table 1 and figure 3) is a composite index that combines the Market Attractiveness Index (MAI), the Policy Perception Index (PPI) and the Best Practice Potential Index (BPI) according to the formula;
(IPI)c = [wm(MAI)c + wp(PPI)c] x BPIc
Where,
wm= weighting applied to the Market Attractiveness Index (MAI)
wp= weighting applied to the Policy Perception Index (PPI)
BPIc = Best Practice Potential Index (BPI) for each country
And wm + wp = 1

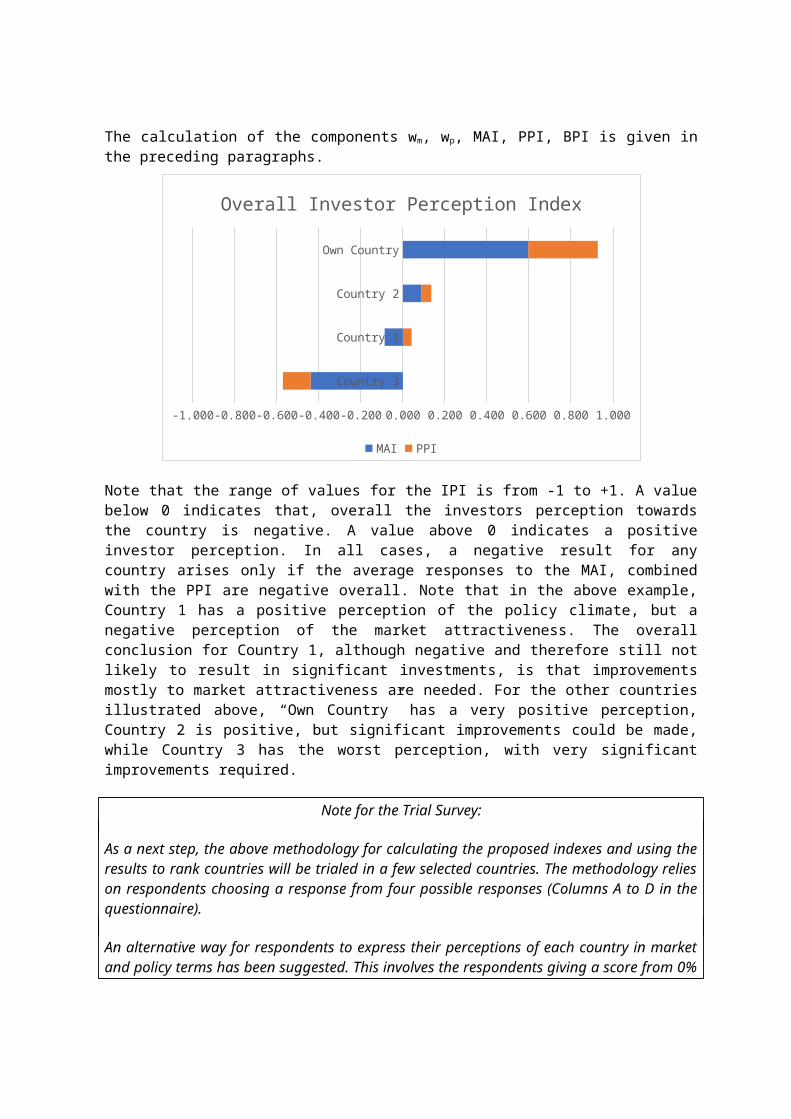
The calculation of the components wm, wp, MAI, PPI, BPI is given in the preceding paragraphs.
Country 3
Country 1
Country 2
Own Country
-1.000 -0.800 -0.600 -0.400 -0.200 0.000 0.200 0.400 0.600 0.800 1.000
Overall Investor Perception Index
MAI PPI
Note that the range of values for the IPI is from -1 to +1. A value below 0 indicates that, overall the investors perception towards the country is negative. A value above 0 indicates a positive investor perception. In all cases, a negative result for any country arises only if the average responses to the MAI, combined with the PPI are negative overall. Note that in the above example, Country 1 has a positive perception of the policy climate, but a negative perception of the market attractiveness. The overall conclusion for Country 1, although negative and therefore still not likely to result in significant investments, is that improvements mostly to market attractiveness are needed. For the other countries illustrated above, “Own Country” has a very positive perception, Country 2 is positive, but significant improvements could be made, while Country 3 has the worst perception, with very significant improvements required.
Note for the Trial Survey:
As a next step, the above methodology for calculating the proposed indexes and using the results to rank countries will be trialed in a few selected countries. The methodology relies on respondents choosing a response from four possible responses (Columns A to D in the questionnaire).
An alternative way for respondents to express their perceptions of each country in market and policy terms has been suggested. This involves the respondents giving a score from 0% to 100% for each question. Under this scoring scheme, the above formulae would be amended to arrive at the three indexes.
It should be possible during the trial survey to use both scoring methods and compare the results obtained. A decision would then be made regarding the final methodology to be used, based on the scoring method preferred by the respondents.

3. Presentation of resultsParagraph 4 above defines the method of calculation of the proposed indexes (IPI, MAI, PPI, BPI). After calculating these results for each country, the following presentational formats will be required;
1) Country-by-country results for each index, in rank order (whether published TBC).
There are likely to be at least 20 countries where results can be obtained. At least 3 responses are required from a country to produce a valid result. There are likely to be countries where insufficient responses are received.
The required graphical presentations are required;
Full ranking of all countries for each of the four indexes Up to 5 regional rankings, each region containing ranked results for each of
the four indexes (South-eastern Europe, Central Europe and Baltic States, Eastern Europe and the Caucasus, Central Asia, Southern and Eastern Mediterranean)
Example of full ranking for all countries (illustrative only 4 )
EgyptArmeniaMorocco
JordanUkraine
Bosnia HerzegovinaTunisia
MoldovaAlbaniaTurkey
KazakhstanGeorgia
AzerbaijanMontenegro
BelarusSerbia
FYR MacedoniaCyprus
GreeceCroatia
0% 10% 20% 30% 40% 50% 60% 70% 80% 90% 100%
ICT Investor Perception Index
Series1Series2Blue = Policy Percep-
tion Index
Red = Market Attrac-tiveness Index
[Note: This is an alternative bar chart method of ranked presentation using the alternative method of scoring based on 0%-100% (see also “Note for trial survey” in paragraph 4 above)]
4 The results displayed are only illustrative, i.e. this ranking and the values for each country are not derived from actual results.

2) Time trends
The presentation of time trends can only be done after a second and subsequent surveys. This will be done country-by-country for all the four indexes. The best format for presenting these results is in the five regional groupings (South-eastern Europe, Central Europe and Baltic States, Eastern Europe and the Caucasus, Central Asia, Southern and Eastern Mediterranean). The presentation commentary should focus on the most improved countries, citing specific comments and face-to-face discussion highlights.
Example of time trend
Country 3 Country 1 Country 2 Own Country
-1
-0.8
-0.6
-0.4
-0.2
0
0.2
0.4
0.6
0.8
Investor Perception Index(change 2017 to 2018)
2017 2018
3) Descriptive assessments
Alongside the graphical results, a detailed commentary will be presented, which summarises the written comments returned in the questionnaires, focusing on statements of the situation and policy or procedural experiences, ranging from “extemporary policy”, “examples of best practice”,” factors that increase risk”, right through to “horror stories”. On each specific aspect of the investment climate, respondents were asked to comment if the situation is so poor that this factor alone means that you will not invest.
The commentary will also include lists (country-by-country) of the priority factors identified in the survey (see also paragraph 6 below). In the illustrative example, Country 2 was identified as having the following priorities for improving investment conditions in the ICT sector;
The legal and regulatory framework specific to ICT
Quality of databases and access to information
Availability of labour especially digital skills

Taxation generally or targeted at the ICT sector
Political stability, security, criminality, terrorism
In cases such as this, where there are still a number of barriers to investment (Country 2 had an Investor Perception Index result of +0.135 out of a maximum of 1.0), it will be an advantage to hold face-to-face interviews with several of the investors to obtain the clearest possible picture of the specific issues that have contributed to these priority factors being highlighted in the survey.
When face-to-face interviews are held, the summaries of the discussions should be presented as case studies, with appropriate safeguards in the drafting to preserve the anonymity of the investors. If the nature of the case makes the identity of the investor then it should not be used in the report, unless the investor gives their agreement.
One of the main objectives of the survey report is to highlight to the countries where improvements can be made to make investment conditions better. The drafting of the narrative sections of the report should be written in a way that not only points out the problems, but also explains the improvements required.
It is proposed that EBRD publishes the results of the ICT Investor Perception Index survey on its own website and also incorporates a presentation of the results and follow-up recommendations into one of its regional conferences.
4. Using the results to identify where improvements can be made in each country
As shown in the above illustration of the resulting IPI rankings, the countries where improvements can be made can be identified. The questionnaire results can also give a clear picture, country by country, of the factors of policy, regulation and associated topics (Part IV of the questionnaire) contribute most to the overall negative perceptions.

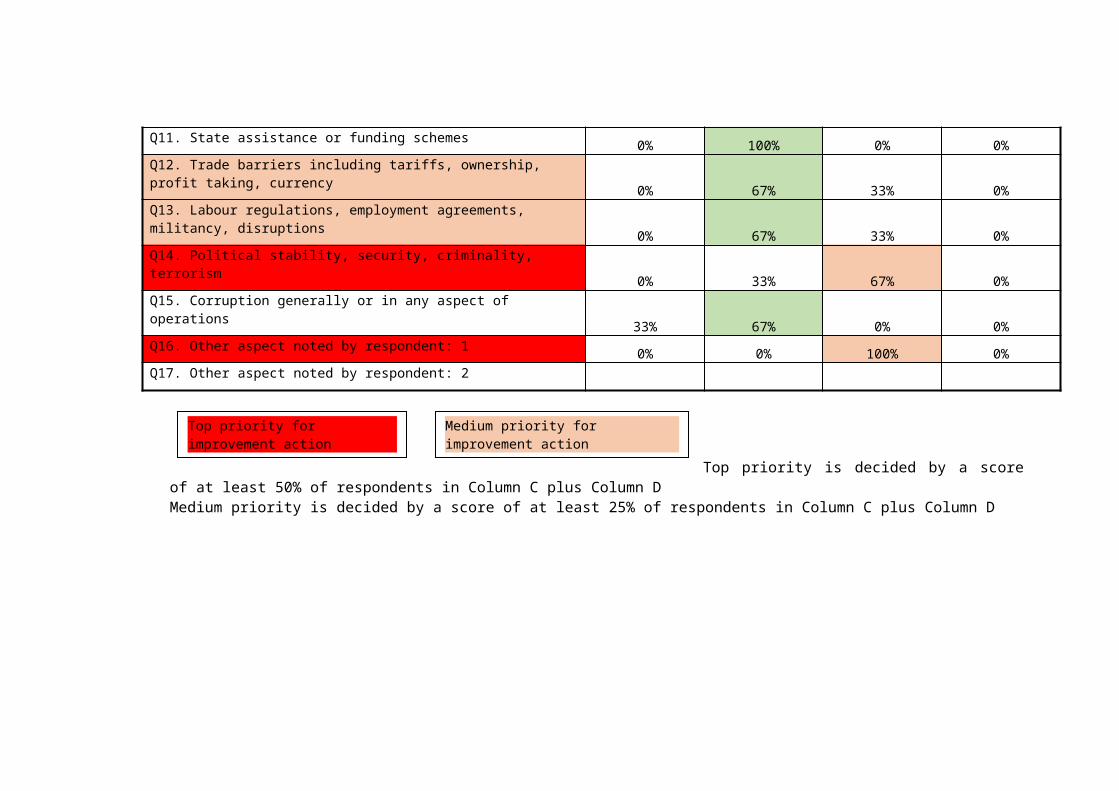
A simple table can be constructed, giving the total responses to Part IV of the questionnaire for each policy topic, as follows.
Analysis of responses – Country 2Topic Responses in
Column A(The situation is
such that it positively
encourages you to invest)
Responses in Column B
(The situation is such that it does
not deter you from investing)
Responses in Column C
The situation is such that it mildly deters you from
investing
Responses in Column D
(The situation is such that it
strongly deters you from investing)
Q1. The country's overall legal system, predictability and process 0% 100% 0% 0%Q2. Legal and regulatory framework specific to ICT 0% 33% 67% 0%Q3. Policy makers favour investments and do not favour incumbents 0% 67% 33% 0%Q4. Level of certainty concerning administration and existing regulations 0% 67% 33% 0%Q5. Quality of databases and access to information 0% 33% 67% 0%Q6. Availability of labour especially with digital skills 0% 33% 67% 0%Q7. Regulatory duplication, inconsistencies and overlaps 0% 67% 0% 33%Q8. Certainty in construction permits and wayleaves 0% 67% 33% 0%Q9. Taxation generally or targeted at the sector 0% 33% 33% 33%Q10. Overall infrastructure (roads, power etc.) 33% 67% 0% 0%Q11. State assistance or funding schemes 0% 100% 0% 0%Q12. Trade barriers including tariffs, ownership, profit taking, currency 0% 67% 33% 0%Q13. Labour regulations, employment agreements, militancy, disruptions 0% 67% 33% 0%Q14. Political stability, security, criminality, terrorism 0% 33% 67% 0%Q15. Corruption generally or in any aspect of operations 33% 67% 0% 0%Q16. Other aspect noted by respondent: 1 0% 0% 100% 0%Q17. Other aspect noted by respondent: 2

Top priority is decided by a score of at least 50% of respondents in Column C plus Column D
Medium priority is decided by a score of at least 25% of respondents in Column C plus Column D
Top priority for improvement action Medium priority for improvement action

In the example above, the top priorities in Country 2 for improving investment conditions in the ICT sector are;
The legal and regulatory framework specific to ICT
Quality of databases and access to information
Availability of labour especially digital skills
Taxation generally or targeted at the ICT sector
Political stability, security, criminality, terrorism
Respondents are asked to give comments or explanations in their responses for each question. This will provide additional information on specific examples, associated factors and horror stories that lead to a perception of increased investment risk.
If the situation is complex and a clear picture is not emerging from the questionnaire results and comments received, then face-to-face discussions with specific investors may be necessary in order to obtain a clear picture of the situation in particular countries.
The trial survey (proposed as the next step) will explore the range of responses, their clarity and their value in achieving a clear investor perception and the ability to be able to compare results across a number of countries.
Annex A
ICT Sector: Survey of Investor Perception
Dear Client: The main purpose of the survey is to use the results to inform investors, policy makers, regulatory and other influencers of sector investment so that they can make better decisions that will increase effectiveness in telecommunications sector investments and in
particular to improve broadband infrastructure coverage, capacity and connectivity.
The broadband investment sector embraces telecommunications infrastructure and connectivity (fixed and mobile networks) and the services (both retail and wholesale) that are
delivered over these networks (voice, internet, data, media and broadband services). This definition is used within the context of the key development objective of this survey – to
promote broadband infrastructure investments.
We are interested in the views of a wide range of investors in these infrastructures and services, either as direct investors (network operators and service providers), or as institutions
financing investments. We are also seeking the views of analysts and advisors in the sector.
The answers provided will be treated in strictest confidence and the overall results, or any part of the results will not be attributed to any organisation or group of organisations. When the full
survey has been completed, the results will be published to benefit investors, policy makers, regulators and other sector players by making it clear where actions need to be taken to
improve the climate for sector investments.
You are asked to make a separate response for each country per region where you are familiar (either by your existing presence or by your having studied the market for possible investment
in the sector in that country). For these countries, if you are not familiar with any particular aspect of the market, then you should select "No opinion/not active in this country, or not give an answer and leave the fields open. EBRD currently operates in 39 countries (and up to 25 of
these countries will be covered in the survey). We are also interested in your views on any other countries where you are familiar, so there is space for you to add countries and give your responses. The countries being surveyed will be drawn from the following: Albania, Armenia,
Azerbaijan, Belarus, Bosnia and Herzegovina, Bulgaria, Croatia, Cyprus, Egypt, Estonia, FYR Macedonia, Georgia, Greece, Hungary, Jordan, Kazakhstan, Kosovo, Kyrgyz Republic, Latvia,
Lithuania, Moldova, Mongolia, Montenegro, Morocco, Poland, Romania, Russia, Serbia, Slovak Republic, Slovenia, Tajikistan, Tunisia, Turkey, Turkmenistan, Ukraine and Uzbekistan.
Parts I and II of the survey ask for some details about your firm and its role in the countries being surveyed. This company information will be held in strictest confidence.
Part III of the survey asks about your opinion of the market for ICT sector investments, specifically what you perceive about the market size, potential and attractiveness for
investments. In the survey, these market views are distinct from your views on the existing

conditions there, including policies, the legal framework and regulations. Your opinions on those legal, policy and regulatory risk factors are separately requested in Part IV of the survey.
Please answer as many questions as possible. Questions in Parts III and IV have a “no opinion option”. Where possible, please feel free to express additional opinions in the text spaces
provided.
For which regions can you provide us with information?
South-Eastern Europe (Albania, Bosnia and Hercegovina, Croatia, Cyprus, FYR Macedonia, Kosovo, Montenegro, Serbia)
Eastern Europe and the Caucasus (Armenia, Azerbaijan, Belarus, Georgia, Moldova, Ukraine)
Central Asia (Kazakhstan, Kyrgyz Republic, Uzbekistan)
Southern and Eastern Mediterranean (Egypt, Jordan, Lebanon, Morocco, Tunisia)

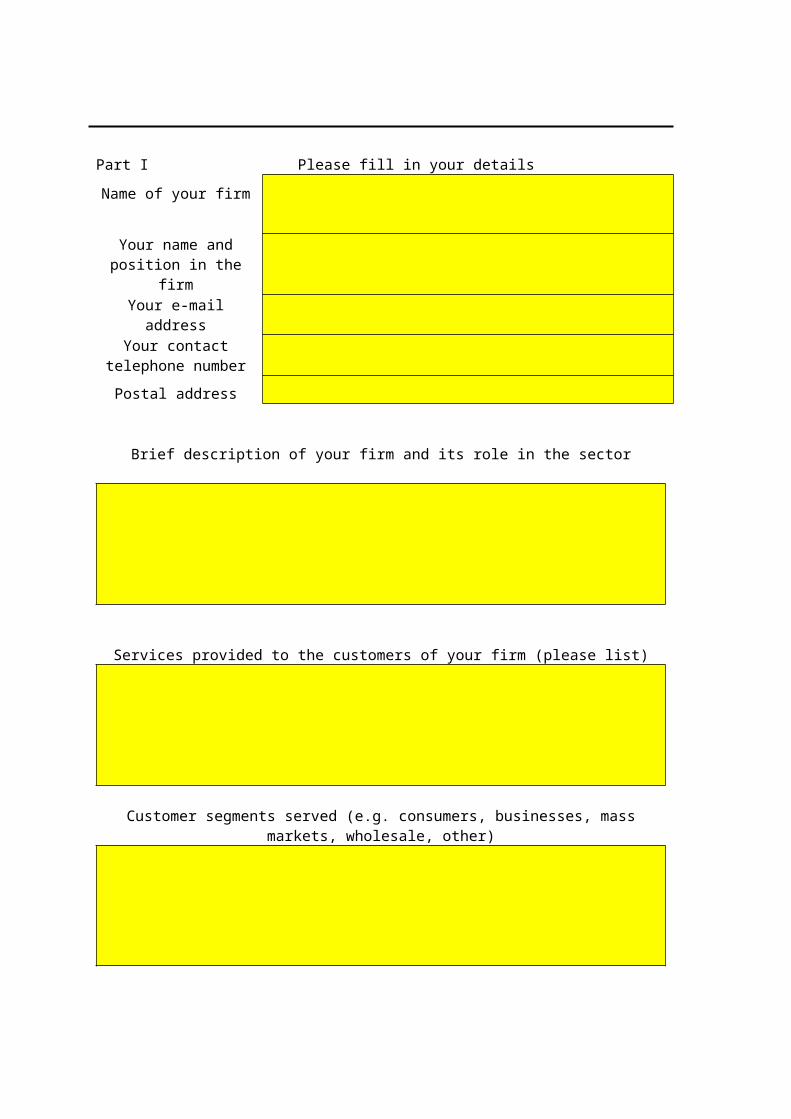
Part I Please fill in your details
Name of your firm
Your name and position in the firm
Your e-mail addressYour contact telephone
number
Postal address
Brief description of your firm and its role in the sector
Services provided to the customers of your firm (please list)
Customer segments served (e.g. consumers, businesses, mass markets, wholesale, other)

Country
Already there or considering involvement?
How familiar are you with the market? (1 = small knowledge, 5=
very familiar)
Number of customers
** = your firm's home country
Total investment in the most recent five accounting years (all countries)
Amount Currency
Part II Types of investments made by the respondentWhat types of investment are you making, or currently considering, in the ICT market? (Your answer may vary by country, in which case please include a full list including all countries).
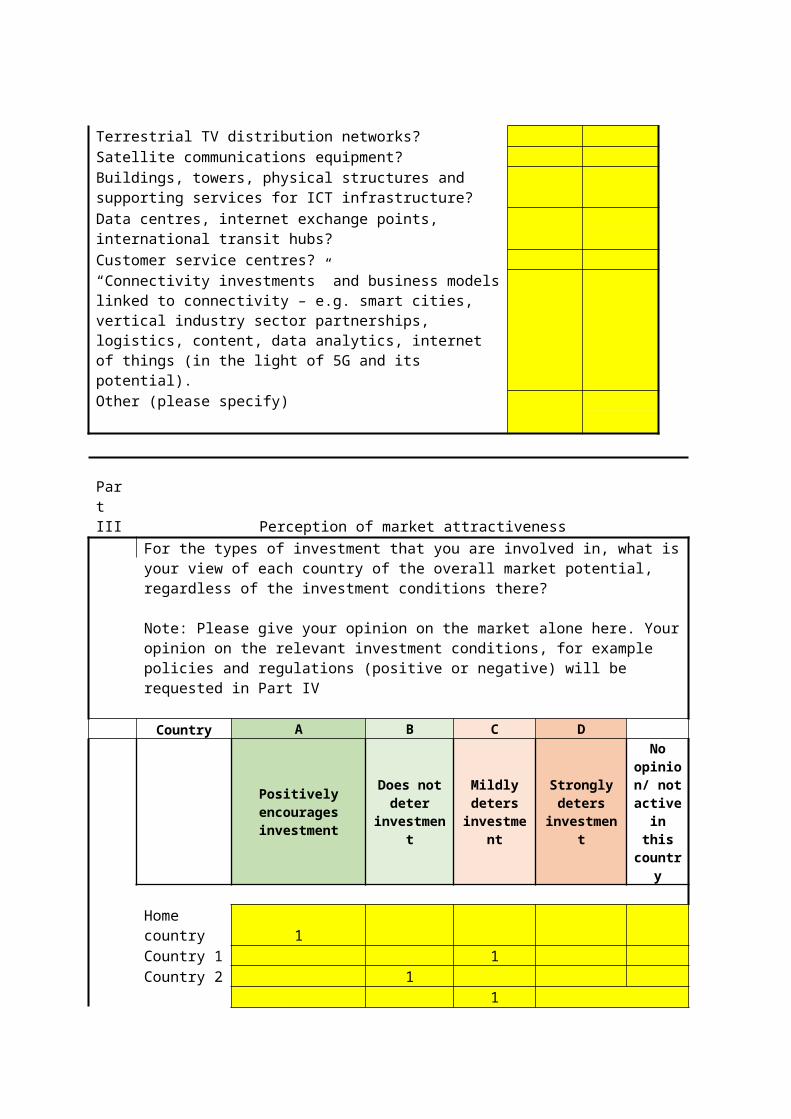
Yes NoFixed network infrastructure investments?Mobile network infrastructure investments?Additional mobile spectrum?Cable TV network infrastructure?Terrestrial TV distribution networks?Satellite communications equipment?Buildings, towers, physical structures and supporting services for ICT infrastructure?Data centres, internet exchange points, international transit hubs?
Customer service centres?“Connectivity investments” and business models linked to connectivity – e.g. smart cities, vertical industry sector partnerships, logistics, content, data analytics, internet of things (in the light of 5G and its potential).Other (please specify)
Part III Perception of market attractiveness
For the types of investment that you are involved in, what is your view of each country of the overall market potential, regardless of the investment conditions there?
Note: Please give your opinion on the market alone here. Your opinion on the relevant investment conditions, for example policies and regulations (positive or negative) will be requested in Part IV
Country A B C D
Positively encourages investment
Does not deter
investment
Mildly deters
investment
Strongly deters
investment
No opinion/
not active in
this country
Home country 1Country 1 1Country 2 1
Country 3 1
Please provide us with any comments, observations, experiences in any countries that help us to understand your response

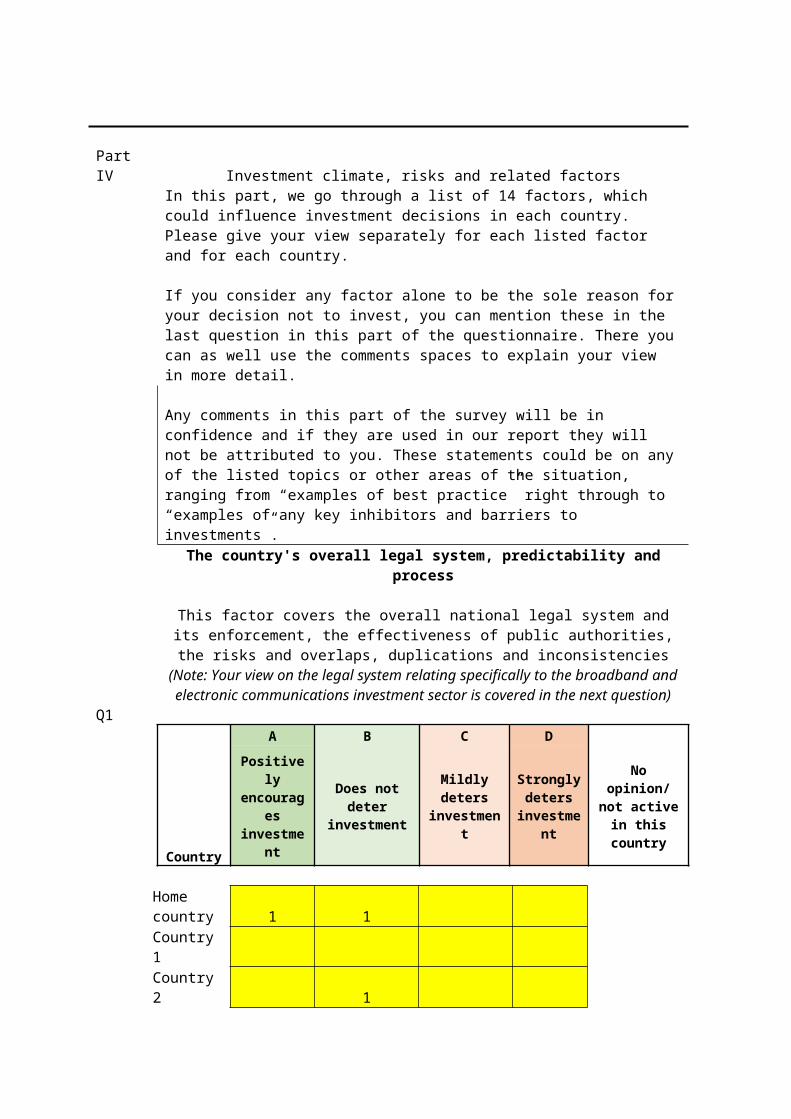
Part IV Investment climate, risks and related factorsIn this part, we go through a list of 14 factors, which could influence investment decisions in each country.Please give your view separately for each listed factor and for each country.
If you consider any factor alone to be the sole reason for your decision not to invest, you can mention these in the last question in this part of the questionnaire. There you can as well use the comments spaces to explain your view in more detail.
Any comments in this part of the survey will be in confidence and if they are used in our report they will not be attributed to you. These statements could be on any of the listed topics or other areas of the situation, ranging from “examples of best practice” right through to “examples of any key inhibitors and barriers to investments”.
Q1
The country's overall legal system, predictability and process
This factor covers the overall national legal system and its enforcement, the effectiveness of public authorities, the risks and overlaps, duplications and
inconsistencies(Note: Your view on the legal system relating specifically to the broadband and electronic communications investment sector is covered in the next question)
Country
A B C D
Positively encourages investment
Does not deter investment
Mildly deters investment
Strongly deters
investment
No opinion/ not active in this country
Home country 1 1Country 1Country 2 1
Country 3 1
Please provide us with any comments, observations, experiences in any countries that help us to understand your response
Q2
Legal and regulatory framework specific to electronic communications and broadband investments
This includes the existing overall legal and regulatory framework (primary and secondary legislation/ by laws) relating specifically to the electronic communications networks and services sector, your confidence in the effective application of those laws and the transparency of the procedures used by law makers and regulatory bodies in supervising those laws. The types of laws and regulations for the sector are typically related to the rights and obligations of market participants, interconnection and access, sector competition, conditions for the provision of services, technical standards and any specific rules for promoting investments.
(Note: Some specific aspects regarding the rules on electronic communications are covered in questions that follow, including spectrum availability, construction permits and rights of way.)
Country A B C D
Positively encourages investment
Does not deter investment
Mildly deters investment
Strongly deters investment
No opinion/
not active in
this country
Home country 1Country 1 1 Country 2 1 Country 3 1
Please provide us with any comments, observations, experiences in any countries that help us to understand your response

Participation in the state sector
This includes the level of state ownership of networks and services operators and the possible implications for competition, for example the possible bias that could result in applying policies, laws and regulations
Q3
Country
A B C D
Positively encourages investment
Does not deter
investment
Mildly deters investment
Strongly deters
investment
No opinion
/ not active in this
country
Home country 1Country 1 1Country 2 1Country 3 1
Please provide us with any comments, observations, experiences in any countries that help us to understand your response

Q4 State assistance and funding schemesThis includes any funds that are available to investors for assisting electronic communications networks and services expansion or for
ensuring universal service (for example rural development funds, digital society/ information society development funds, broadband infrastructure
funding) and the related rules and procedures applying to such funding with relation to the conditions for state participation, open access,
distortion of competition etc.
Country
A B C D
Positively encourages investment
Does not deter
investment
Mildly deters investment
Strong deterent to investment
Home country 1Country 1 1Country 2 1
Country 3 1
Please provide us with any comments, observations, experiences in any countries that help us to understand your response

Q5 Quality of databases and access to information
This includes the existence and reliability of existing information sources for population distribution and other relevant national statistics as well as specific databases for
licence holders in the sector, interconnection offers, network infrastructure atlas, index of relevant laws and regulations.
Country
A B C D
Positively encourages investment
Does notdeter
investment
Mildly deters investment
Strongly deters
investment
No opinion/
not active in
this country
Home country 1Country 1 1Country 2 1Country 3 1
Please provide us with any comments, observations, experiences in any countries that help us to understand your response

Q6 Availability of labour especially with digital skills
This includes labour and skills required for network construction and commissioning, management of operations, customer service and business management
Country
A B C D
Positively encourages investment
Does not deter
investment
Mild deterrent to investment
Strong deternet to investment
Home country 1Country 1 1Country 2 1Country 3 1
Please provide us with any comments, observations, experiences in any countries that help us to understand your response
Q7 Labour relations, employment agreements, militancy, disruptions
This relates to the national or sector specific conditions for employing labour in support of investment and operations, including the risk of strikes or other disruptions outside the control of the investor, for example through organised labour campaigns
generally or directed at the sector specifically
Country
A B C D
Positively encourages investment
Does notdeter
investment
Mildly deters investment
Strongly deters
investment
No opinion/
not active in this
country
Home country 1Country 1 1Country 2 1Country 3 1
Please provide us with any comments, observations, experiences in any countries that help us to understand your response

Q8
Access to state-controlled resources related to investment in networks and services
This includes the access and the procedures used in frequency spectrum, numbering or any other types of networks and services licences or authorisations required before launching new services or growing
existing services
Country
A B C D
Positively encourage
s investment
Does not deter from investment
Mild deterent to investment
Strong Deterent to Investment
No opinion/
not active in
this country
Home country 1Country 1 1Country 2 1
Country 3 1
Please provide us with any comments, observations, experiences in any countries that help us to understand your response
Q9 Certainty in construction permits or wayleaves
This includes any required approvals for physical construction or civil engineering works and the placing of plant on public or private land (including masts, towers, poles, overhead wires, ducts, manholes, operational or other buildings, street furniture, etc.)
Country
A B C D
Positively encourages investment
Does notdeter
investment
Mildly deters investment
Strongly deters
investment
No opinion/
not active in this
country
Home country 1Country 1 1Country 2 1Country 3 1
Please provide us with any comments, observations, experiences in any countries that help us to understand your response

Q10
Taxation generally or targeted at the sector
This includes the general taxation applied to businesses and individuals plus any specific taxes or additional financial burdens placed on trading in the electronic communications sector, the
collection of services revenues or on the outlay of investment or operating costs
Country A B C D
Positively encourages investment
Does not deter
investment
Mild deterrent
to investment
Strong deterrent to investment
No opinion
/ not active in
this country
Home country 1 Country 1 1
Country 2 1 Country 3 1
Please provide us with any comments, observations, experiences in any countries that help us to understand your response
Q11 Overall infrastructure
This relates to the national and local infrastructures for road transport, electric power distribution and other utilities essential to the normal operation of electronic
communications networks and services
Country
A B C D
Positively encourages investment
Does notdeter
investment
Mildly deters investment
Strongly deters
investment
No opinion/
not active in this
country
Home country 1Country 1 1Country 2 1Country 3 1
Please provide us with any comments, observations, experiences in any countries that help us to understand your response

Q12 Trade barriers
This includes any trade barriers or specific trade tariffs (generally or related to the sector), ownership restrictions, profit repatriation, currency risks
Country A B C D
Positively encourages invetment
Does not deter
investment
Mild deterrent to investment
Strong deterrent to investment
No opinion
/ not active in
this country
Home country 1Country 1 1Country 2 1
1Country 3
Please provide us with any comments, observations, experiences in any countries that help us to understand your response

Q13 Political stability, security, criminality, terrorism
This relates to any aspect that threatens your presence in the country from danger to life and personal safety or the overall climate of adherence to the rule-of-law and the
general level of criminal threats against businesses, residents and visitors
Country
A B C D
Positively encourages investment
Does notdeter
investment
Mildly deters investment
Strongly deters
investment
No opinion/
not active in this
country
Home country 1Country 1 1Country 2 1Country 3 1
Please provide us with any comments, observations, experiences in any countries that help us to understand your response

Q14
Corruption generally or in any aspect of operations
This relates to the likelihood of corruption affecting investments or operations, either through the taking of bribes in return for specific
assistance or through systemic corruption applied generally in contravention of relevant laws and regulations
Country A B C D
Positively encourages investment
Does not deter
investment
Mild deterrent to investment
Strong deterrent to investment
Home country 1 Country 1 1
Country 2 1 Country 3 1
Please provide us with any comments, observations, experiences in any countries that help us to understand your response
Any other aspects that are not mentioned above that you would like to tell us about?

Part V Confidence in moving towards best practice
Please rate the confidence that you place on the country's policy makers/ regulators etc. being motivated and able to improve towards implementing best practice
conditions for investors
Country
A B C D
Very confident
It could happen within a
reasonable timeframe
Some doubts that
it will happen at
all
Strong doubts/ Unlikely ever to
happen
No opinion/
not active in this
country
Home country 1Country 1 1Country 2 1Country 3 1
Please provide us with any comments, observations, experiences in any countries that help us to understand your response