BACKGROUND NOTE: MACROECONOMIC …unctad.org/en/Docs/webgds2014_g20d01_en.pdf · UNCTAD...
43
UNITED NATIONS CONFERENCE ON TRADE AND DEVELOPMENT UNCTAD contribution to the G20 Framework Working Group BACKGROUND NOTE: MACROECONOMIC STRATEGIES AND TRADE FROM A GLOBAL PERSPECTIVE 13 January 2014 UNITED NATIONS DISTRIBUTION RESTRICTED
Transcript of BACKGROUND NOTE: MACROECONOMIC …unctad.org/en/Docs/webgds2014_g20d01_en.pdf · UNCTAD...

1
UNITED NATIONS CONFERENCE ON TRADE AND DEVELOPMENT
UNCTAD contribution to the G20 Framework Working Group
BACKGROUND NOTE:
MACROECONOMIC STRATEGIES AND TRADE
FROM A GLOBAL PERSPECTIVE
13 January 2014
UNITED NATIONS
DISTRIBUTION RESTRICTED


UNCTAD contribution to the G20 Framework Working Group iii
Table of contents
A. Introduction ........................................................................................................................................ 1
B. Recent trends in international trade ................................................................................................... 3
1. Global trade expansion has virtually ground to a halt .................................................................... 3
2. Commodity prices and the terms of trade ....................................................................................... 5
C. Trade performance under constrained macroeconomic conditions: the challenge for the G20 ....... 9
1. Macroeconomic goals, constraints and their relation to trade: a typology. ................................. 10
a. Deficit countries pursuing fiscal adjustments ........................................................................... 10
b. Fiscal tightening in countries with more policy space............................................................... 11
c. Countries maintaining or expanding export surpluses .............................................................. 11
d. Countries gradually shifting away from export surpluses or moving into deficits .................... 13
e. The case of liquidity injections .................................................................................................. 14
2. Targets, ‘gap analysis’, and policies from a global perspective .................................................... 15
a. The aggregation of country responses to the crisis is either not conducive to the recovery of
trade and growth or is unsustainable ........................................................................................... 15
b. Defining the policy gaps based on feasible targets for the world as a whole and on the
identification of mechanisms of adjustment: a modelling approach ........................................... 16
3. Better regulation for reducing commodity price volatility ............................................................ 19
D. Conclusions ....................................................................................................................................... 20
Tables and Charts .................................................................................................................................. 22
Note
This publication has not been formally edited.


UNCTAD contribution to the G20 Framework Working Group 1
BACKGROUND NOTE:
MACROECONOMIC STRATEGIES AND TRADE
FROM A GLOBAL PERSPECTIVE
A. Introduction
More than five years after the onset of the global financial crisis, the world economy has not
recovered a strong growth path. Its lack of dynamism is most visible in output, employment and
investment figures, but it is also apparent from the very sluggish growth of international trade. The
latter contrasts sharply with the remarkable expansion of trade in the two decades preceding the
crisis, when the share of exports or imports of goods and services in GDP, at constant prices, virtually
doubled: from around 13 per cent to 27 per cent in developed countries, and from 20 per cent to
close to 40 per cent in developing countries (Table 1).
Stagnant international trade is likely to hamper long-run global economic growth, to the extent that
the narrower scope of scale economies and specialization gains holds back the productivity frontier.
From the point of view of a single country or group of countries, expanding net exports can also
support GDP growth by increasing autonomous demand and relaxing the balance of payment
restrictions. Indeed, in a situation of subdued domestic demand (whether due to high unemployment,
depressed wages, rising income inequality, high private indebtedness or fiscal austerity) policy
makers can see rising exports as the only route to pulling the economy quickly out of depression, as,
for example, was the case of the East-Asian countries affected by the 1997-1998 crisis.
What may be true for a country taken in isolation may, however, not hold from a global perspective.
In the late 1990s and early 2000s, crisis-hit countries could boost exports thanks to strong real

Background note: macroeconomic strategies and trade from a global perspective 2
devaluation and the availability of large and growing markets elsewhere; but this was only possible
because other countries accepted the appreciation of their currency and (particularly developed
economies) increased their imports of manufactures from East and South-East Asia. By contrast, the
countries more severely affected by the present crisis (developed countries and some European
transitional countries) mainly trade with each other.
The elaboration of a strategy in which international trade will contribute to strong, sustained and
balanced growth needs a proper diagnosis of the state of the global economy. In a situation
characterized by insufficient global demand, it is highly unlikely that international trade will
autonomously kick start economic growth. Facilitating trade (as was decided in the recent WTO
Ministerial Meeting in Bali) and further reducing existing tariffs or long-standing agricultural subsidies
(which remain unfinished business in the Doha negotiations) may be helpful to making the trading
system more efficient and fairer over the longer term, but would not address the main constraints on
trade today.
More generally, at the global level, there is no source of external demand that could stimulate
growth, other than consumption and investment, both private and public. Therefore, the starting
point for a virtuous circle of expanding output and trade must come from increased domestic
demand in a sufficiently large number of relevant countries. Reciprocally, a GDP slowdown or
contraction in a given country negatively affects its imports, and other countries' exports with
potential second order declines in income and consumption.
The crisis has tended to reduce growth more significantly in a number of deficit countries, thereby
contributing to diminished global trade imbalances. But in order to avoid the resurgence of global
imbalances, the main surplus countries should take the lead in the recovery of global demand,
allowing other countries to make any required adjustments to their domestic demand in a non-
contractionary manner. Efforts to spur exports through wage reductions and an “internal
devaluation” would be self-defeating and counterproductive, especially if followed by several trade
partners at the same time.
A second point to bear in mind in elaborating a strategy for trade, as further discussed below, is that
increased trade is not a goal in itself: its role in supporting growth and welfare depends on its
underlying drivers and its place within a wider development process. This is particularly important in
commodity-exporting developing countries, where the underlying activities may function as enclaves
with few linkages to the domestic economy and little impact on domestic income. The issue of the
level and stability of commodity prices is a particular concern for these countries in determining their
prospects to diversify and upgrade their production capacities, through the structural transformation
of their economy. Consequently, any policy measures taken for expanding trade should not sterilize
its developmental potential. Equally, a rebound of trade (to pre-crisis growth rates) should not
necessarily be considered a positive development if it is associated with unsustainable debt
expansion and asset bubbles.
This paper will first present in section B the recent trends in international trade, showing its notable
growth slowdown (in volume) and discussing the factors behind this. It will then examine the
evolution of the terms of trade, mainly explained by commodity prices. The question of the level and
instability of these prices will be addressed. Section C will discuss the place of international trade in
different countries' macroeconomic setting and the policy consequences therein. It will be shown

UNCTAD contribution to the G20 Framework Working Group 3
that in many cases, the chosen responses may be rational at the country level, but tend to generate a
deflationary bias at the global level, which hiders global recovery. There is therefore a strong case for
a coordinated stimulus by the G-20 countries, which would provide a sustainable basis for a renewed
growth of global demand, output and trade.
B. Recent trends in international trade
1. Global trade expansion has virtually ground to a halt
The global crisis had a strong impact on international trade. In the short run, it sharply reduced the
demand and prices of traded goods and services; in addition, it disrupted the financing of trade
operations, leading in 2009 to a reduction in the volume and value of merchandise trade of almost 14
and 23 per cent, respectively. Several studies that have examined the sharp fall in world trade that
occurred between the third quarter of 2008 and the first quarter of 2009, and from which world
trade still has not recovered, indicate that (i) trade in durable goods (such as automotive products
and industrial supplies) fell more than trade in non-durable goods (such as commodities); (ii) the
sharp fall in consumer durables and other differentiated goods (branded manufactures) was entirely
in terms of volume, with no price reductions; and (iii) declines in real final expenditure were
responsible for most of the collapse of international trade in 2008–2009.1 Country-specific evidence
also indicates that the collapse of world trade in 2008–2009 affected countries that export mainly
manufactures through negative volume effects.2
Much of this contraction was recovered the following year. However, it appears that the crisis had
long-term consequences on international trade, which did not return to the rapid growth rate of the
years preceding the crisis. In fact, the global volume of trade in goods has grown at an annual rate of
2 per cent on average since 2011, compared to 7 per cent between 2005 and the first half of 2008.
This slowdown affected developing, transitional and developed economies alike, with very few
exceptions (Table 2 and Chart 1).
More disaggregated evidence further supports the argument that sluggish economic activity in
developed economies accounted for most of the slowdown in international trade. European imports
of goods shrank by almost 3 per cent in volume in 2012 and by another 2 per cent in 2013. Anaemic
imports in the EU countries necessarily hurt their exports as most of them are oriented to other EU
members, even though the share of intra-regional exports declined from 68 per cent of total exports
in 2007 to 62 per cent in 2012. Consequently, the volume of exports from EU countries as a group
grew less than 1 per cent a year between the last quarter of 2010 and the third quarter of 2013. Only
the UK showed a significant increase in exports during that period, encouraged by its currency
depreciation in real terms (Chart 2), which also meant that its imports remained subdued.
1 Bems R, Johnson R and Yi KM, "The great trade collapse", Annual Review of Economics, 2013, 5: 375-400.
2 UNCTAD, Trade and Development Report 2013, pp. 29-30.
Background note: macroeconomic strategies and trade from a global perspective 4
Japan’s exports have not yet recovered from their sharp fall caused by the earthquake of 2011.
Despite some improvements in the course of 2013, supported by a significant depreciation of the yen,
exports in volume at the third quarter 2013 remained 5 per cent below their level of the first quarter
2011 and more than 10 per cent below their pre-crisis level in the first half of 2008. Imports volume
has continued to grow, albeit at a moderate pace. Among the major developed economies,
international trade in volume (including both exports and imports) had significantly exceeded their
pre-crisis peaks, by the third quarter of 2013, only in Australia, Canada and the United States.
Germany shows a peculiar pattern, because its trade rebounded rapidly to close to its pre-crisis level,
but has progressed very little since 2010 (Table 2).
Trade also decelerated considerably in developing and transition economies. In developing countries,
its volume grew by 4.5 per cent annually between the last quarter of 2010 and 2013, compared to
almost 10 per cent from 2005 to mid-2008. Its slowdown was even more accentuated in the
transition economies, falling from an annual growth of 17 per cent to one of 4 per cent in the same
periods. Trade deceleration included Asian countries that had previously played a major role in
boosting international trade.
The rate of growth of China's exports, by volume, declined from an average annual rate of 27 per
cent during the period 2002–2007 to 7 per cent in 2011-2013, a lower rate than its GDP growth.
Concomitantly, China's imports, by volume, decelerated from 19 per cent to 7 per cent, on average,
between the same periods. Since 2012, only regions exporting a large proportion of primary
commodities (i.e. Africa, West Asia and, to a lesser extent, Latin America and the Russian Federation)
saw a significant increase in their exports to China. Several exporters of manufactures in Asia
registered a sizeable slowdown of growth in their external trade. This was the result not only of
lower imports from Europe, but also of slower growth in some developing regions, in particular in
East Asia.
Imports by developed countries as a group remain below their pre-crisis level, and only by mid-2013
did their exports recover and slightly exceed their pre-crisis highs. On the other hand, exports from
the group of developing countries were 22 per cent above their pre-crisis peaks, while the
corresponding figure for their imports was 23 per cent higher (Chart 1). This continued growth
(although at much lower rates) of international trade and also GDP in developing countries led some
observers to pronounce their “decoupling” from the economic performance of developed countries,
and their adoption of a new pattern of export-led growth, with South-South trade becoming the
main driving force.3
South-South trade has indeed gained in importance, with its share in total developing-country
exports increasing from less than 30 per cent during the second half of the 1990s to more than 40
per cent in 2012. About half of this increase has occurred since 2008 (Table 3). However, rapid
growth in developing countries in 2010 was mainly due to their adoption of countercyclical
macroeconomic policies and their recovery from the slowdown (or recession) of 2009. Moreover,
their growth has been losing steam since then.
It should also be noted that much of South-South trade (close to three quarters) takes place within
3 Canuto O, Haddad M and Hanson G, "Export-led growth v2.0". Economic Premise No 3, Poverty Reduction and Economic
Management Network, World Bank, Washington DC, 2010
UNCTAD contribution to the G20 Framework Working Group 5
Asia, which is related to these countries’ strong involvement in international production networks.
Developed countries have generally been the final destination of goods produced in these networks
and much of their demand, such as on United States markets, depended on unsustainable policy
stances.4 As a consequence, the decline in exports from Asian supply chains to their developed-
country end markets sets a limit to manufactured exports between countries in East and South-East
Asia, and may explain the reduction of their share in total South-South trade. On the other hand,
primary commodities exports (especially those originated in Latin America and Africa) have increased
their share in South-South trade.
Taken together, there is little evidence to support the view that South-South trade has become an
autonomous engine of growth for developing countries. Rather, the close links between the
dynamics of South-South trade, on the one hand, and trade in primary commodities and trade within
international production networks (even ignoring the significant double counting that takes place in
networked trade), on the other, indicates that engaging in South-South trade has probably done little
to reduce developing countries’ vulnerability to external trade shocks. However, if developing
countries could shift to a growth strategy that gives a greater role to domestic demand growth, a
greater share of their manufactured imports would be destined for final use in their domestic
markets rather than being re-exported to developed countries. Such a shift could make the
contribution of South-South trade to output growth in developing countries more sustained and less
vulnerable to global shocks. And while developing countries’ rapid growth recovery in 2010, and their
continued rapid growth through 2012, supported historically high commodity prices and high levels
of trade in primary commodities, the more recent growth slowdown in these countries has
contributed to a decline in commodity prices and somewhat less favourable prospects for the export
revenues of commodity exporting countries.
Overall, the crisis brought to an end a two-decade long period in which world trade grew at rapid
rates, both in developed and developing countries: in particular, it expanded twice as fast (on
average) as global output between 2002 and 2007, which itself increased significantly. In 2012-2013,
not only did global output growth decelerate, but trade volume was growing at an even lower pace.
This general downward trend in international trade sets an unfavourable framework for strategies
aimed at recovering growth through expanding exports. It also highlights the vulnerabilities
developing countries continue to face at a time of lacklustre growth in developed countries. These
vulnerabilities are partly related to a slower progression in the volume of external demand, which
affects mainly the developing countries exporting manufactures, and partly to the evolution of the
terms of trade, to which commodity exporters are the most vulnerable.
2. Commodity prices and the terms of trade
Since the turn of the millennium, output growth in countries whose exports include a large share of
commodities has benefited from a significant improvement in their terms of trade. While a decline in
4 On a cautionary note, it should be borne in mind that the large amount of trade between geographically close countries
involved in international production chains results in considerable double-counting of South-South trade in manufactures, since the exports of countries participating in those chains generally have a high import content, and those chains play an important role in South-South trade.
Background note: macroeconomic strategies and trade from a global perspective 6
the world prices of certain manufactures has played some role, the bulk of this improvement has
been driven by the commodity price boom over the period 2002–2008 and another rapid rebound
following a sharp price decline in 2008–2009 (Chart 3). Countries whose oil and mineral and mining
products account for a sizeable share of total exports have generally experienced the largest terms-
of-trade gains since the early 2000s. On the other hand, manufacture exporters with significant
commodity imports experienced a decline in their terms of trade, while European countries and the
US show little changes, owing to a similar structure of imports and exports, both consisting basically
in manufactures (Chart 4).
Part of the rising trend in commodity prices reflects a structural shift in physical market
fundamentals. Rapid industrialization and urbanisation in some fast growing developing countries,
notably the large ones among them, have strongly increased these countries’ demand for
commodities. The upward trend in prices has also been supported by a slow supply response to these
demand changes, as historically low price levels in the 1990s had led to a long period of
underinvestment in production capacity for several key commodities, especially in the mineral and
mining sectors.
Projections about the further evolution of commodity prices are particularly difficult in the current
uncertain global economic environment, but there is little doubt that the growth outlook for both
developed and developing countries will have a significant impact on future commodity demand
trends. While economic activity in developed countries clearly has a direct impact on primary
commodity price developments, its largest impact may be indirect and linked to its effect on the pace
of industrialization and urbanization in developing and transition economies whose growth
trajectories have been supported by exports of manufactures to developed-country markets.
More generally, possible future commodity price developments are likely to depend to a large extent
on whether commodity prices are in a so-called “supercycle” – i.e. a trend rise in the prices of a
broad range of commodities which may last two decades or more – and if so, at what point in the
cycle they are currently situated. The current rising trend has been characterized by rapid economic
growth, industrialization and urbanization in a range of developing countries, among which China has
played a particularly strong role because of the large size of its economy and because of the nature
of its growth. It is for this reason that the recent slowdown in Chinese growth, as well as its process
of growth rebalancing that involves less reliance on exports and greater efforts to promote domestic
consumption, has reignited the debate on whether the expansionary phase of the commodity
supercycle might be coming to an end. The lower average annual commodity prices of 2012 and 2013
compared with those of 2011 could be considered an indication of such a possibility.
It is clear that prices will reach an upper limit at some point whereupon there will be demand
destruction, substitution and technological advances in search of greater efficiency of use, and/or
increases in supply as a response to high prices. However, the question is whether such a turning
point has been reached or whether the expansionary phase of the supercycle still has a number of
years to run. If indeed the turning point has been reached, an additional question is whether
commodity prices will plunge in the descendent phase of the supercycle, or whether they will remain
at relatively high levels. In the latter scenario, the rise in commodity prices should be seen more as
an upward shift than as the expansionary phase of a cycle.

UNCTAD contribution to the G20 Framework Working Group 7
Historical evidence shows that price trends have been closely related to the evolution of global
economic activity and aggregate demand, particularly for metals. Episodes of rising prices have
normally ended in price collapses when demand has fallen as a result of a deceleration of global
growth or a recession. A similar outcome could be expected in the current context if global economic
growth remains weak due to slow growth or stagnation in developed economies. However, the rise
in commodity prices over the past decade was strongly determined by developments in developing
countries. It is therefore the growth outlook for these countries that matters most for future
commodity demand trends. In particular, this implies that if large developing countries, most
importantly China, were to continue to rely on exports as a considerable source for growth, they are
very likely to experience a further deceleration of growth as a result of lower exports to developed
countries. This could in turn have a strong negative impact on commodity prices.
In addition to changes in physical market fundamentals, the broad-based surge in commodity prices
over the past decade has also been affected by substantial inflows into commodity-related
investment products.5 Financial investors have sought to diversify their portfolios by investing in
commodities as part of a broader strategy aimed at reducing their concentration on equities, bonds
and currencies. The change in strategy of financial investors was based on historical evidence which
suggests that, over the long run, a broader portfolio composition improves investors’ risk-return
performance.6 However, recent evidence (discussed below) suggests that adding commodity futures
to their portfolios no longer helps investors hedge against either equity or currency market risk.
Identifying the extent to which financial investment has affected the level and volatility of
commodity prices is challenging due to the limited transparency and level of disaggregation of
existing data. However, there is evidence to support the view that financial investors have affected
price dynamics in the short term and caused commodities to behave as an asset class.7 Financial
investment subjects commodity prices to movements unrelated to commodity market fundamentals
because financial investors usually have little interest in commodity-specific information and base
their decisions on news from equity and currency markets. Financial investment therefore causes a
co-movement of prices on commodity, equity and currency markets and the related uncertainty on
the actual sources of price movements that such behaviour will cause for commodity market
participants is likely to trigger herding and ignite commodity price bubbles.8
From the evidence on the correlation between the returns on broad-based investment in
commodities and those on equity investments (Chart 5), it would seem that a positive correlation
emerged only in the run-up to the current financial crisis, and that it became accentuated only in its
5 For evidence, see “G20 Study Group on Commodities, Contribution by the United Nations Secretariat”, April 2011,
available at http://unctad.org/en/Docs/webgds2011_g20d05_en.pdf. 6 Gorton G and Rouwenhorst KG (2006). Facts and fantasies about commodity futures. Working Paper No. 10595, National
Bureau of Economic Research (NBER), Cambridge, MA, March. 7 For broader discussion of the debate on the price impact of financial investment, see the Report by the G20 Study Group
on Commodities available at http://www.cmegroup.com/education/files/G20Nakaso-November202011.pdf, as well as UNCTAD’s Trade and Development Reports (TDRs) 2008, 2009 and 2011, which focus on the role of information in price discovery on commodity markets. A recent review of the academic literature on how financial investors affect risk sharing and information discovery in commodity markets concludes that financialization has substantially changed commodity markets through these mechanisms: Cheng IH and Xiong W (2013). The financialization of commodity markets. Working Paper 19642, National Bureau of Economic Research (NBER), Cambridge, MA, November; available at http://www.nber.org/papers/w19642 . 8 For evidence, see “G20 Study Group on Commodities, Contribution by the United Nations Secretariat”, April 2011,
available at http://unctad.org/en/Docs/webgds2011_g20d05_en.pdf, as well as Chapter V in TDR 2011.
Background note: macroeconomic strategies and trade from a global perspective 8
aftermath. However, it is well known that the greatest benefits from investing in commodity futures
are derived from diversifying across not only different commodity categories but also individual
commodities.9 Because the Standard and Poor’s Goldman Sachs Commodity Index (S&P GSCI) is
heavily weighted in energy, it is possible that the evolution of this correlation during the early 2000s,
and especially in strongly negative numbers in 2003, was strongly influenced by events in energy
markets, and especially by the war in Iraq in 2003. Thus it is useful to examine the correlation
between returns on non-energy commodity futures and equity investments. That correlation began
to increase already in the early 2000s, well before the onset of the current crisis, as reflected in Chart
5 on the basis of the non-energy version of the Dow Jones Union Bank of Switzerland Commodity
Index (DJ UBSCI).
Such greater positive correlation between returns on commodity futures and investments in other
asset classes has also emerged, perhaps even more strongly, with respect to currency markets. It is
common knowledge that dollar-denominated commodity prices often move in the opposite direction
to the dollar exchange rate. This is because a lower value of the dollar makes commodities cheaper in
non-dollar consuming areas, thereby increasing incentives to consume, while it reduces the revenues
of producers in non-dollar areas, thereby increasing incentives to produce. This mechanism may well
explain part of the increased negative correlation between returns on the S&P GSCI and the dollar
exchange rate index, which began in the early 2000s (Chart 6).
Indeed, this is consistent with the growing demand for commodities from emerging economies in a
period of dollar depreciation.10 However, the abrupt character and sizeable size of this shift, the fact
that it occurred in 2002–2003, i.e. when financial investment in commodity markets started to
increase rapidly, and that another similar shift occurred in the wake of the current crisis suggest that
other factors have contributed to this development. An additional factor is most probably the
emergence of carry-trade speculation. In 2002–2004, there was a substantial change in the
correlation between returns on commodity futures and the exchange rates of currency pairs that
have been popular with carry-trade speculators (as shown in Chart 7 for a number of selected
currency pairs). This positive correlation clearly increased in the run-up to the peak in commodity
prices in 2008, became fairly strong after the onset of the current crisis when there was a general
process of deleveraging across different asset classes, and was further accentuated following the
adoption of the second round of monetary easing by the United States Federal Reserve in the second
half of 2010.
However, since June 2013, when financial market participants started to widely perceive that the
Federal Reserve would slow-down the pace of quantitative easing, these correlations have declined,
and by the end of 2013 returned to levels that existed prior to monetary easing. The fact that there
have been two shifts, rather than just one, in the correlation between returns on commodity
investment on the one hand and equity and carry-trade investment on the other indicates that
monetary easing has only accentuated cross-market correlations. By the same token, the tightening
of monetary conditions can be expected to merely eliminate the source of the second shift in the
cross-market correlation, but it is unlikely to eliminate the financialization of commodity markets
9 Basu P and Gavin WT (2011). What explains the growth in commodity derivatives? Federal Reserve Bank of St. Louis
Review, 93(1): 37–48. 10
For evidence on this relationship, see Tang K and Xiong W (2012). Index investment and financialization of commodities, Financial Analysts Journal, 68(6): 54–74.
UNCTAD contribution to the G20 Framework Working Group 9
altogether and bring cross-market correlations back to where they were at the end of the 1990s.11
While new regulatory pressures may have reduced the interest of financial investors in commodity
markets, their shift to different investment vehicles implies that the need for tighter regulation of
financial investment in commodities has lost nothing of its pertinence.12
C. Trade performance under constrained macroeconomic
conditions: the challenge for the G20
The patterns of trade volume and prices reviewed above are not encouraging. Global trade activity
remains subdued, commodity price movements remain uncertain with fundamentals clouded by the
pressures from financial markets, while the correlation between commodity futures and other
financial markets also influences foreign exchange determination which is critical for trade
performance. As noted above and in other UNCTAD studies, this uncharacteristic price formation in
commodity, forex and equity markets tends to distort resource allocation, monetary policy and more
generally the process of development in many countries.
The observed global trends in trade result from the agglomeration of country responses to the
macroeconomic constraints they face in the pursuit of their growth strategies. Subsection 1 explored
a typology that could shed light on the rationale of such responses. In the next sub-section this
analysis is subject to the question of whether such responses do in fact add up to the best outcome
when analysed from the perspective of the world as a whole. From this perspective, a set of targets
for global growth and reduced global imbalances is tentatively proposed (rather than ‘gaps’ in
relation to individual country benchmarks). Using a modelling approach it is possible to indicate the
nature and degree of policy responses to ensure a global recovery by focusing on the policy
instruments considered in the model simulation itself. This exercise will show that despite some ad
hoc moves in the right direction, more decisive steps forward are necessary, for which a far greater
effort of coherence and international policy coordination is key. Sub-section 3 brings in the necessity
of enhancing efforts towards financial regulation to pave the way for a sustained and stable recovery
of trade and growth.
11
For further discussion, see Chapter V of TDR 2011, which anticipated these developments in correlations (pages 132–133). 12
See, e.g., United Nations, World Economic Situation and Prospects 2013, Box II.2: “Financial investment and physical commodity holdings”, available at http://www.un.org/en/development/desa/policy/wesp/wesp_current/wesp2013.pdf.

Background note: macroeconomic strategies and trade from a global perspective 10
1. Macroeconomic goals, constraints and their relation to trade: a typology.
Before defining a typology of differentiated country responses over the most recent period, it is
worth stressing that at the peak of the crisis and up to 2010 there were strong common factors
driving the behaviour of private and of public sectors in most countries.
At the peak of the financial crisis the central preoccupation of private sector institutions in major
economies was the adjustment of spending to correct financial imbalances. As is well-known, before
the crisis the private sector in a number of major economies had assumed heavy debt burdens which
were sustainable only to the extent that rising asset prices could continue to maintain healthy
balance sheets. But following the asset price collapse households and firms were forced to restrain
spending in order to regain balance sheet strength. Hence, the contribution of consumption to
growth was negative for most developed countries of the G20 during 2009, affecting as well
investment. In other cases, like in Argentina, Australia, Canada and France, private spending had a
low or negligible contribution to growth, Among G20 countries, only Brazil, China, India and
Indonesia exhibited a significantly positive contribution of private spending to growth, resulting from
targeted stimuli (most notably China, where a quick policy response privileged investment). In the
aggregate, the combined deterioration of consumption and investment has been, and to an extent
remains, a dominant factor behind the fall and subsequent deceleration of imports worldwide. This
kind of adjustment could be said to be rational from the perspective of households and firms seeking
to stabilise their individual balance sheets.
Without countervailing measures, the contraction of consumption and investment, and in turn of
import volume, would have persisted far beyond the crisis in a subset of the major economies such
as the United States, the United Kingdom and some Euro Area countries in which imbalances in their
financial sectors were highest. The deflationary downside cycle that would have followed was short-
circuited by the policy response of governments, injecting fiscal and monetary stimuli. This was not
only a rational response of countries individually, but it also translated into a coherent outcome in
the aggregate, to which in part the G20 can take credit. At the risk of belabouring this point, the
confluence of expansionary policy responses was embraced by most countries, not only those most
heavily affected by systemic financial threats, and its initial success owes much to a high degree of
collective action. The rapid revival of trade by 2010 can be almost fully explained in this light.
From 2011 onwards, with the world economy and global trade showing only weak signs of recovery,
the diversity of country-specific goals and macroeconomic constraints has lent itself to a much more
fragmented international response.
a. Deficit countries pursuing fiscal adjustments
By 2011, the preoccupation with the large fiscal imbalances that emerged as a result of the lower
revenues, fiscal stimuli and bank bail-outs was high in some countries. The contributions of
government spending to growth were halted or quickly reversed in the UK, as well as several
eurozone countries, including Greece, Ireland, Italy, Portugal and Spain. In the US, despite the
Federal efforts to persevere with the fiscal stimuli, considerable drawbacks emerged at state and
local government levels. In Mexico, where some government spending programmes were preserved

UNCTAD contribution to the G20 Framework Working Group 11
for longer, some degree of tightening affected investment. Australia, meanwhile, started to unwind
the fiscal spending stimulus only in mid-2012, thus allowing itself more traction from other sectors,
and a relatively more robust trajectory.
UNCTAD and other international institutions, including the IMF, have questioned whether a
generalized shift towards austerity was propitious and of the right measure. It was further argued
that multiplier effects will adversely impact other components of demand and eventually imports
and global trade, and making the adjustments self-defeating from a global perspective. Yet, given the
uncertainties of the time, and, for the Euro Area in particular the institutional constraints on
government borrowing, it could be argued that the shift towards contractionary adjustment was
understandable, even if the chance of succeeding without significant costs was unlikely. The
aspirations of individual countries not-withstanding, it seems clear that the weakening of global
demand and trade took hold from the turn-around of fiscal policy stances in 2011.
b. Fiscal tightening in countries with more policy space
The shift of fiscal policy stance from stimulus to adjustment (or contraction) was assumed by several
other countries not directly or not so gravely affected by fiscal imbalances as those mentioned above.
Within the G20, Canada, France and Germany would fall into this category, promoting a partial
unwinding of fiscal stimuli. In the case of Indonesia, a deceleration of government spending was off-
set with continuing investment and credit programmes. Several other countries not members of the
G20 adopted early austerity measures as well.13 Excepting a few cases where a tightening of
spending was successfully compensated with other measures, an inspection of contributions of
demand components to growth suggests that the transmission from slowdown or contraction of
fiscal spending since 2011 to other components of domestic spending and eventually imports was
tangible and had some relevance in the weakening of global demand.14 Yet, from the perspective of
individual countries it was difficult to resist the shift to austerity especially given the influence
exercised by financial markets, often cajoled by rating agencies (which nonetheless failed in
detecting tangible risks during the excessive leverage that led to the global crisis). From the
perspective of a single country facing such pressures, it seems understandable that many countries
prematurely followed the austerity path.
c. Countries maintaining or expanding export surpluses
With fiscal tightening taking hold of many countries, the concern of UNCTAD, shared by other policy-
makers and observers, is how to engineer a recovery led by greater domestic spending in surplus
countries. The recommendation for countries in surplus to increase expenditure in times of global
imbalances and weak growth in order to avert the recessionary adjustment by indebted countries
has a long tradition in economics. Keynes’ Economic Consequences of the Peace (1919), debates at
13
Ortiz I and Cumings M. "The age of austerity: a review of public expenditures and adjustment measures in 181 countries". Working paper, Initiative for Policy Dialogue and the South Centre, New York and Geneva, 2013. 14
These transmission mechanisms have been sufficiently explored by different traditions, including the underlying model of the so-called ‘monetary approach to the balance of payments’ (see for example Polak J, 'Monetary Analysis of Income Formation and Payments Problems', IMF Staff Papers, vol. 6, pp 1-50, 1957; and Polak J, 'Fifty Years of Exchange Rate Research and Policy at the International Monetary Fund', IMF Staff Papers, vol. 42, pp. 734–761 (1995) 1995).

Background note: macroeconomic strategies and trade from a global perspective 12
Bretton Woods in 1944, and the discussions leading to the London Debt Agreement (1953) may be
good examples. In the more recent period, similar calls were made, notably by the IMF and the US
Treasury.15 Yet, a global reflation driven by surplus countries has not been the dominant direction
taken by the world economy and it will be important to understand why the policy objectives and
constraints of surplus countries have led to a different direction or a weaker stance than needed.
Using as a metric the average of the last three years, less than half of the countries of the G20 show
current account surpluses: China shows an average surplus of about 2 per cent of GDP, Germany
about 7.0 per cent of GDP, Japan about 1.5 per cent, the Russian Federation about 4 per cent, and
Saudi Arabia about 22 per cent of GDP (see Table 4).16 Among these, Germany, Republic of Korea and
Saudi Arabia achieved comparable surpluses than in the boom period of 2004-07. In the latter two
countries, and generally for developing countries, the achievement of export surpluses, with the
implied accumulation of foreign reserves, may be functional to their development goals and reduce
the exposure to external shocks. Economic development and diversification require a sustained pace
of investment and social expenditure but in far too many instances these processes have been halted
when foreign exchange constraints were binding. Saudi Arabia and more generally exporters of
commodities or energy have typically been threatened by trade shocks. And such shocks turn more
uncertain and potentially more disruptive in conditions of global financial instability, as suggested in
section B.2 above. What is more, when an economy remains heavily dependent on a small subset of
non-renewable products, or products whose value could be adversely affected by technological
advances in their extraction or the production of substitutes, net-export surpluses provide financial
resources to build robust stabilization funds. In the absence of alternative frameworks for the
stabilization of commodity prices and for the promotion of industrialization strategies, to which we
will turn below, it seems understandable that Saudi Arabia or countries of similar structure and
conditions aim at maintaining trade surpluses.
Republic of Korea, and like some industrializing developing economies, may share with primary
exporters the need to secure export revenues in order to feed the process of post-industrial
development, but its constraints and potential risks cannot be said to be comparable to those of
primary producers. Rather, Republic of Korea seems to operate in a relatively vulnerable
environment for different reasons. In particular, its banks vulnerability to foreign finance remains a
concern; and such concern has been exacerbated in the wake of the potential for financial instability
that could result from the US Fed tapering. These are non-negligible risk factors and in this context it
may be understandable that this economy and others in similar a condition aim at keeping a room for
manoeuvre on their external accounts.
Germany’s economic model has typically relied heavily on export performance. During the financial
crisis the economy became swiftly affected by the contraction of global exports but net-exports
recovered equally rapidly. It is argued that the export success owes to a continuingly restrictive fiscal
stance and wage depreciation. By these means domestic demand, and thus imports are relatively
restrained, while price competitiveness of exports rise or is maintained. Besides, by adhering to a
15
See: IMF, World Economic Outlook - October 2009. Sustaining the Recovery. Washington DC: International Monetary Fund; IMF, World Economic Outlook - October 2013. Transitions and Tensions. Washington DC: International Monetary Fund; and US Treasury, Report to Congress on International Economic and Exchange Rate Policies. U.S. Department of the Treasury - Office of International Affairs, October 30. 16
The European Union as a whole has achieved an average surplus of nearly 1 per cent of its GDP but we will not consider this case in discussing country strategies and constraints.
UNCTAD contribution to the G20 Framework Working Group 13
tight fiscal stance it is often argued that inflation is contained, contributing to the depreciation of the
real exchange rate. In the stated policy priorities little consideration had deserved the question of
whether this strategy, which yields persistently high current account surpluses, may impinge on the
growth prospects of Germany’s trading partners. Only recently the data show a considerable
stagnation of Germany’s exports. Against this background, there are indications of a small change of
direction of policy, translated into some degree of wage increases and more public investment in
education and infrastructure (which may or may not turn to be ‘fiscally neutral’ as neither rises of
taxation or of public debt are contemplated ex-ante). Thus, a shift of this nature, even if possibly in
the right direction, may not be sufficient to represent a meaningful reduction of Germany’s large
external surplus.
More generally, it could be argued that from a single country perspective a sensible strategy may
consist of: ensuring a reduction of costs including labour, increasing competitiveness, improving
flexibility of the labour force, eventually allowing net exports to increase demand and gain
technological progress on the back of the economies of scale achieved by trade. This may not be
consistent with the expansion of net-exports elsewhere, may not lead to higher competitiveness
overall (as competitiveness is a relative measure), and wage compression and labour flexibility may
not trigger a rise of income that can translate in a comparable rise of demand. But these problems
may arise on the aggregate. Individually some countries may succeed, provided that others lose.
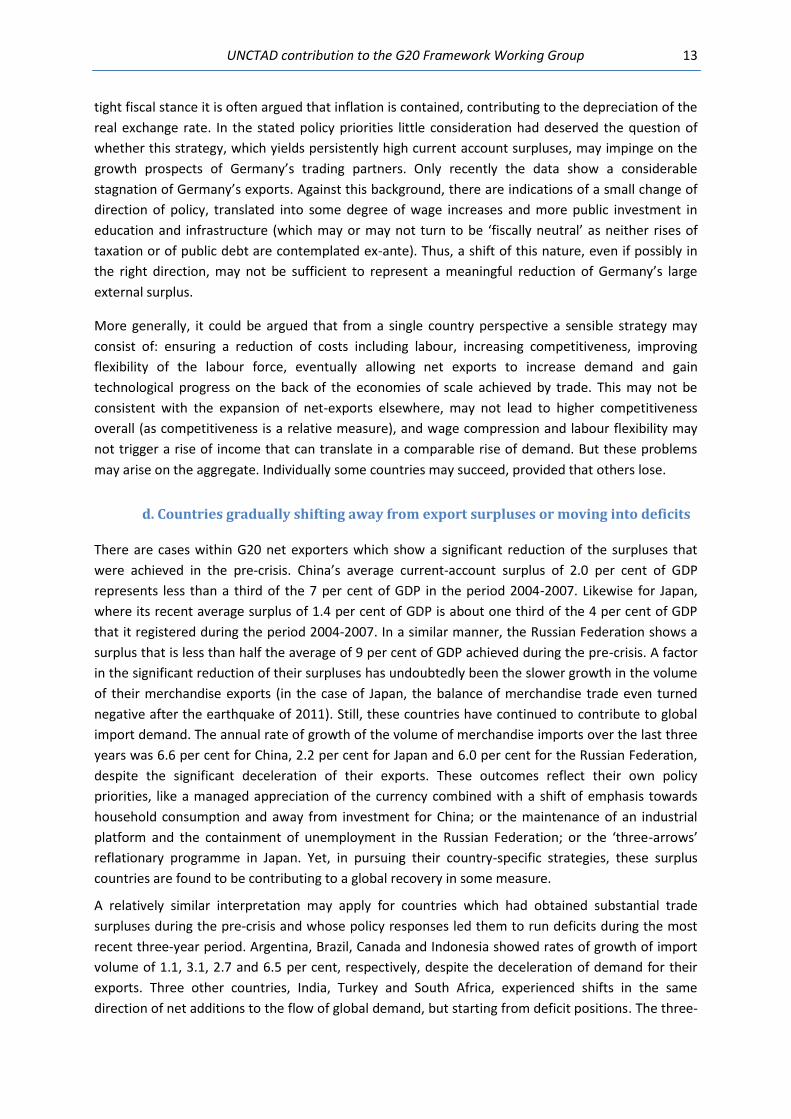
d. Countries gradually shifting away from export surpluses or moving into deficits
There are cases within G20 net exporters which show a significant reduction of the surpluses that
were achieved in the pre-crisis. China’s average current-account surplus of 2.0 per cent of GDP
represents less than a third of the 7 per cent of GDP in the period 2004-2007. Likewise for Japan,
where its recent average surplus of 1.4 per cent of GDP is about one third of the 4 per cent of GDP
that it registered during the period 2004-2007. In a similar manner, the Russian Federation shows a
surplus that is less than half the average of 9 per cent of GDP achieved during the pre-crisis. A factor
in the significant reduction of their surpluses has undoubtedly been the slower growth in the volume
of their merchandise exports (in the case of Japan, the balance of merchandise trade even turned
negative after the earthquake of 2011). Still, these countries have continued to contribute to global
import demand. The annual rate of growth of the volume of merchandise imports over the last three
years was 6.6 per cent for China, 2.2 per cent for Japan and 6.0 per cent for the Russian Federation,
despite the significant deceleration of their exports. These outcomes reflect their own policy
priorities, like a managed appreciation of the currency combined with a shift of emphasis towards
household consumption and away from investment for China; or the maintenance of an industrial
platform and the containment of unemployment in the Russian Federation; or the ‘three-arrows’
reflationary programme in Japan. Yet, in pursuing their country-specific strategies, these surplus
countries are found to be contributing to a global recovery in some measure.
A relatively similar interpretation may apply for countries which had obtained substantial trade
surpluses during the pre-crisis and whose policy responses led them to run deficits during the most
recent three-year period. Argentina, Brazil, Canada and Indonesia showed rates of growth of import
volume of 1.1, 3.1, 2.7 and 6.5 per cent, respectively, despite the deceleration of demand for their
exports. Three other countries, India, Turkey and South Africa, experienced shifts in the same
direction of net additions to the flow of global demand, but starting from deficit positions. The three-

Background note: macroeconomic strategies and trade from a global perspective 14
year average growth of import volume of 6.0, 3.0 and 3.3 per cent, respectively for India, Turkey and
South Africa, are remarkable considering the deterioration in their current account balance,
contributing to demand elsewhere. Either private agents were seizing the opportunity of funds made
available through international markets to increase spending, or policy-makers were responding to
pressing domestic policy priorities, such as the continuation of social and infrastructure spending, or
were generating employment and promoting credit to sustain domestic spending, or were coping
with binding constraints. Yet, it will be difficult to argue that without a sustained recovery in their
export markets these policy strategies could last.
e. The case of liquidity injections
In countries like Japan, the United Kingdom, the United States, and the Euro Area as a whole,
monetary injections became over the last three years essential pieces of their policy toolkit. The
assessment about the appropriateness of these measures has been manifold. Very few
commentators would dispute that it was necessary to contain the deterioration of balance sheets of
systemically important institutions. Critical views have stressed lack of coherence resulting from
absence or weakness of complementary measures like enhanced regulation of the financial system,
or more active fiscal policy to ensure that injections generate real demand, or more targeted credit
policies to revitalize production and employment creation by credit-constrained agents, etc. Another
set of concerns embraces similar criticisms on the international sphere, cautioning about potential
spillover effects into unfettered global financial markets. As UNCTAD has argued, such spillover
effects on portfolio behaviour, price formation, international trade and countries’ policy space can be
serious, even if they are not the only source of global financial instability (see section B.2 above).
Regarding the implications on global demand and trade, liquidity injections of this kind are not
neutral either. Without these flows the financing of demand by deficit countries like those described
above would become more challenging or would force drastic adjustments with recessionary risks.
But without regulation the same flows could be disruptive or cause countries to fall into debt-traps; a
subsequent reversal of capital flows would be even more costly. With a proper long term horizon
capital flows can be a support for development, but short term and speculative allocations can add to
instability, from both their entry and exit. Similar considerations apply when such liquidity injections
are retained within a country’s border. Properly channelled and regulated, credit for the promotion
of investment and employment can be the linchpin of a sustained economic recovery. But
unregulated and turned into speculative portfolios, would mostly lead to asset bubbles and
unsustainable debt overhangs. Yet, it should be mentioned that from the individual perspective of
the issuer of such injections their necessity was justifiable, even if in the aggregate and in
combination with other measures (or their absence) there can be adverse implications for the stable
growth of demand and trade.

UNCTAD contribution to the G20 Framework Working Group 15
2. Targets, ‘gap analysis’, and policies from a global perspective
a. The aggregation of country responses to the crisis is either not conducive to the
recovery of trade and growth or is unsustainable
The sets of individual country policy goals and strategies discussed above could in principle be the
basis for the specification of benchmarks against which to measure gaps and suggest policy actions.
But as suggested, the assumed policy agendas are not fully coherent from an aggregate perspective
and over time.
By simply aggregating the policy strategies laid out above, the likely global scenario is one of a
protracted and weak recovery (ruling out ex-ante shocks and systemic crises).17 Despite the positive
contributions to world demand by a few countries highlighted above, if overall the burden of
adjustment is left to expenditure reductions in deficit countries, the global impact is deflationary. The
contraction of spending that starts in deficit countries spreads onto income of their trading partners
via reduced imports and forces harsher adjustments over time. Likewise, the adjustment by pursuing
export gains based on squeezing labour costs is eventually counterproductive because one country’s
wages and incomes from production are the ultimate driver of a sustained growth of demand in one
country and its partners. With demand falling, production and income follows, causing a series of
negative feedbacks between partners. This kind of process can be sharper if partners enter in a race
to the bottom to reduce costs and wages.
Such a scenario is not a prediction but rather a globally-structured conditional outcome. It is
delineated on basis of the current state of the world economy and the estimation of behaviour and
policy responses to the country strategies summarized above. Even if the timing and intensity of
changes remain uncertain, the empirical estimation suggests that such strategies cannot be the basis
for achieving a sustained growth recovery for the world as a whole. If gaps were defined with respect
to the expected achievements out of the mentioned individual country strategies, over time the gaps
would be widening for most cases.
A different scenario may perhaps materialize. Some countries may succeed in adjusting by
contraction of spending and by achieving greater cost and labour competitiveness, provided that
other countries shift into faster domestic spending encouraged by asset appreciations and over-
indebtedness. This is not a purely theoretical possibility. Given the record stock market appreciations
experienced over the last two years in major markets, and housing appreciations in some developed
and emerging economies, it is not unthinkable that a new cycle of credit creation, spending and asset
bubbles might be taking place in a few economies. For instance, if real estate prices pick-up
considerably in the US, debt-driven consumption may start to resume again supported by
appreciations in stock and housing markets. A similar configuration could perhaps materialize in the
17
The empirical estimation was generated with the UN Global Policy Model. It is described in: http://www.un.org/en/development/desa/policy/publications/ungpm/gpm_concepts_2010.pdf. The version used here – number 5b – incorporates employment and functional distribution of income and their feedbacks into the macro and global economy. The full technical description of the model, version 3, can be downloaded from: http://www.un.org/en/development/desa/policy/publications/ungpm/gpm_technicaldescription_main_2010.pdf. An update will soon be available through the UNCTAD site.

Background note: macroeconomic strategies and trade from a global perspective 16
UK, where stock and housing markets have been on the rise and private sector spending is growing at
a slightly faster pace than income. Other countries which might follow this pattern could perhaps be
Australia, Indonesia and South Africa, where increased correlations can be observed between
domestic credit creation, stock market prices and an incipient rise of consumer demand. Whether
excess demand over income from this subset of countries will be enough to pull the global economy
into a spending spree and generate sufficiently fast growth is very uncertain at this moment. But in
that case the configuration of global demand will likely resemble the formation of external and
internal imbalances that led to the global crisis.
If such a scenario was to materialize, it would be unsustainable even if for some period it could
deliver more acceptable growth rates than the one sketched above. But to the extent that such
would be an unsustainable process and with a likely devastating outcome, it does not serve as a
guide from which to draw policy recommendations.
There is a non-irrelevant implication from this. If the prospects of a scenario of resuming global
imbalances cannot serve as a guide for policy analysis, it will as well be misleading to define policy
gaps, and trade gaps, in particular, drawing trends that are based on the patterns of the pre-crisis
period when global imbalances were at their peak.
b. Defining the policy gaps based on feasible targets for the world as a whole and
on the identification of mechanisms of adjustment: a modelling approach
As a group and for each country individually, the contribution of the G20 to a global recovery cannot
be a ‘collection of disparate country measures’. A globally integrated approach is required, set out as
a coordinated set of measures.
The diagnostic proposed above suggests that a sustained recovery of trade is intrinsically related with
the growth of global demand and with stability in the formation of main prices. It also warns of the
negative effects that may arise if a resurgence of global imbalances or waves of financial instability
were allowed. Hence, from a global perspective it seems sensible to set targets of growth and the
evolution of main prices and financial balances, and make their achievement subject to the
underlying macroeconomic dynamics of countries and their global interrelations. Gaps could be
analysed by comparing desired/feasible targets with a baseline represented by the conditional
scenario of slow growth derived from current policy stances, as discussed above. The targets are set
out ex-ante and can be modified; in this sense the model outcome should be interpreted as an
empirical example to guide the policy analysis.
Model simulation outcomes are first presented by some critical global variables in chart 8. The model
generates the pace of global growth, trade, investment, etc. by a target-instrument approach.
Targets and instruments operate at a country level but the global outcome results from the dynamic
interactions of demand, supply, prices and financial conditions. Endogenous constraints play a critical
role in the feasibility of outcomes in the usual manner. As capacity utilization starts to bind, or as
excess demand for international goods surges, prices, supply and technical progress responses
emerge. The global growth rate, fully detailed at country or group level in chart 9, is economically
feasible. It requires, among other assumptions explained below, a faster and stable rate of growth of
investment, which together with the rise of productivity triggered by greater demand helps averting

UNCTAD contribution to the G20 Framework Working Group 17
a narrowing of the output gap. To achieve the global patterns of growth, trade, investment and
capacity utilization presented, it was also necessary to assume away perverse effects of
financialization on prices of commodities and energy, as well as exchange rates. This requires
attention to the international financial architecture and financial regulation, as discussed above.
The evolution of global imbalances is captured in chart 10, and the country-by-country external
performance is shown in chart 11. These two charts confirm that a genuine growth recovery
necessitates a decisive contribution of surplus countries to feed into global demand. Accordingly, the
model solution proposed ceilings/floors for current account positions of the different countries
depending on their initial conditions. The ceilings/floors were empirically designed to be reached
over the mid-term, as changes in production and distribution patterns take time. The instruments at
work included income redistribution and employment protection policies, as well as exogenous
changes in components of aggregate demand, subject to constraints on the evolution of net savings
or net borrowing positions of institutions, as well as on domestic price inflation. As these constraints
start to bind endogenous responses in the determination of exchange rates emerge. Chart 12 shows
that stable and small changes in real exchange rates were contributing to a smooth correction of
external imbalances even if economic growth has accelerated. Like in the case of formation of
commodity prices, to achieve stable and well-behaved foreign exchange markets, effective action is
required in the areas of financial and capital account regulation.
Other areas of policy action that were considered to achieve faster growth of trade with narrower
imbalances were trade and industrial policy. Industrial policy was assumed to contribute to the
process of diversification and structural transformation in the course of development. Trade policy is
envisaged in the UN GPM as a way to trigger exogenously greater access to markets in industrialized
countries by non-agricultural products of countries in the process of industrialization, as originally
conceived in the Doha Round. Similar effects can be assumed to result from experiences of South-
South integration.
The assumptions regarding fiscal policy are implied by charts 13 and 14, showing respectively
government spending and public sector borrowing requirements relative to GDP. Spending acts as an
instrument for the growth of demand and is tuned to achieve growth or external balance targets,
depending on the country case and on the degree of influence of other instruments like income
distribution or investment programmes. Chart 13 shows that in some cases government spending
grows at a faster pace of GDP, particularly when the economic growth challenge is demanding and
the private sector remains in a somewhat more critical financial position. In the cases of Germany,
Central America and Mexico, Indonesia and South-Asia (to a lesser extent), government spending
acts as a means to increase total investment.
In the UK, some Euro Area countries and Brazil, government spending in goods and services rises at a
considerably slower pace than GDP, even denoting a small contraction in real terms in the initial two-
to three years of the simulation. Under the proposed conditions of these simulations a small
adjustment of spending in real terms was assumed during the first two to three years of the
projection period, which then was followed by a sustained increase. The slower pace of spending in
goods and services was partly compensated with an implied increase in transfers and social
provisions which in some of these countries was perceptibly affected. An adjustment of spending
seemed necessary as these countries experienced high deficit ratios, but debt-stabilization could

Background note: macroeconomic strategies and trade from a global perspective 18
have been achieved equally with stable trends of spending but higher taxation. Either way, it ought
to be underlined that fast economic growth was sustained throughout by means of a significant
injection from net exports, which could not have happened spontaneously and required significant
contributions of surplus countries to add to global demand.
Chart 14 confirms that all countries achieve stable and manageable financial positions of the public
sector, despite most of them increasing spending at a faster pace than GDP while GDP accelerated.
This is derived from three factors. First, it is the deficits with respect to a faster GDP that make the
ratio to GDP smaller. Second, faster growth of GDP causes faster growth of government revenues.
Third, additionally an assumption is made to increase direct tax rates (presumably with a progressive
agenda to preserve income of those with greater propensity to consume) in order to stabilize fiscal
deficits in the mid-term. The patterns of government spending and fiscal deficits of the two
simulations can be used as a ‘gap analysis’ to guide policy action.
Finally, the remaining critical assumption is captured in chart 15, the functional distribution of
income. In this case the direction of change is unequivocal and uniform across all countries. Labour
income share has to rise after having fallen for several years in most countries. In some cases, like
Canada, the UK, Germany, North European countries and the CIS there was a small and temporary
step-increase during the crisis. This represents a mix of on the one hand, the initial hit that profit-
makers absorb until the burden is transferred to workers and, on the other hand a pro-active policy
response. In some other cases, in South America and lower-income countries of Africa,
improvements in labour remuneration have been taking place before the crisis. This not-
withstanding, there is a need for further and considerable improvements in labour income
distribution as a means to trigger a revival of consumption, investment and trade. In all countries or
groups the change in the ‘wage-share’, was set out as an instrument to contribute to the global
recovery, contrary to the belief of many observers that wages have to fall to cause a rise of
investment and trade. The outcomes presented here confirm that the consistent aggregation of
positive changes in labour remuneration yield the desired result. What is more, of all the instruments
used in this simulation to achieve a faster growth of GDP and trade, this seems to be the one for
which the highest degree of coordination is required. The impact of increases of the wage share on
GDP and trade would be significantly weakened if it was promoted by a country in isolation. In the
current context, some of the gains in domestic demand derived from raising labour income at par
with productivity may be eroded by external competition from countries where production costs
remained depressed. In other words, this is the area which requires the most decisive coordination
efforts by G20 leaders.
Turning to one of the central prescriptions about the role of surplus countries in a global recovery, it
is worth noticing that the narrowing of surpluses of typical net-export performers in these
simulations did not come at the expense of slower growth, rather the contrary. Neither had export
performers contracted exports. In essence, these results were achieved by greater domestic demand
triggered by exogenous stimuli to investment and/or government spending, as well as by changes in
the distribution of income favouring sectors with higher spending propensities. As neither inflation
nor financial imbalances of domestic institutions moved beyond standard thresholds, growth
proceeded undisturbed.

UNCTAD contribution to the G20 Framework Working Group 19
In sum, this simulation exercise shows that the promotion of trade is a task that comprises a complex
set of policy measures, given the fact that the promotion of a stable and vigorous pattern of trade is
intrinsically related with a continuing growth of demand as well as with the narrowing of external
imbalances and, by extension, of financial balances of domestic institutions. The outcomes of the
simulations can well serve as a guide for policy action. For each target and instrument considered
above, GDP growth, current account balances, government spending and deficit in relation to GDP,
and the remuneration of labour, there is a gap to fill. The quantifications proposed are, as in any
model, approximate and subject to further investigation, but the directions of the required changes
seem unequivocal. Above all, international policy coordination is essential and on this front the G20
has also a gap to fill.
3. Better regulation for reducing commodity price volatility
Looking ahead, reducing price volatility will be important for commodity-exporting developing
countries if they are to profit fully from the relatively high price levels of recent years. This would
require a better regulation of commodity markets.
While new regulatory pressures may have reduced the interest of financial investors in commodity
markets, their shift to different investment vehicles implies that the need for tighter regulation of
financial investment in commodities has lost nothing of its pertinence. New regulatory measures
have been initiated mainly with a view to increasing transparency in derivatives trading and
encouraging better risk management on the part of private market participants and undertaken
through the Dodd-Frank Wall Street Reform and Consumer Protection Act of 2010 (the Dodd-Frank
Act) in the United States and agreements on revising the Market in Financial Instruments Directive
(MiFID) and the Markets Abuse Directive (MAD) in the European Union. The adoption of more
stringent regulatory measures, such as the widening of position limits rules, have been delayed in the
European Union, where the so-called “trialogue process” of negotiations between the European
Parliament, the European Commission and the Council of Ministers is on-going, and in the United
States because of the very large number of comments that the US Commodity Futures Trading
Commission (CFTC) had received on its initial proposal, presented in 2011. On 5 November 2013, the
CFTC approved a revised position limits rule, as well as a rule on the data aggregation of positions
across borders designed to prevent regulatory evasion by trading through foreign affiliates. These
proposals have been published in the Federal Register and are open for comments until 10 February
2014. Allowing regulators to verify cross-border compliance to position limits has been a major issue
and regards disagreement as to whether global entities can be regulated effectively by their
adherence to voluntary principles, as is currently the rule, or whether national regulators should be
allowed to oversee trading of foreign affiliates.
In addition to this disagreement, the setting of any position limit faces the challenges of specifying
maximum numbers and determining where exceptions for commercial users apply. The latter has
become increasingly difficult as commercial users have engaged in financial trades and financial
investors have come to hold and trade physical commodities. A key problem of financial agents
trading physical commodities, or using investment vehicles that are collateralized through physical
Background note: macroeconomic strategies and trade from a global perspective 20
inventories, is that the related inventories of physical commodities generally remain unreported. The
ensuing information asymmetry in the market makes it impossible for commercial market
participants to determine the price that would solely reflect supply and demand fundamentals. Such
cases may result in significant short-term price volatility. As previously argued by UNCTAD, such
situations are reminiscent of currency markets and, just as central banks that intervene in foreign-
exchange markets, market authorities in charge of commodity market surveillance could be
mandated to intervene directly in exchange trading on an occasional basis by buying or selling
derivatives contracts with a view to smoothing short-term price volatility and deflating price bubbles.
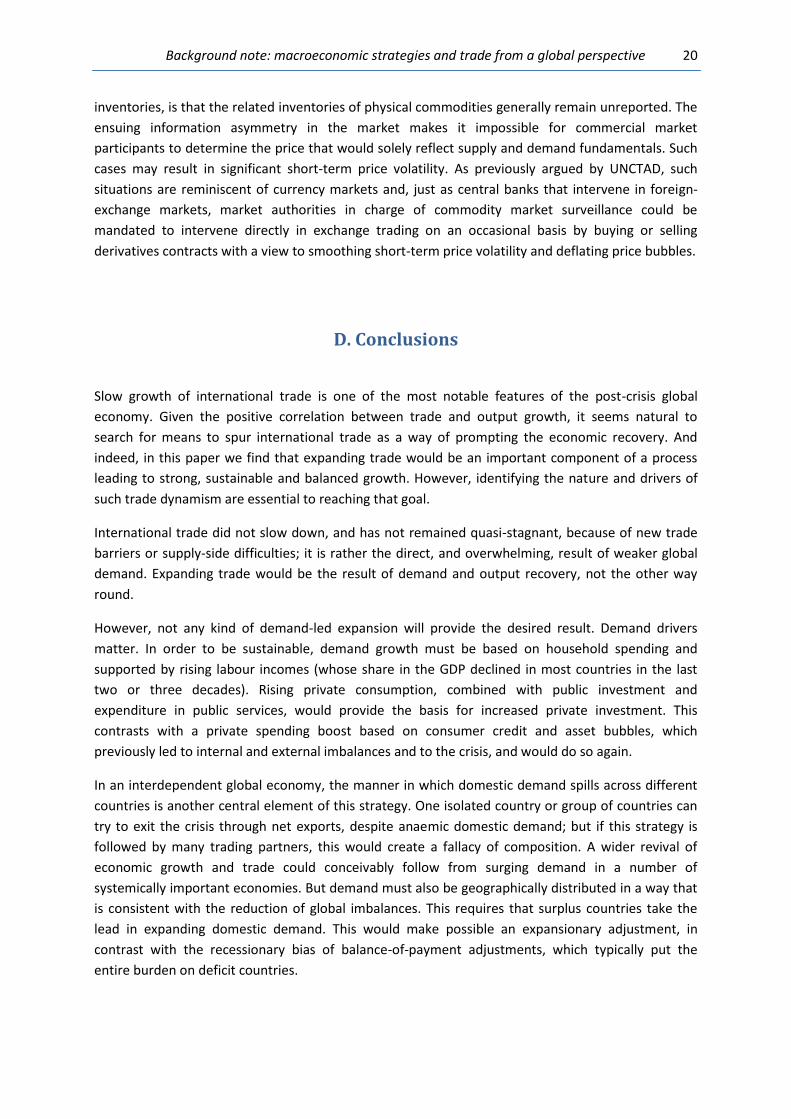
D. Conclusions
Slow growth of international trade is one of the most notable features of the post-crisis global
economy. Given the positive correlation between trade and output growth, it seems natural to
search for means to spur international trade as a way of prompting the economic recovery. And
indeed, in this paper we find that expanding trade would be an important component of a process
leading to strong, sustainable and balanced growth. However, identifying the nature and drivers of
such trade dynamism are essential to reaching that goal.
International trade did not slow down, and has not remained quasi-stagnant, because of new trade
barriers or supply-side difficulties; it is rather the direct, and overwhelming, result of weaker global
demand. Expanding trade would be the result of demand and output recovery, not the other way
round.
However, not any kind of demand-led expansion will provide the desired result. Demand drivers
matter. In order to be sustainable, demand growth must be based on household spending and
supported by rising labour incomes (whose share in the GDP declined in most countries in the last
two or three decades). Rising private consumption, combined with public investment and
expenditure in public services, would provide the basis for increased private investment. This
contrasts with a private spending boost based on consumer credit and asset bubbles, which
previously led to internal and external imbalances and to the crisis, and would do so again.
In an interdependent global economy, the manner in which domestic demand spills across different
countries is another central element of this strategy. One isolated country or group of countries can
try to exit the crisis through net exports, despite anaemic domestic demand; but if this strategy is
followed by many trading partners, this would create a fallacy of composition. A wider revival of
economic growth and trade could conceivably follow from surging demand in a number of
systemically important economies. But demand must also be geographically distributed in a way that
is consistent with the reduction of global imbalances. This requires that surplus countries take the
lead in expanding domestic demand. This would make possible an expansionary adjustment, in
contrast with the recessionary bias of balance-of-payment adjustments, which typically put the
entire burden on deficit countries.

UNCTAD contribution to the G20 Framework Working Group 21
Therefore, this paper proposes a gap analysis on international trade which is forward-looking, has a
global perspective and incorporates the main determinants of trade performance. It is forward-
looking because it does not take past trends as its benchmark, since those trends, in our view, were
unsustainable. Instead, it estimates a possible path for international trade conditional on a set of
policy measures. It is global because it takes into consideration the interaction between national
policies and outcomes, instead of taking each country in isolation. Finally, this gap analysis does not
limit itself to trade evolution, but examines its main determinants, in particular the shortcomings of
income distribution and demand.
A comprehensive approach should also consider trade and finance jointly, as observed J. M. Keynes,
while he negotiated the foundations of the Bretton Woods system.18 In particular, financial
regulation should soften the impact of financial and monetary factors on commodity prices, which
generates macroeconomic instability and interferes on investment decisions and the implementation
of development policies.
18
"Whilst other schemes are not essential as prior proposals to the monetary scheme, it may well be argued, I think, that a monetary scheme gives a firm foundation on which the others can be built. It is very difficult while you have monetary chaos to have order of any kind in other directions". Keynes JM, “Letter to Lord Addison, May 1944” in The Collected Writings of John Maynard Keynes, Volume XXVI: Activities 1941-1946, Shaping the Post-War World, Bretton Woods and Reparations, ed. Donald Moggridge (London: The MacMillan Press. Ltd., 1980), pp. 5-6.

Background note: macroeconomic strategies and trade from a global perspective 22
Tables and Charts
Table 1: GDP by type of expenditure and country groups, 1981–2011
Percentage of GDP Average annual growth
1981– 1991– 2003– 2008– 1981– 1991– 2003– 2008–
1990 2002 2007 2011 1990 2002 2007 2011
Developed economies
GDP 100.0 100.0 100.0 100.0 3.2 2.6 2.6 -0.1
HH 60.7 61.1 62.1 62.7 3.2 2.8 2.5 0.3
Gov 20.7 19.0 18.3 19.0 2.6 1.7 1.6 1.5
Inv 18.9 20.0 20.7 18.5 4.2 3.2 4.1 -4.0
Exp 13.3 19.3 24.3 26.5 4.9 6.5 6.5 0.8
Imp 13.2 19.2 25.5 26.8 5.7 6.9 6.6 0.1
Developing economies
GDP 100.0 100.0 100.0 100.0 3.6 4.7 7.0 5.3
HH 58.3 57.3 54.6 52.9 3.7 4.4 5.9 4.5
Gov 16.1 14.4 13.5 13.6 3.7 3.6 5.9 5.7
Inv 24.3 25.7 27.5 30.8 1.6 4.8 10.4 7.4
Exp 22.2 30.3 40.4 42.0 3.5 8.2 12.0 5.9
Imp 19.6 27.2 35.9 39.6 3.2 7.7 13.1 7.0
Transition economies
GDP … 100.0 100.0 100.0 … -3.0 7.6 1.2
HH … 47.0 53.2 60.8 … -1.3 10.7 3.3
Gov … 20.2 16.7 15.2 … -1.8 2.7 0.8
Inv … 27.1 23.1 24.0 … -12.2 14.9 -2.1
Exp … 30.8 38.6 37.0 … 1.1 8.4 0.8
Imp … 23.3 31.2 35.5 … -2.7 15.5 0.9
Source: UNCTAD secretariat calculations, based on UNCTADstat. Note: Averages and growth rates based on constant 2005 prices and
2005 exchange rates. HH=household consumption expenditure; Gov=government consumption expenditure; Inv=gross capital formation; Exp=exports, Imp=imports.

UNCTAD contribution to the G20 Framework Working Group 23
Table 2: Volume growth rates of merchandise exports and imports by volume, 2005-2013
(Annualized rates based on seasonally adjusted quarterly series)
Exports Imports
Q1 2005 - Q2 2008 - Q4 2010 - Q1 2005 - Q2 2008 - Q4 2010 -
Q2 2008 Q4 2010 Q3 2013 Q2 2008 Q4 2010 Q3 2013
World 7.2 1.7 2.1 6.9 1.3 2.1
Developing economies 9.3 4.8 3.5 10.6 5.6 5.4
Transition economies 8.4 -3.7 1.7 23.9 -6.4 5.0
Developed economies 5.9 0.2 1.0 4.5 -0.7 -0.3
Argentina 3.6 2.0 -0.3 19.3 7.7 1.1
Australia 3.3 4.5 3.4 10.6 0.3 3.0
Brazil 3.5 -0.2 0.6 19.6 9.3 3.1
Canada 0.5 -3.2 3.0 5.1 1.1 2.7
China 19.5 9.8 6.7 13.8 15.0 6.6
France 1.1 -1.1 -1.0 2.5 -2.0 -2.9
Germany 7.5 -0.4 0.1 5.8 1.0 -1.1
India 14.7 9.0 3.1 14.9 5.1 6.0
Indonesia 3.4 8.8 1.6 5.6 7.2 6.5
Italy 4.6 -2.8 -0.9 3.0 -0.7 -7.6
Japan 10.1 2.5 -2.1 1.9 0.1 2.2
Korea 14.1 11.7 3.6 7.6 3.2 2.6
Mexico 3.5 3.8 5.6 5.3 2.0 5.7
Russia 5.2 -2.0 1.5 27.0 -4.4 6.0
Saudi Arabia 4.0 -2.1 3.2 15.0 -4.0 14.4
South Africa 3.8 5.2 -2.6 9.1 -1.2 3.3
Spain 4.6 1.9 1.6 5.0 -3.9 -5.5
Turkey 12.4 0.4 8.2 10.3 7.3 3.0
United Kingdom -2.7 -1.1 3.9 0.8 -1.1 -0.9
United States 8.4 1.6 3.4 2.2 0.5 1.8
European Union 27 5.4 -0.2 0.8 5.4 -1.4 -1.8
Source: UNCTAD secretariat calculations, based on UNCTADstat.

Background note: macroeconomic strategies and trade from a global perspective 24
Table 3: World exports by origin and destination, selected country groups, 1995–2012 (Per cent of world exports)
Destination
Developing economies
Transition economies
Developed economies
Total
Origin
1995
Developing economies 11.9 0.3 16.1 28.3
Transition economies 0.3 0.6 1.1 2.1
Developed economies 16.6 1.1 52.1 69.7
Total 28.8 2.0 69.2 100.0
2000
Developing economies 13.1 0.2 18.8 32.1
Transition economies 0.4 0.5 1.4 2.4
Developed economies 15.0 0.8 49.8 65.5
Total 28.5 1.5 70.1 100.0
2008
Developing economies 19.8 0.8 18.3 38.9
Transition economies 0.9 0.9 2.8 4.6
Developed economies 13.6 1.9 40.9 56.5
Total 34.3 3.7 62.0 100.0
2012
Developing economies 25.3 0.8 18.5 44.7
Transition economies 0.9 0.8 2.4 4.1
Developed economies 15.0 1.7 34.6 51.2
Total 41.2 3.3 55.5 100.0
Source: UNCTAD secretariat calculations, based on UNCTADstat.

UNCTAD contribution to the G20 Framework Working Group 25
Table 4: Current account and trade balances as per cent of GDP
average
2000 2001 2002 2003 2004 2005 2006 2007 2008 2009 2010 2011 2012 2013 2011-13
a. Current Account Balance, per cent of GDP
Argentina -3.2 -1.4 8.6 6.3 2.1 2.9 3.6 2.8 2.1 2.7 0.4 -0.5 0.0 -0.6 -0.4
Australia -3.9 -2.1 -3.7 -5.4 -6.2 -5.9 -5.8 -6.7 -4.9 -4.6 -3.5 -2.8 -4.1 -3.0 -3.3
Brazil -3.8 -4.2 -1.3 0.7 1.7 1.6 1.2 0.2 -1.7 -1.4 -2.2 -2.1 -2.4 -3.7 -2.8
Canada 2.5 2.1 1.7 1.1 2.3 1.8 1.4 0.8 0.1 -2.9 -3.5 -2.8 -3.4 -3.0 -3.1
China 1.7 1.3 2.4 2.6 3.6 5.9 8.5 10.1 9.3 4.9 4.0 1.9 2.3 1.9 2.0
France 1.4 1.8 1.3 0.7 0.5 -0.5 -0.6 -1.0 -1.8 -1.3 -1.4 -1.8 -2.2 -1.7 -1.9
Germany -1.8 0.0 2.0 1.9 4.6 5.0 6.2 7.5 6.2 6.0 6.1 6.2 7.1 7.1 6.8
India -1.0 0.3 1.4 1.5 0.1 -1.2 -1.0 -0.7 -2.4 -2.0 -3.1 -3.2 -4.9 -3.0 -3.7
Indonesia 4.8 4.3 4.0 3.5 0.6 0.1 3.0 2.4 0.1 1.9 0.7 0.2 -2.7 -3.4 -2.0
Italy -0.5 -0.1 -0.8 -1.3 -0.9 -1.7 -2.6 -2.4 -2.9 -2.0 -3.5 -3.1 -0.5 0.5 -1.0
Japan 2.5 2.1 2.8 3.2 3.7 3.7 3.9 4.8 3.3 2.9 3.7 2.0 1.1 1.0 1.4
Rep. of Korea 2.8 1.7 1.3 2.4 4.7 2.2 1.4 2.1 0.6 3.7 2.7 2.3 3.8 5.0 3.7
Mexico -2.9 -2.6 -2.0 -1.1 -0.9 -1.0 -0.8 -1.4 -1.8 -0.9 -0.3 -1.0 -1.2 -1.8 -1.4
Russian Federation 18.1 11.1 8.4 8.4 10.0 11.1 9.7 6.0 6.2 3.8 4.7 5.2 3.6 2.4 3.7
Saudi Arabia 7.3 4.9 6.1 12.7 20.1 27.4 26.3 22.5 25.5 4.9 12.7 23.7 23.2 18.0 21.6
South Africa -0.1 0.3 0.8 -1.0 -3.0 -3.5 -5.3 -7.0 -7.2 -4.0 -2.0 -2.3 -5.2 -6.5 -4.7
Turkey -3.7 2.0 -0.3 -2.5 -3.6 -4.4 -6.0 -5.8 -5.4 -1.9 -6.1 -9.6 -6.2 -7.9 -7.9
United Kingdom -2.9 -2.3 -2.1 -1.7 -2.0 -1.8 -2.8 -2.2 -0.9 -1.4 -2.7 -1.5 -3.8 -4.3 -3.2
United States -4.0 -3.7 -4.2 -4.5 -5.1 -5.6 -5.8 -4.9 -4.6 -2.6 -3.0 -2.9 -2.7 -2.5 -2.7
European Union -1.0 -0.3 0.1 0.1 0.5 0.1 -0.2 -0.4 -0.9 0.0 0.1 0.4 0.9 1.4 0.9
b. Trade Balance, per cent of GDP
Argentina -0.6 1.3 15.4 12.0 7.8 6.6 6.3 4.9 4.3 5.6 3.5 2.4 2.5 2.1 2.4
Australia -1.1 0.6 -1.0 -2.6 -2.7 -1.8 -1.1 -1.8 -0.8 -0.4 1.0 1.3 -1.1 -1.1 -0.3
Brazil -1.2 -0.9 1.6 3.6 4.4 4.1 3.4 2.0 0.5 0.4 -0.5 -0.3 -1.0 -1.8 -1.0
Canada 5.6 5.5 4.2 3.6 4.1 3.9 2.7 2.1 1.7 -1.5 -1.9 -1.2 -2.0 -1.6 -1.6
China 2.4 2.1 2.6 2.2 2.6 5.5 7.7 8.8 7.7 4.4 3.8 2.5 2.8 2.8 2.7
France 1.0 1.4 1.6 1.0 0.5 -0.6 -1.0 -1.4 -2.2 -1.3 -1.7 -2.3 -1.9 -1.8 -2.0
Germany 0.1 1.8 4.2 3.9 5.0 5.2 5.6 7.0 6.2 4.9 5.6 5.2 5.9 5.7 5.6
India -2.8 -1.9 -1.0 -1.3 -2.1 -3.3 -3.4 -3.0 -6.0 -4.8 -5.3 -5.7 -7.4 -5.3 -6.1
Indonesia 8.9 7.7 6.7 5.3 4.4 2.9 5.4 4.8 2.0 3.9 3.0 2.9 -0.2 -1.1 0.5
Italy 1.0 1.4 0.8 0.6 0.7 0.0 -0.8 -0.3 -0.7 -0.5 -1.9 -1.5 1.1 1.8 0.5
Japan 1.5 0.6 1.3 1.7 2.0 1.5 1.4 1.9 0.4 0.5 1.4 -0.7 -1.8 -1.8 -1.4
Rep. of Korea 3.1 2.0 1.5 2.8 4.7 2.7 1.9 2.4 -0.1 3.7 3.1 2.3 3.6 4.6 3.5
Mexico -1.5 -1.8 -1.6 -1.7 -2.1 -1.7 -1.5 -1.8 -2.4 -1.7 -1.3 -1.4 -1.3 -1.2 -1.3
Russian Federation 20.6 12.7 10.6 11.4 12.4 13.7 12.5 8.2 9.5 7.8 7.9 8.6 7.2 6.2 7.3
Saudi Arabia 15.6 13.7 14.9 20.6 25.2 31.8 29.7 25.0 28.1 9.3 16.6 26.6 25.9 20.5 24.4
South Africa 3.0 4.0 3.8 2.3 -0.3 -0.5 -2.4 -2.7 -3.1 -0.9 -0.2 -0.6 -3.0 -3.2 -2.3
Turkey -4.0 2.9 0.6 -1.0 -2.5 -3.5 -5.1 -5.1 -4.7 -1.0 -5.4 -8.9 -5.4 -6.4 -6.9
United Kingdom -1.9 -2.3 -2.7 -2.3 -2.7 -2.8 -2.6 -2.6 -2.2 -1.6 -2.2 -1.5 -2.2 -1.8 -1.8
United States -3.7 -3.4 -3.8 -4.3 -4.9 -5.4 -5.4 -4.8 -4.8 -2.7 -3.3 -3.6 -3.3 -3.0 -3.3 Source: UNCTAD secretariat calculations, based on UNCTADstat; OECD, StatExtracts database;
Economist Intelligence Unit, EIU CountryData database; and IMF, World Economic Outlook, October 2013.

Background note: macroeconomic strategies and trade from a global perspective 26
Chart 1: World trade by volume, 2005-2013
(Index numbers, 2005 = 100)
A. Export of goods
B. Import of goods
Source: UNCTAD secretariat calculations, based on UNCTADstat.

UNCTAD contribution to the G20 Framework Working Group 27
Chart 2: Real effective exchange rates (REER), G20 Member States, 2005-2013
(Indices, 2005 = 100)
Source: UNCTAD Secretariat calculations based on UNCTADstat.
Note: REER are calculated using GDP deflators. 2013 are estimations.

Background note: macroeconomic strategies and trade from a global perspective 28
Chart 3: Monthly commodity prices indices by commodity group, January 2002-November 2013
(Index numbers, 2002 = 100)
Source: UNCTAD Secretariat calculations, based on UNCTAD Commodity Price Statistics Online
database.
Note: Crude petroleum price is the average of Dubai/Brent/West Texas Intermediate, equally
weighted. Index numbers are based on prices in current dollars, unless otherwise specified.

UNCTAD contribution to the G20 Framework Working Group 29
Chart 4: Net barter terms of trade, 2000-2013
(Index numbers, 2000 = 100)
Source: UNCTAD Secretariat calculations, based on UNCTADstat.
Note: 2013 are estimations.
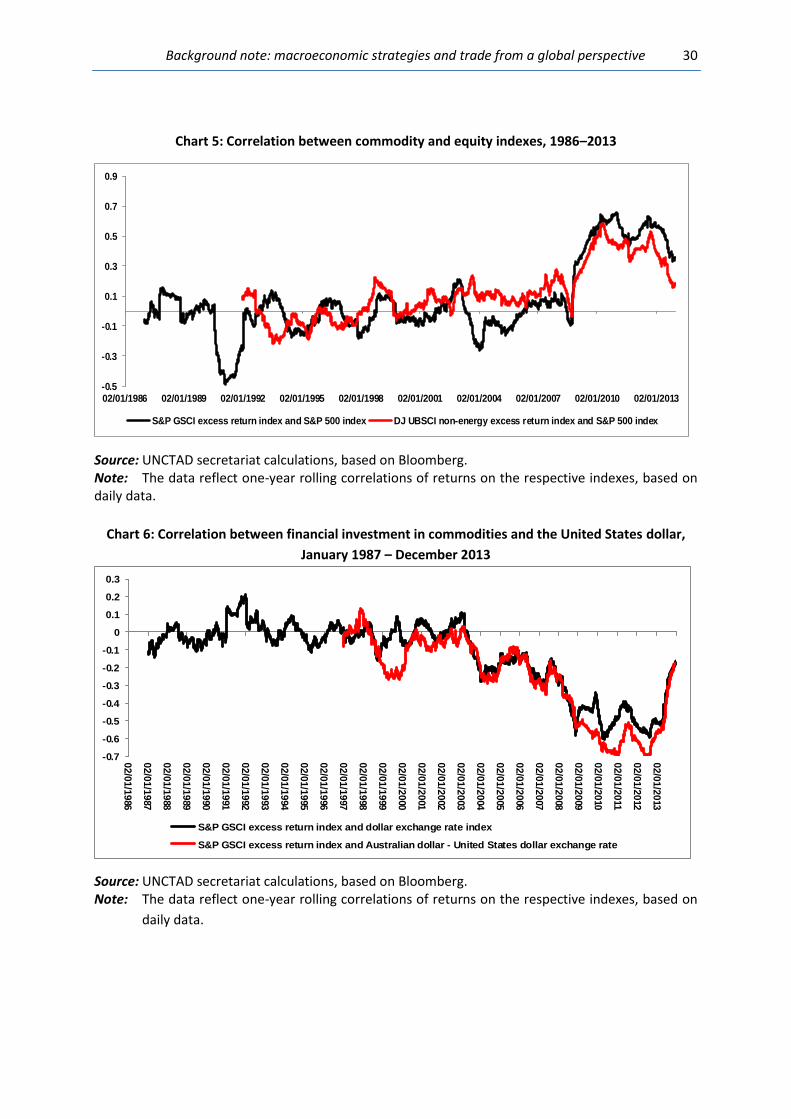
Background note: macroeconomic strategies and trade from a global perspective 30
Chart 5: Correlation between commodity and equity indexes, 1986–2013
-0.5
-0.3
-0.1
0.1
0.3
0.5
0.7
0.9
02/01/1986 02/01/1989 02/01/1992 02/01/1995 02/01/1998 02/01/2001 02/01/2004 02/01/2007 02/01/2010 02/01/2013
S&P GSCI excess return index and S&P 500 index DJ UBSCI non-energy excess return index and S&P 500 index
Source: UNCTAD secretariat calculations, based on Bloomberg. Note: The data reflect one-year rolling correlations of returns on the respective indexes, based on daily data.
Chart 6: Correlation between financial investment in commodities and the United States dollar,
January 1987 – December 2013
-0.7
-0.6
-0.5
-0.4
-0.3
-0.2
-0.1
0
0.1
0.2
0.3
02/0
1/1
986
02/0
1/1
987
02/0
1/1
988
02/0
1/1
989
02/0
1/1
990
02/0
1/1
991
02/0
1/1
992
02/0
1/1
993
02/0
1/1
994
02/0
1/1
995
02/0
1/1
996
02/0
1/1
997
02/0
1/1
998
02/0
1/1
999
02/0
1/2
000
02/0
1/2
001
02/0
1/2
002
02/0
1/2
003
02/0
1/2
004
02/0
1/2
005
02/0
1/2
006
02/0
1/2
007
02/0
1/2
008
02/0
1/2
009
02/0
1/2
010
02/0
1/2
011
02/0
1/2
012
02/0
1/2
013
S&P GSCI excess return index and dollar exchange rate index
S&P GSCI excess return index and Australian dollar - United States dollar exchange rate
Source: UNCTAD secretariat calculations, based on Bloomberg. Note: The data reflect one-year rolling correlations of returns on the respective indexes, based on
daily data.

UNCTAD contribution to the G20 Framework Working Group 31
Chart 7: Correlation between financial investment in commodities and the Japanese yen, January 1987 – December 2013
-0.7
-0.6
-0.5
-0.4
-0.3
-0.2
-0.1
0
0.1
0.2
0.3
02/0
1/1
986
02/0
1/1
987
02/0
1/1
988
02/0
1/1
989
02/0
1/1
990
02/0
1/1
991
02/0
1/1
992
02/0
1/1
993
02/0
1/1
994
02/0
1/1
995
02/0
1/1
996
02/0
1/1
997
02/0
1/1
998
02/0
1/1
999
02/0
1/2
000
02/0
1/2
001
02/0
1/2
002
02/0
1/2
003
02/0
1/2
004
02/0
1/2
005
02/0
1/2
006
02/0
1/2
007
02/0
1/2
008
02/0
1/2
009
02/0
1/2
010
02/0
1/2
011
02/0
1/2
012
02/0
1/2
013
S&P GSCI excess return index and Australian dollar - Japanese Yen exchange rate
S&P GSCI excess return index and Icelandic krona - Japanese yen exchange rate
Source: UNCTAD secretariat calculations, based on Bloomberg. Note: The data reflect one-year rolling correlations of returns on the respective indexes, based on
daily data.

Background note: macroeconomic strategies and trade from a global perspective 32
Chart 8: World growth rates of selected variables
-10
-5
0
5
10
15
90 95 00 05 10 15 20 25 30
GDP at market rates
-10
-5
0
5
10
15
90 95 00 05 10 15 20 25 30
Private investment
-10
-5
0
5
10
15
90 95 00 05 10 15 20 25 30
Exports of goods and services
-10
-5
0
5
10
15
90 95 00 05 10 15 20 25 30
Capacity utilisation
Baseline (blue), G20-coordinated growth (red) Units: % per year
0.4
0.6
0.8
1.0
1.2
1.4
1.6
90 95 00 05 10 15 20 25 30
Primary commodities relative to world prices (index; 2005 = 1)
0.4
0.6
0.8
1.0
1.2
1.4
1.6
90 95 00 05 10 15 20 25 30
Oil relative to world prices (index; 2005 = 1)
Source: UNCTAD Secretariat calculations based on UN Global Policy Model Note: Shaded areas correspond to simulation period

UNCTAD contribution to the G20 Framework Working Group 33
Chart 9: growth rate of GDP
-15
-10
-5
0
5
10
15
1990 2000 2010 2020 2030
USA
-15
-10
-5
0
5
10
15
1990 2000 2010 2020 2030
Canada
-15
-10
-5
0
5
10
15
1990 2000 2010 2020 2030
Japan
-15
-10
-5
0
5
10
15
1990 2000 2010 2020 2030
UK
-15
-10
-5
0
5
10
15
1990 2000 2010 2020 2030
Germany
-15
-10
-5
0
5
10
15
1990 2000 2010 2020 2030
Other North & W est Europe
-15
-10
-5
0
5
10
15
1990 2000 2010 2020 2030
France
-15
-10
-5
0
5
10
15
1990 2000 2010 2020 2030
Italy
-15
-10
-5
0
5
10
15
1990 2000 2010 2020 2030
Other South & East Europe
-15
-10
-5
0
5
10
15
1990 2000 2010 2020 2030
Turkey
-15
-10
-5
0
5
10
15
1990 2000 2010 2020 2030
Other East Asia High Income
-15
-10
-5
0
5
10
15
1990 2000 2010 2020 2030
China
-15
-10
-5
0
5
10
15
1990 2000 2010 2020 2030
India
-15
-10
-5
0
5
10
15
1990 2000 2010 2020 2030
Indonesia
-15
-10
-5
0
5
10
15
1990 2000 2010 2020 2030
CIS and other
-15
-10
-5
0
5
10
15
1990 2000 2010 2020 2030
Brazil
-15
-10
-5
0
5
10
15
1990 2000 2010 2020 2030
Argentina
-15
-10
-5
0
5
10
15
1990 2000 2010 2020 2030
Central America and Caribbean
-15
-10
-5
0
5
10
15
1990 2000 2010 2020 2030
South Africa
-15
-10
-5
0
5
10
15
1990 2000 2010 2020 2030
Other W est Asia
-15
-10
-5
0
5
10
15
1990 2000 2010 2020 2030
Other South America
-15
-10
-5
0
5
10
15
1990 2000 2010 2020 2030
Other East Asia
-15
-10
-5
0
5
10
15
1990 2000 2010 2020 2030
Other South Asia
-15
-10
-5
0
5
10
15
1990 2000 2010 2020 2030
North Africa
-15
-10
-5
0
5
10
15
1990 2000 2010 2020 2030
Africa Low Income
Baseline (blue), G20-coordinated growth (red) Units: % per year
Source: UNCTAD Secretariat calculations based on UN Global Policy Model

Background note: macroeconomic strategies and trade from a global perspective 34
Chart 10: Global imbalances under the 'G20-coordinated growth’ scenario, 1980-2030 (per cent of World Gross Product)
-3
-2
-1
0
1
2
31
98
0
19
82
19
84
19
86
19
88
19
90
19
92
19
94
19
96
19
98
20
00
20
02
20
04
20
06
20
08
20
10
20
12
20
14
20
16
20
18
20
20
20
22
20
24
20
26
20
28
20
30
Oil-exporting economies Deficit developing economies
Surplus developing economies (excluding China) Deficit developed economies
Surplus developed economies China
CIS economies
Source: UNCTAD Secretariat calculations based on UN Global Policy Model.

UNCTAD contribution to the G20 Framework Working Group 35
Chart 11: Current account as per cent of GDP
-10
-5
0
5
10
15
1990 2000 2010 2020 2030
USA
-10
-5
0
5
10
15
1990 2000 2010 2020 2030
Canada
-10
-5
0
5
10
15
1990 2000 2010 2020 2030
Japan
-10
-5
0
5
10
15
1990 2000 2010 2020 2030
UK
-10
-5
0
5
10
15
1990 2000 2010 2020 2030
Germany
-10
-5
0
5
10
15
1990 2000 2010 2020 2030
Other North & W est Europe
-10
-5
0
5
10
15
1990 2000 2010 2020 2030
France
-10
-5
0
5
10
15
1990 2000 2010 2020 2030
Italy
-10
-5
0
5
10
15
1990 2000 2010 2020 2030
Other South & East Europe
-10
-5
0
5
10
15
1990 2000 2010 2020 2030
Turkey
-10
-5
0
5
10
15
1990 2000 2010 2020 2030
Other East Asia High Income
-10
-5
0
5
10
15
1990 2000 2010 2020 2030
China
-10
-5
0
5
10
15
1990 2000 2010 2020 2030
India
-10
-5
0
5
10
15
1990 2000 2010 2020 2030
Indonesia
-10
-5
0
5
10
15
1990 2000 2010 2020 2030
CIS and other
-10
-5
0
5
10
15
1990 2000 2010 2020 2030
Brazil
-10
-5
0
5
10
15
1990 2000 2010 2020 2030
Argentina
-10
-5
0
5
10
15
1990 2000 2010 2020 2030
Central America and Caribbean
-10
-5
0
5
10
15
1990 2000 2010 2020 2030
South Africa
-10
-5
0
5
10
15
1990 2000 2010 2020 2030
Other W est Asia
-10
-5
0
5
10
15
1990 2000 2010 2020 2030
Other South America
-10
-5
0
5
10
15
1990 2000 2010 2020 2030
Other East Asia
-10
-5
0
5
10
15
1990 2000 2010 2020 2030
Other South Asia
-10
-5
0
5
10
15
1990 2000 2010 2020 2030
North Africa
-10
-5
0
5
10
15
1990 2000 2010 2020 2030
Africa Low Income
Baseline (blue), G20-coordinated growth (red) Units: %
Source: UNCTAD Secretariat calculations based on UN Global Policy Model.

Background note: macroeconomic strategies and trade from a global perspective 36
Chart 12: Real exchange rates
0.0
0.5
1.0
1.5
2.0
2.5
3.0
1990 2000 2010 2020 2030
USA
0.0
0.5
1.0
1.5
2.0
2.5
3.0
1990 2000 2010 2020 2030
Canada
0.0
0.5
1.0
1.5
2.0
2.5
3.0
1990 2000 2010 2020 2030
Japan
0.0
0.5
1.0
1.5
2.0
2.5
3.0
1990 2000 2010 2020 2030
UK
0.0
0.5
1.0
1.5
2.0
2.5
3.0
1990 2000 2010 2020 2030
Germany
0.0
0.5
1.0
1.5
2.0
2.5
3.0
1990 2000 2010 2020 2030
Other North & W est Europe
0.0
0.5
1.0
1.5
2.0
2.5
3.0
1990 2000 2010 2020 2030
France
0.0
0.5
1.0
1.5
2.0
2.5
3.0
1990 2000 2010 2020 2030
Italy
0.0
0.5
1.0
1.5
2.0
2.5
3.0
1990 2000 2010 2020 2030
Other South & East Europe
0.0
0.5
1.0
1.5
2.0
2.5
3.0
1990 2000 2010 2020 2030
Turkey
0.0
0.5
1.0
1.5
2.0
2.5
3.0
1990 2000 2010 2020 2030
Other East Asia High Income
0.0
0.5
1.0
1.5
2.0
2.5
3.0
1990 2000 2010 2020 2030
China
0.0
0.5
1.0
1.5
2.0
2.5
3.0
1990 2000 2010 2020 2030
India
0.0
0.5
1.0
1.5
2.0
2.5
3.0
1990 2000 2010 2020 2030
Indonesia
0.0
0.5
1.0
1.5
2.0
2.5
3.0
1990 2000 2010 2020 2030
CIS and other
0.0
0.5
1.0
1.5
2.0
2.5
3.0
1990 2000 2010 2020 2030
Brazil
0.0
0.5
1.0
1.5
2.0
2.5
3.0
1990 2000 2010 2020 2030
Argentina
0.0
0.5
1.0
1.5
2.0
2.5
3.0
1990 2000 2010 2020 2030
Central America and Caribbean
0.0
0.5
1.0
1.5
2.0
2.5
3.0
1990 2000 2010 2020 2030
South Africa
0.0
0.5
1.0
1.5
2.0
2.5
3.0
1990 2000 2010 2020 2030
Other W est Asia
0.0
0.5
1.0
1.5
2.0
2.5
3.0
1990 2000 2010 2020 2030
Other South America
0.0
0.5
1.0
1.5
2.0
2.5
3.0
1990 2000 2010 2020 2030
Other East Asia
0.0
0.5
1.0
1.5
2.0
2.5
3.0
1990 2000 2010 2020 2030
Other South Asia
0.0
0.5
1.0
1.5
2.0
2.5
3.0
1990 2000 2010 2020 2030
North Africa
0.0
0.5
1.0
1.5
2.0
2.5
3.0
1990 2000 2010 2020 2030
Africa Low Income
Baseline (blue), G20-coordinated growth (red) Units: index
Source: UNCTAD Secretariat calculations based on UN Global Policy Model.

UNCTAD contribution to the G20 Framework Working Group 37
Chart 13: Government total expenditure in goods and services as per cent of GDP
15
20
25
30
1990 2000 2010 2020 2030
USA
15
20
25
30
1990 2000 2010 2020 2030
Canada
15
20
25
30
1990 2000 2010 2020 2030
Japan
15
20
25
30
1990 2000 2010 2020 2030
UK
15
20
25
30
1990 2000 2010 2020 2030
Germany
15
20
25
30
1990 2000 2010 2020 2030
Other North & West Europe
15
20
25
30
1990 2000 2010 2020 2030
France
15
20
25
30
1990 2000 2010 2020 2030
Italy
15
20
25
30
1990 2000 2010 2020 2030
Other South & East Europe
15
20
25
30
1990 2000 2010 2020 2030
Turkey
15
20
25
30
1990 2000 2010 2020 2030
Other East Asia High Income
15
20
25
30
1990 2000 2010 2020 2030
China
15
20
25
30
1990 2000 2010 2020 2030
India
15
20
25
30
1990 2000 2010 2020 2030
Indonesia
15
20
25
30
1990 2000 2010 2020 2030
CIS and other
15
20
25
30
1990 2000 2010 2020 2030
Brazil
15
20
25
30
1990 2000 2010 2020 2030
Argentina
15
20
25
30
1990 2000 2010 2020 2030
Central America and Caribbean
15
20
25
30
1990 2000 2010 2020 2030
South Africa
15
20
25
30
1990 2000 2010 2020 2030
Other West Asia
15
20
25
30
1990 2000 2010 2020 2030
Other South America
15
20
25
30
1990 2000 2010 2020 2030
Other East Asia
15
20
25
30
1990 2000 2010 2020 2030
Other South Asia
15
20
25
30
1990 2000 2010 2020 2030
North Africa
15
20
25
30
1990 2000 2010 2020 2030
Africa Low Income
Baseline (blue), G20-coordinated growth (red) Units: %
Source: UNCTAD Secretariat calculations based on UN Global Policy Model.

Background note: macroeconomic strategies and trade from a global perspective 38
Chart 14: Public sector borrowing requirements as per cent of GDP
-15
-10
-5
0
5
10
15
1990 2000 2010 2020 2030
USA
-15
-10
-5
0
5
10
15
1990 2000 2010 2020 2030
Canada
-15
-10
-5
0
5
10
15
1990 2000 2010 2020 2030
Japan
-15
-10
-5
0
5
10
15
1990 2000 2010 2020 2030
UK
-15
-10
-5
0
5
10
15
1990 2000 2010 2020 2030
Germany
-15
-10
-5
0
5
10
15
1990 2000 2010 2020 2030
Other North & W est Europe
-15
-10
-5
0
5
10
15
1990 2000 2010 2020 2030
France
-15
-10
-5
0
5
10
15
1990 2000 2010 2020 2030
Italy
-15
-10
-5
0
5
10
15
1990 2000 2010 2020 2030
Other South & East Europe
-15
-10
-5
0
5
10
15
1990 2000 2010 2020 2030
Turkey
-15
-10
-5
0
5
10
15
1990 2000 2010 2020 2030
Other East Asia High Income
-15
-10
-5
0
5
10
15
1990 2000 2010 2020 2030
China
-15
-10
-5
0
5
10
15
1990 2000 2010 2020 2030
India
-15
-10
-5
0
5
10
15
1990 2000 2010 2020 2030
Indonesia
-15
-10
-5
0
5
10
15
1990 2000 2010 2020 2030
CIS and other
-15
-10
-5
0
5
10
15
1990 2000 2010 2020 2030
Brazil
-15
-10
-5
0
5
10
15
1990 2000 2010 2020 2030
Argentina
-15
-10
-5
0
5
10
15
1990 2000 2010 2020 2030
Central America and Caribbean
-15
-10
-5
0
5
10
15
1990 2000 2010 2020 2030
South Africa
-15
-10
-5
0
5
10
15
1990 2000 2010 2020 2030
Other W est Asia
-15
-10
-5
0
5
10
15
1990 2000 2010 2020 2030
Other South America
-15
-10
-5
0
5
10
15
1990 2000 2010 2020 2030
Other East Asia
-15
-10
-5
0
5
10
15
1990 2000 2010 2020 2030
Other South Asia
-15
-10
-5
0
5
10
15
1990 2000 2010 2020 2030
North Africa
-15
-10
-5
0
5
10
15
1990 2000 2010 2020 2030
Africa Low Income
Baseline (blue), G20-coordinated growth (red) Units: %
Source: UNCTAD Secretariat calculations based on UN Global Policy Model.

UNCTAD contribution to the G20 Framework Working Group 39
Chart 15: Income from employment as per cent of GDP
36
44
52
60
68
1990 2000 2010 2020 2030
USA
36
44
52
60
68
1990 2000 2010 2020 2030
Canada
36
44
52
60
68
1990 2000 2010 2020 2030
Japan
36
44
52
60
68
1990 2000 2010 2020 2030
UK
36
44
52
60
68
1990 2000 2010 2020 2030
Germany
36
44
52
60
68
1990 2000 2010 2020 2030
Other North & West Europe
36
44
52
60
68
1990 2000 2010 2020 2030
France
36
44
52
60
68
1990 2000 2010 2020 2030
Italy
36
44
52
60
68
1990 2000 2010 2020 2030
Other South & East Europe
36
44
52
60
68
1990 2000 2010 2020 2030
Turkey
36
44
52
60
68
1990 2000 2010 2020 2030
Other East Asia High Income
36
44
52
60
68
1990 2000 2010 2020 2030
China
36
44
52
60
68
1990 2000 2010 2020 2030
India
36
44
52
60
68
1990 2000 2010 2020 2030
Indonesia
36
44
52
60
68
1990 2000 2010 2020 2030
CIS and other
36
44
52
60
68
1990 2000 2010 2020 2030
Brazil
36
44
52
60
68
1990 2000 2010 2020 2030
Argentina
36
44
52
60
68
1990 2000 2010 2020 2030
Central America and Caribbean
36
44
52
60
68
1990 2000 2010 2020 2030
South Africa
36
44
52
60
68
1990 2000 2010 2020 2030
Other West Asia
36
44
52
60
68
1990 2000 2010 2020 2030
Other South America
36
44
52
60
68
1990 2000 2010 2020 2030
Other East Asia
36
44
52
60
68
1990 2000 2010 2020 2030
Other South Asia
36
44
52
60
68
1990 2000 2010 2020 2030
North Africa
36
44
52
60
68
1990 2000 2010 2020 2030
Africa Low Income
Baseline (blue), G20-coordinated growth (red) Units: %
Source: UNCTAD Secretariat calculations based on UN Global Policy Model.