Background Material Capital Markets Day 2021
68
Background Material Capital Markets Day 2021 23 November 2021
Transcript of Background Material Capital Markets Day 2021

Background Material
Capital Markets Day 202123 November 2021

This presentation has been prepared by Orkla ASA (the “Company”) solely for information purposes. The presentation does not constitute an invitation or offer to acquire, purchase or subscribe for securities.
Certain statements included in this presentation contain various forward-looking statements that reflect management’s current views with respect to future events and financial and operational performance. The words “believe,” “expect,” “anticipate,” “intend,” “may,” “plan,” “estimate,” “should,” “could,” “aim,” “target,” “might,” or, in each case, their negative, or similar expressions identify certain of these forward-looking statements. Others can be identified from the context in which the statements are made. Although we believe that the expectations reflected in such forward-looking statements are reasonable, these forward-looking statements are based on a number of assumptions and forecasts that, by their nature, involve risk and uncertainty. Various factors could cause our actual results to differ materially fromthose projected in a forward-looking statement or affect the extent to which a particular projection is realized. Factors that could cause these differences include but are not limited to the Company’s ability to operate profitably, maintain its competitive position, to promote and improve its reputation and the awareness of the brands in its portfolio, to successfully operate its growth strategy and the impact of changes in pricing policies, political and regulatory developments in the markets in which the Company operates, and other risks.
The information and opinions contained in this document are provided as at the date of this presentation and are subject to change without notice.
No representation or warranty (expressed or implied) is made as to, and no reliance should be placed on, the fairness, accuracy or completeness of the information contained herein. Accordingly, neither the Company nor its subsidiary undertakings or any of such person’s officers or employees accepts any liability whatsoever arising directly or indirectly from the use of this document.
Disclaimer
2

Index
Presentations Page
CEO key notes 4
Financial targets 8
Operating model 16
Prioritized growth initiatives 29
Portfolio management and M&A 52
Appendices 59

CEO Keynotes
• Strong foundation with 300 brands and ~80% of revenue from
brands with number 1 and 2 market positions
• Cultural change nurturing braveness and challenger mindset
• Step change profitable organic growth*, targeting at least 2.5%
• Targeting mid-single-digit underlying EBIT (adj.) growth
• Continue to be in the forefront on sustainability
- Integral part of business strategy with clear targets
• Three prioritized growth areas;
- Plant-based
- Out of Home
- Consumer Health
* All Alternative Performance Measures (APM) are presented in the appendix4

CEO Keynotes (ii)
• Top three priority approaches to reaching our
targets:
- Winning locally
- Embracing change
- Building tomorrow
• International expansion of selected brands
• Geographical expansion and partnerships
• A more dynamic approach to our portfolio
- Consider acquisitions, divestitures,
spinouts, IPOs, JVs
5

Being consumer centric
in a digital world
Being a local
champion
for sustainability
Being the best
partner
in all we do
Our people
make the difference
Local consumer insight
at the heart of everything
Operational & commercial
competitiveness
Plant-based
Health
Out of Home
Geographic expansion
Top three priority approaches to reaching our targets

Targets for Orkla 2022-2024
7
Organic growth* of at least 2.5%**
Mid-single-digit U.EBIT (adj.)* growth**
M&A and portfolio management to support value creation strategy
Local champion for sustainability
• Scope 1&2 GHG reduction of 65%*** by 2025
• Scope 3 GHG reduction of 30%*** by 2025
• 100% recyclable packaging by 2025
* All Alternative Performance Measures (APM) are presented in the appendix
** Targets applicable to BCG incl HQ
*** Orkla’s climate targets have been approved by the Science Based Targets Initiative (SBTI), in line with the UN Paris agreement. Base year 2014

Financial targets

Organic growth** >= market
U.EBIT %**>150 bp by 2021
Net working capital reduction
(% of sales)
>300 bp by 2021
Status for financial targets from Capital Markets Day 2018*
9 * Targets applicable to BCG incl. HQ.
** All Alternative Performance Measures (APM) are presented in the appendix
2018 – 2021 (YTD Q3)
2.1% CAGR
2019 +30 bp
2020 +40 bp
2021 (YTD Q3) - 50 bp
2019 -130 bp
2020 -230 bp
2021 (YTD Q3) -30 bp

Targets for Orkla 2022-2024
10
Organic growth* of at least 2.5%**
Mid-single-digit U.EBIT (adj.)* growth**
M&A and portfolio management to support value creation strategy
Local champion for sustainability
• Scope 1&2 GHG reduction of 65%*** by 2025
• Scope 3 GHG reduction of 30%*** by 2025
• 100% recyclable packaging by 2025
* All Alternative Performance Measures (APM) are presented in the appendix
** Targets applicable to BCG incl HQ
*** Orkla’s climate targets have been approved by the Science Based Targets Initiative (SBTI), in line with the UN Paris agreement. Base year 2014

Targeting organic growth of at least 2.5%
* All Alternative Performance Measures (APM) are presented in the appendix
** Target applicable to BCG incl HQ
*** 2018 Adjusted for the loss of the distribution agreement with Wrigley11
1.6%
20202018***2017
1.6%
2019 YTD Q3-21
1.6%
0.4%
1.3%
3.8%
CAGR
2016 -
Q3-21
Organic growth*
2022-24
At least
2.5% p.a.
Target**

12
2017
3.4%
2018***
-1.1%
4.1%
2019 2020 YTD Q3-21
5.2%
2.3%
5.4%
Underlying EBIT (adj.)* growth for BCG incl. HQ
Targeting mid-single-digit underlying EBIT (adj.) growth
* All Alternative Performance Measures (APM) are presented in the appendix
** Target applicable to BCG incl HQ
*** 2018 Adjusted for the loss of the distribution agreement with Wrigley
CAGR
2016 –
Q3-21Target
2022 – 2024**
Mid-single-digit

Sustainability strategy and targets towards 2025
13
1) Targets for greenhouse gas reduction have been validated by the Science-based Targets initiative.
2) Scope 1 and Scope 2 in accordance with the Greenhouse Gas Protocol. Base year 2014.
3) Scope 3 in accordance with the Greenhouse Gas Protocol. Base year 2014.
Environmental
engagementStrong engagement for the
environment
• > 60% renewable energy
• 65% reduction in
greenhouse gas emissions
from own operations (80%
reduction by 2040) 1,2
• 30% reduction in
greenhouse gas emissions
in the value chain, outside
own operations (75%
reduction by 2040) 1,3
• 30% reduction in energy
and water consumption
• 50% reduction in food waste
Sustainable sourcingPartnership for sustainable
raw materials
• Ensure respect for workers’
rights
• Achieve verified sustainable
production of key raw
materials4
• Promote sustainable
farming and fishing
• 100% recyclable packaging
• 75% packaging made of
recycled materials
• 50% plastic packaging
made of recycled or
renewable materials
Nutrition and
wellnessMaking it easier to live
healthily
• Double consumption of
products and services that
promote a healthier lifestyle
• 15 per cent less salt and
sugar5
• Inspire people to adopt a
healthier lifestyle
Safe productsSafe products build trust
• 100% food manufacturing
facilities at green level6
• 100% approved suppliers6
• Continue to ensure that all
products are safe
Care for people and
societyStrong local engagement for
sustainability
• Create strong local
engagement for
sustainability
• 100% compliance with
Orkla’s human rights policy
• Create healthy workplaces
with zero injuries
• Women in 50% of
leadership positions at all
levels
• Create a culture of integrity
everywhere
4) The assessment of importance is based on the risk related to and scope of the Group’s sourcing
5) Reduction in overall consumption of salt and sugar from Orkla’s food products. Base year 2015.
6) In accordance with the Orkla Food Safety Standard

M&A and portfolio management to support value creation strategy
14
2010 2011 2012 2013 2014 2015 2016 2017 2018 2019 2020 2021
50
10
20
30
40
Operating
income*
BNOK
(BCG)
Key divestments
Share portfolio

Funding considerations & allocation priorities
Funding considerations Allocation priorities
15
• Maintain a financial and business risk profile consistent
with an investment grade credit rating
• Secure funding when you don’t need it - avoid
expensive bridge financing and restrictive covenants
which can be challenging to reverse
o Diversified funding sources
o Diversified maturity structure
• Retain capacity to seize attractive opportunities when
they arise, with available funding on competitive and
non-restrictive terms
• #1 priority is maintaining an attractive and predictable
dividend policy – have never reduced ordinary
dividends
• #2 priority is value accretive M&A and organic
investments in strengthening the future Orkla
• #3 priority is to return excess capital to shareholders

Operating model

117
billion
Orkla Group in figures
17
47.1
EMPLOYEES**
21,500
OPERATING INCOME*
97%SERVICE LEVEL**
billion
* Full-year figures 2020
** As at Q3 2021
*** Orkla holds 42.6% ownership in Jotun AS
billion
PRODUCTION SITES**
5.5EBIT (ADJ)*
1.0PROFIT FROM
ASSOCIATES * / ***

Operating model
18
Improving everyday
life through enjoyable
and sustainable
local brands
LO
CA
L S
TR
EN
GT
H
SYNERGIES
Optimized model
Multi-national
competitors
Smaller, local
competitors
Optimized means that Orkla will win
through taking out more scale than
smaller, local players and being
closer and more flexible so as to
accommodate local preferences
than global peers
19
A leading Nordic-based
BCG companyStrong Brands Local presence Scale advantages
• Long heritage in the
Nordic region
• Strong presence in the
Baltics, Central Europe
and South Asia
• Listed on Euronext
Oslo
• Strong positions in
smaller markets
• ~80% of revenue
from #1 and #2 brands
• Market shares typically
in the range of 30-80%
• Being close to the
consumer and
customer
• Superior local insight
and set-up
• Autonomous units
with full P+L
responsibility
• Develop concepts
across markets
• Synergy
realization throughout
supply chain
• Centres of
competence in select
areas
“Improving everyday life through enjoyable and sustainable local brands”
Orkla Optimized Model

(NOK billion)
Sales: 7.2
EBIT (adj.): 1.2
EBIT (adj.) margin:
16.8%
A unique portfolio of strong local brands
20
Orkla Confectionery &
Snacks
Orkla
Food
Ingredients
(NOK billion)
Sales: 10.7
EBIT (adj.): 0.5
EBIT (adj.) margin:
4.7%
Orkla
Care
(NOK billion)
Sales: 6.9
EBIT (adj.): 1.0
EBIT (adj.) margin:
14.8%
Industrial &
Financial
Investments
Hydro Power
Financial Investments
Jotun (42.6%)
Note: Full-year figures 2020
Orkla
Foods
(NOK billion)
Sales: 18.3
EBIT (adj.): 2.6
EBIT (adj.) margin:
14.4%
26%
42%
21%
3%
7%
World otherEurope otherNorway Nordics ex. Norway Baltics
29%
49%
16%
5%
1% 33%
42%
18%
1%
7%
42%
42%
11%
4%
1%
Orkla
Consumer
Investments
(NOK billion)
Sales: 3.8
EBIT (adj.): 0.4
EBIT (adj.) margin:
10.5%
33%
44%
23%
0% 0%

Increased exposure outside Norway and ~25% of revenue in Out of Home
Sales revenues by geographical region* BCG channel split (net sales), FY 2020
21
39%35% 32%
39% 38% 35% 32% 30% 29% 27% 26%
23%
20%21%
23% 22%23%
22%21% 21%
21% 22%
11%
9%9%
10% 11%10%
10%11% 10%
10% 10%
8%
6%6%
7% 7%7%
8%8% 8% 10% 11%
7%
7%
4%5%
5%5% 5% 5% 5%
10%
13%18%
14% 16%16% 20% 23% 23% 23% 23%
0%
10%
20%
30%
40%
50%
60%
70%
80%
90%
100%
3%
201520132010 2011 2017
3%
2012 2014 2016 2018 2019 2020
Norway Finland and Iceland
Sweden
Denmark
The Baltics
Rest of Europe
Rest of the world
* Excluding internal sales and other operating revenues
** Other channels include: Specialized Trade, Pharmacy, Industry, D2C and Other
0%
10%
20%
30%
40%
50%
60%
70%
80%
90%
100%
Orkla totalFoods Confectionery
& Snacks
BNOK 47
Food
Ingredients
Care Consumer
Investments
Other channels** Out of home Grocery

22
#2 #1 #1 #1
Norway Sweden Finland Denmark
Snacks
Ketchup
Health
supplements
Example of market positions and brands in the grocery channel:
#1 #1 #1
#1 #3 #1#1
Estonia Latvia
#1#3
#1#1 #1
#1 #1
80% of revenue from number 1 and 2 market positions

Operating modelExamples: Growing the core

How Stratos has doubled its market share over the last three years
Brand-building
Over the last three years the Stratos chocolate brand has doubled its market share and increased its sales revenues by + 115%. Stratos’ performance accounts for 32% of the value growth in the chocolate tablet category.
Strategic innovation In-store activation
Excellent brand-building with high media-investments based on clear and distinct brand positioning.
Strategic innovation within the core, investing in unique new technology to improve the taste experience.
Strong and consistent in-store activation including both new innovations and core products.
Consumer sales (NOK million)
-
50
100
150
200
250
300
350
2018 2019 2020
C
O
R
E
+160 million NOK since 2018
Source: NielsenIQ ScanTrack, Norge Total DVH, Sjokoaldeplater/brand Stratos, Value Sales'000, Volume Sales '000. Value % Chg YA, Value % Share, 2018, 2019,
2020, YTD TY, week 40, 2021. Ref.nr.03393708, Date:12.11.2021 (Copyright © NielsenIQ.)
+ 115%

New Launch2020
Sjöbris
Restart of local Home Care brand Grumme in Sweden in 2016, after acquisition of Cederroth
• Positioning as the sustainable pioneer
• Investment in brand-building• Bold insight-driven
communication • Strong innovation program based
on utilizing portfolio cross-border ➢ + 60% sales growth, all time
high market shares

We have replicated the success of Paulúns in Sweden in other markets,
with a clear health positioning and tasty products
26
Finland: Launched in 2015Sweden: Launched in 2010 Norway: Launched in 2017
Today:
No. 1 brand in Müsli & Granola
Today:
No. 2 brand in Granola
Today:
No. 1 brand in Granola and Cereals

27

Building a new Biscuit factory in Latvia will serve Orkla’s needs going forward and
significantly reduce our climate footprint
28
New Orkla Biscuit Production (OBP) factory
Status on 1st November 2021
Key Figures
32 000 square meters
300 employees
13 production lines
Strong local brands serving all markets
Increased innovation capabilities in the category
Improved cost position
Sustainability vision for Orkla Biscuit Production (OBP)
“OBP is a guiding star for sustainable
production”
50%
waste reduction
25%
decrease in energy
consumption
25%
lower water
consumption
Best practice waste
water treatment

Growth initiatives (i)Plant-based
Growing sales from 1 to 3 BNOK in 2025

Long-term consumer trends are driving the inevitable shift towards
plant-based – Orkla uniquely positioned to bring down barriers
30
AWARENESS
TASTE & TEXTURE
PRICE
CONSUMER BARRIERS
SUSTAINABILITY
HEALTH
ANIMAL WELFARE
CONSUMER DRIVERS

2018 20232017 20202019 RTM 2021-Q3
621
20242022 2025 target
240
449
846981
3.000
CAGR: 52%1
Orkla has set an ambitious target of NOK +3 billion turnover in 2025 in
plant-based
31
Orkla sales, plant-based
(2017-2025, NOK million1)
1) Not adjusted for currency fluctuations. Growth YTD Q3-21 vs. YTD Q3-20 was 22%
2) Not including distribution agreements. Growth mainly driven by organic growth, supported by smaller acquisitions
NOK +3 billion
target for 20252

Orkla is uniquely positioned to be a leading player within Plant-based
32
Orkla strengths
Leading positions
Strong brands with
NATURLI’ and Anamma
paired with market-leading
position in the Nordics
Local presence
Expanding footprint fueled
by strong local
organizations in 12
European markets
Strong capabilities
Competence in meat and
dairy replacements built
over the last 30 years

• Orkla has built strong competence in
plant-based categories for the last
30 years through our brands
NATURLI’ and Anamma
• We have market leading positions
across our Nordic markets
– #1 in dairy and meat in
Denmark
– #1 in meat in Sweden
– #1 in select meat segments in
Norway
• We are growing our positions in the
Baltics and Central- and Eastern
Europe
Strong capabilities and leading positions in meat
and dairy replacement – built over 30 years
33
Current Orkla Plant-based
Norway
Finland
Denmark
Baltics
Romania
Sweden

The NATURLI’ brand and product portfolio have proven
successful, and are growing across 20+ markets
34
Plant-based, NATURLI’ potential
Australia and
New ZealandIsrael
South
Korea
• NATURLI’ products can be found in
more than 20+ markets globally
…from Denmark to South Korea,
Australia and New Zealand
• With NATURLI’ we have a brand
and a product portfolio that we can
expand to new markets as the plant-
based category grows worldwide
• As an example, NATURLI’ Vegan
Block (vegan butter alternative) has
proven highly successful with year-
on-year growth in all markets where
it has been launched

Orkla has several award-winning plant-based products driving our strong
positions
35
Examples of award-winning products
• 100% vegan,
undistinguishable from butter
– Tastes like butter
– Melts like butter
– Browns like butter
• Exported globally, growing in
all markets where it has been
introduced
NATURLI’ vegan butter
• Shapeable minced meat
product, fully replacing
traditional minced meat
• Shapeable – works in a taco,
forms into a burger, rolls into
meat balls
• #1 best-selling plant-based
SKU in Sweden
Anamma shapeable
• Joe’ Kurt vegan yoghurt has a
fresh and sour yoghurt taste,
and a creamy texture
• Based on almonds, and
completely gluten-free
• Multiple different flavors,
including natural and vanilla
NATURLI’ Joe’ Kurt
• Most sold vegan pizza in
Sweden
• Stone oven baked Italian
style, with meltable vegan
cheese and tasty vegan meat
toppings
• Assortment is expanding due
to high consumer success,
Vego Mexicana recently
launched
Anamma pizza

36
• Local business units in 12 European
markets, providing knowledge of
consumer insight, taste preferences,
and strong go-to-market capabilities
• Local production, technology and
innovation for meat and dairy
replacements
• NOK +500 million invested over the
last 3 years in our 6 plant-based
factories
• Increasing investment levels across
meat and dairy replacements going
forward
Local presence
Norway
Denmark
Sweden
Expanding footprint fueled by strong local
organizations in 12 European markets

Orkla Alternative Proteins (OAP) as new business unit to set a broader
and more ambitious strategy for meat and dairy replacements
37
Strengthen Orkla’s long-term technology roadmap fueled by a proactive
partnership strategy
Broaden Orkla’s focus on alternative protein technologies beyond plant-
based
Increase focus on finding value outside existing markets and upstream
activities in the value chain
Orkla Alternative Proteins focus
… to increase Orkla’s long-term competitiveness and value creation

Growth initiatives (ii)Out of Home strategy
Building a leading European Pizza Franchise

Out of Home
Changing consumer preference is driving the desire to establish a sizeable
position in the Out of Home market
▪ Consumers are spending an increasing share of
wallet Out of Home (OOH), driving strong growth
in the market
▪ Increase demand for convenience and accessibility
- take away & delivery segments are growing faster
than traditional dine-in
▪ Closer connection to consumers with potential to
yield a competitive advantage in digital sales and
marketing
Share of wallet
▪ Sizeable market with industrialization potential
▪ Strong underlying growth
▪ A preferred choice across occasions
▪ Timeless concept
▪ Fairly resilient to market cycles / economic downturns
▪ Strong in-house competence
Why Pizza?Why Out of Home?
Pizza limited-
service restaurant
market
’14’08’06 ’20’10 ’12 ’16 ’18 ’22 ’24
39

Limited-Service Pizza represents a strong and growing market
Source: Euromonitor International 2021 edition.
1) Addressable markets include; Austria, Belgium, Czech Republic, Denmark, Estonia, Finland, France, Germany, Ireland, Latvia, Lithuania, Netherlands, Norway, Poland, Portugal, Slovakia, Spain, Sweden,
Switzerland, United Kingdom
Development in addressable1) European Limited-Service Restaurants (LSR) pizza markets
▪ Addressable1) European pizza markets have historically grown strongly, with CAGR of 6.4% 2015-2019
▪ Representing 19% of the total European pizza market, including both Full-service and Limited-Service restaurants across all countries
▪ Strong historical growth expected to continue in coming years
▪ LSR pizza market has proved fairly resilient through economic crisis, compared to other restaurant markets and segments
’09 ’15 ’24’14’10 ’16’13’11 ’17’12 ’18 ’19 ’20 ’21 ’22 ’23
9.7
’07
4.7
’06 ’08
+3.9%
+6.4%
+5.7%
Estimates
BEUR
40
8.3

Belgium
GermanyNetherlands
Finland
Current presenceCurrent platform
A sizeable OOH1) platform with 635 franchised restaurants1
Tangible organic growth opportunities in Finland, the Netherlands
and Belgium, and buy & build agenda in Germany well underway2
Scalable inhouse dough production, significant procurement
volumes and access to leading technology platform for restaurant
and delivery operations
3
Strong management team incentivized to grow the business further
and extract synergies4
293
107
234
1
# of units
MEUR
276Consumer sales
LTM Q3’212)
Out of Home pizza platform with tangible growth potential, both organically
and structurally
41 1) Out of Home
2) Consumer Sales excluding VAT for Kotipizza and New York Pizza (excluding the 3 acquired chains in Germany)

Kotipizza and New York Pizza have historically grown strongly through
same-store sales and network expansion
Growth in number of unitsConsumer sales growth1)
124
146
173
197213
243
276
20162015 20202017 2018 LTM
Q3 2021
2019
+14%
388 399435
472495
515
2015 20172016 2018 2019 2020
105
Q3
2021
635
+247MEUR
1) Consumer Sales excluding VAT for Kotipizza and New York Pizza (excluding the 3 acquired chains in Germany)42
# of units
3x German acquisitions

Orkla with strong in-house competence across several key dimensions supporting accelerated growth in the Out of Home market
Strong pizza competence Best practice sharing and
synergy potential Well known franchise set-up
✓ Strong pizza capabilities within
Orkla
✓ Unique local consumer insights
✓ Brand-building capabilities – be
the trusted choice
✓ Sourcing
✓ Operations & product
development
✓ Marketing & sales
✓ Technology
✓ Strong franchise competence in
current OOH platform
✓ Capital light growth model
✓ Rapid scalability
✓ Local entrepreneurs motivated
to develop their own business
within the system
43
Out of Home
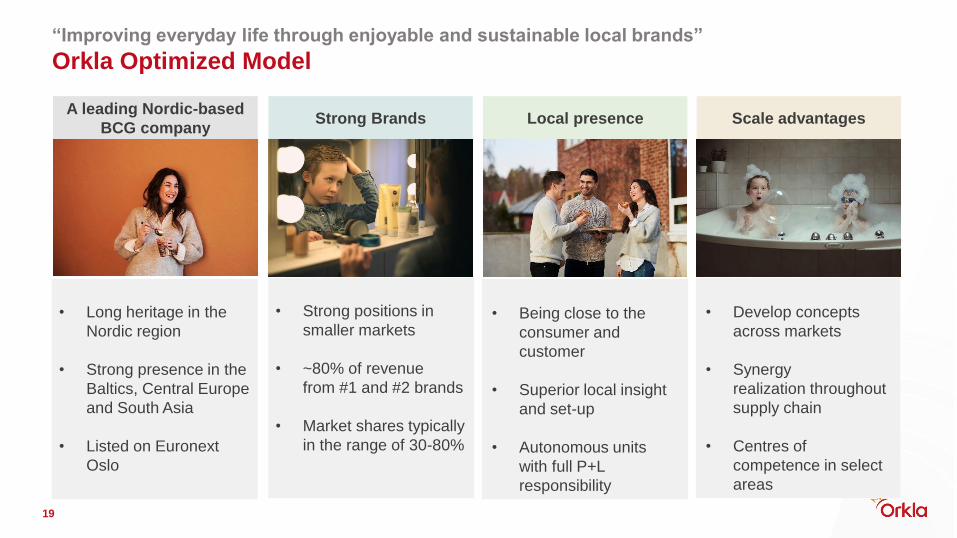
Three key growth pillars to develop a sizable European Out of Home
platform
1 Same store growth Network expansion2 Structural initiatives3
▪ High quality products & services
▪ Loyalty programs
▪ Continued product development
▪ Digital Marketing
▪ Available white spots in all current markets
▪ Increase penetration in larger areas – increasing delivery efficiency
▪ Strengthen and expand our geographical footprint in and around our core markets
▪ Leverage M&A possibilities when and where appropriate
44

Growth initiatives (iii)Consumer Health
Increase sales +50% by end of 2025
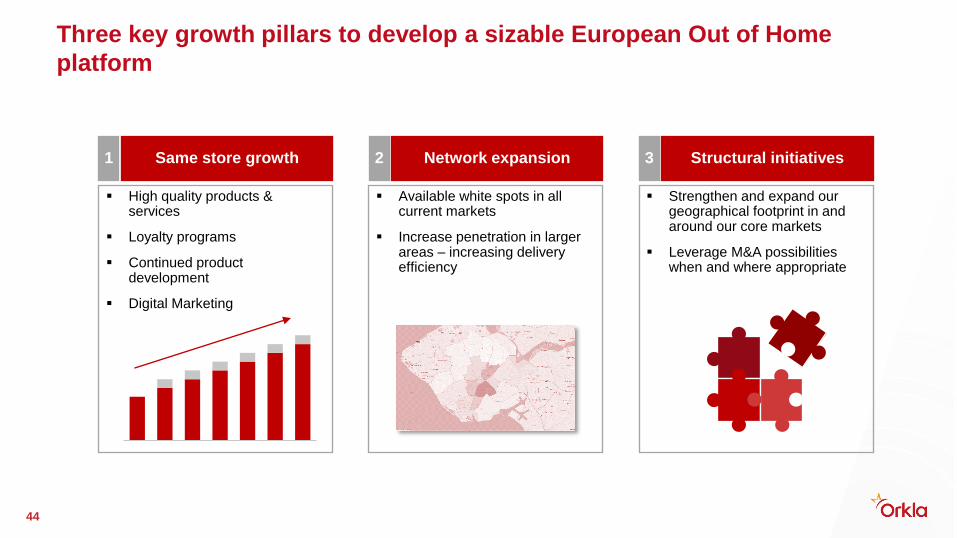
Consumer
Health
WE BELIEVE resilience is
a key to better health and a
better life
WE BELIEVE beauty starts
with an inside jobWE BELIEVE social well-being
is a key to healthy living
WE BELIEVE in healthy
minds in healthy bodies

The current business is a strong foundation for future growth within
consumer health
47
The Orkla companies offering solutions for consumer health. Total revenue base of ~4.6 BNOK*
• The Nordic region’s biggest
supplier and marketer of
health products ranging
from omega-3, vitamin and
mineral supplements,
weight reduction & sports
nutrition products
• Operates in the Nordics,
Baltics and Poland, and is
represented in several other
countries
Orkla Health
• Health and Sports Nutrition
Group AB (HSNG) sells a
broad range of sports
nutrition, health food, fitness
equipment and food brands
and products through its
online stores Gymgrossisten,
Bodystore and
Fitnessmarket
• Operates online retailers in
the Nordics
HSNG
• First launched in 1947
• B2B brands Cederroth First
Aid and Snøgg offer high
quality holistic first aid
solutions for small and large
businesses
• B2C brands Salvequick/
Salvelox, Norgesplaster and
Dr. San, have a market
leading position in multiple
European countries
Orkla Wound Care NutraQ
• Strong fit with Orkla on
category and geography,
and complementary on
channel (D2C) and
capabilities – yielding
interesting growth
opportunities
• D2C set-up to handle both
the launch of new concepts
and geographic expansion
* Proforma full year 2021 (incl. NutraQ)

Consumer Health – a lot of possibilities
48
We are overweightWe are physically active We get older and want to
have an active lifestyleWe are using technology
Science is new
knowledge
We want to live and eat
healthyWe care about the
environmentWe have less time

Orkla intends to take an even more holistic approach to consumer health
across our categories
49
The consumer health landscape is shifting
Food
Healthy snacking Healthy convenience
Plant-based Functional
Less-off… Clean label
Supplements
Personalized Based on needs
Prevent and protect Stay healthy
Subscriptions
Consumer health services
Personalization and individual guidance
Diagnosis Online coaching
Online medical advice
Healthy living
Fitness & exercise Mindfulness
Sleep and stress Performance
Technology
Wearables Monitoring
Data Feedback and learning
Connected and integrated
…
…
…
…
…

The combination of our capabilities will be our competitive edge in taking
a bigger stake in the growing consumer health market
Strong local
brands – with
proven export
success
Local consumer
insight
Trusted partner
in the markets
we are in
Strong
capabilities in
consumer health

Consumer health in Orkla – 6 strategic growth pillars
51
Revitalize and grow
the core retail
New channels:
accelerate D2C &
online
Services: develop personalization and product-related services
Geographic
expansion
• Develop and rejuvenate
grocery retail positions
• Develop and grow
pharmacy positions
• Support digital journey
of traditional b&m retail
• Develop and acquire
relevant concepts,
shifting our portfolio
towards D2C
• Supply chain adapted
for digital sales
• Pursue geographic
expansion opportunities
– International niche
positions through
distributors and
marketplaces
Develop / acquire
new health concepts
& capabilities
• Revitalize our current
portfolio to meet the
demand of the modern
consumers
• Focus on continuous
work and launches
across markets
Strategic growth pillars
21 3
4
5
New growth areas
• Expand into new
categories
• Explore opportunities to
play a larger role with
regard to health, for
instance innovating new
concepts for easier
selfcare
6

Portfolio management
and M&A

Being consumer centric
in a digital world
Being a local
champion
for sustainability
Being the best
partner
in all we do
Our people
make the difference
Local consumer insight
at the heart of everything
Operational & commercial
competitiveness
Plant-based
Health
Out of Home
Geographic expansion
Top three priority approaches to reaching our targets

We value trust-based and long-term partnerships
54 Note: Orkla’s ownership in Dragsbæk is 67%, Lofoten Marine Oils 50%, Eastern 68% (pre-merger) and New York Pizza ~75%
Examples
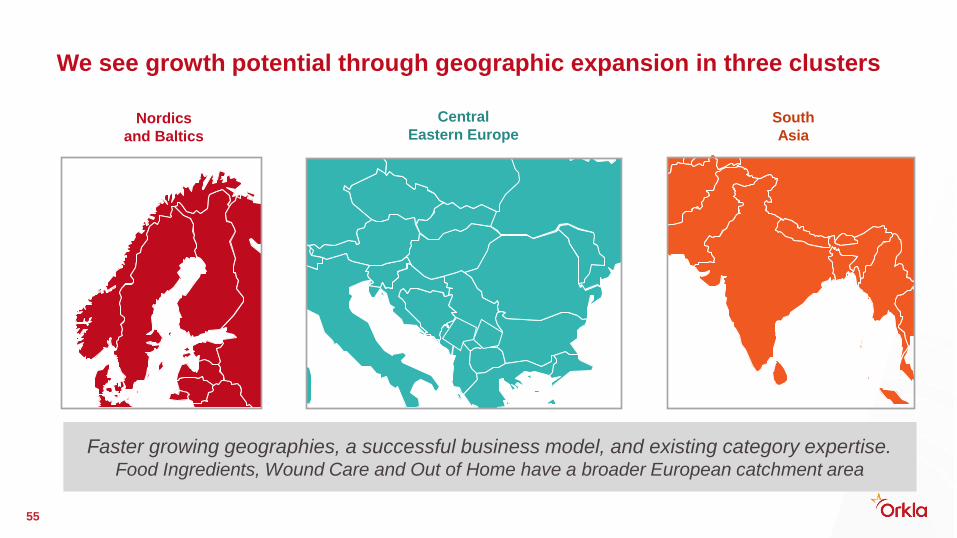
Nordics
and Baltics
Central
Eastern EuropeSouth
Asia
We see growth potential through geographic expansion in three clusters
Faster growing geographies, a successful business model, and existing category expertise.Food Ingredients, Wound Care and Out of Home have a broader European catchment area
55
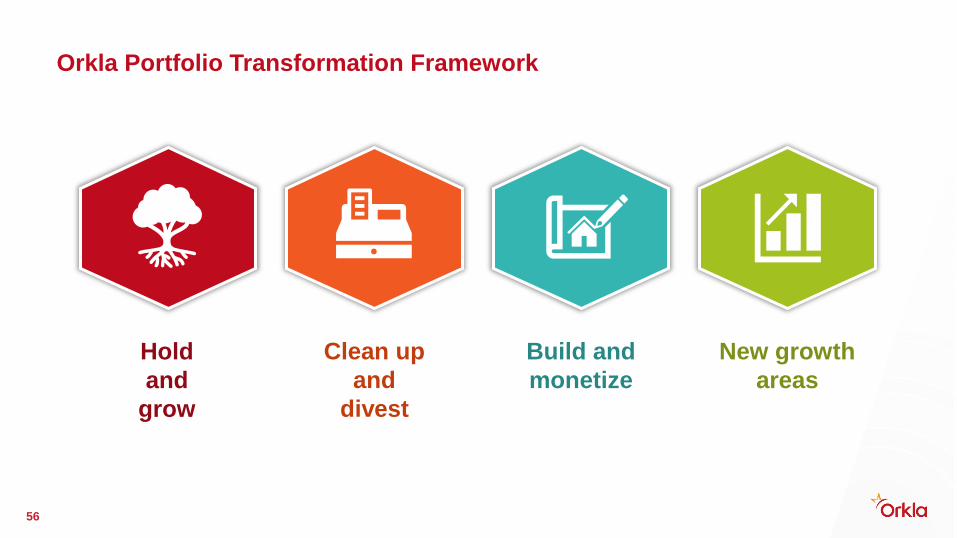
Hold
and
grow
Build and
monetize
Clean up
and
divest
New growth
areas
Orkla Portfolio Transformation Framework
56
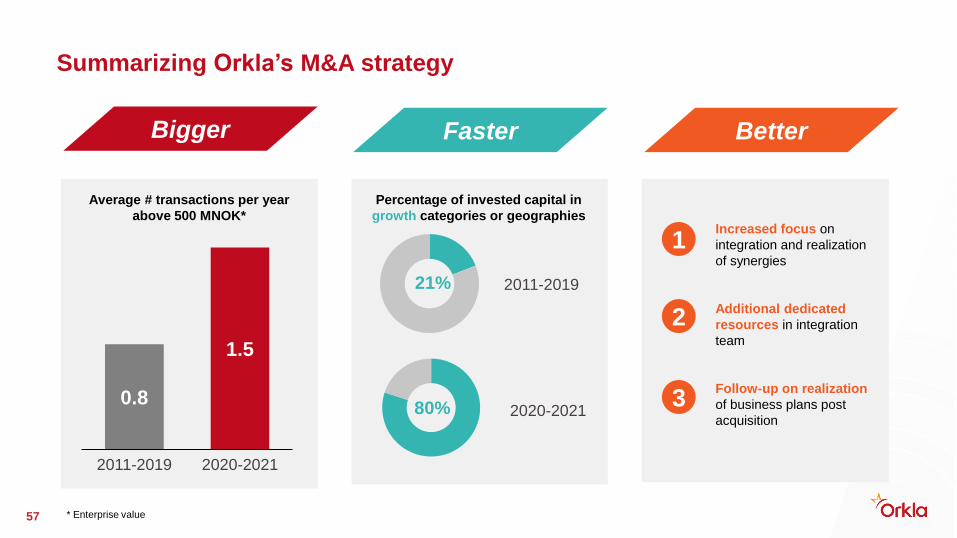
Percentage of invested capital in
growth categories or geographies
Summarizing Orkla’s M&A strategy
2020-202180%
• Increased focus on
integration and realization
of synergies
• Additional dedicated
resources in integration
team
• Follow-up on realization
of business plans post
acquisition
1
2
3
2020-2021
0.8
2011-2019
1.5
Average # transactions per year
above 500 MNOK*
Bigger Faster Better
* Enterprise value57
2011-201921%

Long term value creation
58

Appendices
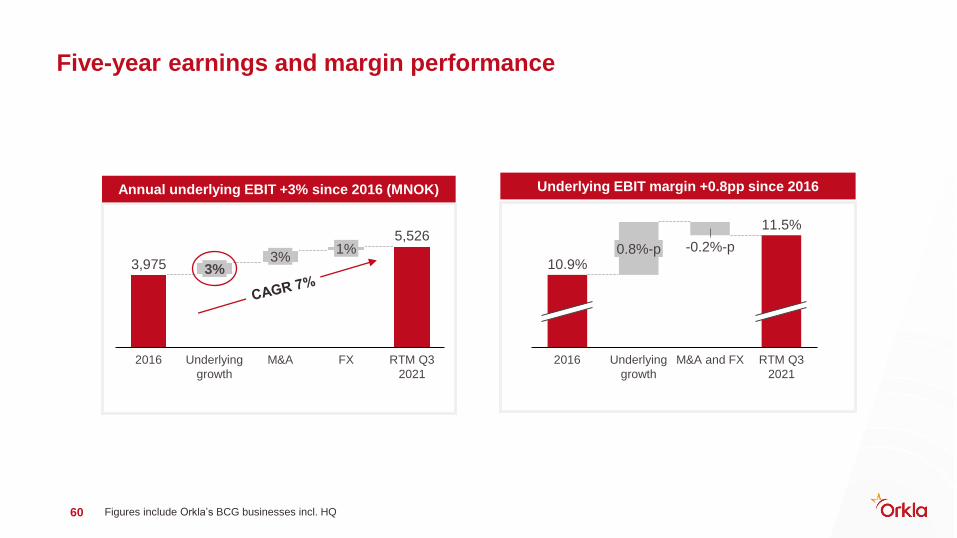
Five-year earnings and margin performance
Figures include Orkla’s BCG businesses incl. HQ60
M&A and FX2016
0.8%-p
Underlying
growth
-0.2%-p
RTM Q3
2021
10.9%
11.5%
Underlying EBIT margin +0.8pp since 2016Annual underlying EBIT +3% since 2016 (MNOK)
3%
2016 Underlying
growth
3%
M&A
1%
FX RTM Q3
2021
3,975
5,526

BCG incl. HQ, cost breakdown 2020 (BNOK), % of revenues
Figures include Orkla’s BCG businesses including HQ61
46,6
5,4
Logistics cost
50%
Revenues Cost of
materials
15%
SG&AConversion
cost
5%4%
Advertising
cost
15%
EBIT (adj.)
Cost breakdown FY 2020

62
Third party spend (BNOK)
13
30
4
32
8
Raw Materials Pack-
aging
Traded Goods Logistics Indirect Third party
spend
30 BNOK in external spend in 2020
Figures include Orkla’s BCG businesses including HQ

Orkla Investments
* Source: Nord Pool Spot, Monthly System Price
** Saudefaldene leases approximately 1 TWh per year from Statkraft and has corresponding energy commitments, resulting in a net effect of zero.63
Jotun (42.6%)Accounted for using equity method
Financial InvestmentsFully consolidated into Orkla’s financial statements
Hydro PowerFully consolidated into Orkla’s financial statements
Ownership:
Type:
Average annual
production (2011-
2020):
Orkla 85%
Reservoir plant
1.9 TWh**
Orkla 100%
Run of the river plant
0.6 TWh
Volume (GWh):
YTD Q3-21: 1,432 (2,182)
Power prices*
(NOK/kWh):
YTD Q3-21: 0.59 (0.09)
EBIT adj. (NOK million):
YTD Q3-21: 287 (17)
Book value real estate:
NOK 1.8 billion

Strong balance sheet and financial flexibility
Amounts in NOK million
* Including acquired businesses in EBITDA
NIBD / R12M EBITDA*Net interest-bearing liabilities (NOK million)
0,5x
1,0x0,9x
1,7x
20202017 2018 2019 Q3 2021
0,0x
2020
4,895
2017
12,273
2018 2019
6,380
Q3 2021
4,893
14
3,037
6,551
14,028
Leasing debt Ex leasing debt
64

Funding sources and maturity profile*
Debt maturity→ average maturity 3.4 years Funding sources (in BNOK)
* Per Q3 202165
3,000
7,000
5,000
0
1,000
2,000
6,000
4,000
8,000
9,000
10,000
2023
MNOK
2021 2022 2024 2025 2026-
7.9
4.2
9.8
1.8
Unutilised credit facilities
Bonds and CP
Banks
Cash, cash equivalents and interest bearing assets
Unutilised credit facilities Drawn amounts (ex leasing)
Alternative Performance Measures (APM)
66
Organic growth
Organic growth shows like-for-like turnover growth for the Group’s business portfolio and is defined as the Group’s reported change in operating revenues adjusted for effects of
the purchase and sale of companies and currency effects. In calculating organic growth, acquired companies will be excluded 12 months after the transaction date. Sold
companies will be excluded pro forma 12 months prior to the transaction date. Currency effects are neutralised by translating this year’s turnover at last year’s exchange rates.
Organic growth is included in segment information and used to identify and analyse the turnover growth in the existing business portfolio. Organic growth provides an important
picture of the Group’s ability to carry out innovation, product development, correct pricing and brand-building.
EBIT (adj.)
EBIT (adj.) shows the Group’s current operating profit before items that require special explanation and is defined as reported operating profit or loss before “Other income and
expenses” (OIE). These include M&A costs, restructuring or integration expenses, any major gains and write-downs on both tangible and intangible assets, and other items that
only to a limited degree are reliable measures of the Group’s current profitability. EBIT (adj.) margin and growth are derived figures calculated in relation to operating revenues.
EBIT (adj.) is one of the Group’s key financial figures, internally and externally. The figure is used to identify and analyse the Group’s profitability from normal operations and
operating activities. Adjustment for items in OIE which to a limited degree are reliable measures of the Group’s current operating profit or loss increases the comparability of
profitability over time.
Change in underlying EBIT (adj.)
Change in underlying EBIT (adj.) shows like-for-like EBIT (adj.) growth for the Group’s business portfolio and is defined as the Group’s reported change in EBIT (adj.) adjusted
for effects of the purchase and sale of companies and currency effects. In calculating the change in underlying EBIT (adj.), acquired companies will be included pro forma 12
months before the transaction date. Sold companies will be excluded pro forma 12 months prior to the transaction date. Currency effects are neutralised by calculating this
year’s EBIT (adj.) at last year’s currency exchange rates. Underlying EBIT (adj.) margin and change therein are derived figures calculated in relation to operating revenues.
Underlying EBIT (adj.) growth is used for internal management purposes, including for identifying and analysing underlying profitability growth in the existing business portfolio,
and provides a picture of the Group’s ability to develop growth and improve profitability in the existing business. The measure is important because it shows the change in
profitability on a comparable structure over time.

Earnings per share (adj.)
Earnings per share (adj.) show earnings per share adjusted for “Other income and expenses” (OIE) after estimated tax. Items included in OIE. The effective tax rate for OIE is lower than the Group’s tax
rate in both 2021 and 2020 chiefly due to non-deductible transaction costs. Write-downs were also taken in 2020 with no tax effect.
If other items of a special nature occur under the company’s operating profit or loss, adjustments will also be made for these items. No such adjustments had been made as at 30 September 2021. As at
30 September 2020, adjustments were made for a gain on the sales of the associates Andersen & Mørck AS and Allkärrsplans Utvecklings AB.
In the second quarter of 2021, Orkla awarded share options to senior executives (see Note 9 in quarterly report). This could have a dilutive effect for other shareholders and diluted figures are therefore
presented for earnings per share and earnings per share (adj.).
Net replacement and expansion investments
When making decisions regarding investments, the Group distinguishes between replacement and expansion investments. Expansion investments are the part of overall reported investments considered
to be investments either in new geographical markets or new categories, or which represent significant increases in capacity.
Net replacement investments include new leases and are reduced by the value of sold fixed assets to sales value.
The purpose of this distinction is to show how large a part of the investments (replacement) mainly concerns maintenance of existing operations and how large a part of the investments (expansion) is
investments which must be expected to generate increased contributions to profit in future, exceeding expectations of normal operations.
Net interest-bearing liabilities
Net interest-bearing liabilities are the sum of the Group’s interest-bearing liabilities and interest-bearing receivables. Interest-bearing liabilities include bonded loans, bank loans, other loans, lease
liabilities and interest-bearing derivatives. Interest-bearing receivables include liquid assets, interest-bearing derivatives and other interest-bearing receivables.
Net interest-bearing liabilities are the Group’s primary management parameter for financing and capital allocation, which is used actively in the Group’s financial risk management strategy. The statement
of cash flows (Orkla format) therefore shows the change in net interest-bearing liabilities at Group level
Structure (acquired and sold companies)
Structural growth includes adjustments for the acquisition of the businesses Eastern, NutraQ, New York Pizza, Sigurd Ecklund, Hans Kaspar, Nói Siríus, Cake Décor Limited, For All Baking Limited,
Ambasador92, Proteinfabrikken, Seagood Fort Deli, Norgesplaster, Win Equipment, Gortrush and Havrefras. Adjustments have been made for the sale of SaritaS, Vestlandslefsa, Italiensk Bakeri, Gorm’s
and the Skin Care business in Poland, as well as for the closure of Pierre Robert Sverige. Adjustments have also been made for the loss of the distribution agreements with Panzani and OTA Solgryn. A
structural adjustment was made at business area level for the internal relocation of Frödinge. In 2020, adjustments were also made for Lecora, Easyfood, Confection by Design, Risberg, Kanakis, Credin
Sverige, Vamo, Kotipizza, Helga, Anza Verimex and the sale of Glyngøre.
Alternative Performance Measures (APM)
67